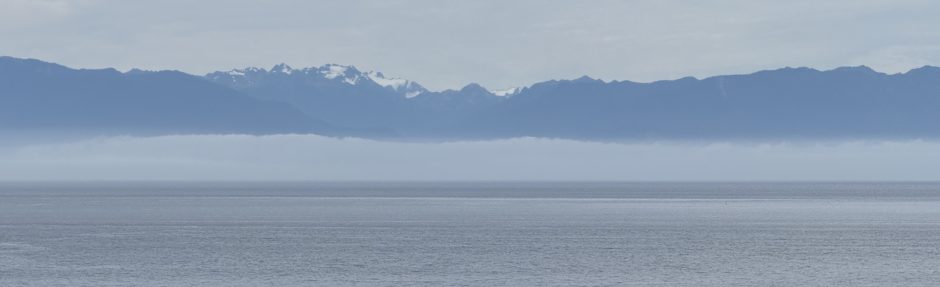
Volcanism at Koko Crater

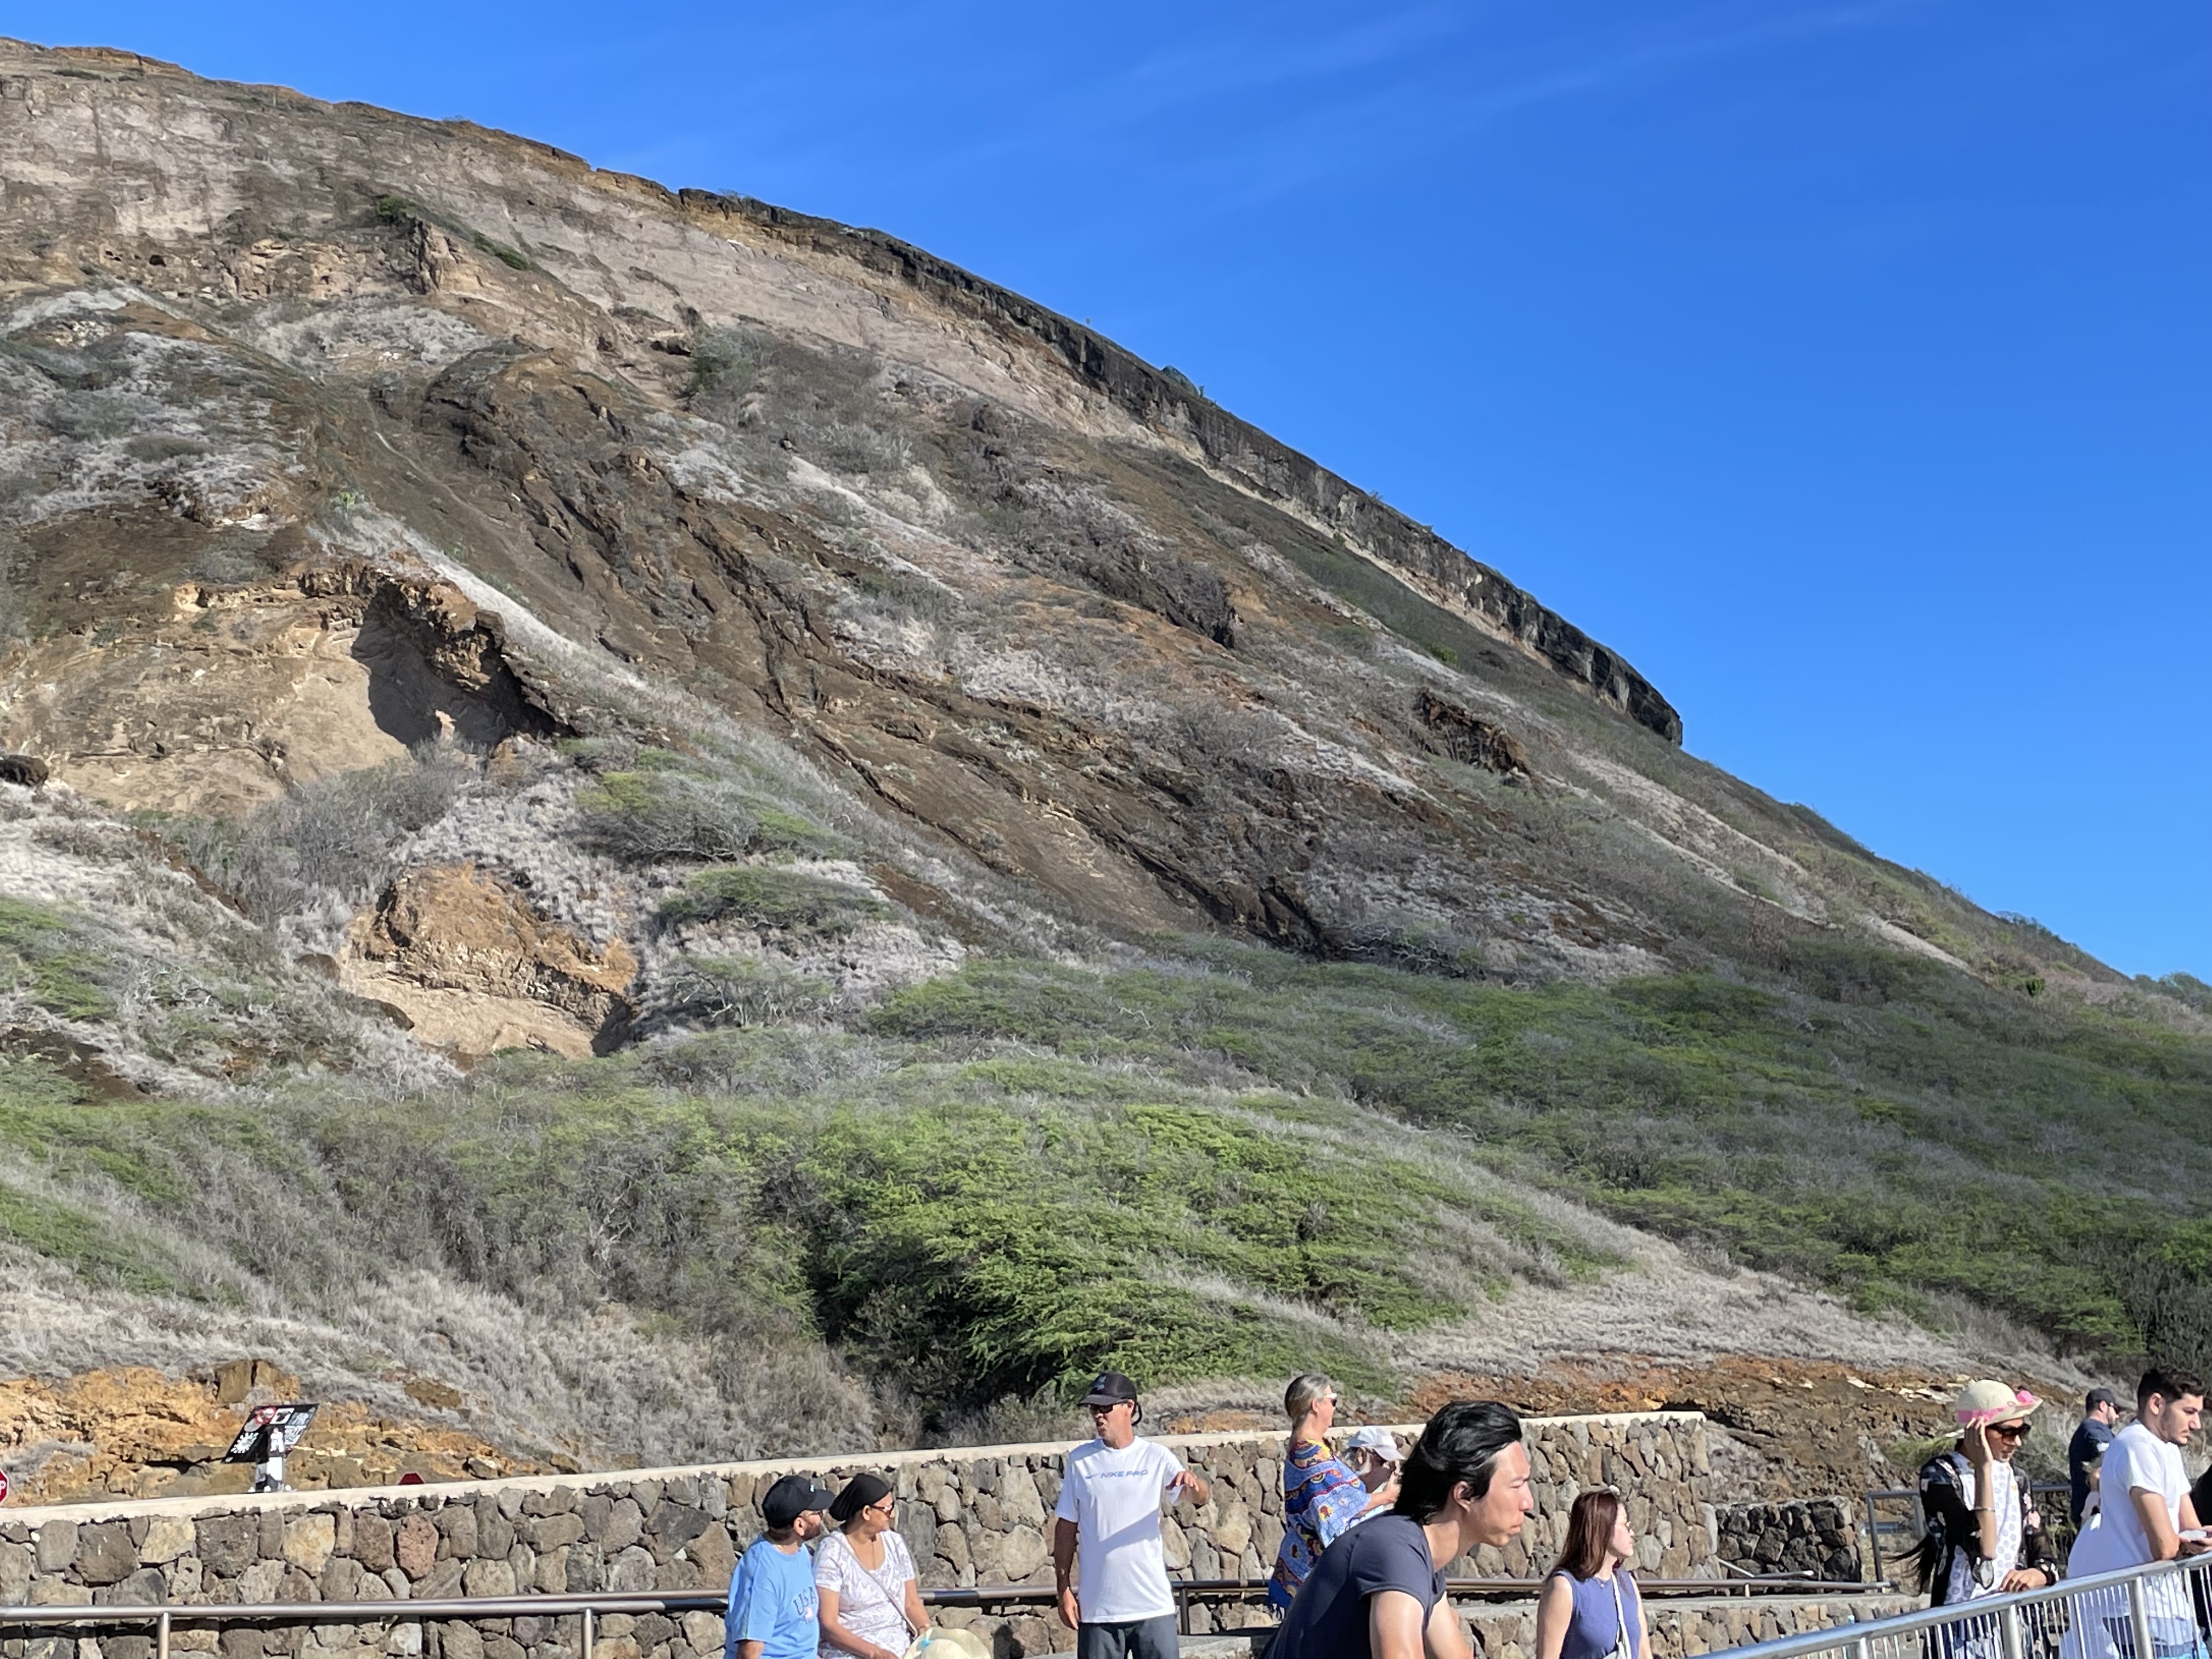
This was a great opportunity to examine geologically recent (less than 1 my old), large-scale volcanism up close. I’ve seen small cinder cones in northern Arizona that are part of the San Francisco volcanic field, but they were small enough to be surmounted in a couple of minutes; other volcanoes I have seen were either huge (entire mountains) or so old that they were unrecognizable. Koko Crater is a perfect fit. It is 1200 feet high and young enough to preserve a range of volcaniclastic textures, yet easily accessible from a safe parking area.



Field Relations
Figures 3 through 5 show us the lay of the land, but we have to get a bigger picture to understand what we’re looking at; and that is difficult in such an immense landscape. I will try.

Structural Trend 1 appears to be close to its original orientation because it conforms to the steep sides of the crater. This alignment is seen on other “ribs” projecting from the crater’s rim. Ash at a temperature of 800 to 1500 F would have stuck wherever it landed and formed horizontally uniform laminae (less than 1/16 inch) and thin beds. This was primary depositional orientation of the ash layers. Of course, ash will fall into steep valleys and fill low spots, just like snow, which is also sticky.
Trend 2 cuts across Structure 1 at more than 30 degrees, but it appears to be local .
Trend 3 dips about 20 degrees towards the crater but its primary orientation is towards the canyon bisected by other ridges seen in Fig. 6. This is a post-eruption feature, as is Trend 2, both of them created as thick layers of ash consolidated, settling more in preexisting valleys than hills. My interpretation is that the valley cutting across (left to right) in Fig. 6 was the edge of the crater when Koko was active. Tephra and basalt collected there to form a plateau (indicated by white ellipse in Fig. 1), which was subsequently eroded, before a few tendrils of basalt flowed out of the crater (e.g. upper parts of Figs. 4 and 6), forming resistant ridges. This post will focus on the stratigraphy of one of these ridges.

Figure 7 reveals at least two unconformities; the fault that dropped the seaward block down a few feet as it rotated, and what appears to be an erosional surface (the cyan line delineating layer “4…5?”). The complex pattern of episodic eruption, erosion, and deformation on the eastern margin of Koko crater is not unusual for a monogenetic volcanic cone, which remains active for a short while, until the magma chamber decompresses (so to speak).
Volcaniclastic Examples
It is time to speak to the rocks, hear their side of the story, and listen to them if we can. All wisdom comes from the earth, and thus it behooves us to hear with our eyes and our imagination (rocks don’t talk), the story that has been written in … stone.


Sedimentary Examples
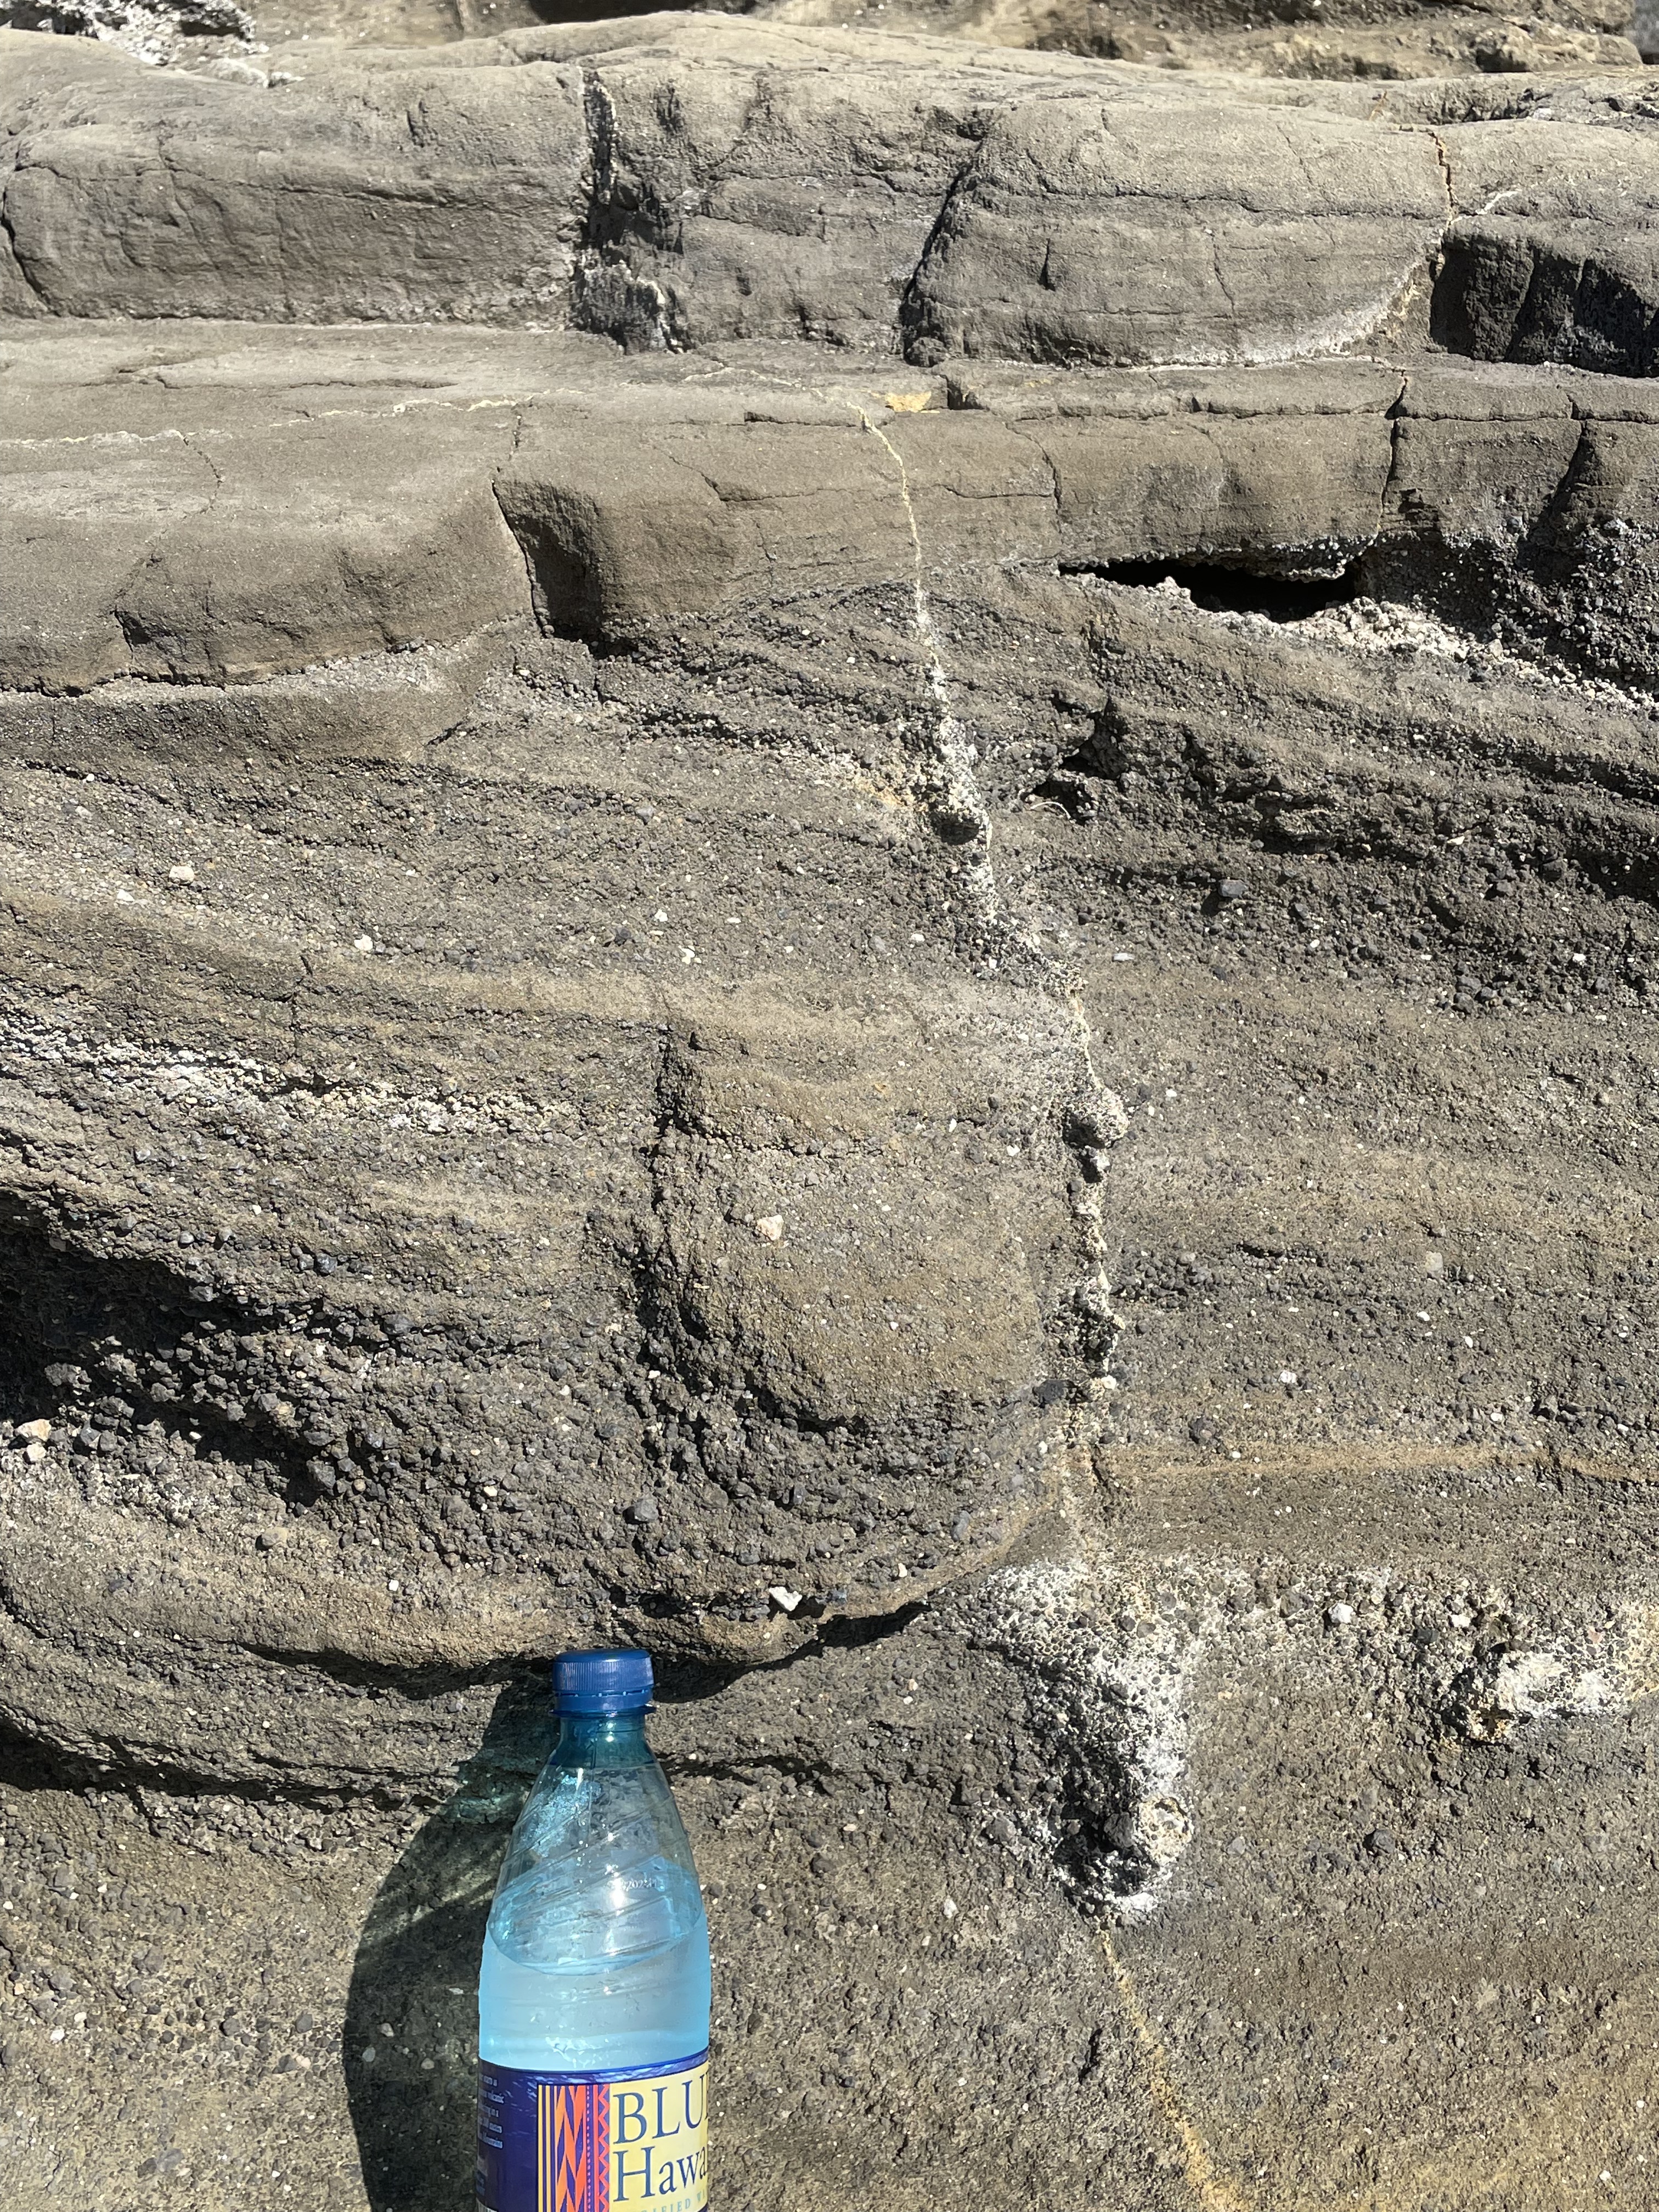
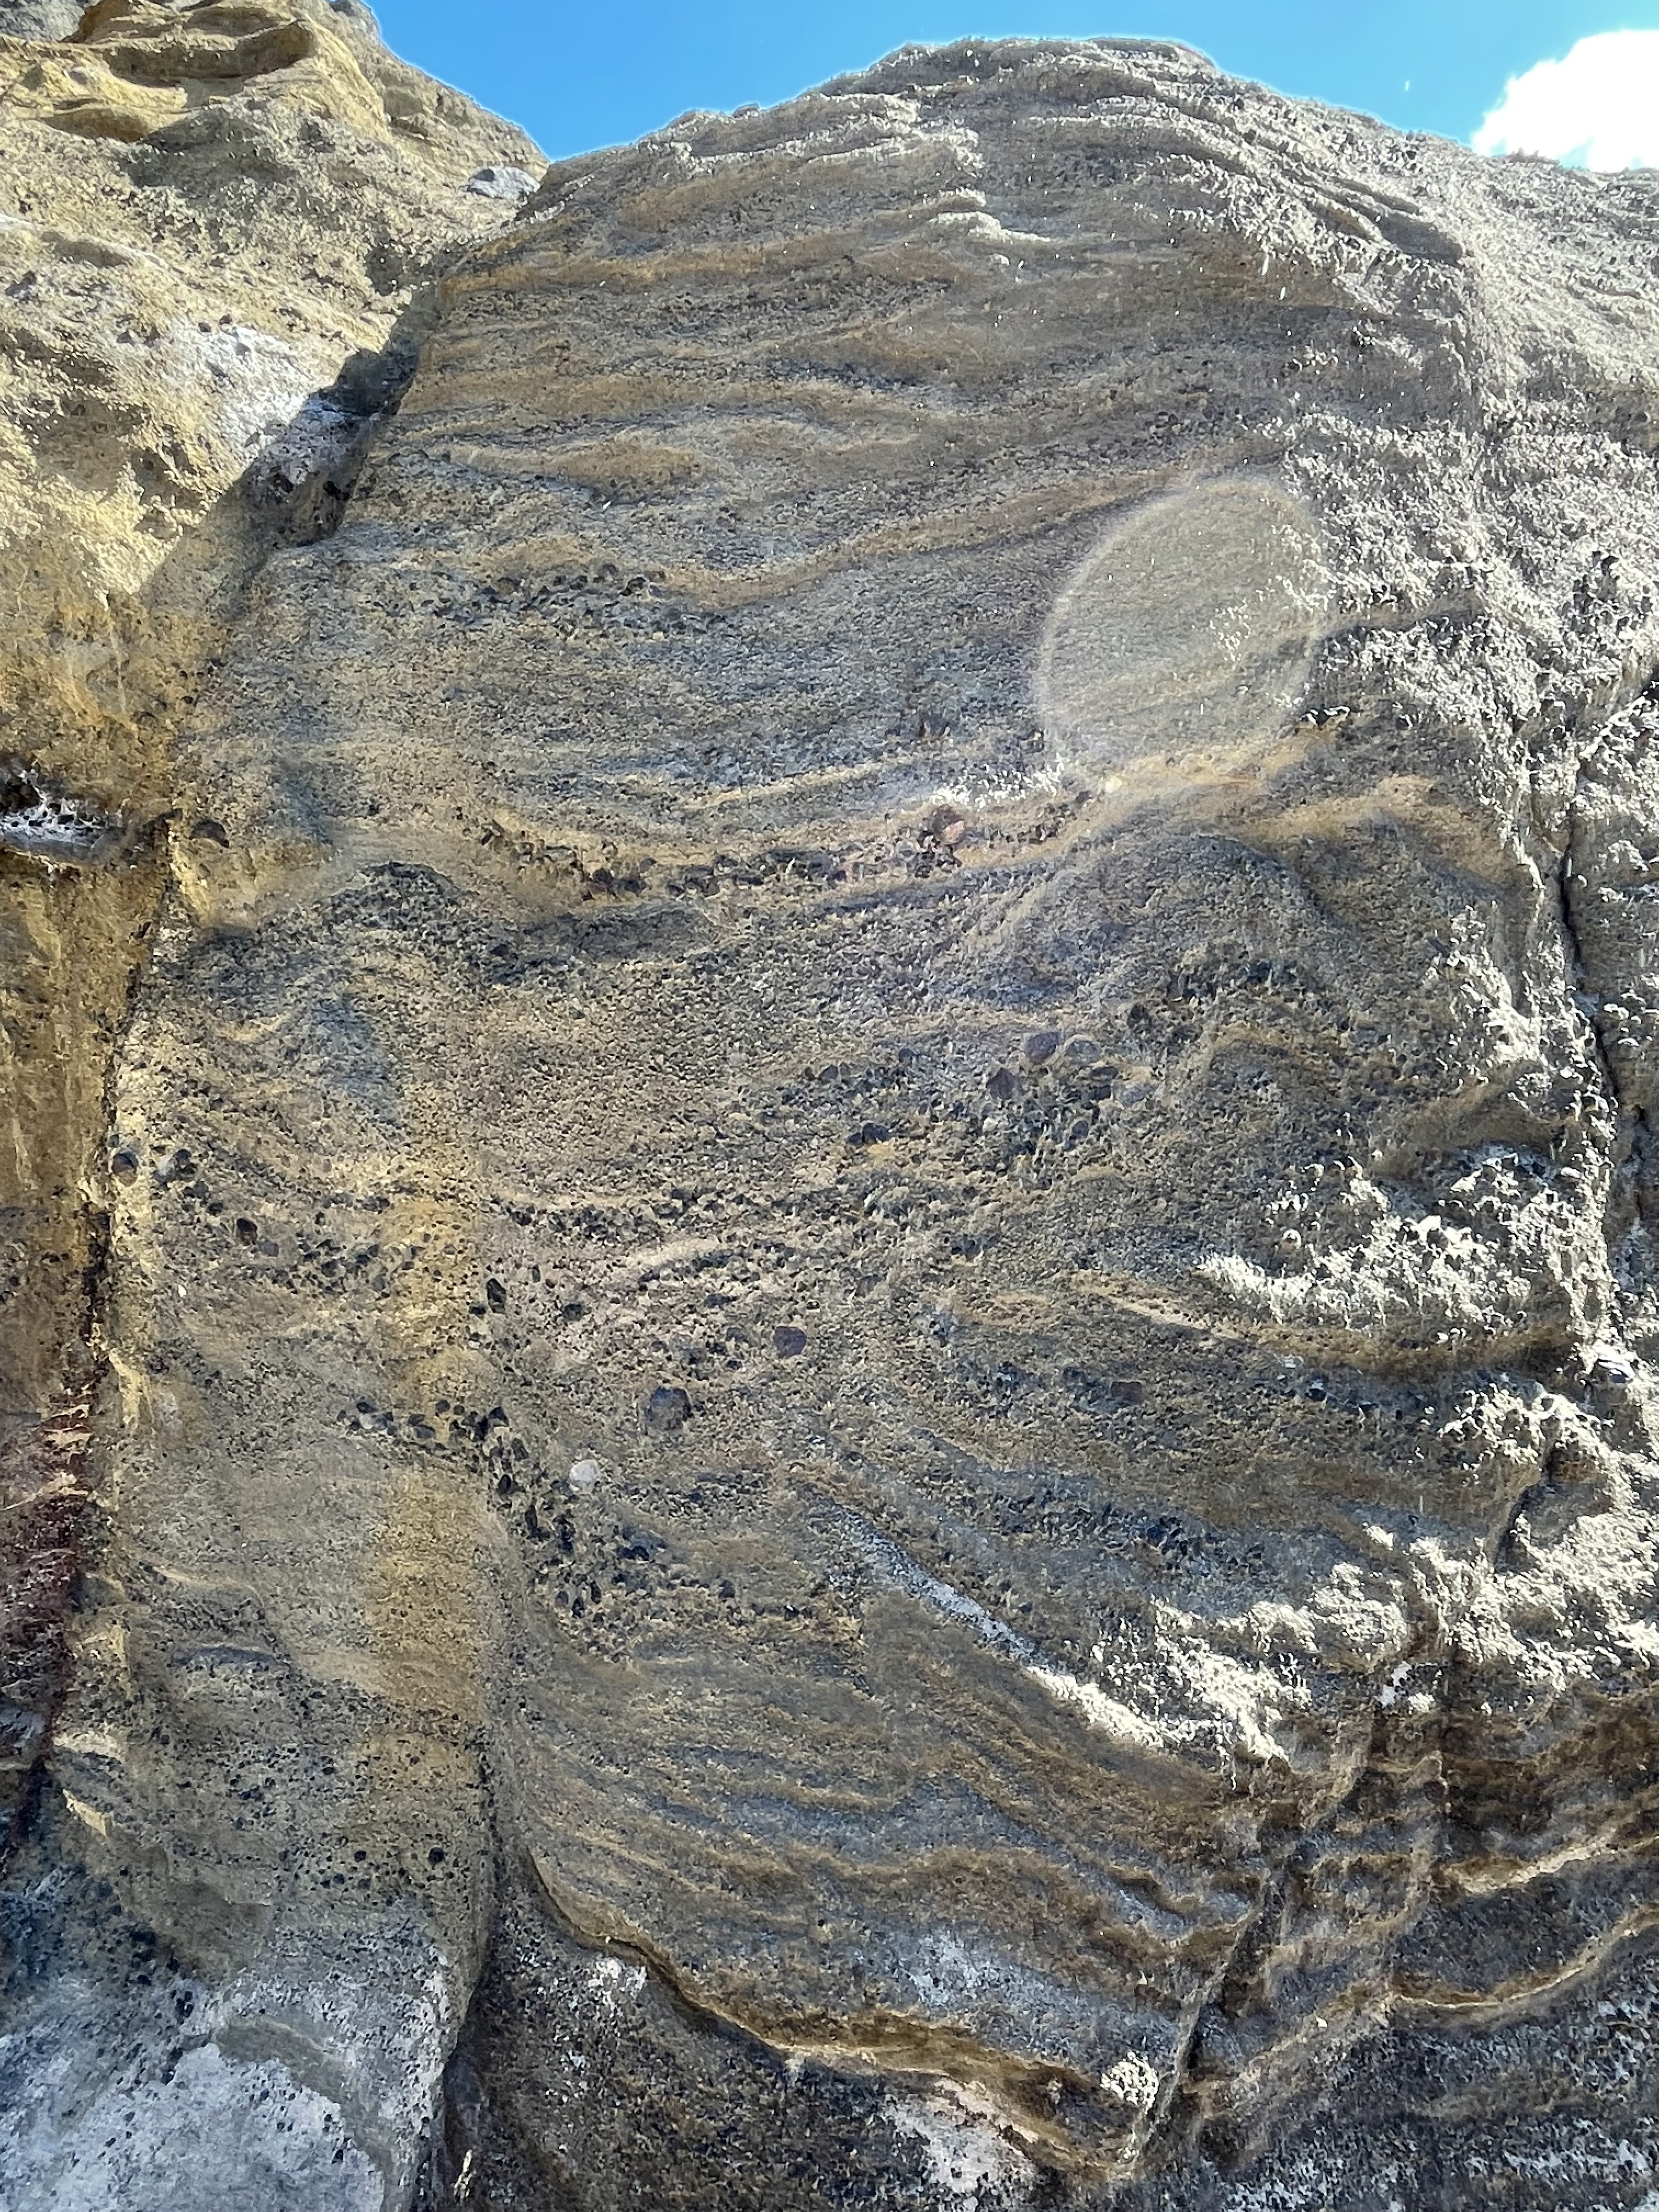
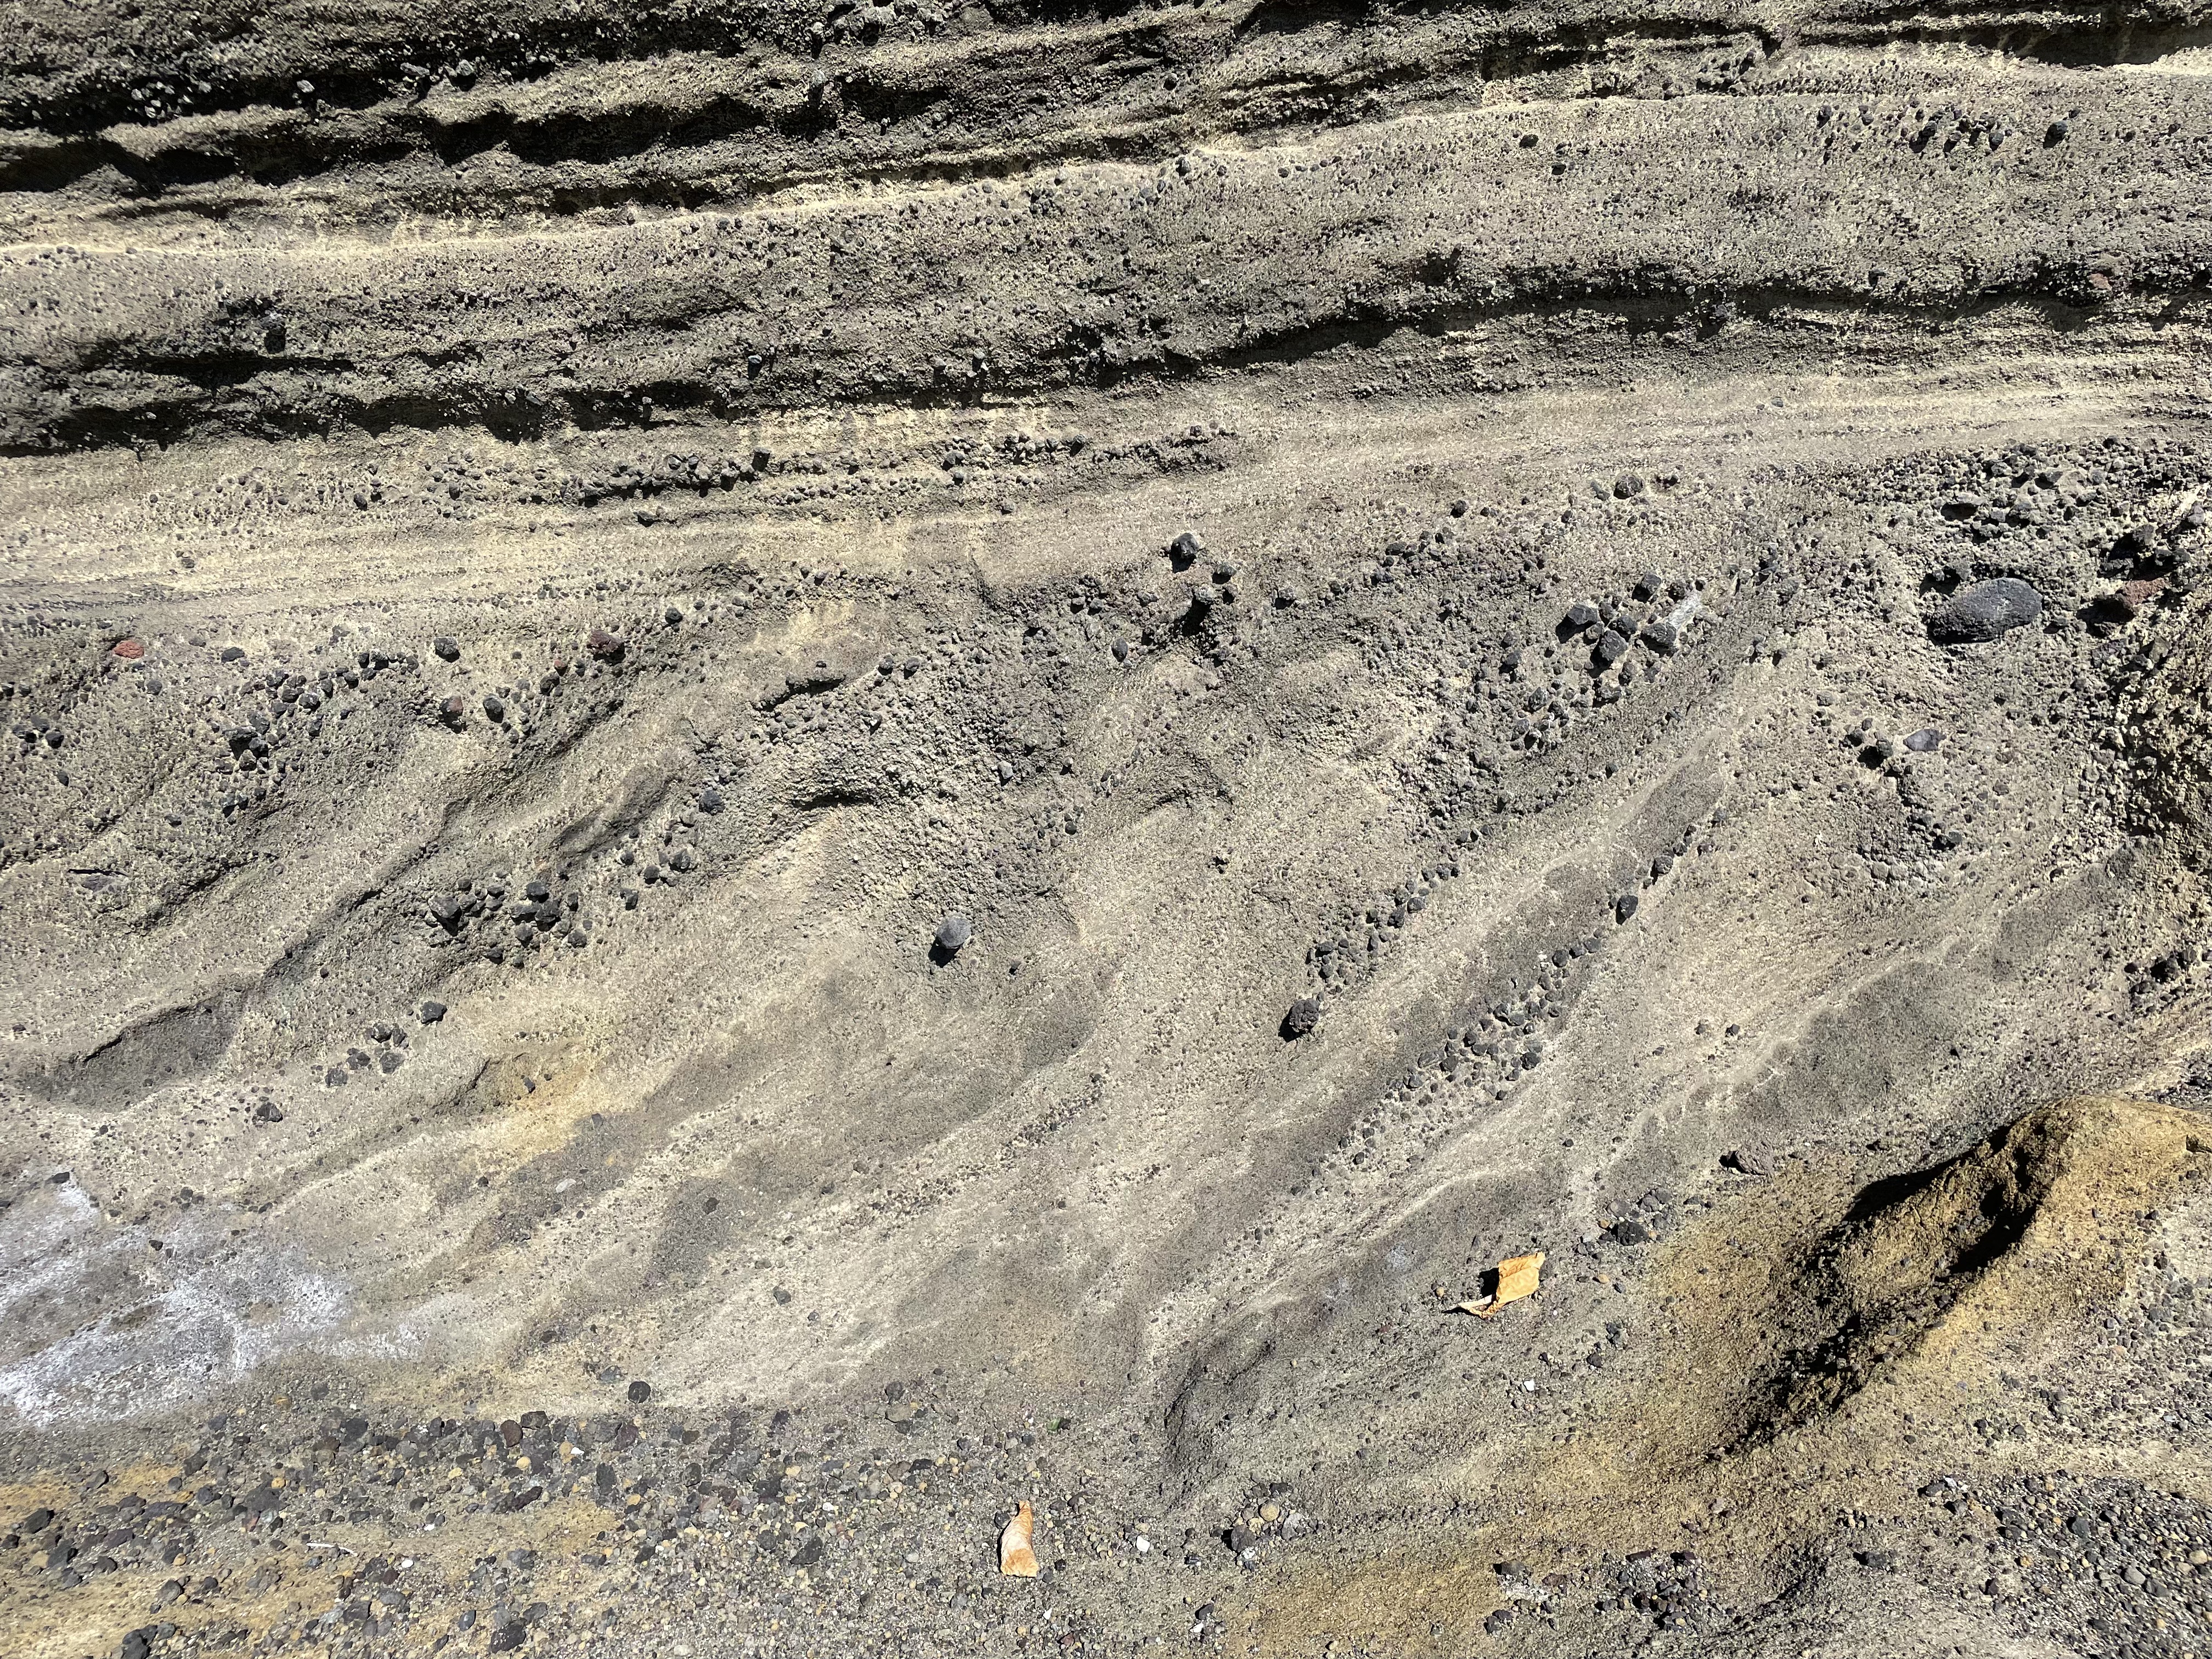
Figures 8 through 12 unambiguously show that volcanic tephra of every size and shape were thrown into the air and landed in hot and sticky ash, where these bombs became clasts, forming volcaniclastic rocks. Now we will look at some examples of rocks that are just as hard, but that reveal sediment transport by wave action.
Summary
I’ve presented a lot of data on volcaniclastic rocks at Koko Crater. Before I summarize I’d like to present one last annotated photo, which shows the stratigraphy as well as I can tell from my limited access to good cross-sections (aka road cuts).

I would like to add a few points to Fig. 16. First, older sediments were seen at the current beach (Figs. 14 and 15) which clearly indicate a surf zone environment. These rocks may be from as much as 100 feet down-section (older), which is consistent with changing relative sea level caused by global sea level fluctuations during the last 100 Ky, and uplift and settling of the Koko crater itself, as magma pushed up and relaxed.
Rocks from~50 feet further up section (younger) demonstrate that the ash was deposited at or slightly above sea level (Figs. 8-12). The total section has a thickness of approximately 100 feet (guesstimate not based on careful measurements, but eyeballed), which must have been deposited within a few thousand years because of the young age of Koko Crater (~50 Ky).
Finally, Koko crater is a tuff cone, which means that it mostly created hot ash as a magma chamber locally depressurized. This kind of eruption doesn’t reoccur once pressure has dropped below the strength of the overlying rocks. Tuff cones are part of larger volcanoes, in this case the Ko’olau volcano, one of three that created Oahu and dominated volcanism for the last four-million years (Fig. 2).
One last word–I have never seen photographs like those I took for this post, not in a text book, Wikipedia, or anywhere else. I don’t know why that is, maybe academic geologists are too busy teaching geology to stop and smell the roses…
A Quick Visit to the Ko’olau Volcanic System
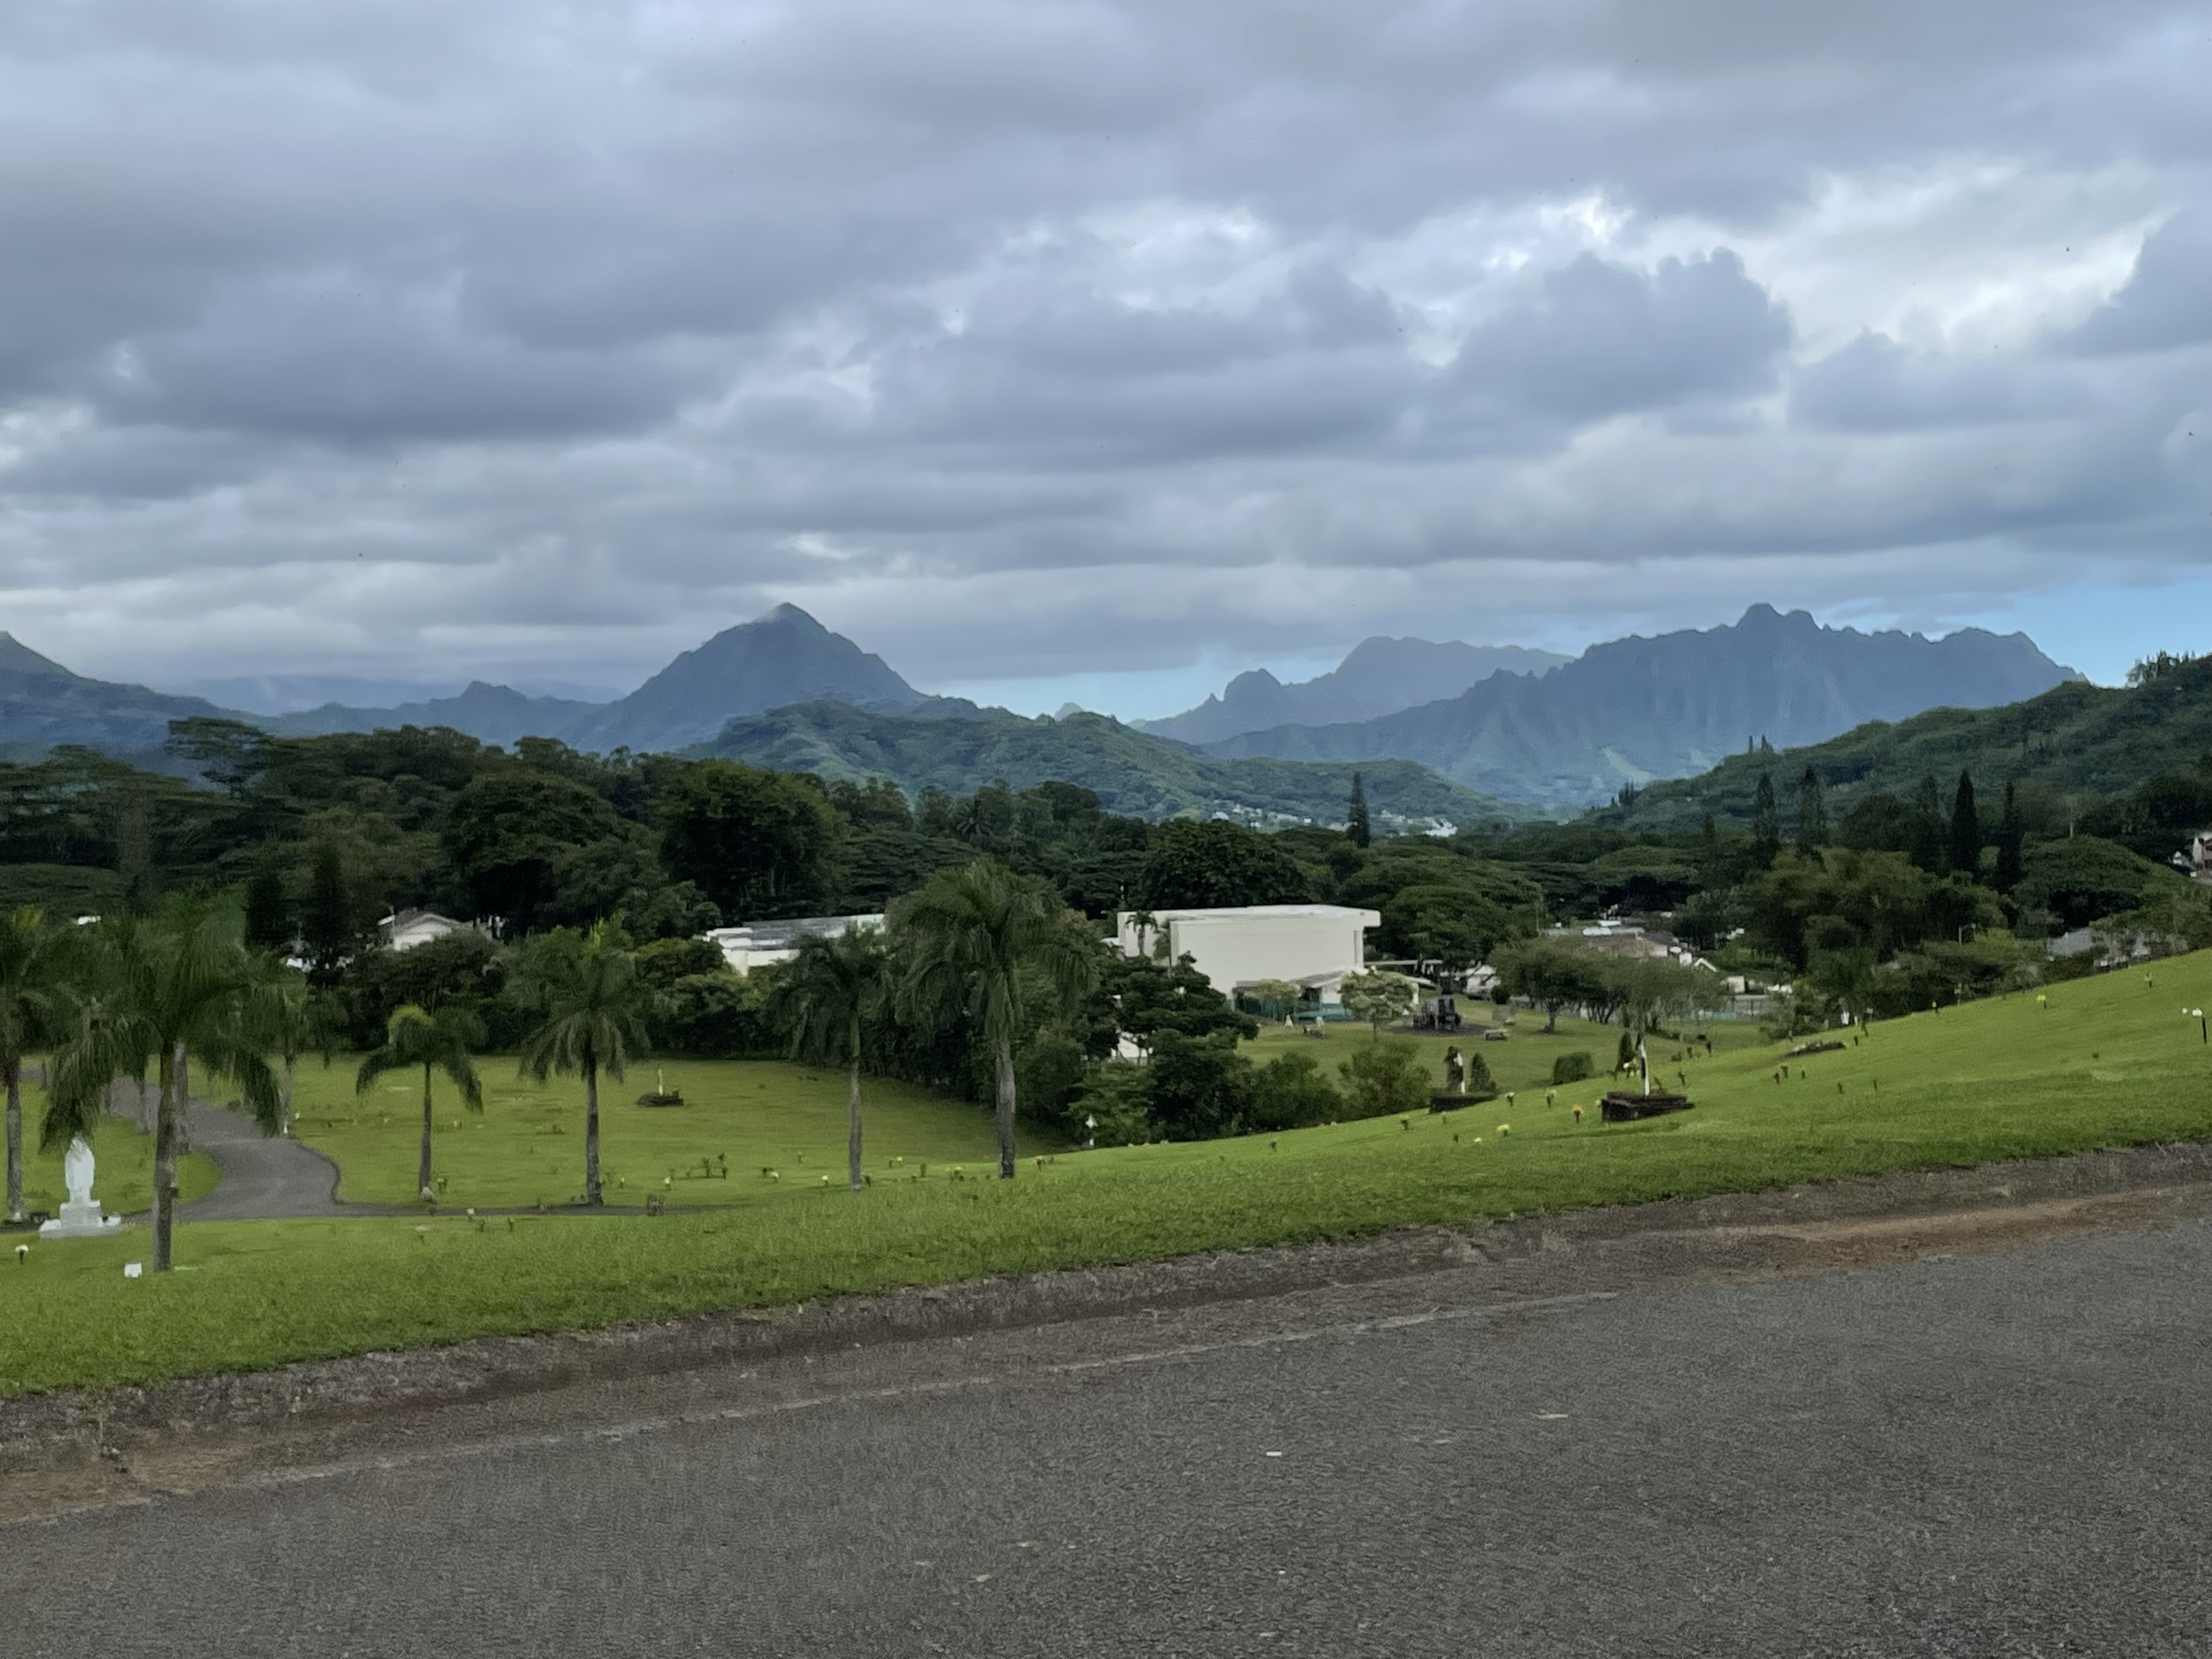

Let’s look at some of the rocks from the Ko’olau caldera, originally erupted in shallow water between 2.8 and 1.7 million-years ago, from a fissure that was below, or not far above, sea level.
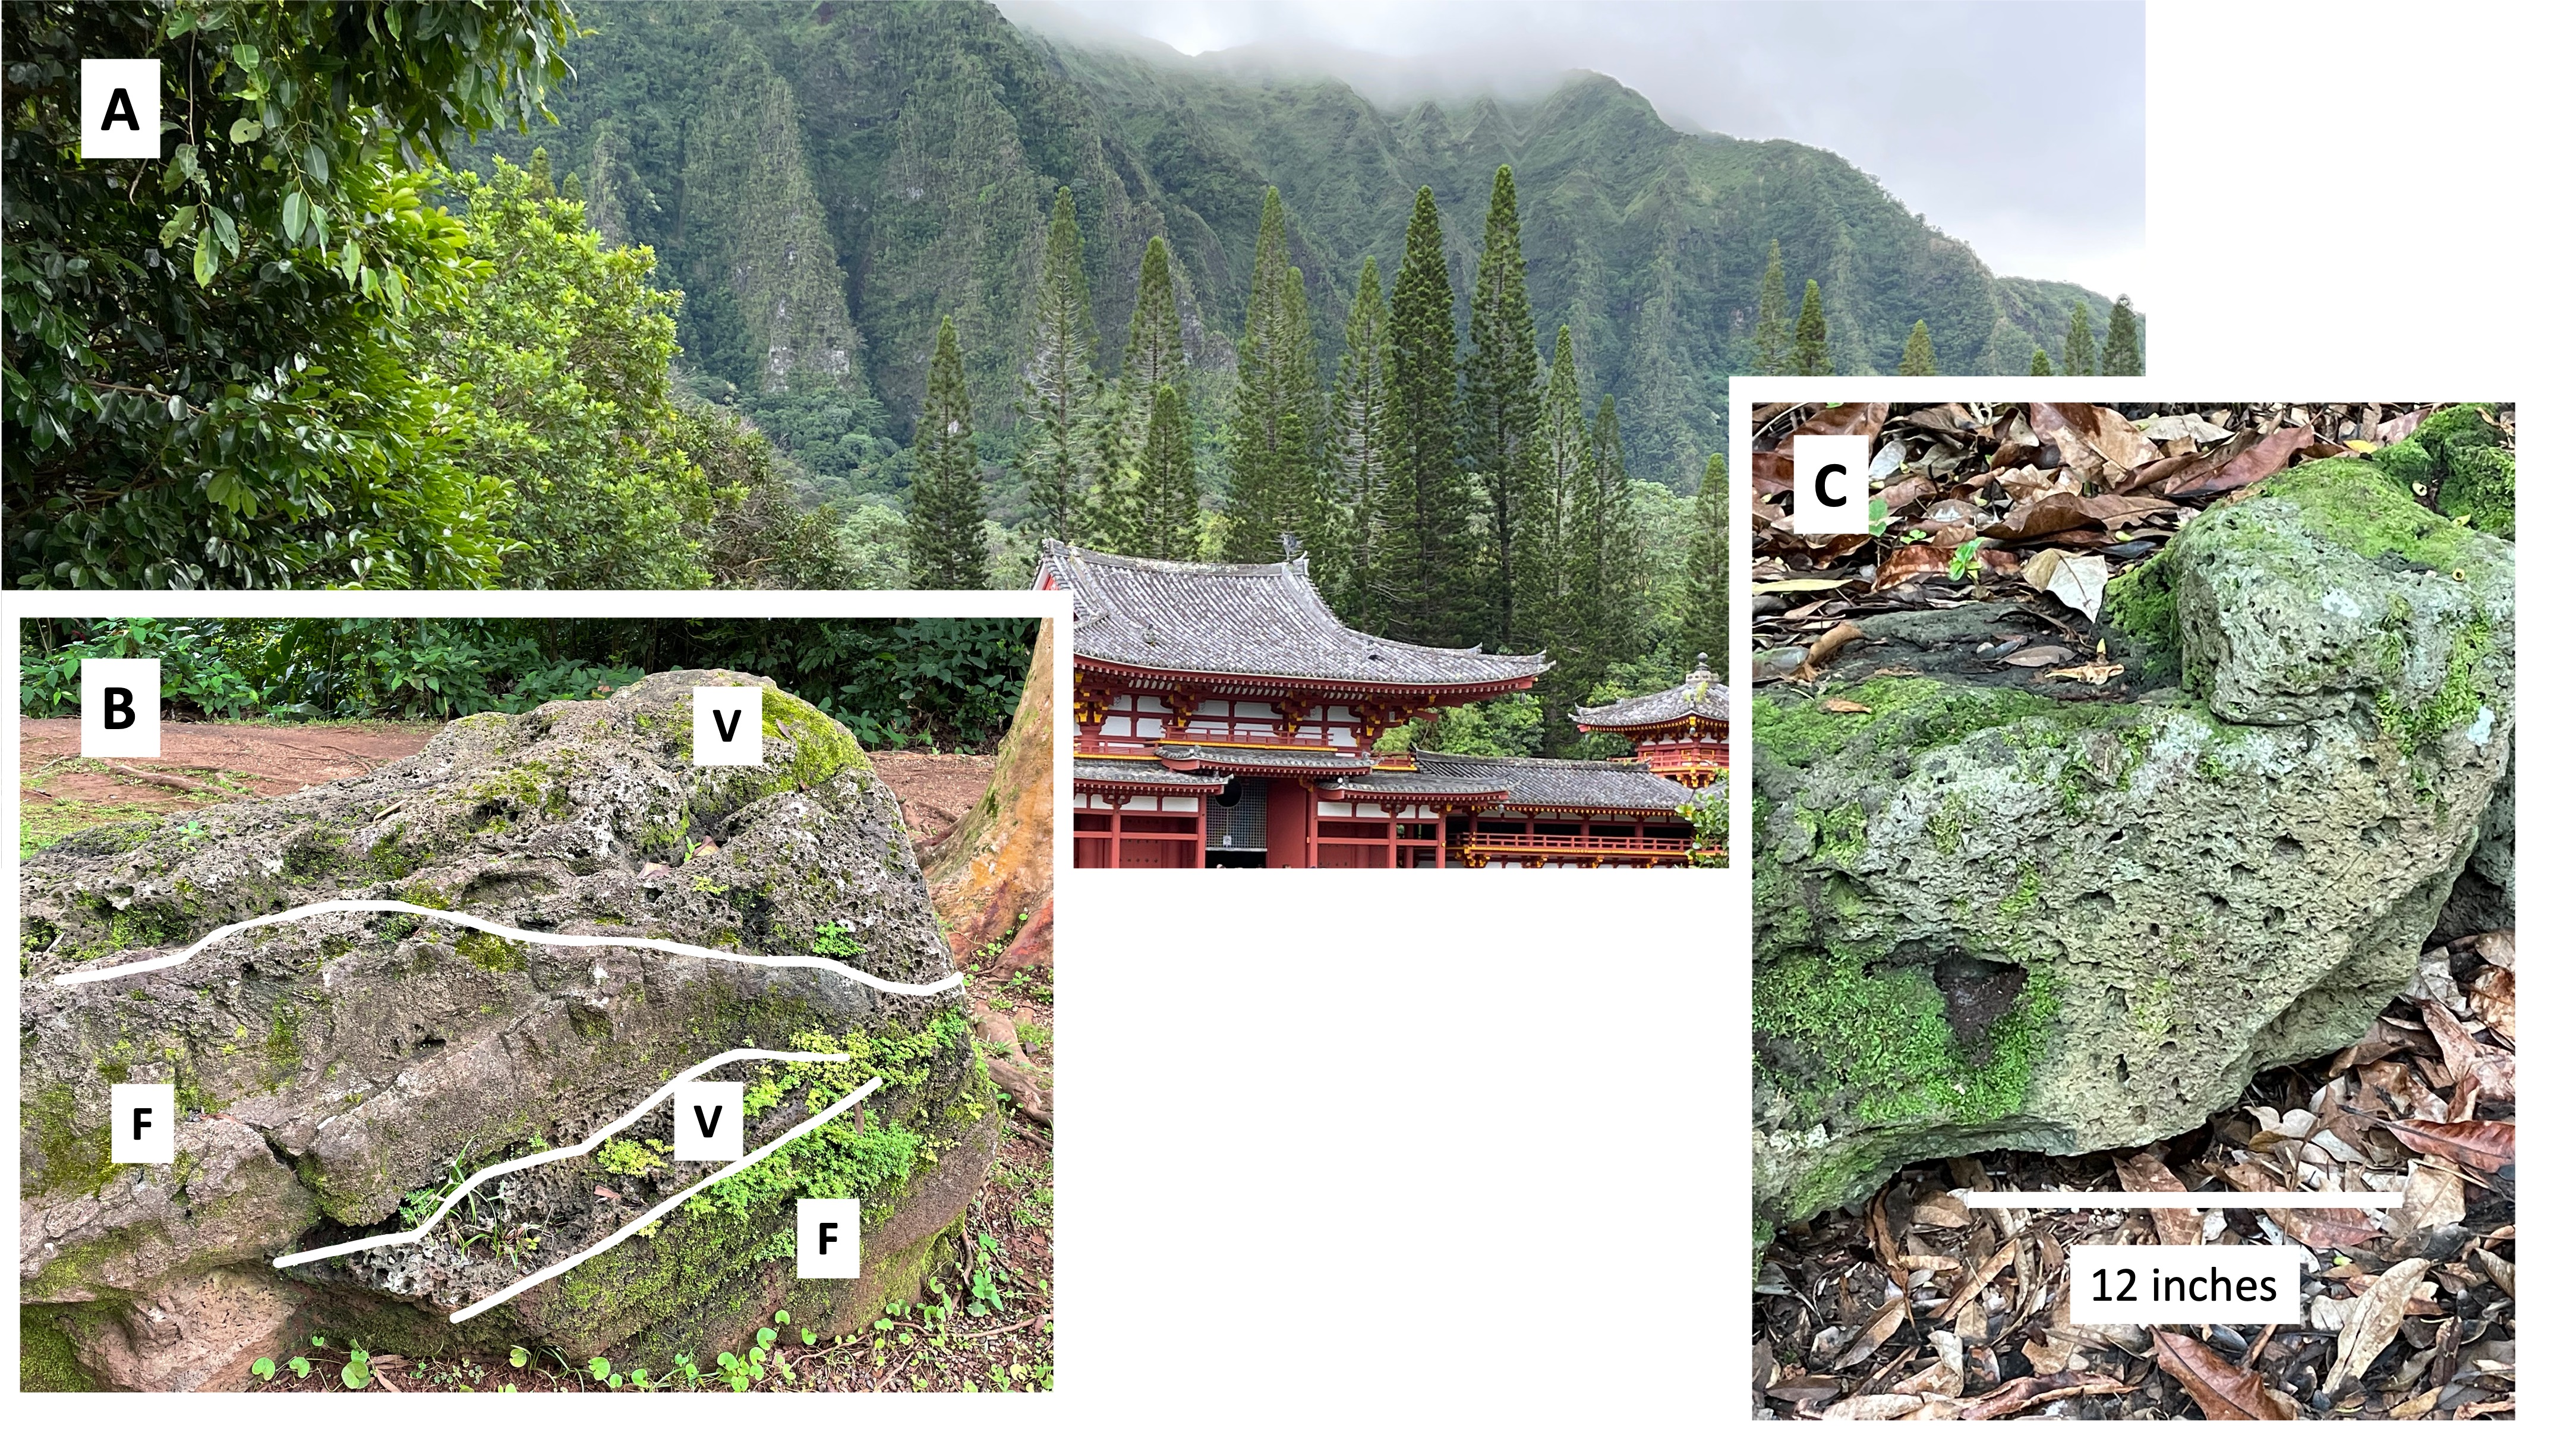
These rocks have been highly altered because of interaction with water when erupted, but the structures seen in Figs. 3B and 3C were preserved. Magma chambers contain a lot of gas, e.g., carbon dioxide and hydrogen sulfide, which expands when the magma moves towards the surface where pressure is lower. Small cavities (vesicles) remain when the gases escape (see Fig. 3C). The volcanic gases are not uniformly mixed within the magma however, so some of the erupted material will have vesicles whereas some will not (see Fig. 3B). Nevertheless, well-defined contacts between gas-rich (vesicular) and gas-poor (solid) magma when it flows onto the surface cannot be easily explained. The “V” and “F” layers in Fig. 3B were not necessarily flowing, although it is likely that they were moving if they were erupted onto a sloping surface. The contacts (white lines in Fig. 3B) could simply be the result of very hot lava flowing out from a common source, the differences that existed within the magma chamber mirroring fine-scale variations of the its chemical characteristics.
The Ko’olau volcanic system would have been venting along fractures, thus creating many, often overlapping, volcanos on the flanks of the main “super” volcano. Such an immense volcanic system couldn’t remain stable for long (i.e. millions of years) and it collapsed into a huge debris field (refer to Fig. 2A), leaving the fragile remnants of its glorious past naked to face the extreme weather that came from the arctic, creating the jagged peaks of the Ko’olau range (Figs. 1 and 3A).
The collapse of the Ko’olau caldera occurred sometime between 1.7 my ago and when volcanism began at several fissures to the southeast about 500 thousand-years ago, adding more land to the island of Oahu.
We’ll see what that was like in my next post…
Back to the Beach: Sand Transport at Waikiki
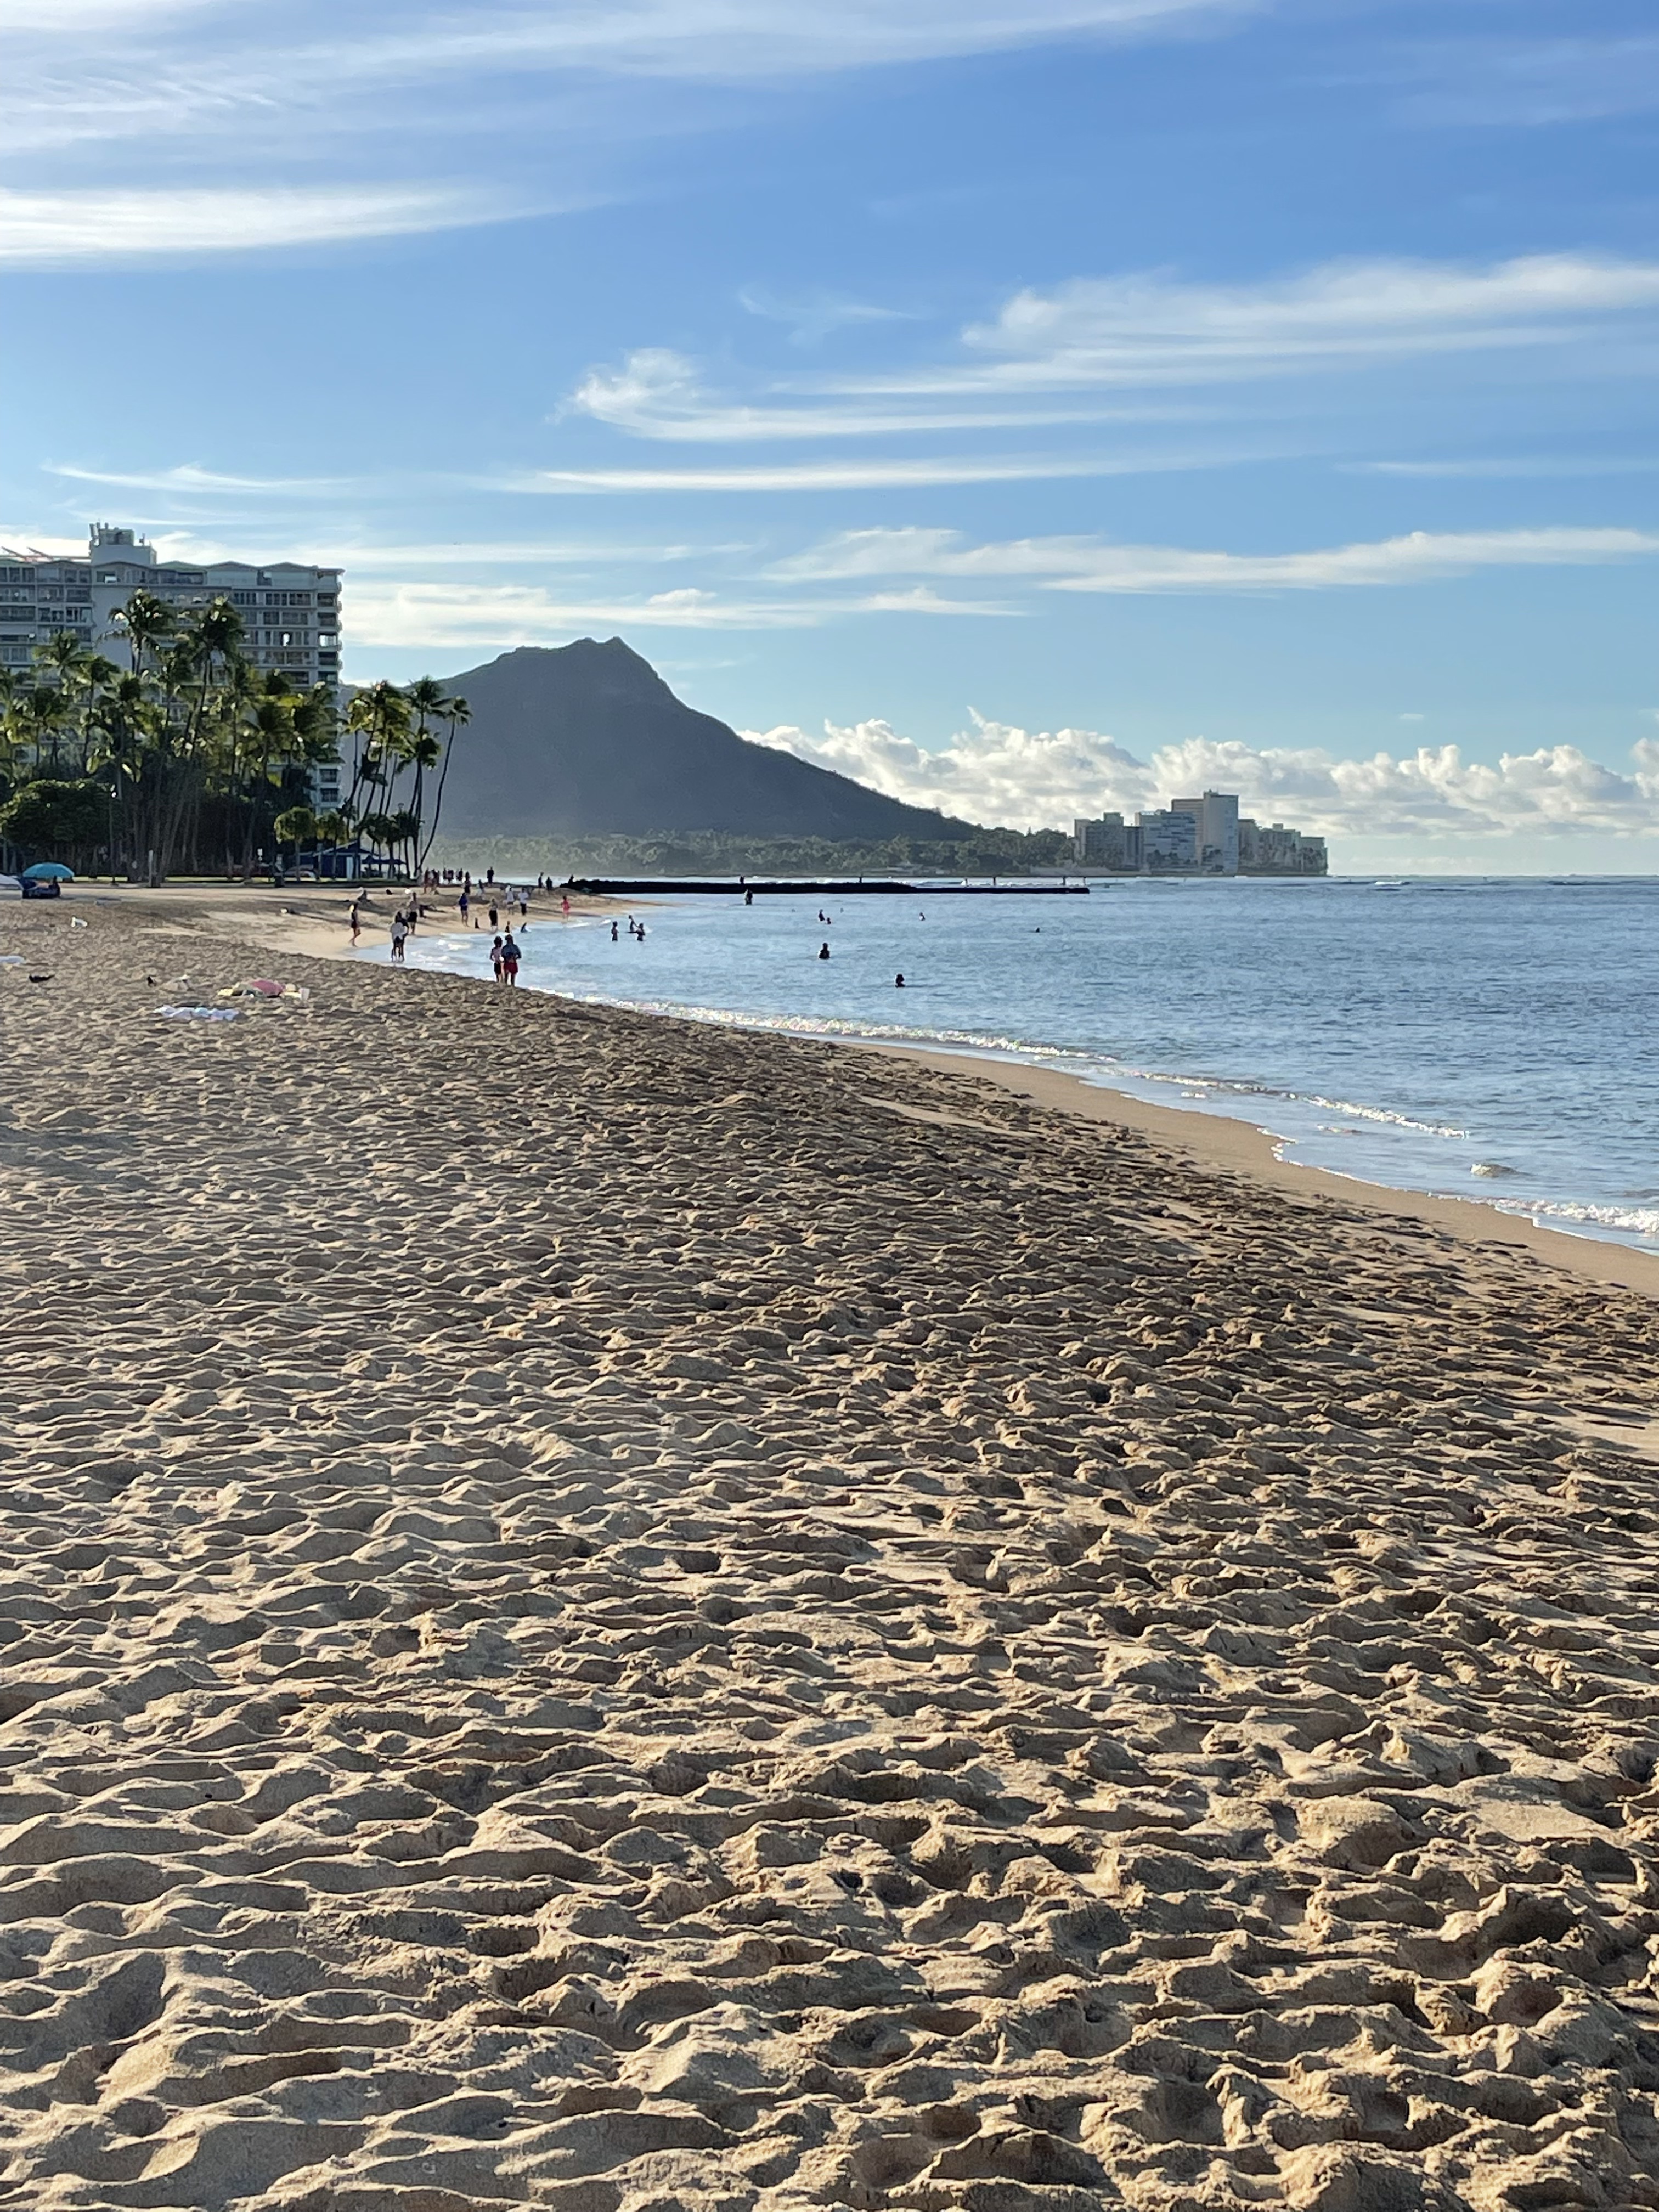
I have discussed beach erosion and topography in several previous posts (e.g. Australia’s east coast and The North Sea); and there is no reason paradise should be exempt from the ravages of wind and waves. Those two powerful tools of nature are on the minds of everyone who lives in Honolulu, as revealed through desperate efforts to keep these beaches from eroding.
Where is Waikiki Beach?

What does the beach look like?

The wind blows from a southeasterly direction for about six months of every year, generating moderate waves that strike Waikiki obliquely from the SE. The result is along shore drift of sand. One quickie solution to this problem is to construct resistant stone or concrete barriers perpendicular to the beach. They are called groins.
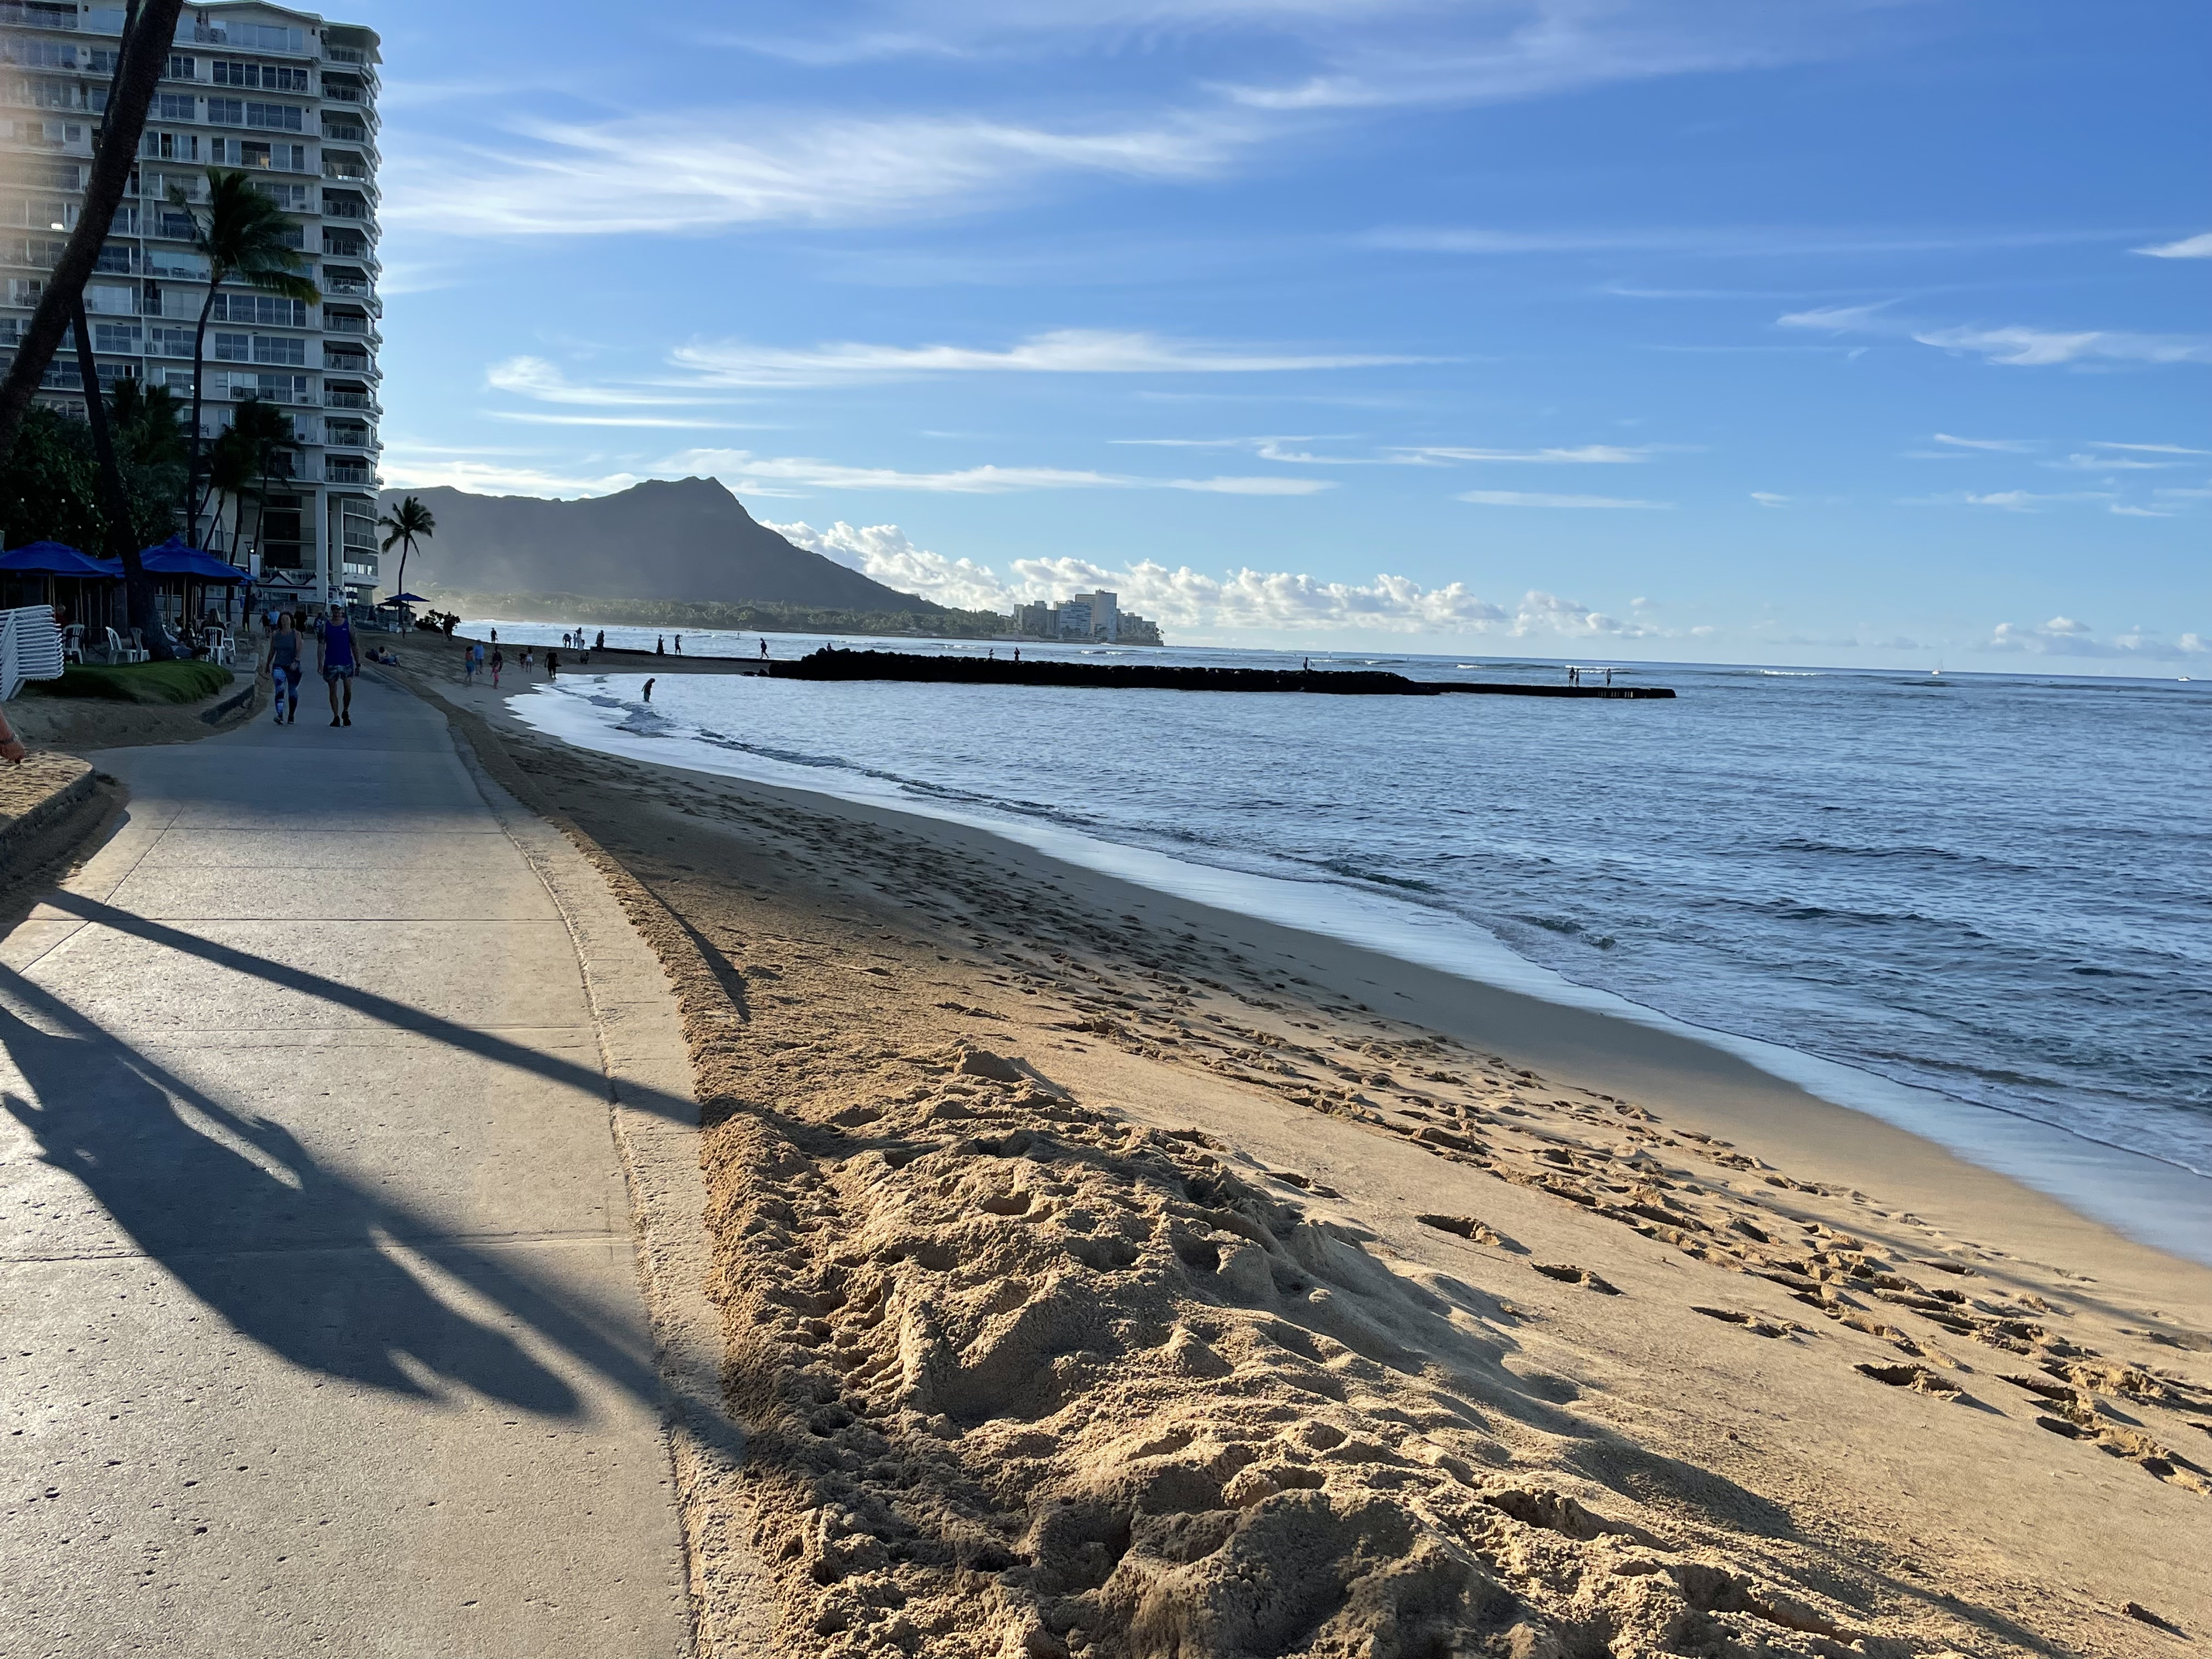
So, what happens on the upflow side of a groin, like that seen in Fig. 4? We can see the erosion on the down flow side (remember the waves are coming towards the camera), but what happens when moderate waves hit a solid wall?

The damage moderate waves can do over years, even decades, has been demonstrated, and Figs. 4 and 5 support those results. The wind blows steadily from the south-southeast between April and October on Waikiki beach. What is the impact?

The westward transport of sand by the SSE wind is obvious at any obstacle to its unimpeded flow, such as sidewalks protected by low walls (Fig. 3), where sand accumulates on the windward side and spills over.
The state of Hawaii is aware of the problems identified in this post, and their solution is beach replenishment. That would explain why the Waikiki beach I visited in 1991 is no longer white, but now as dirty as the beaches of Mississippi Sound, where beach replenishment from offshore sources has been the standard for decades.
Beaches are dynamic zones, where wind, waves, land, and biology interact in a never-ending dance, which is the primary reason (in my opinion) that people are drawn to the seashore. I expected this when I lived on the Gulf coast, but I am surprised to see reality showing its ugly face in paradise…
Claude Moore Park: How Geology Won the Civil War
That is a grandiose title and I admit it’s only part of the story. Nevertheless, the movement of General Lee’s Army of Northern Virginia was tracked from a lookout tower constructed on the ridge that bounds the northern margin of Claude Moore Park (Fig. 1), from where his troops were observed to be moving north, towards Pennsylvania. Because of this tactical intelligence, Union forces converged on Gettysburg and were able to repel the Confederate invasion. Most historians refer to Gettysburg as the high tide of the Confederacy.

The study area is located near the Potomac River, where it drops from the Appalachian Mountains to Chesapeake Bay (Fig. 1). The ancient rocks that underly this area have been deeply eroded by streams, producing a labyrinth of hills and valleys. This post begins at the Uplands (Fig. 1) and shows the dramatic change in both ancient and modern sedimentation that results from such a landscape.

The ridge probably follows the erosion-resistant channel of a river, with coarser sediment forming uplands because it is resistant to erosion. It is like a topographic inversion; what was once low (the bed of a gravel river) is now high because cobbles are difficult to move by water that is no longer focused in a river channel.
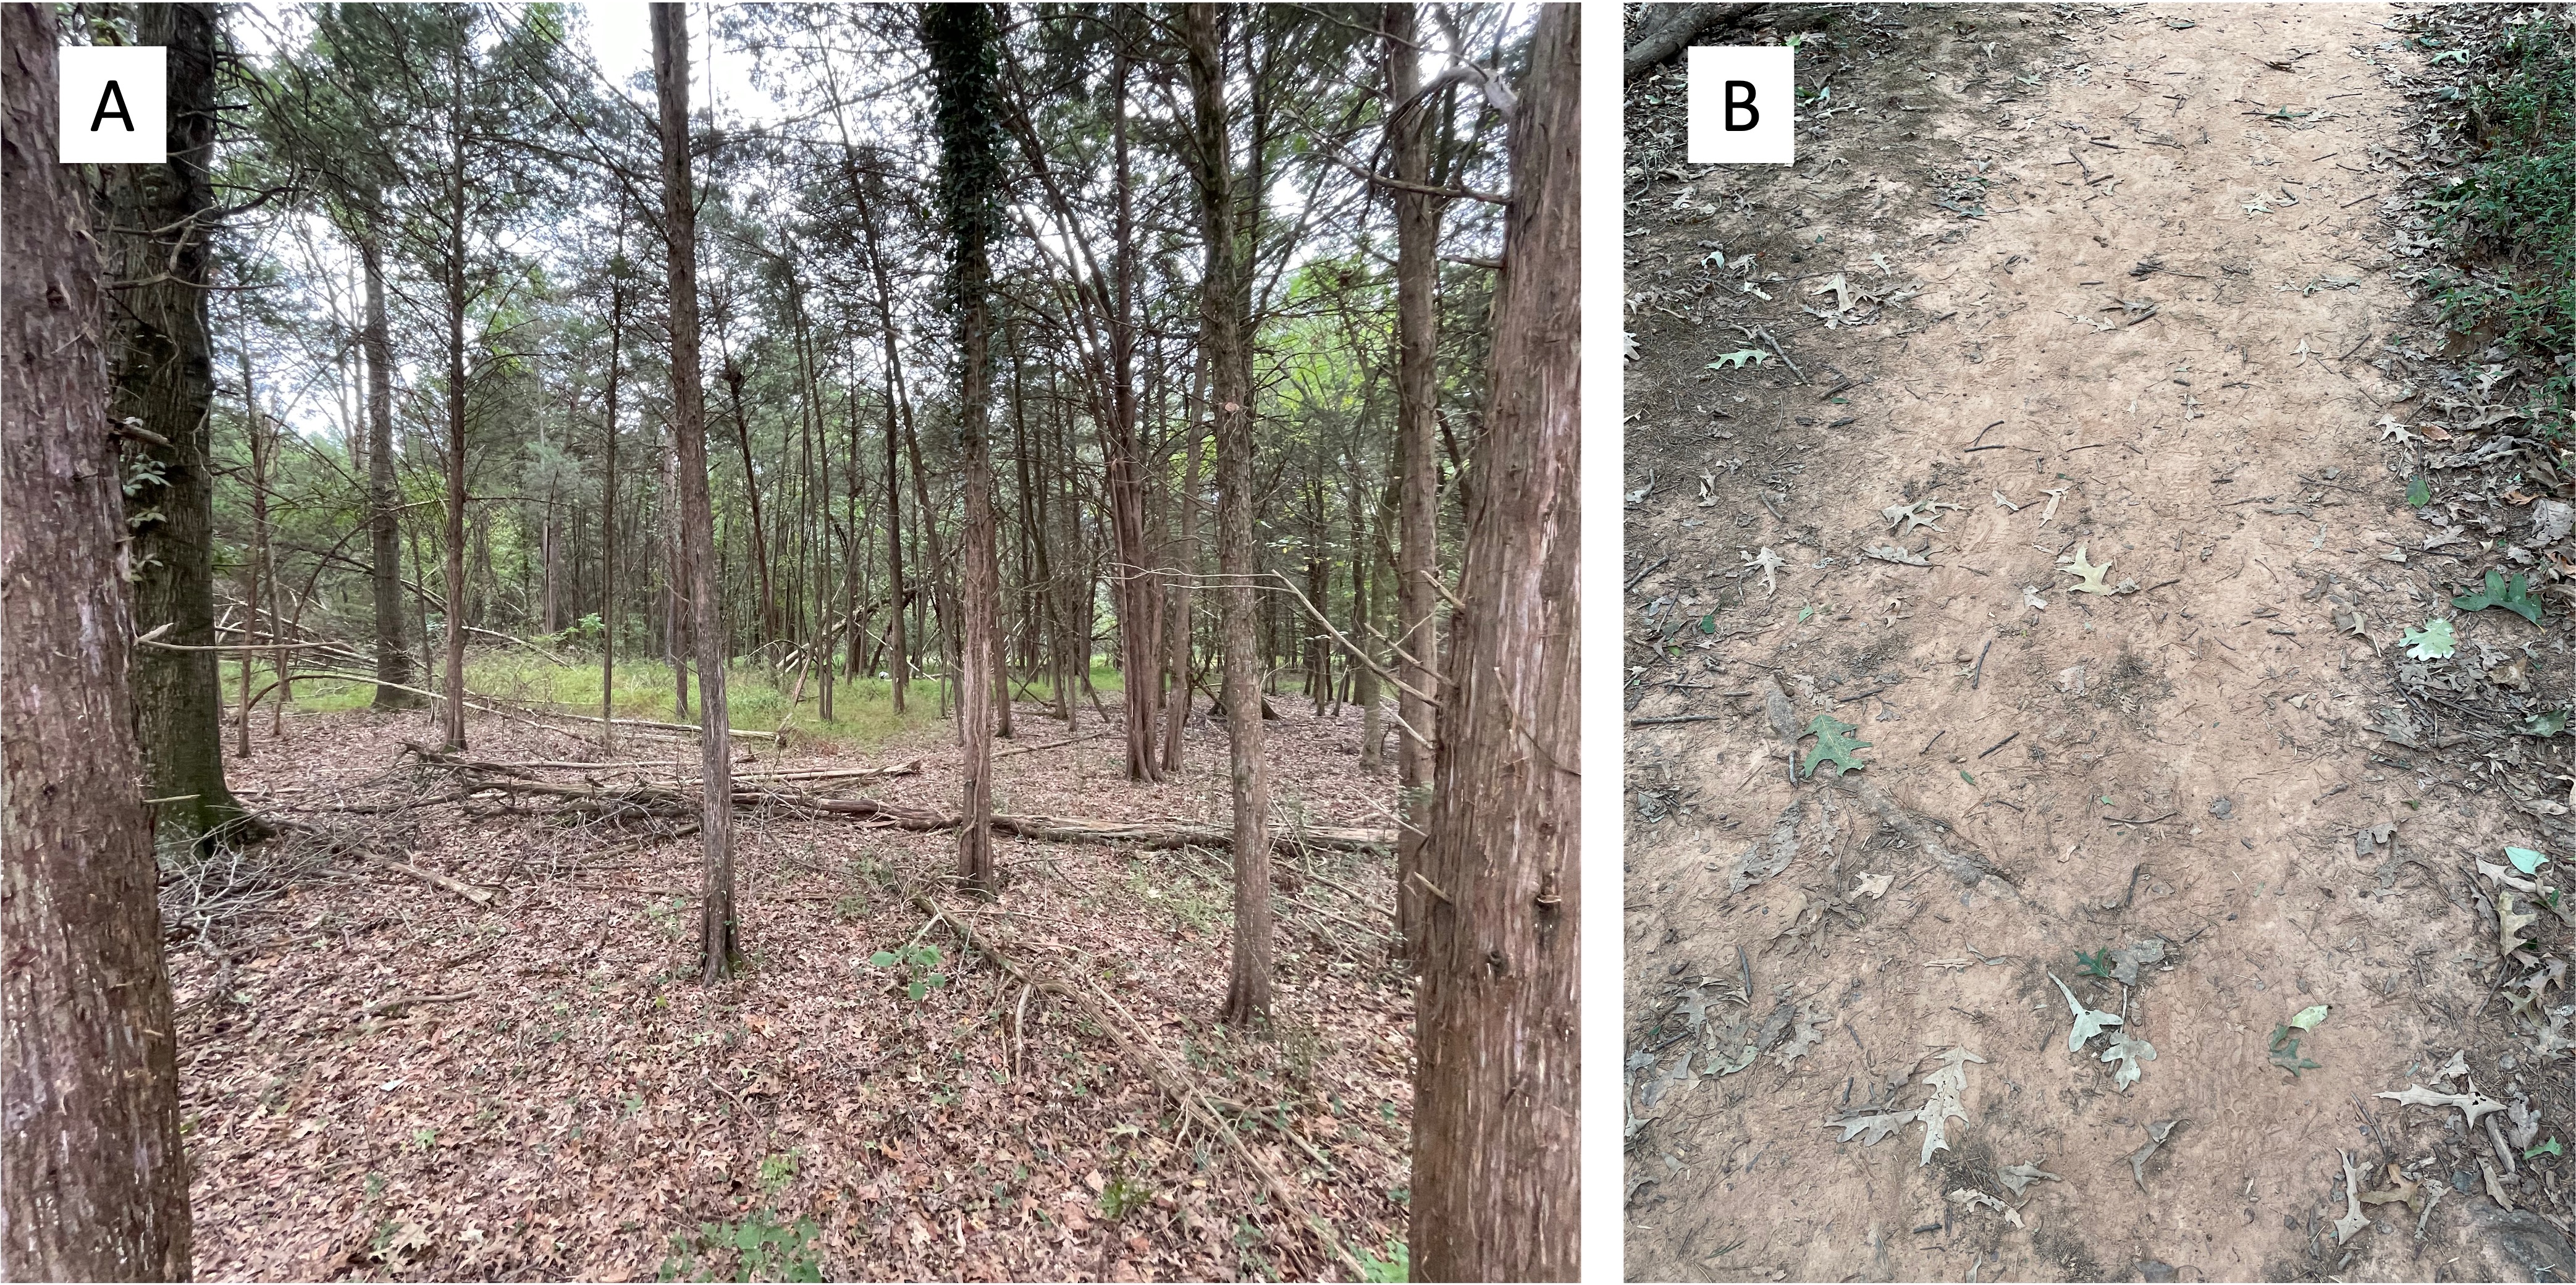
The slope reduces southward and drains into a pond (Fig. 1), which is simply the lowest topography and thus wet year round. However, the entire area labeled as “Wetland” in Fig. 1 is probably periodically inundated during wet times.

This post has shown how sedimentation can change over short spatial distances, and topography can become inverted. The wetland area was once the flood plain of a gravel river (e.g. Fig. 2), but the silt and clay that collects on a flood plain is easily eroded and weathered when it is exposed to the elements, creating local wetlands surrounded by ancient river beds.
This interpretation is speculative because bed rock is never far beneath the surface in northern Virginia. We saw no outcrops on the ridge, however, which doesn’t mean that there is no resistant rock beneath the gravel-covered slopes, but it is consistent (geologists love that word) with my interpretation. Further support for the ancient stream-bed hypothesis comes from the orientation of the ridge, which doesn’t follow the regional structural trend of NE-SW for basement rocks. Note that the Appalachian Mountains define this trend (see Fig. 1), as have all of the Paleozoic and Mesozoic rocks we have encountered in the area. The uplands (see Fig. 1) ridge is oriented east-to-west, which goes against the grain, geologically speaking.
Thanks to an ancient gravel stream, the Union army was alerted to the movements of the Confederate invasion and stopped them at Gettysburg. Geology saved the day again…
The Forest and the Trees: Glacial Topography of the Central German Plain

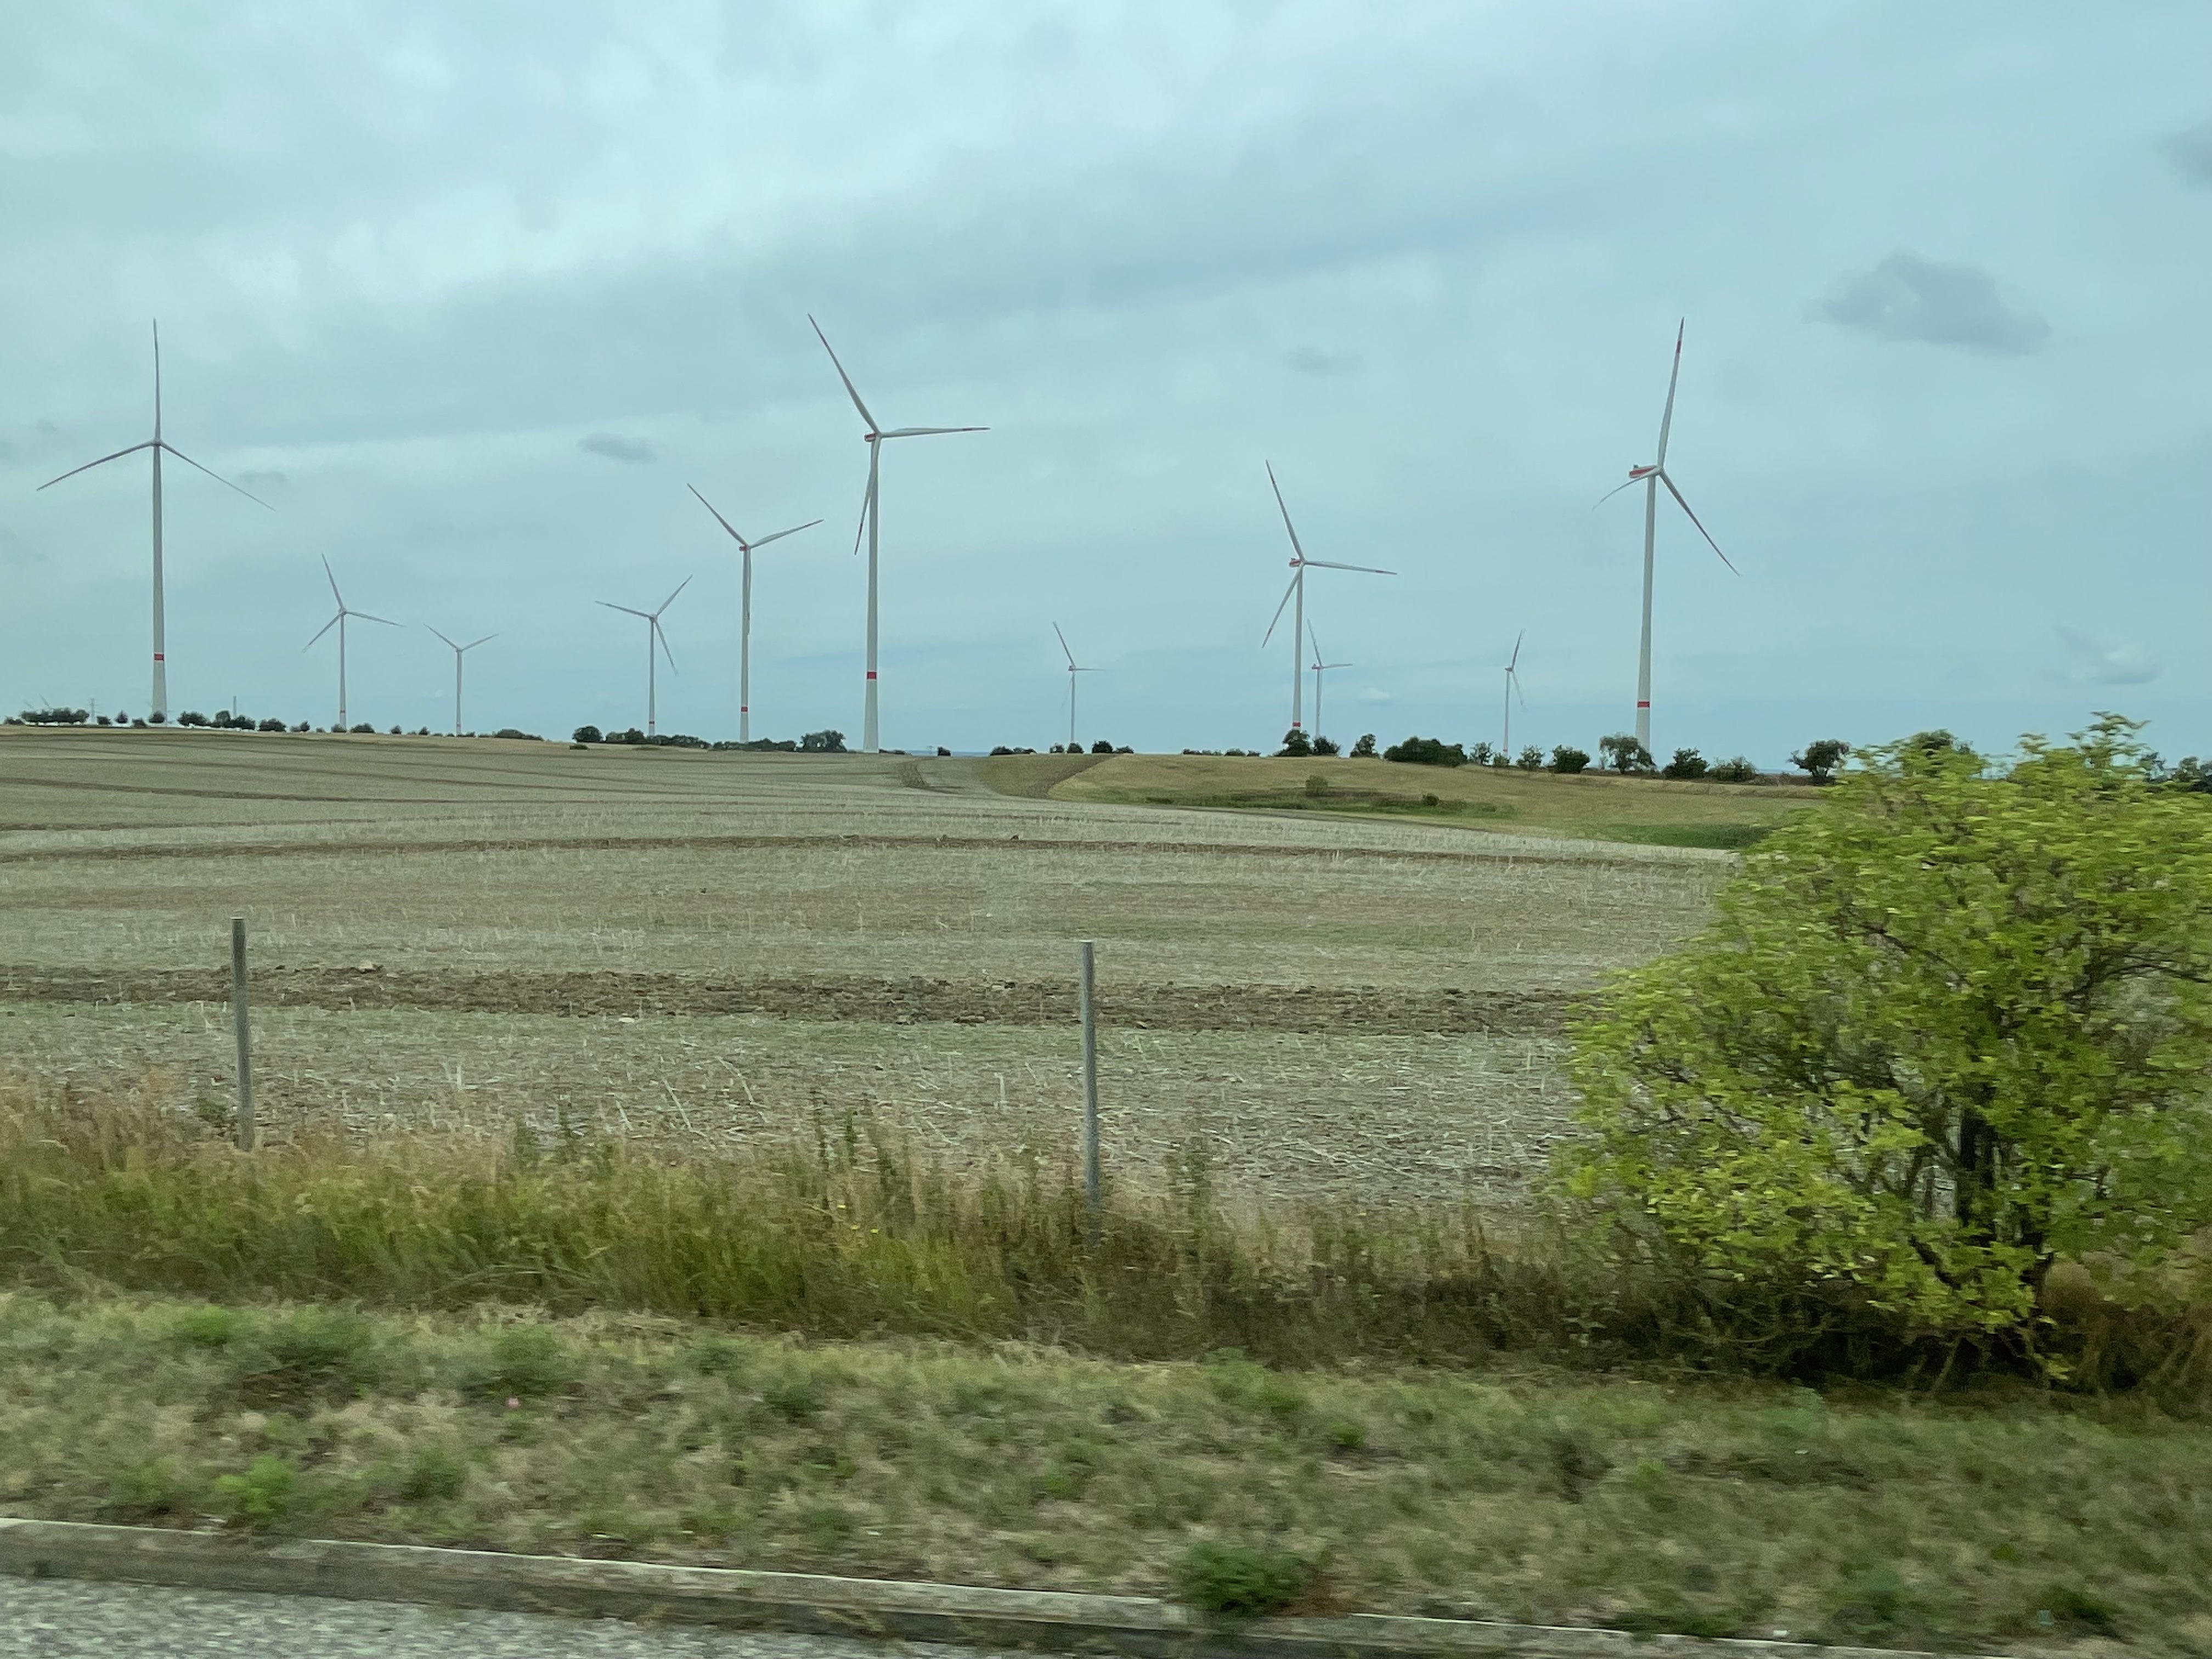
The wind blows pretty steady over the North German Plain and Central Uplands, so there are wind turbines everywhere, scattered among the hay fields (Fig. 1).

The topography of the Central Germany Plain is very similar to Nebraska, Kansas, and the Dakotas, because they were all created by the advance and retreat of multiple glaciers during the Pleistocene Ice Age. As we saw in the last post, advancing ice sheets as thick as a mile push rock and soil in front of them, before melting back for a few millennia, leaving piles of soil and boulders behind. They are like gigantic bull dozers.
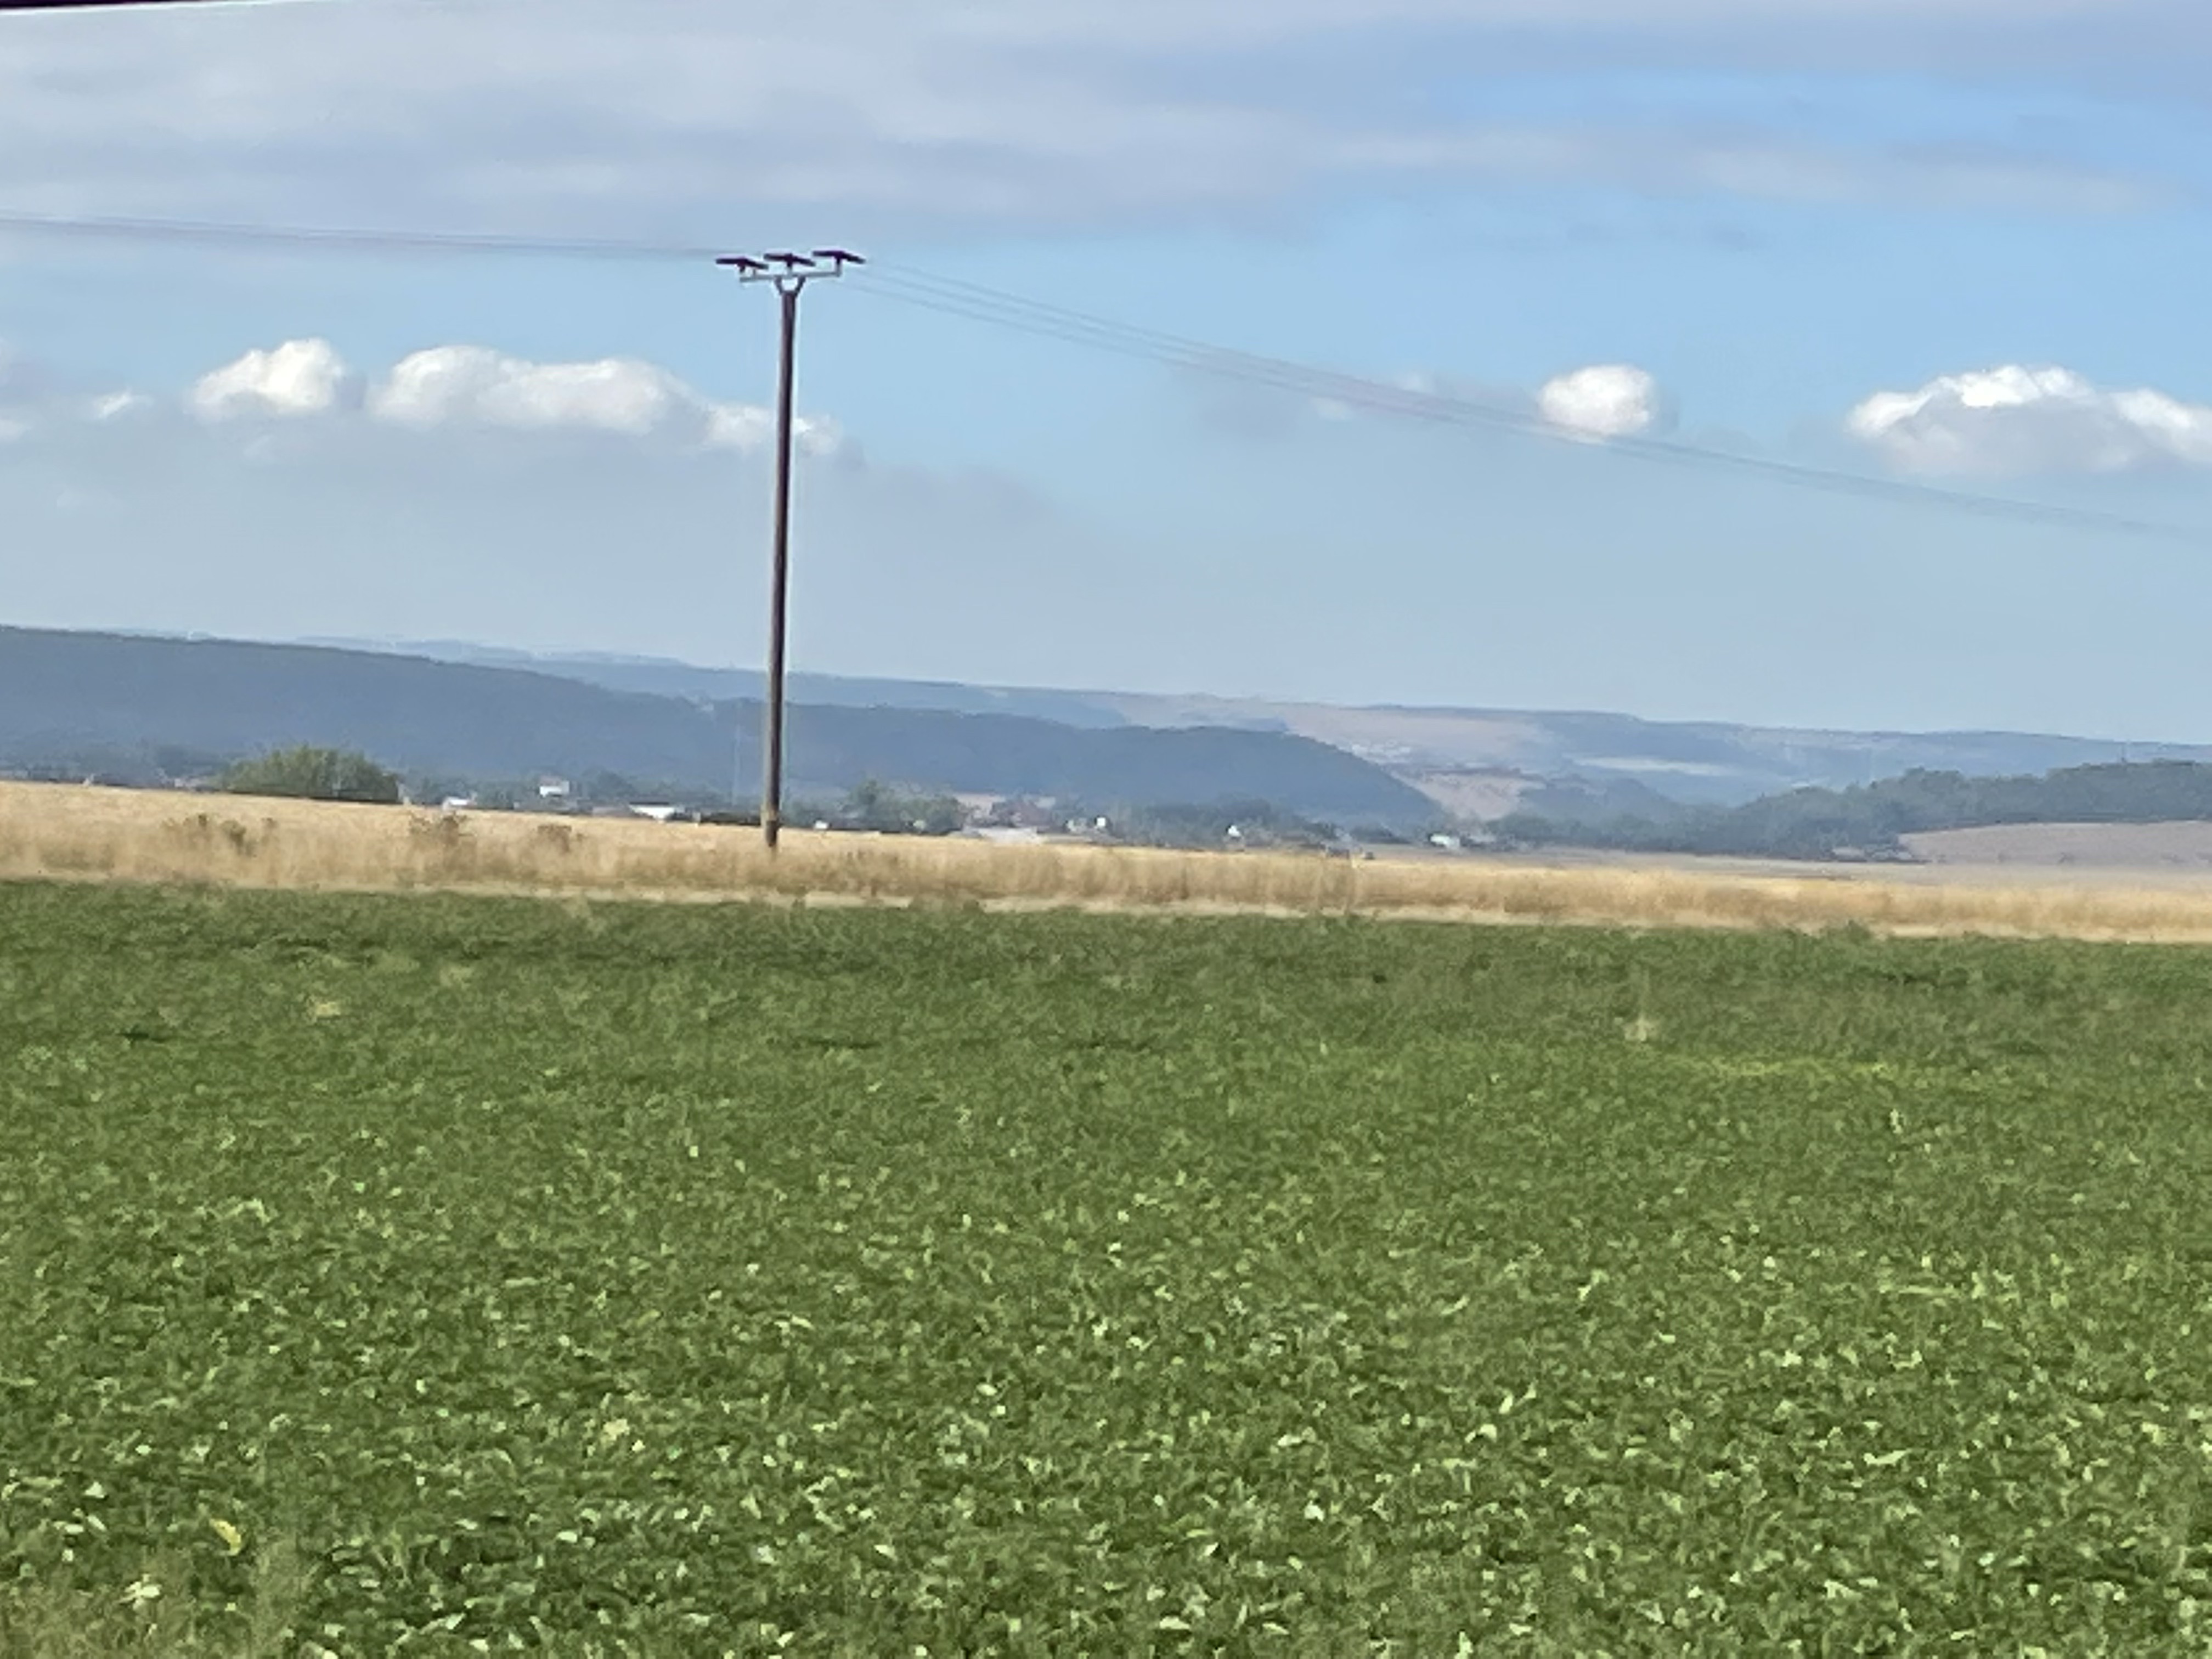
As ice slides over the landscape, scraping off whatever gets in its way, the ice at its base can melt from the friction, creating streams that transport already ground-up rocks. The usual rules of sedimentology apply to these ice-encased streams. They can deposit their sediment load as eskers, which identify these sub-glacier streams, or as piles of scraped-off soil (terminal moraines). I don’t know which I’m looking at in Fig. 4, but this image gives a good impression of their impact on the landscape. Keep in mind that the ice was approximately ONE-MILE thick above the landscape shown in Fig. 4…

As I alluded to in the previous post, geology isn’t a sequence of static processes; there is always more than one cause of what we see today, and none of them are stationary. Thus, the landscape produced by the continental glaciers that advanced over the Central German Plain during the Pleistocene were constantly in competition with alpine glaciers created in the valleys and peaks of the Alps. The huge ice sheets had the power to overcome any obstacle…but they couldn’t surmount the steep slopes of the Alps.
The glaciers that originated in the Alps waited until the last retreat of the great ice sheets that originated in Scandinavia, before they could make their play in the Holocene. Vast quantities of easily weathered feldspar were washed down their steep slopes into a panoply of rivers, which cut through the moraines left behind during the retreat of the continental ice sheets, creating broad river valleys like that of the Saale River (Fig. 5). Germany’s central plain and uplands were cut to ribbons by these growing streams, resulting in one of the most water-navigable regions in the world.
You always have to watch your back…
An Erratic Path: Glacial Geology in Usedom, Germany
This post finds me on the Baltic Sea, although I never actually saw it first hand. But this report isn’t about coastal geology; instead, I will be talking about an unusual feature of glacial terrains.


I haven’t explicitly described glacial terrains in previous posts, and this is not going to be a summary. As always, I’m only going to discuss what I saw with my own eyes. The flat, poorly drained topography of glacial areas (Fig. 1) is often interrupted by linear mounds of loose gravel, sand and silt. These features are called moraines and they are ever-present in northern Germany, especially in Usedom (Fig. 3).
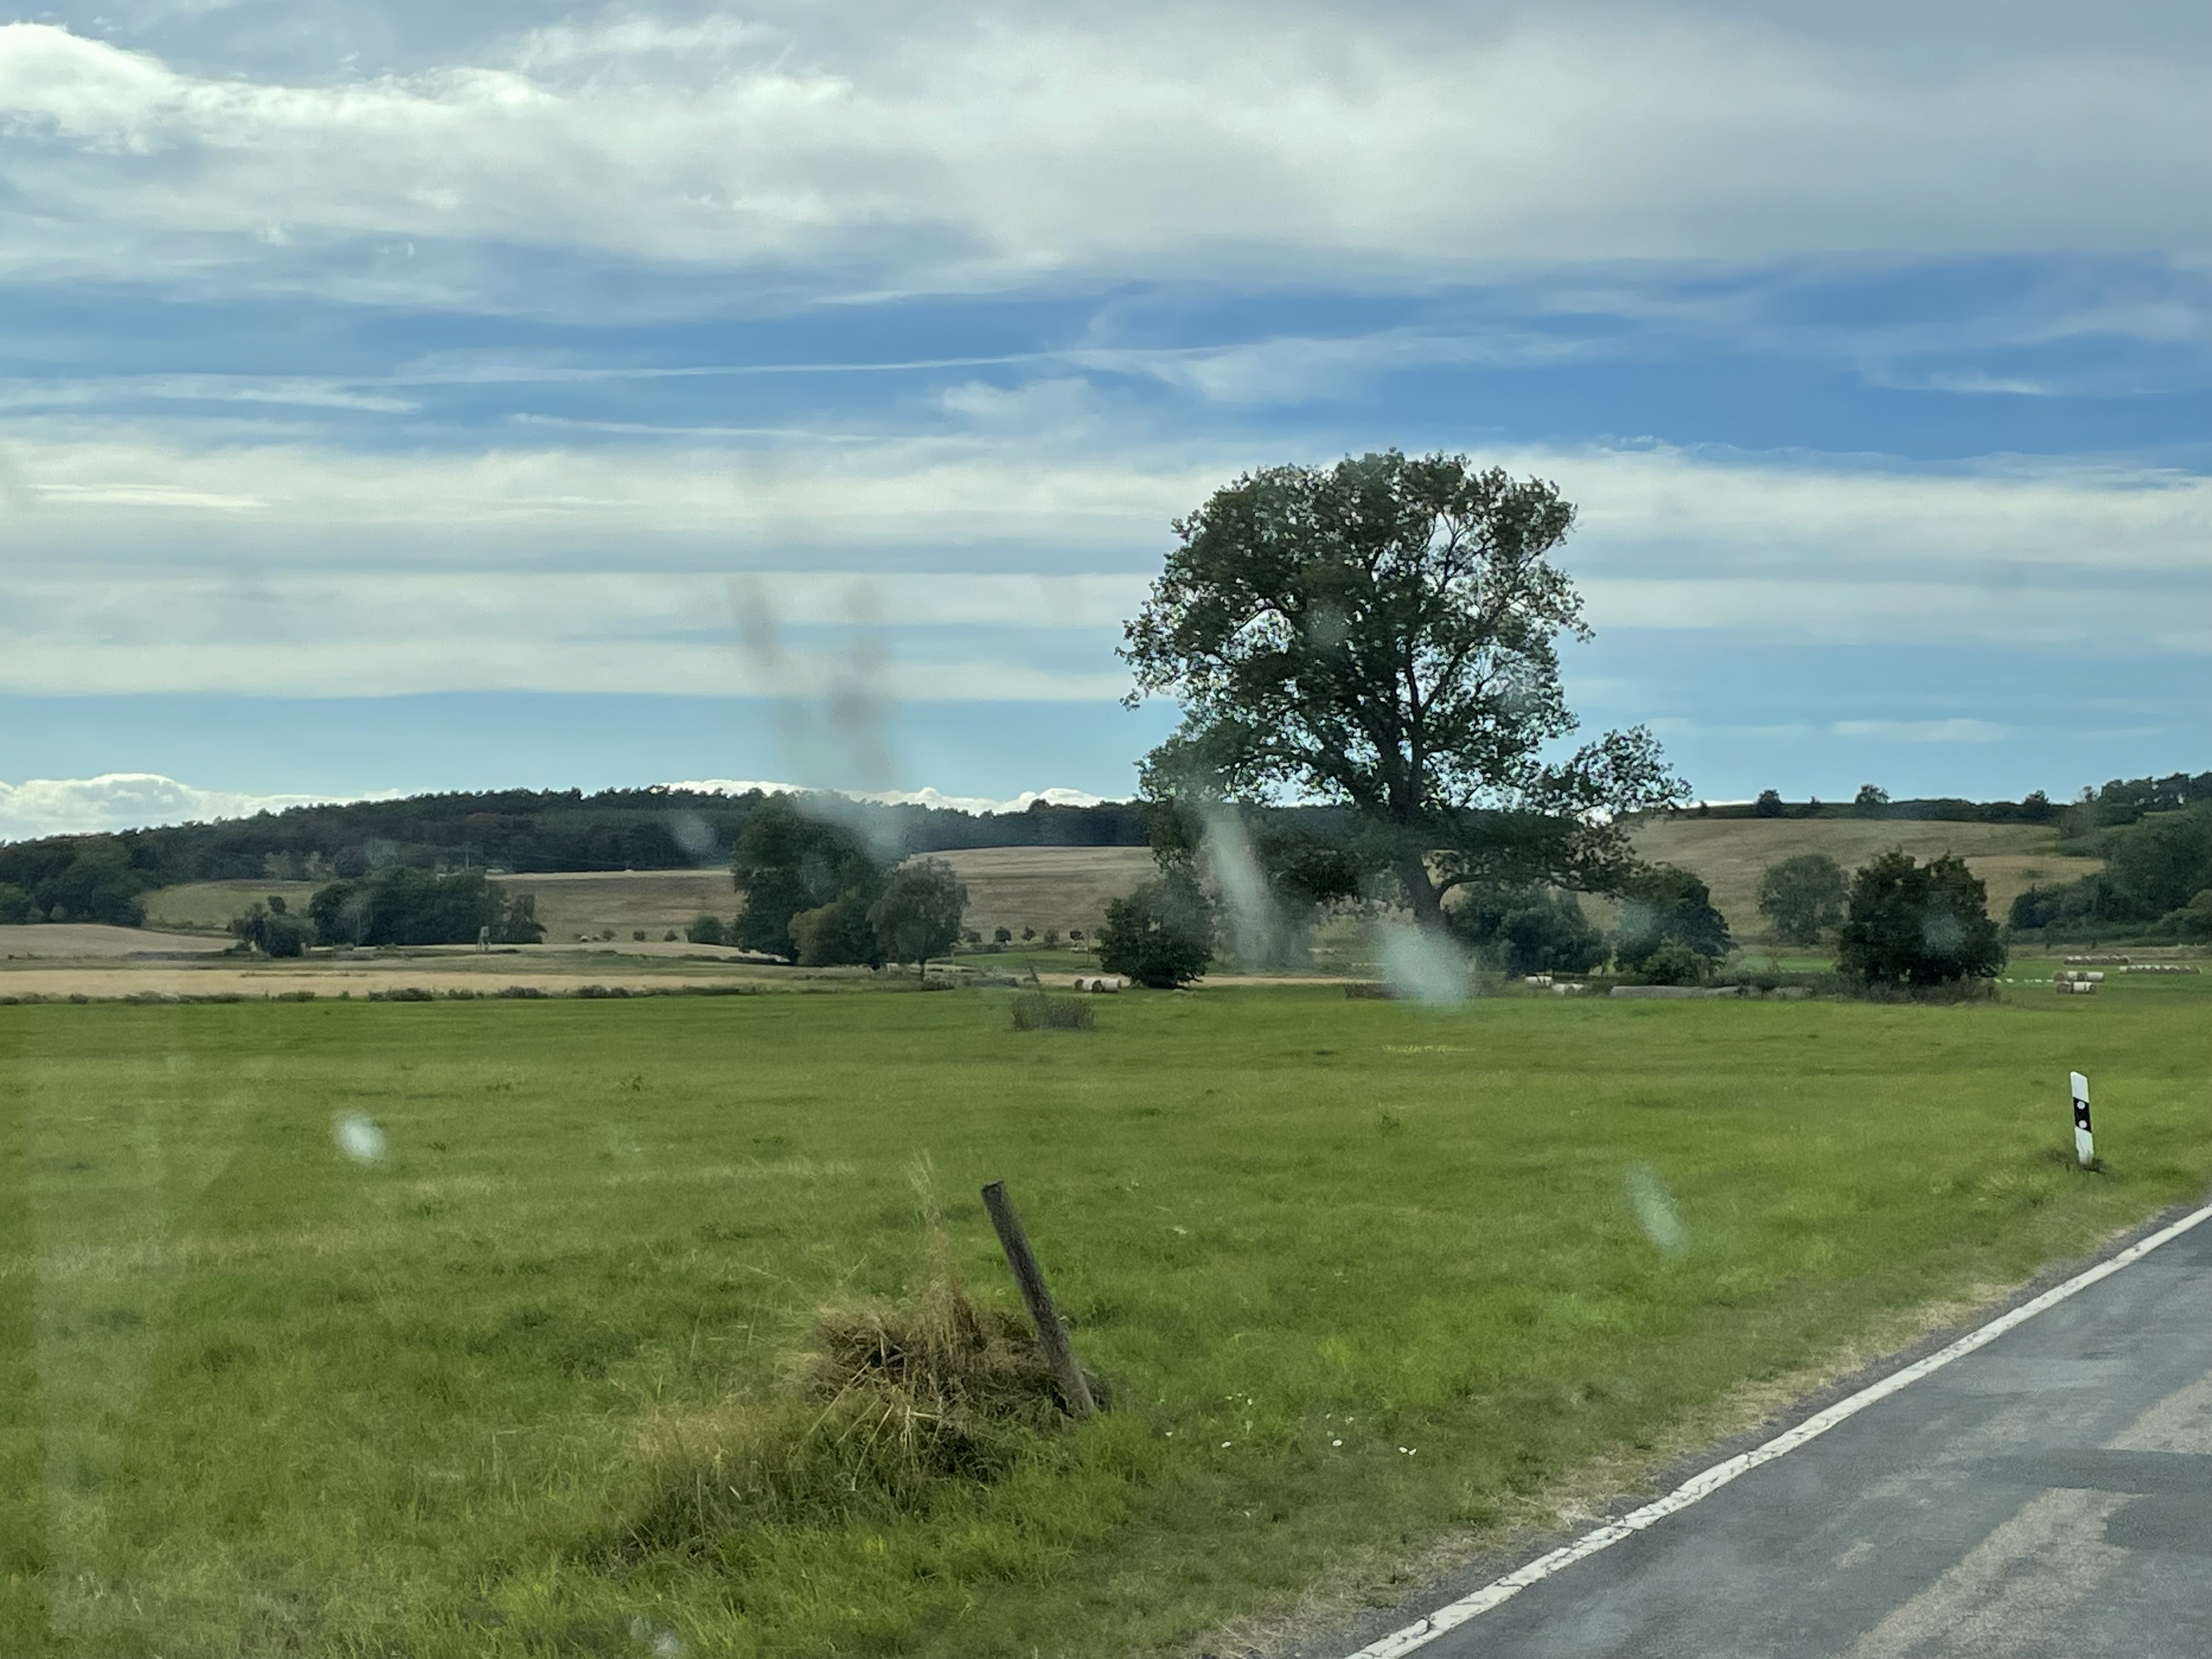
The primary glacial feature I encountered on this trip is the titular Erratic–large, rounded boulders scattered around a featureless landscape (Fig. 4).

Let’s look at a couple of examples and see what they tell us about their source.

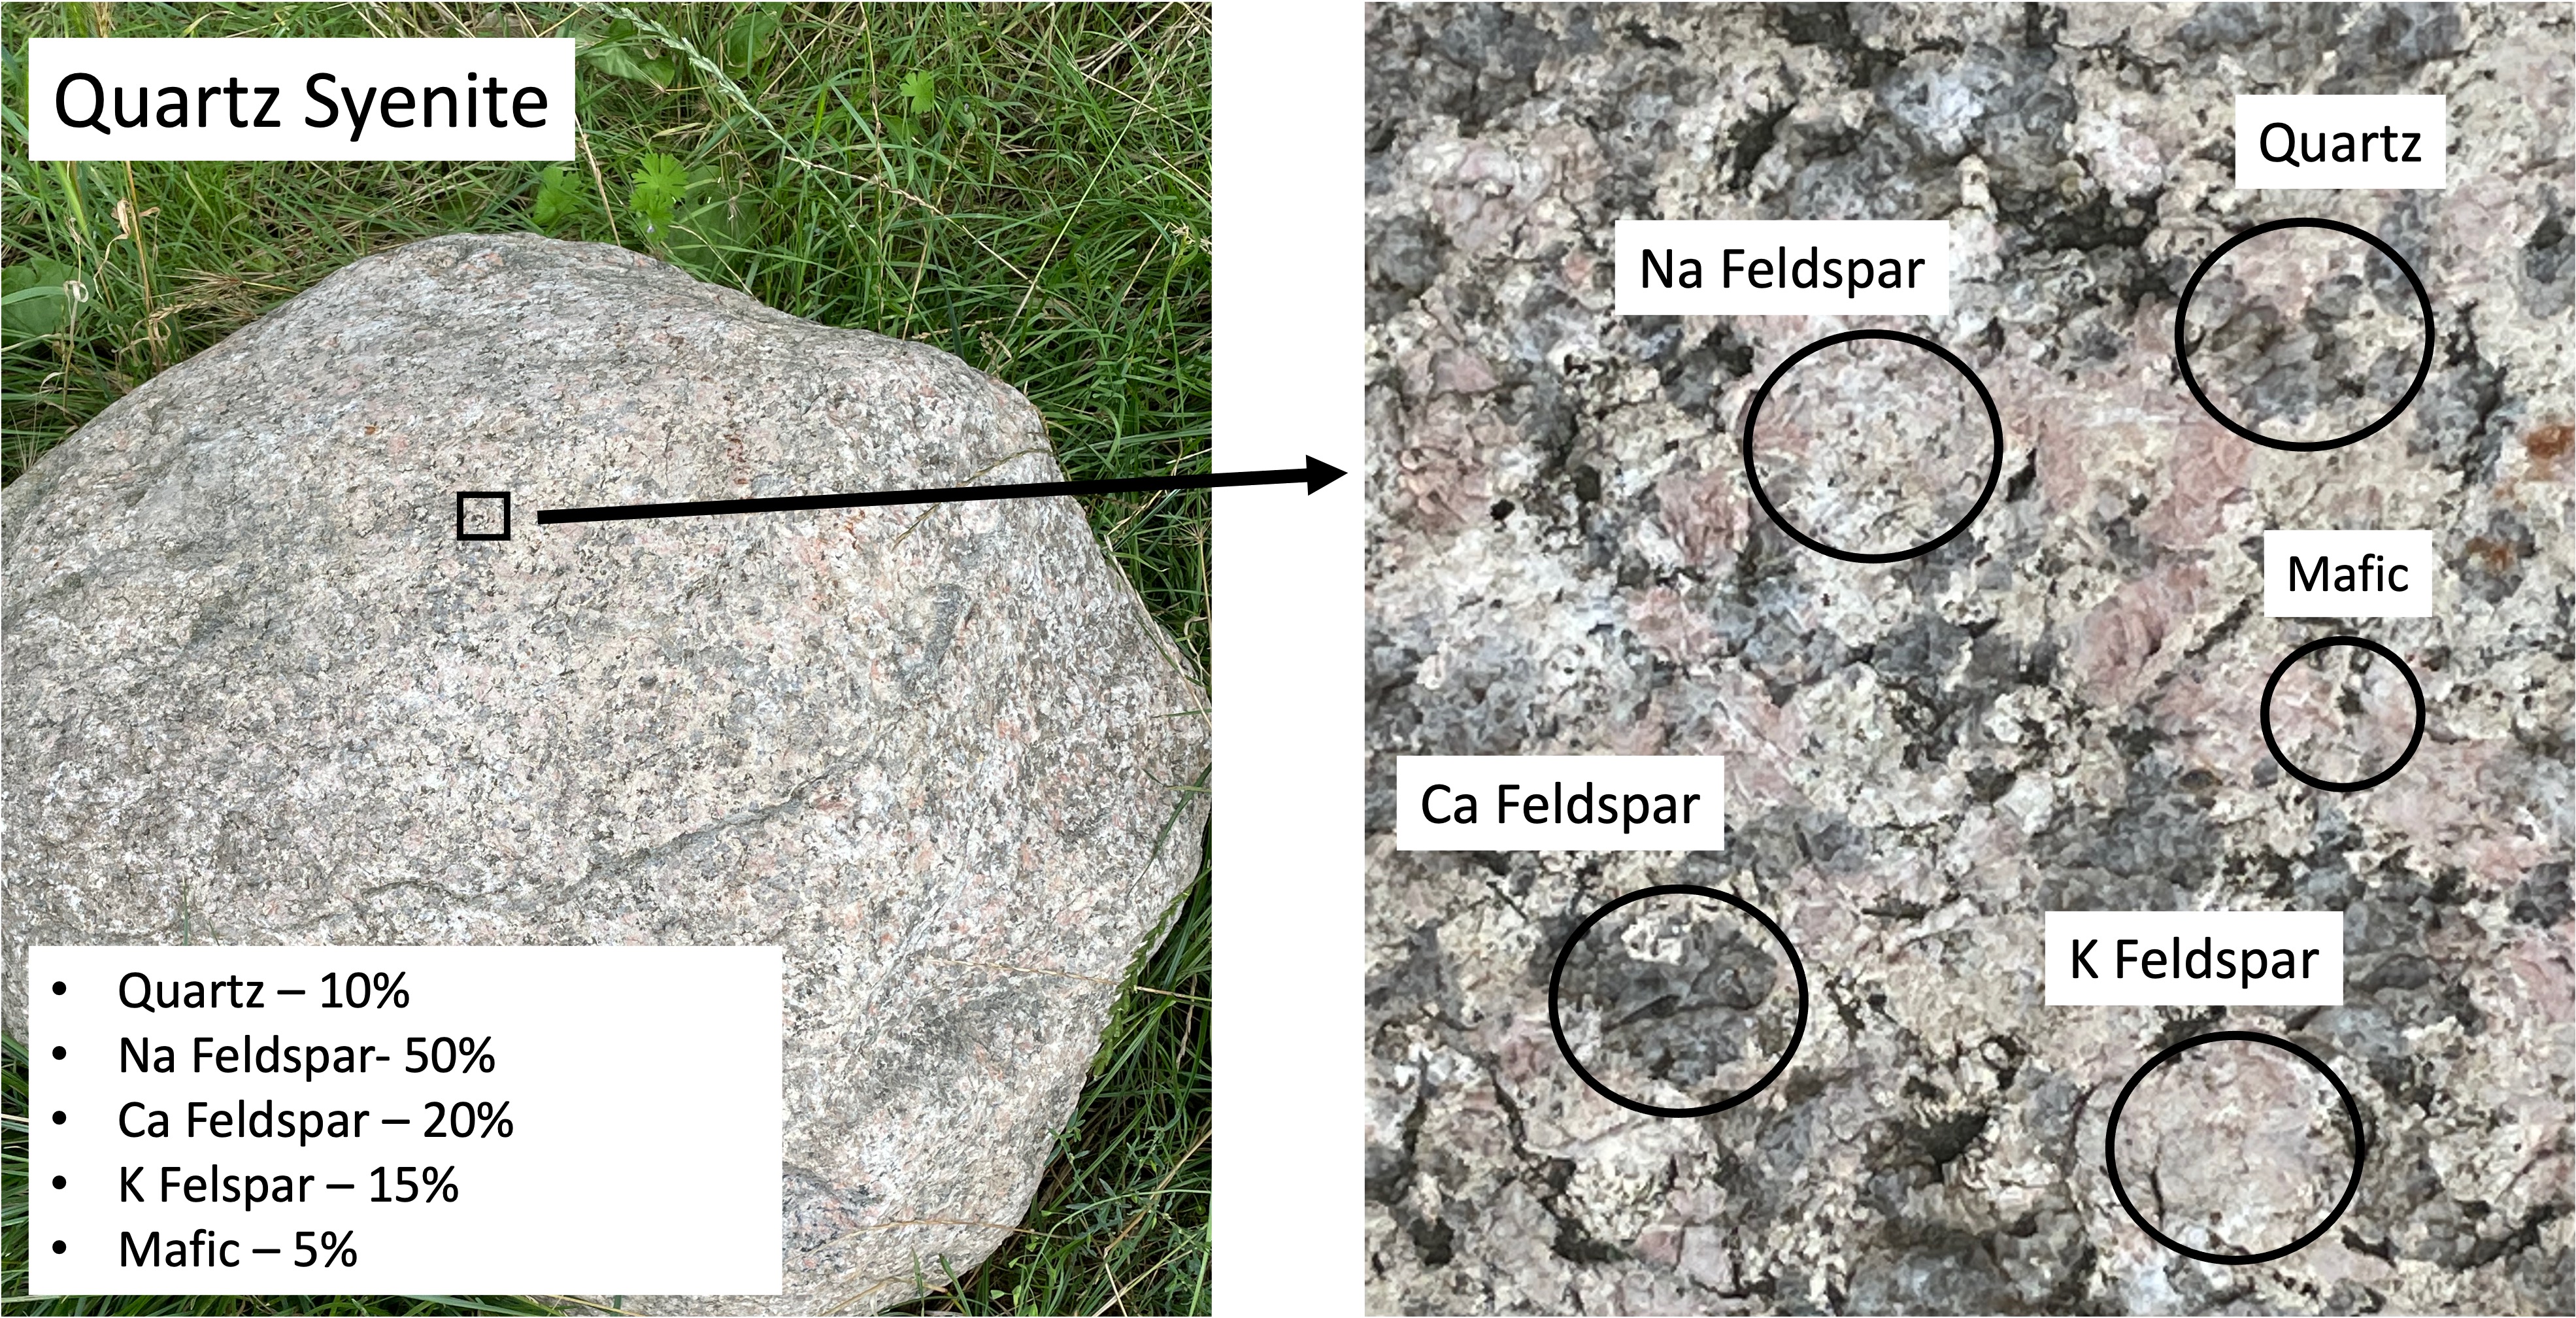
The first erratic boulder I found (Fig. 5) contains no more than 5% quartz (left photo caption), and is dominated by K-feldspar, which is unusual. The magma from which this rock formed (deep beneath the surface where it cooled for millions of years) didn’t contain very much water, which is indicated by the small amount of quartz. The chemistry of the magma is quasi-frozen in the minerals, the second-most-abundant of which is Na Feldspar. The feldspars form a continuum that depends on the relative abundance of potassium (K), sodium (Na), and calcium (Ca); K and Na both form lighter-colored minerals whereas Ca forms dark feldspar minerals. Based on the mineralogical composition of this rock (inset in left image of Fig. 5), this would be classified as a syenite (middle left side of Fig. 6).
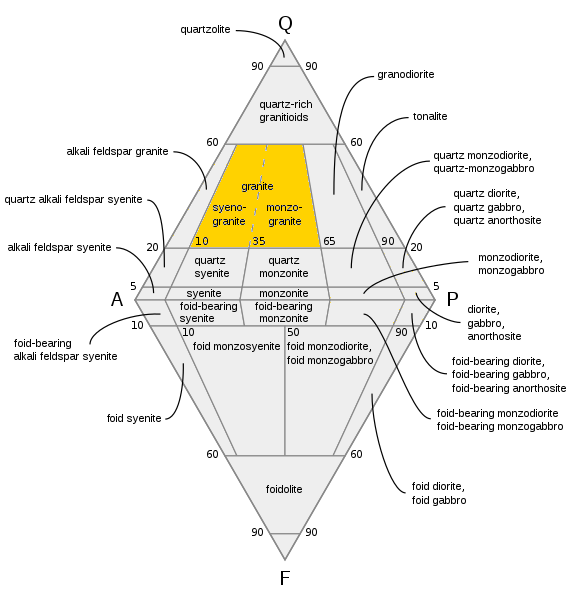
Syenites are formed in thick, continental crust. An example today would be the Alps (far beneath them) or the Himalayas, where subduction of denser oceanic crust is not occurring. In other words, the rock shown in Fig. 5 was created deep beneath the surface (~30 miles) when continents collided.
The boulders seen in Figs. 5 and 7 could have come from the same magma chamber because, as you would expect, there would be variations in local chemistry in a magma chamber tens of miles in diameter, and slow rates of convection wouldn’t mix the magma to a uniform consistency, even over millions of years. Magma, even when heated to 2000 F and buried tens of miles beneath the surface, is still thicker than molasses; it doesn’t mix well.

Phenocrysts like those seen in Fig. 8 are created in intrusive igneous rocks when they go through a multistep cooling process; for example, magma near the edge of the magma chamber loses heat to the surrounding rock and forms crystals like those seen in Fig. 8. These phenocrysts are then captured by the still-molten components of the magma and dragged along for probably hundreds-of-thousands of years (at a very slow speed, like inches per thousand years).
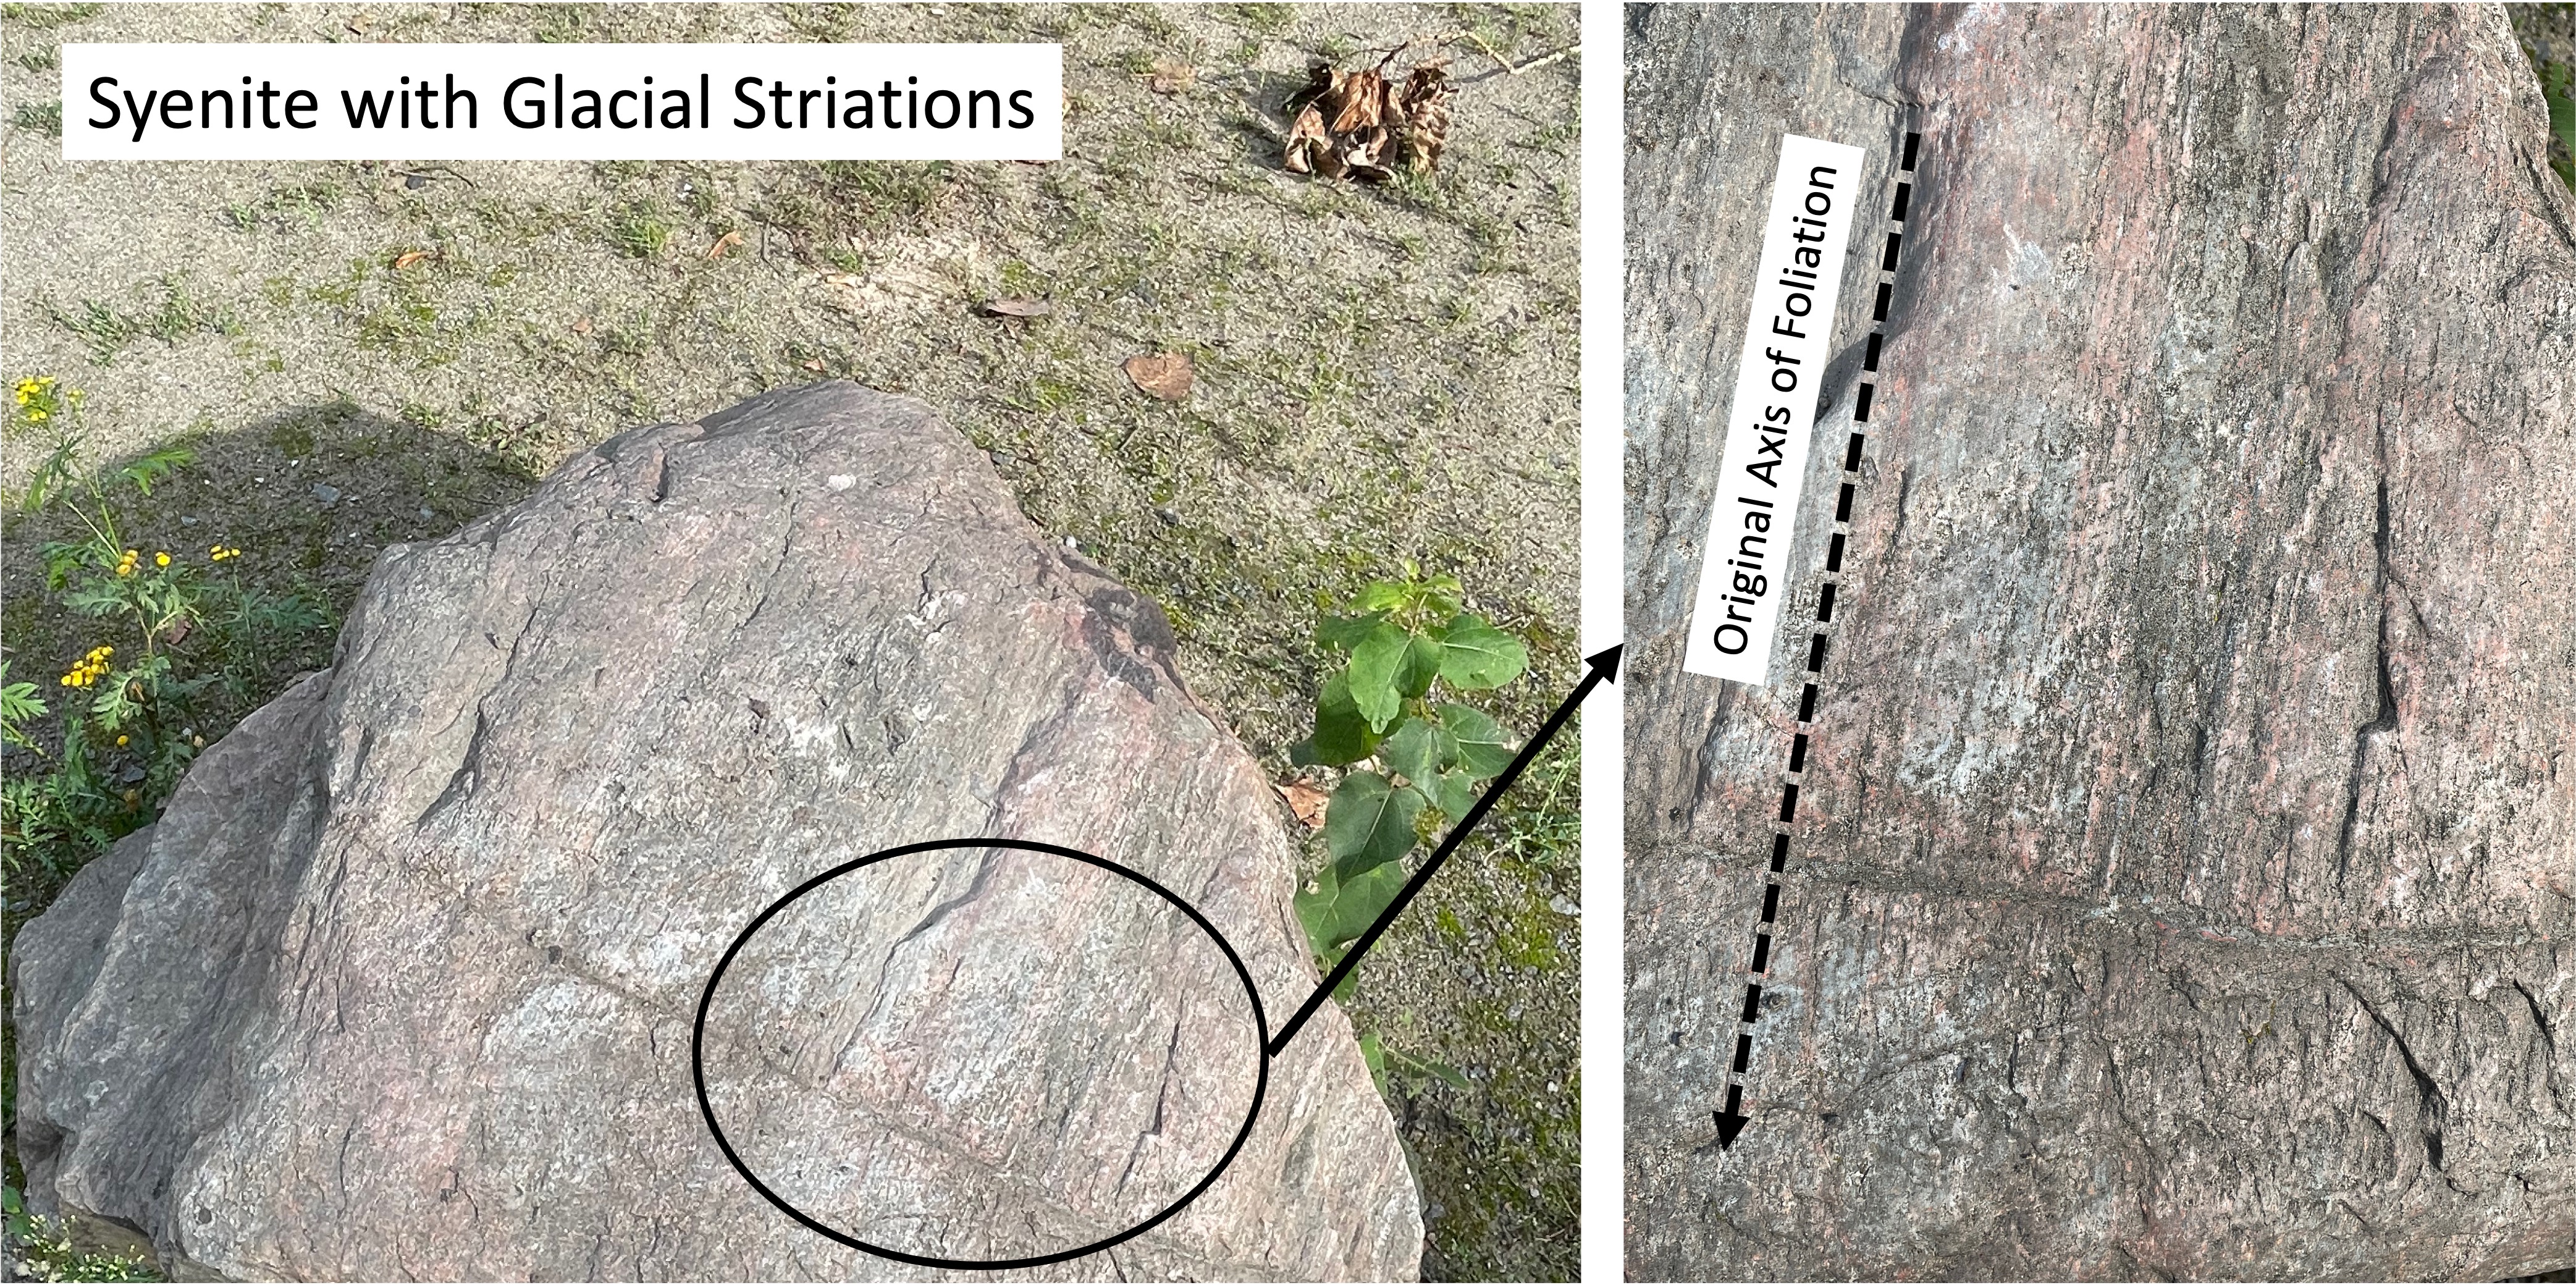
When the magma finally cools enough to become solid rock, it is uplifted as overlying rocks (of all kinds) are eroded by wind and water, not to mention ice. They are finally exposed in great mountain ranges like the Himalayas, where the rock breaks into smaller-and-smaller pieces along joints. When these pieces become small enough to be transported at the base of glaciers (you’ve heard the phrase glacially slow), they are dragged along, scraping over more rocks, sand, and gravel, which leaves evidence of their precarious journey (Fig. 9).

This post has been erratic, starting out looking at a glacial terrain (Figs. 1-4), then taking a detour into igneous petrology, the chemistry of magmas, and mineralogy, with a little plate tectonics thrown in. That’s how geology is; everything is an ongoing process that never quite reaches equilibrium (e.g. the phenocrysts in Fig. 8), and the journey is unending.
I didn’t investigate the origin of the syenite boulders examined in this post, but (if memory serves) they match the mineralogy of intrusive rocks from Sweden, which is a long way from Usedom.
Stockholm is about 500 miles north of Usedom…
Eidersperrwerk: Keeping Out the North Sea
My last post explored the mud flats bordering the North Sea in northern Germany, where we found conflicting methods applied to control and protect the levee system. This post investigates more aggressive measures implemented at the mouth of the Eider River. We will briefly look at the Eidersperrwerk, a gate system designed to control both storm surge incursion up the Eider, and river outflow
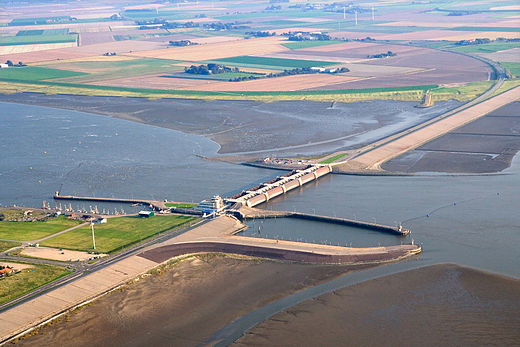
We will focus on the seaward mud flats in this post. Let’s take a look at the south side of the river first (upper-right of Fig. 1).
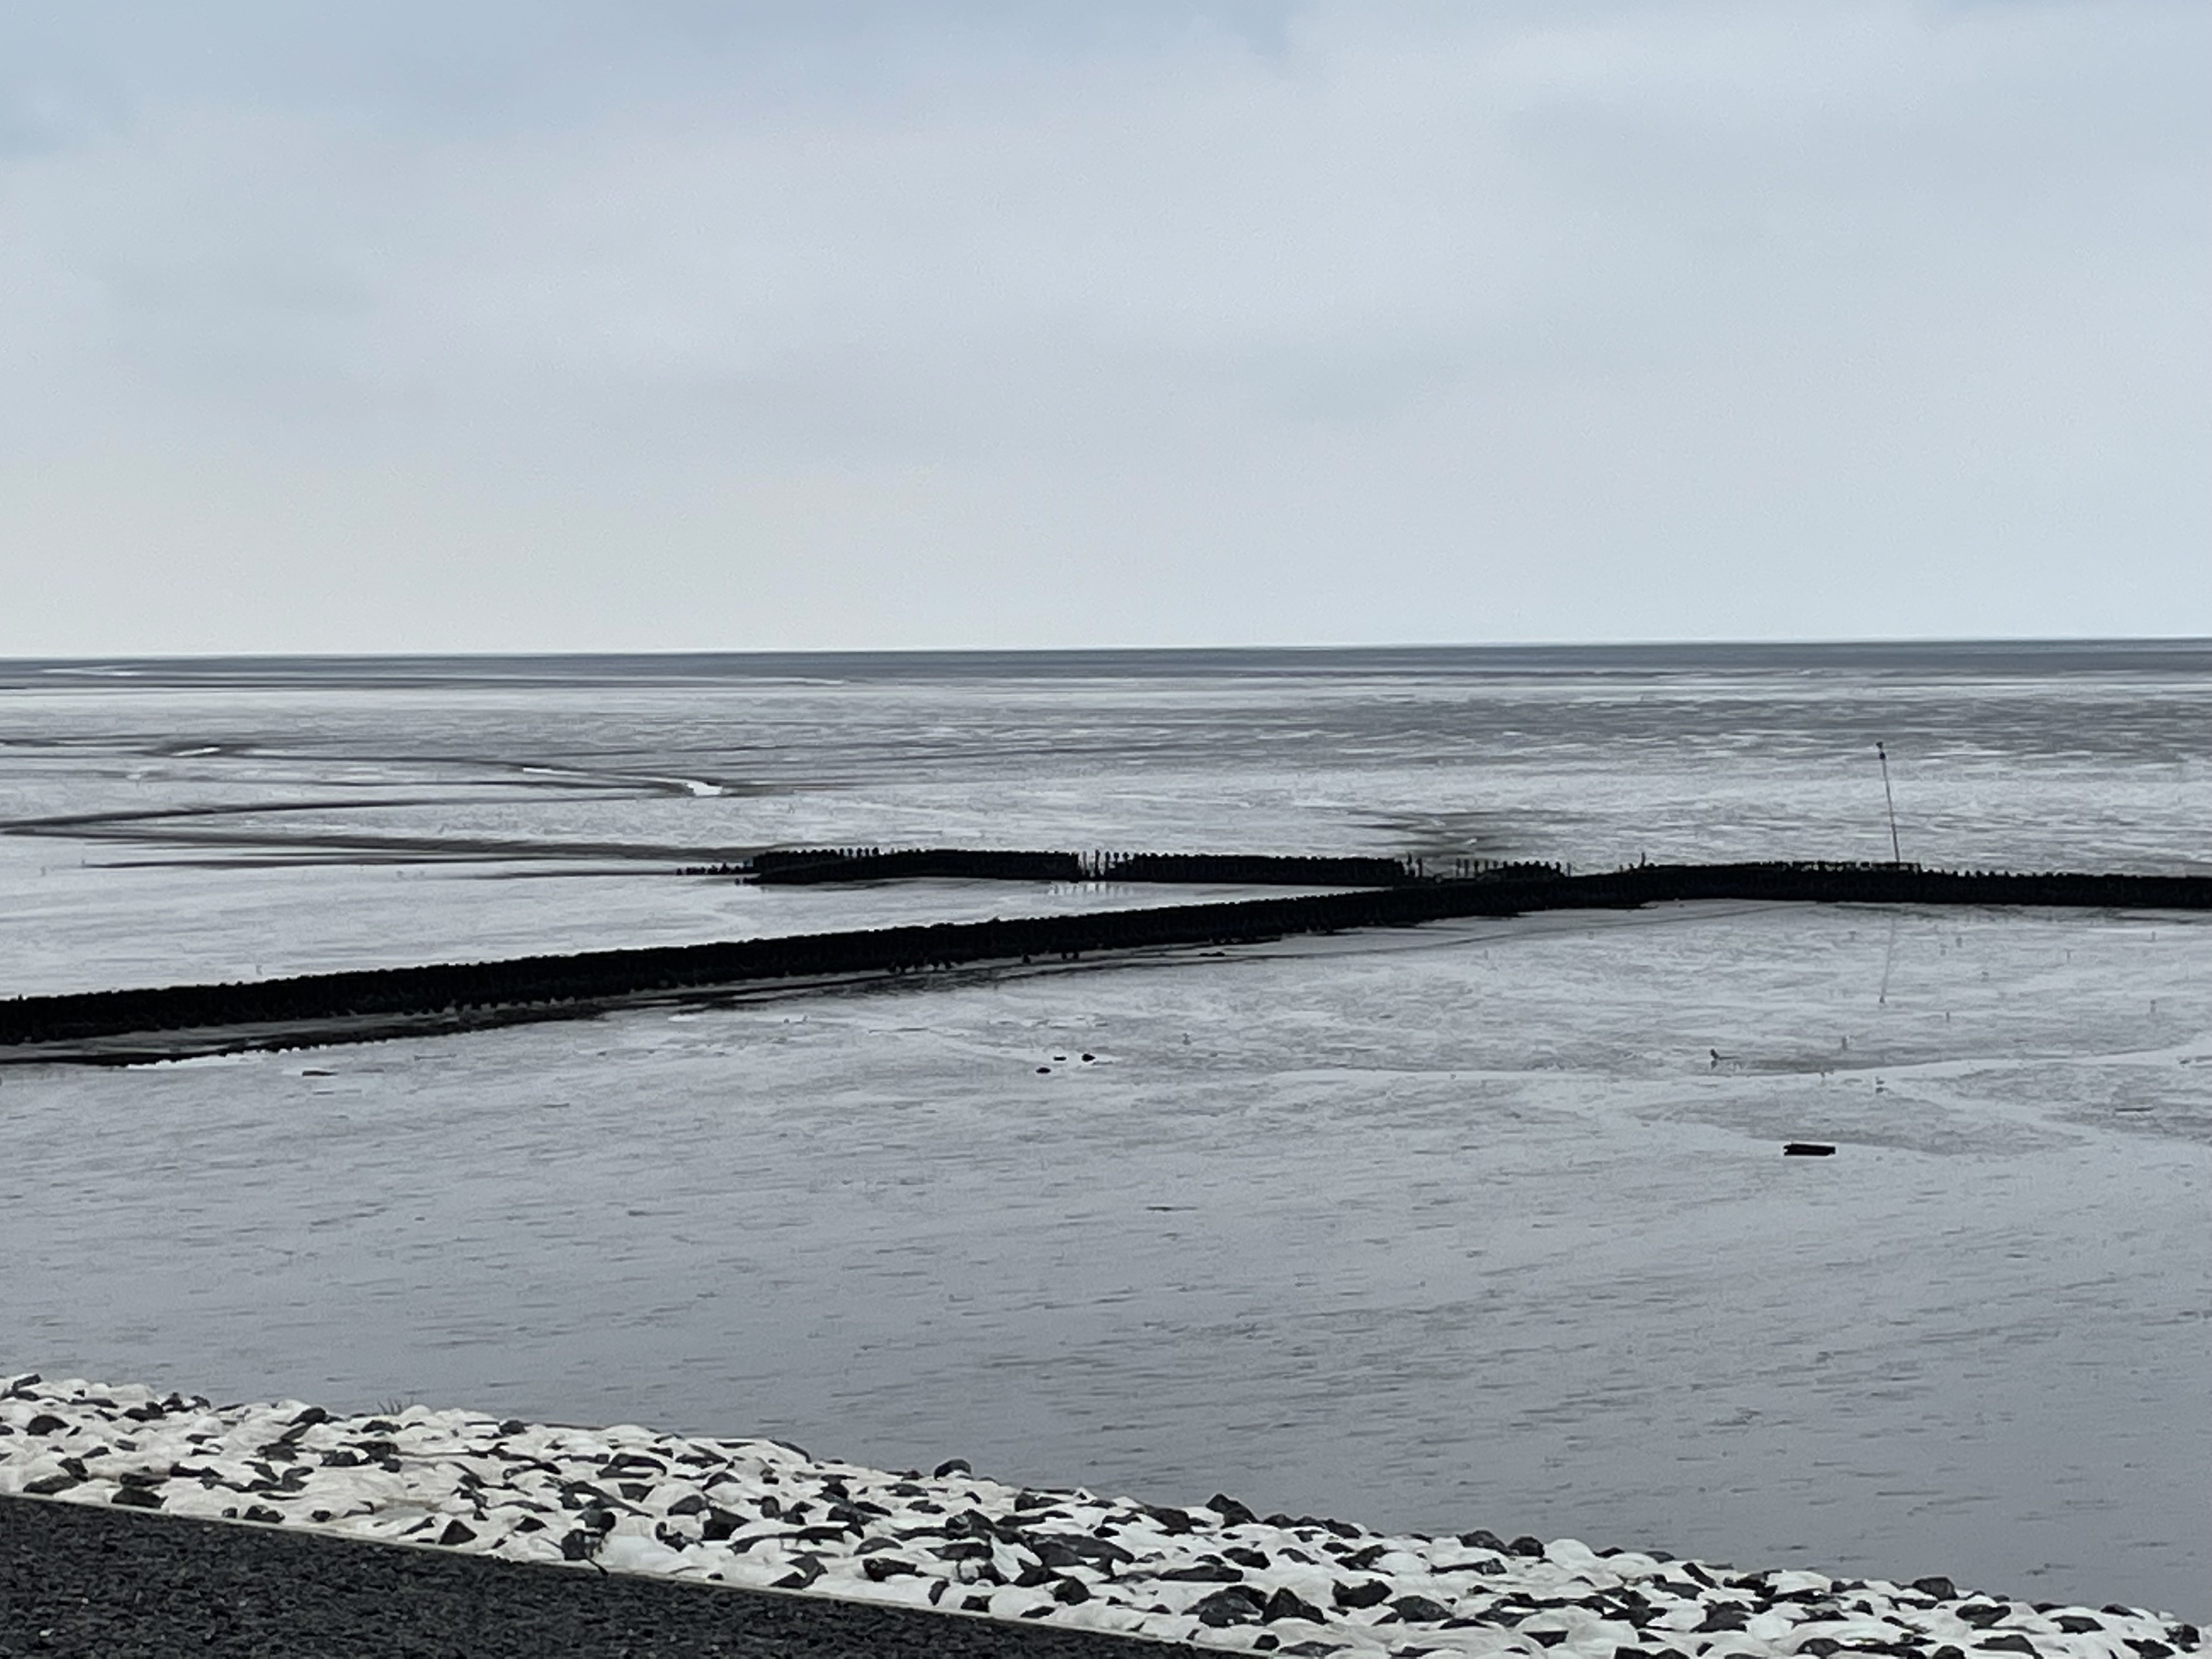


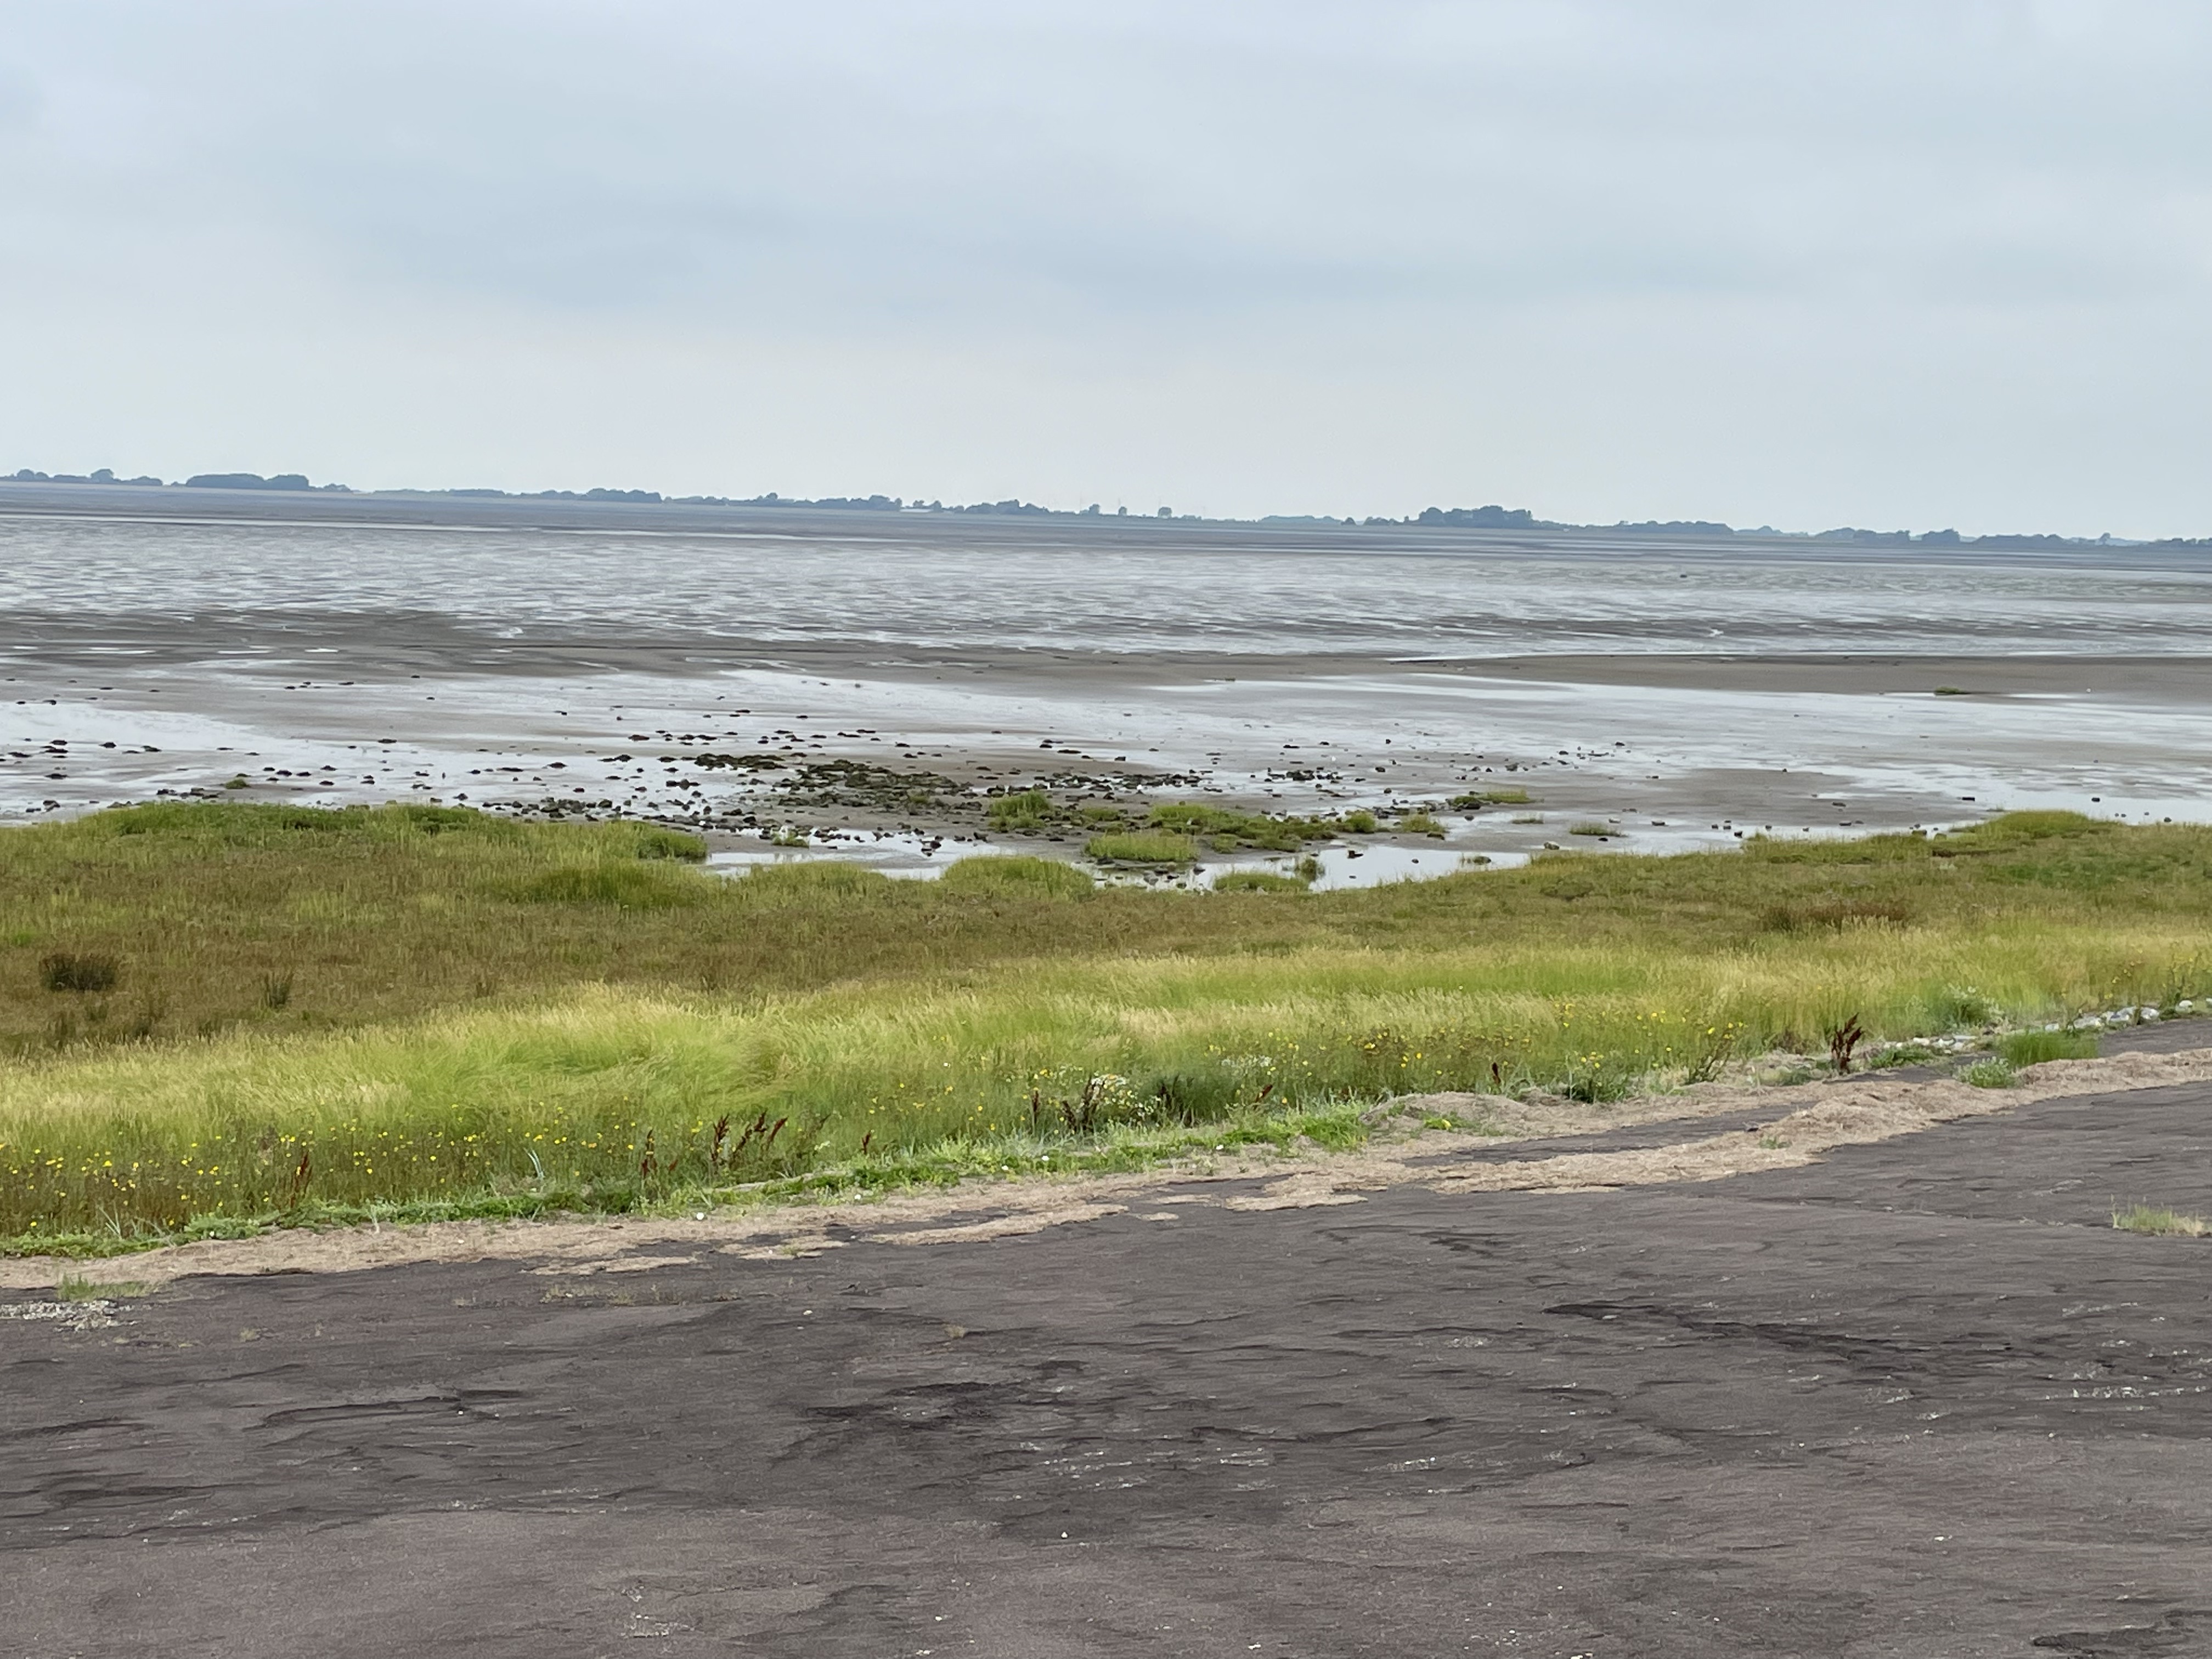

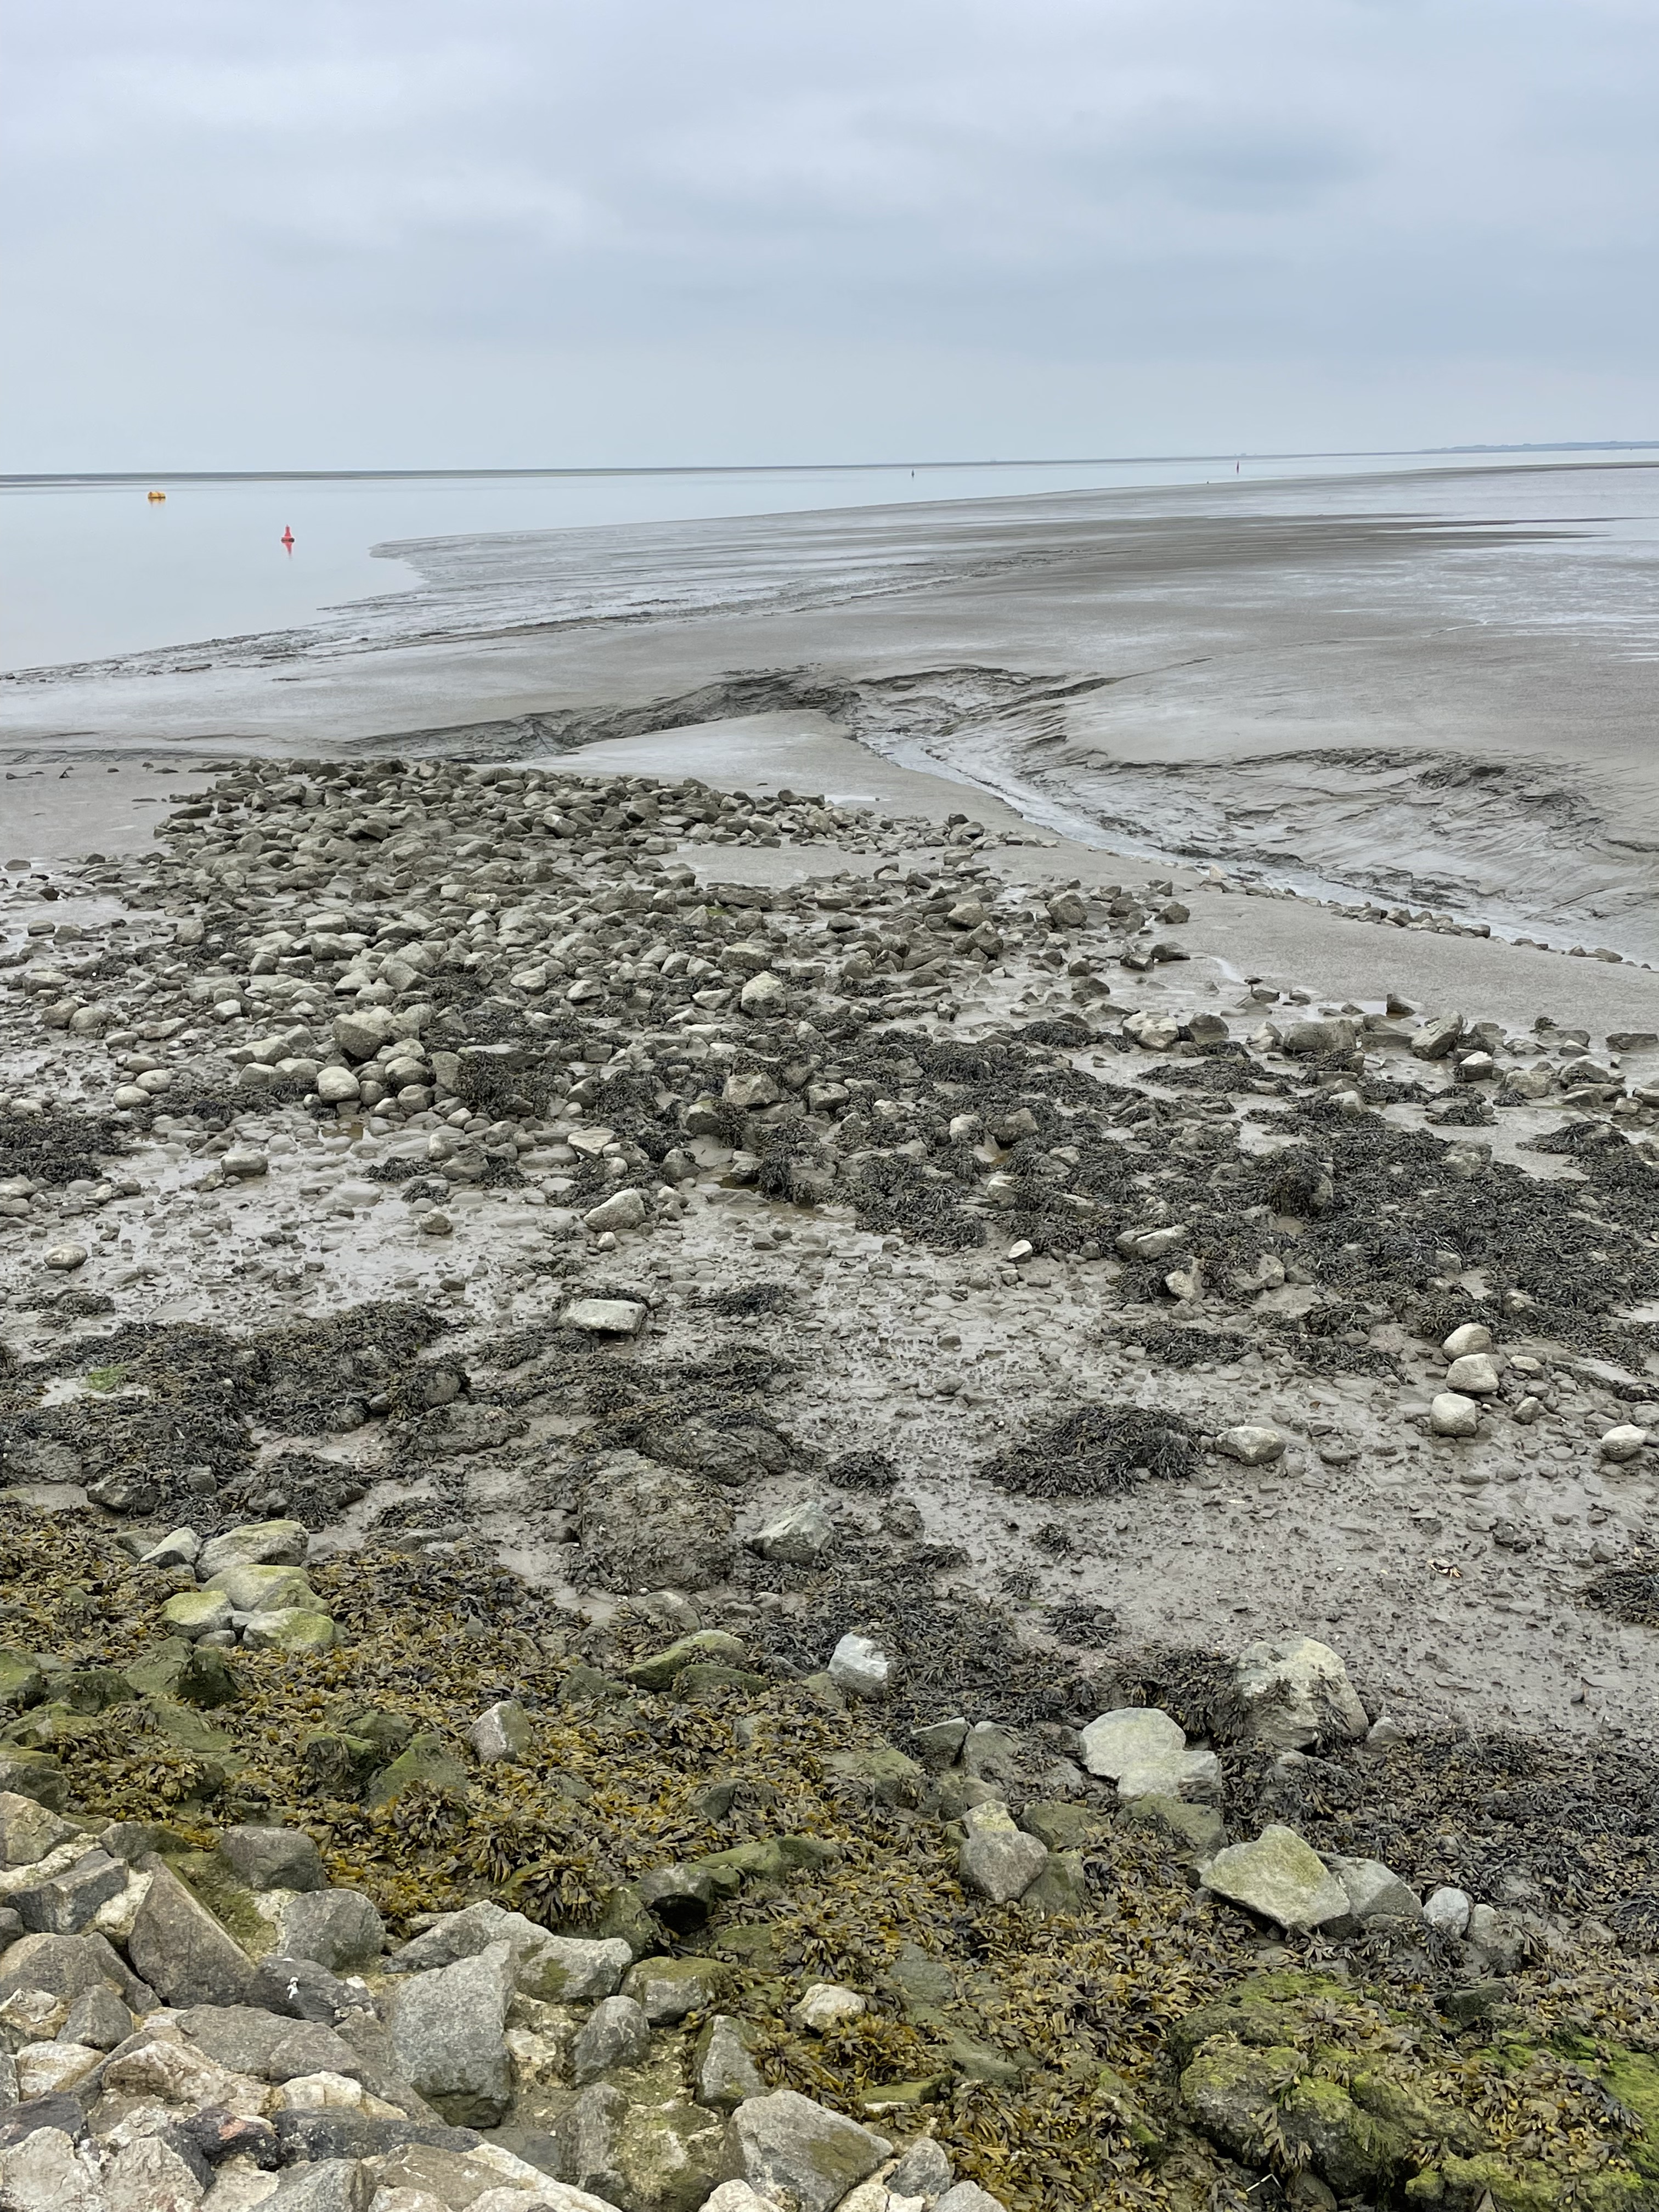
Comparing Fig. 1 to Figs. 2 and 5-8, we can see the effects of years (probably decades), during which interval the northern margin of the river mouth filled with sediment and grass was established (Fig. 5). Subsequently, it seems that erosion removed some of this soil and grass (Fig. 6). Meanwhile, storms have been slowly wearing away the boulders armoring the base of the levee (Fig. 8) and a semipermanent fair-weather berm was constructed (compare Figs. 1 and 7).
In summary, something appears to have changed in the dynamic environment around the mouth of the Eider. It should come as no surprise that constructing a gate system and cutting off a major sediment supply for at least half the time had dramatic effects on the nearshore. Mud flats are very sensitive to sediment supply, and it could have been either reduced alongshore transport from the north, or the almost-complete denial of rive-borne mud that led to the current situation.
Some scientists propose that storminess varies on many scales, from decadal to millennial as climate fluctuates…
Coastal Restoration on the North Sea
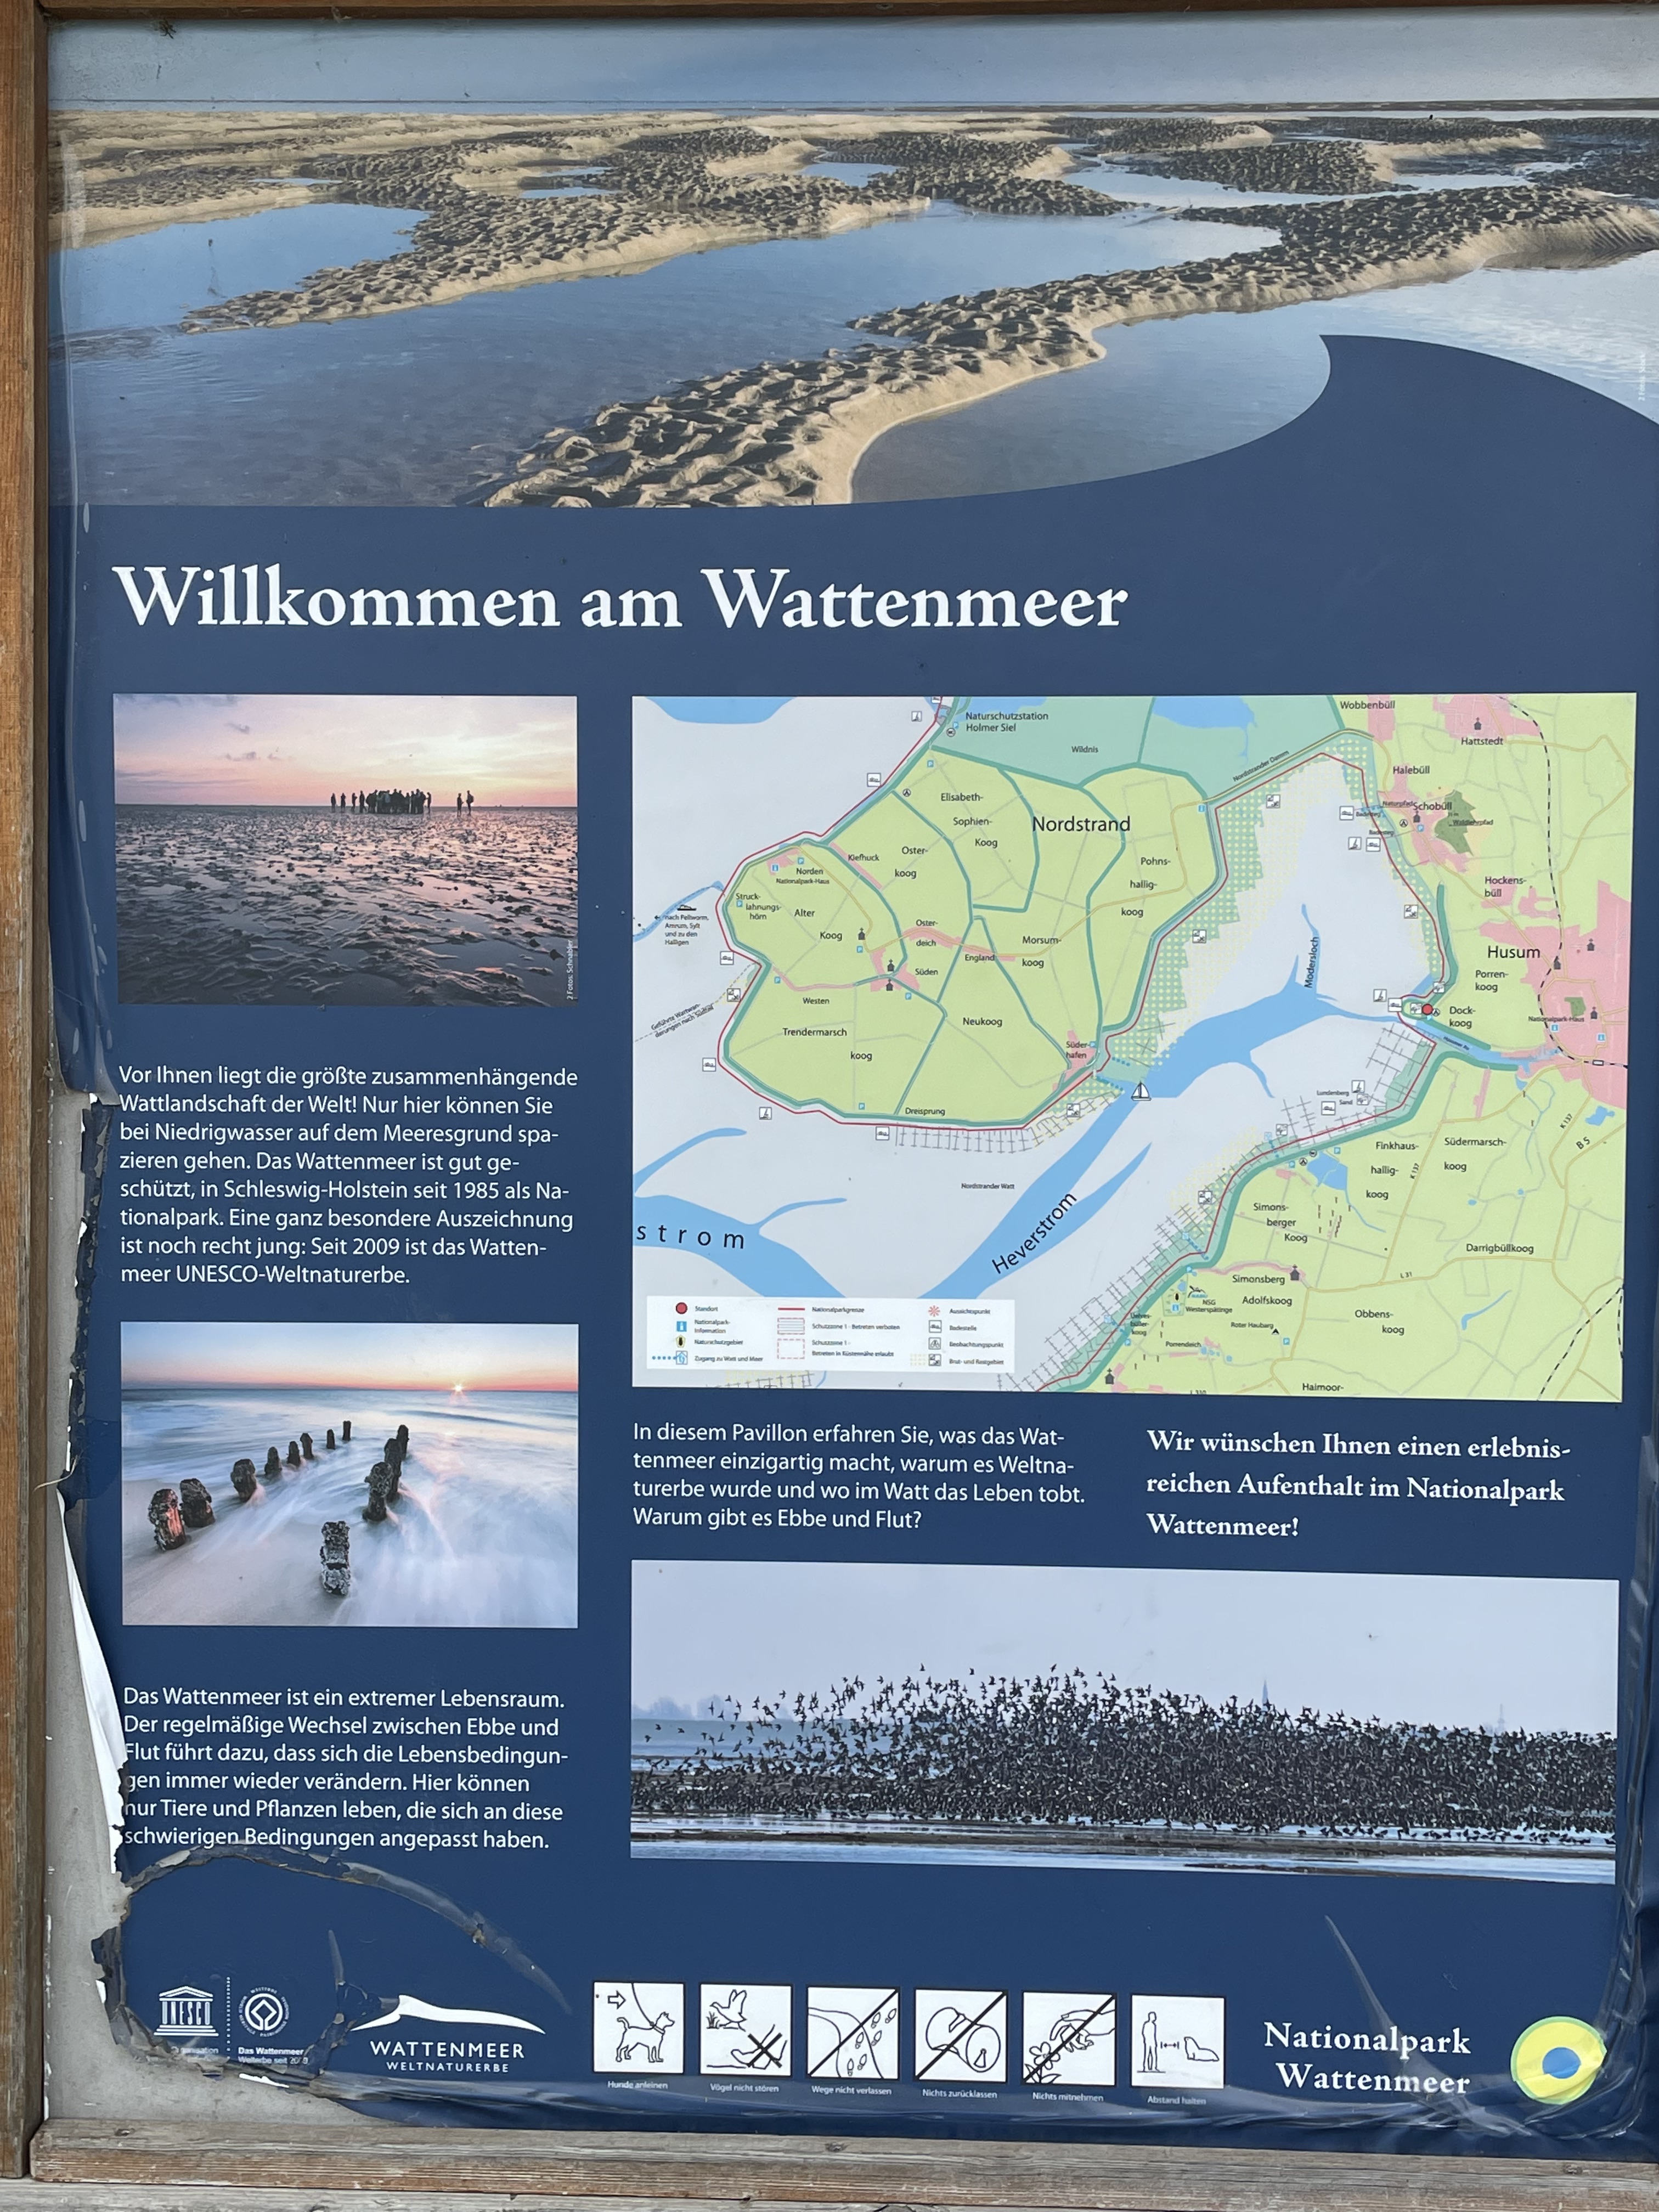
Today’s post takes me to the North Sea coast of Germany, the city of Husum, and to one of the famous mud flats from the region. Rivers running from the Alps drain Germany, transporting mud (silt and clay) to the north coast, where it is transported along the coast and stirred around by strong tidal flows. We are going to look at efforts to stop dramatic erosion caused by a reduction of sediment input, because of dams and coastal construction, leading to a serious threat to the levee protecting Husum from the North Sea (Fig. 2).
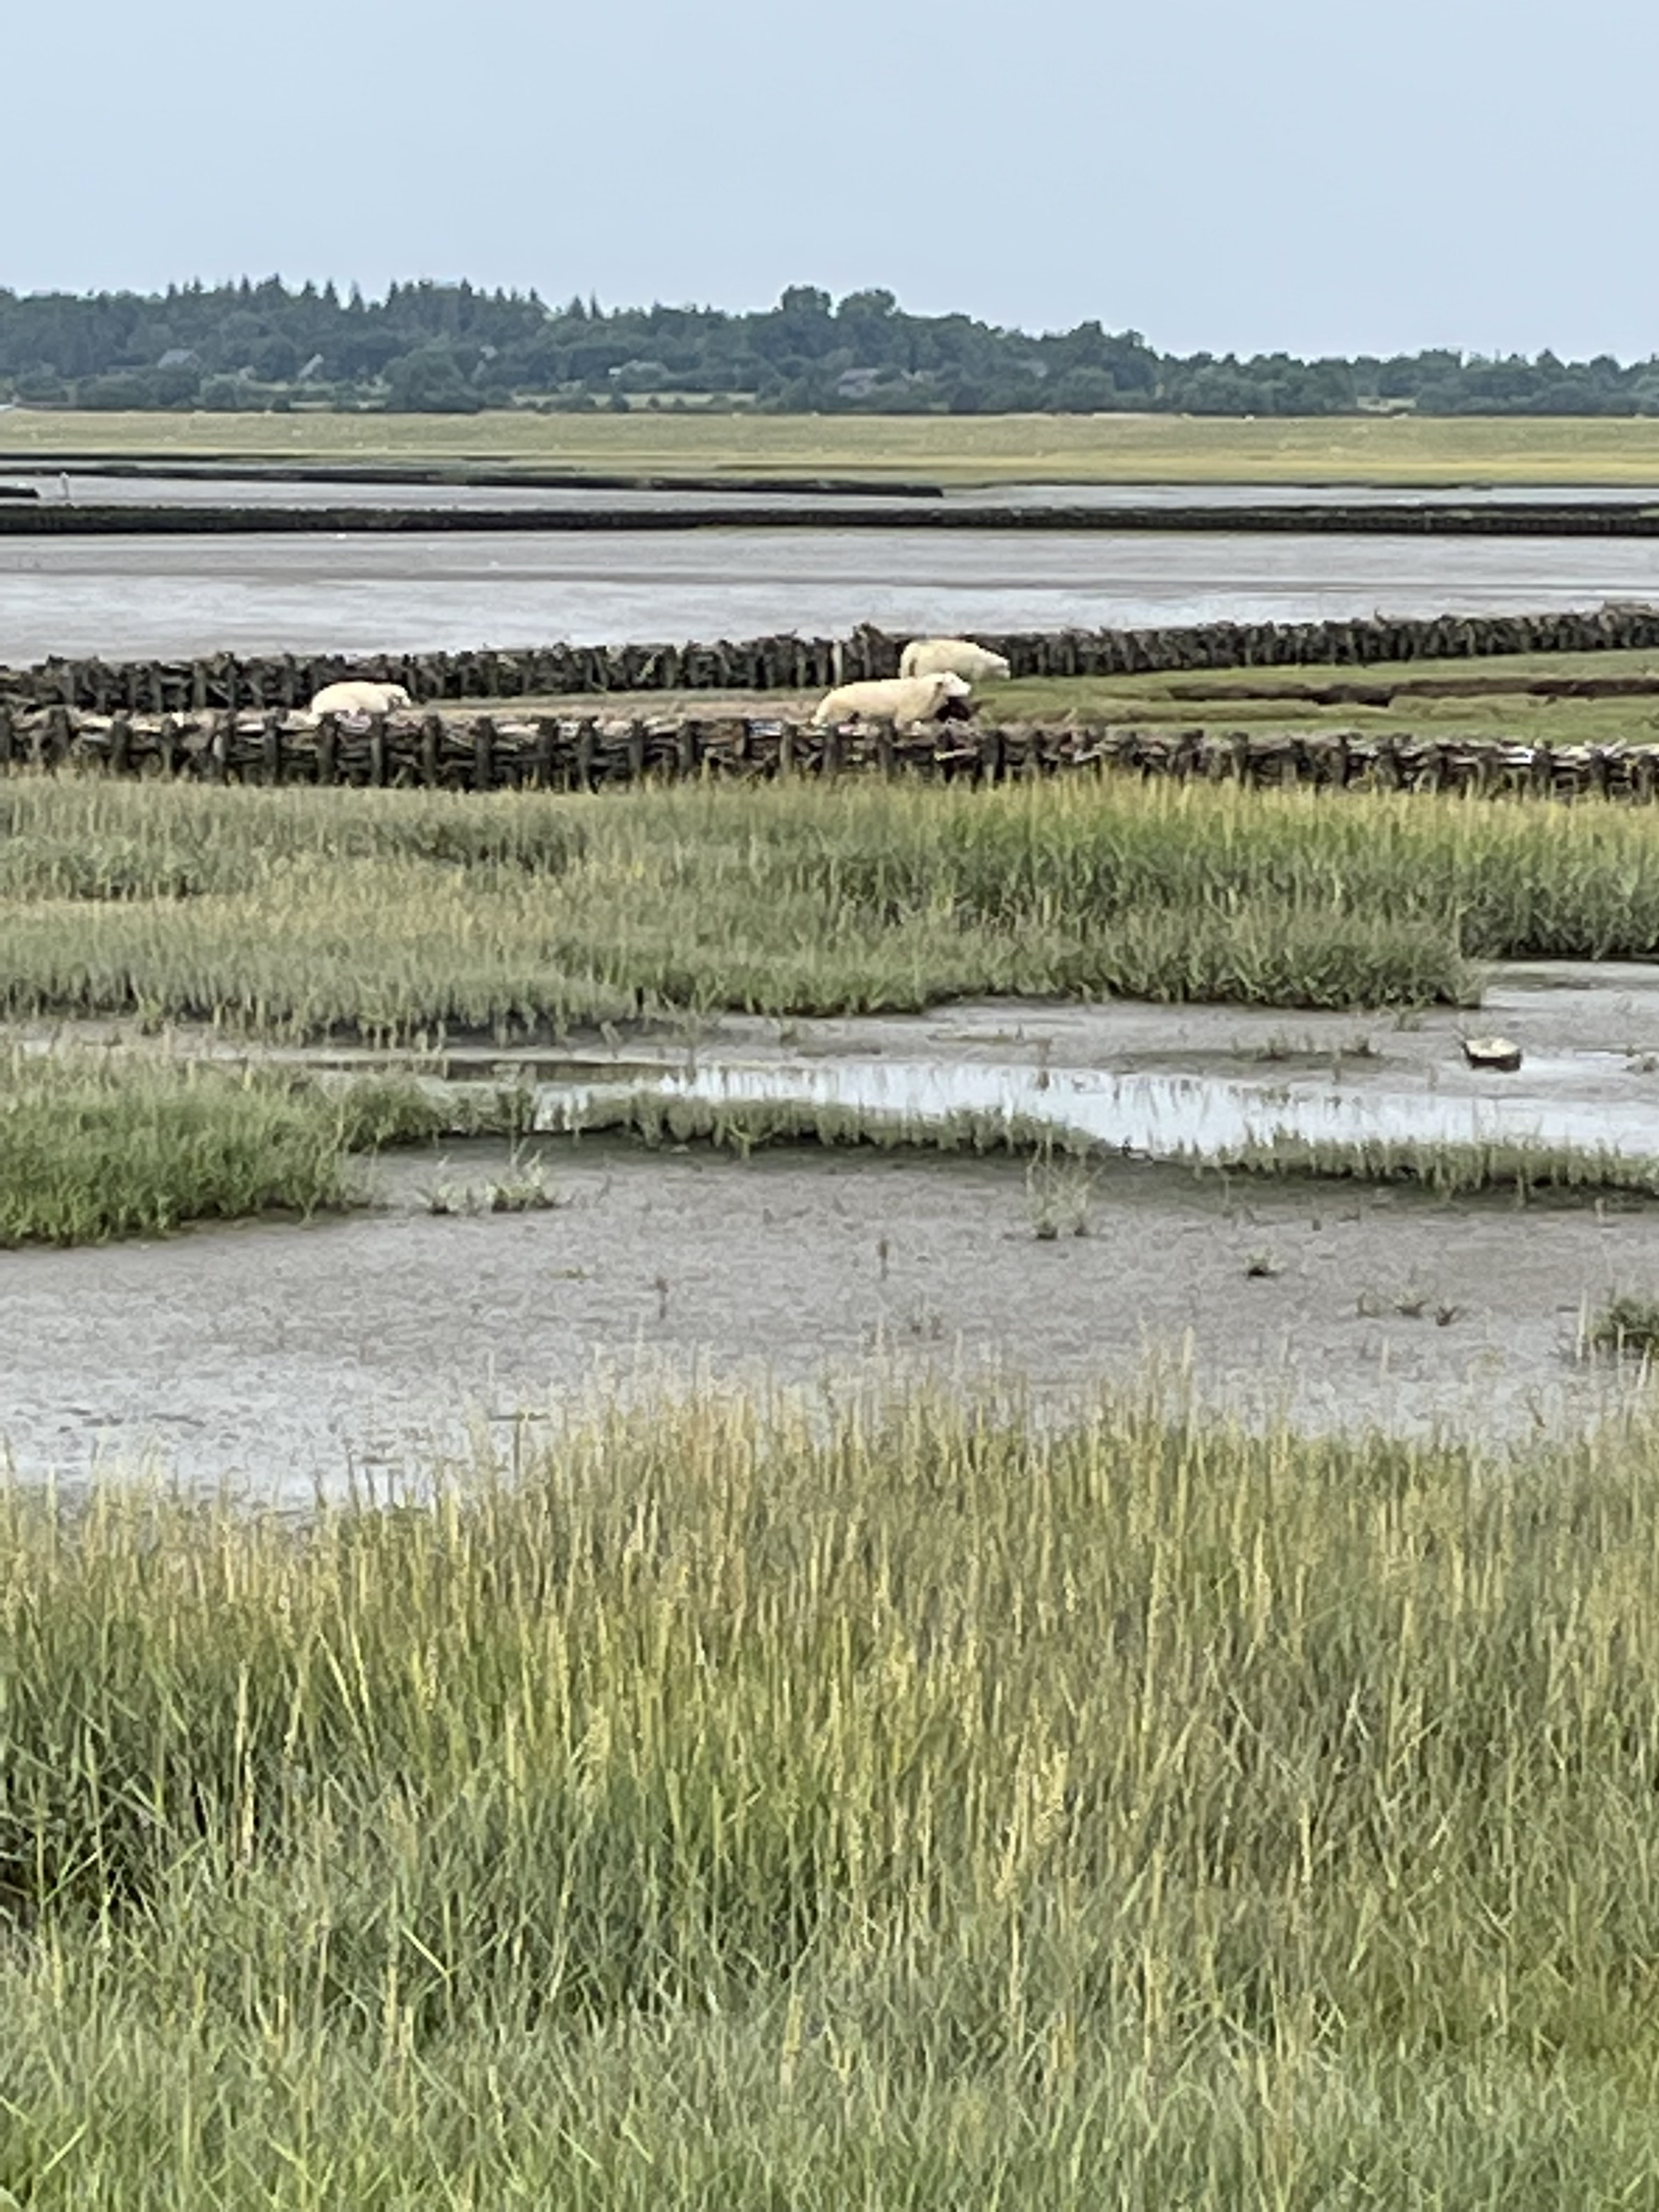
The mud flats schematically shown in Fig. 1 are covered with fence-like structures designed to catch mud brought in the the high tide (Fig. 3).

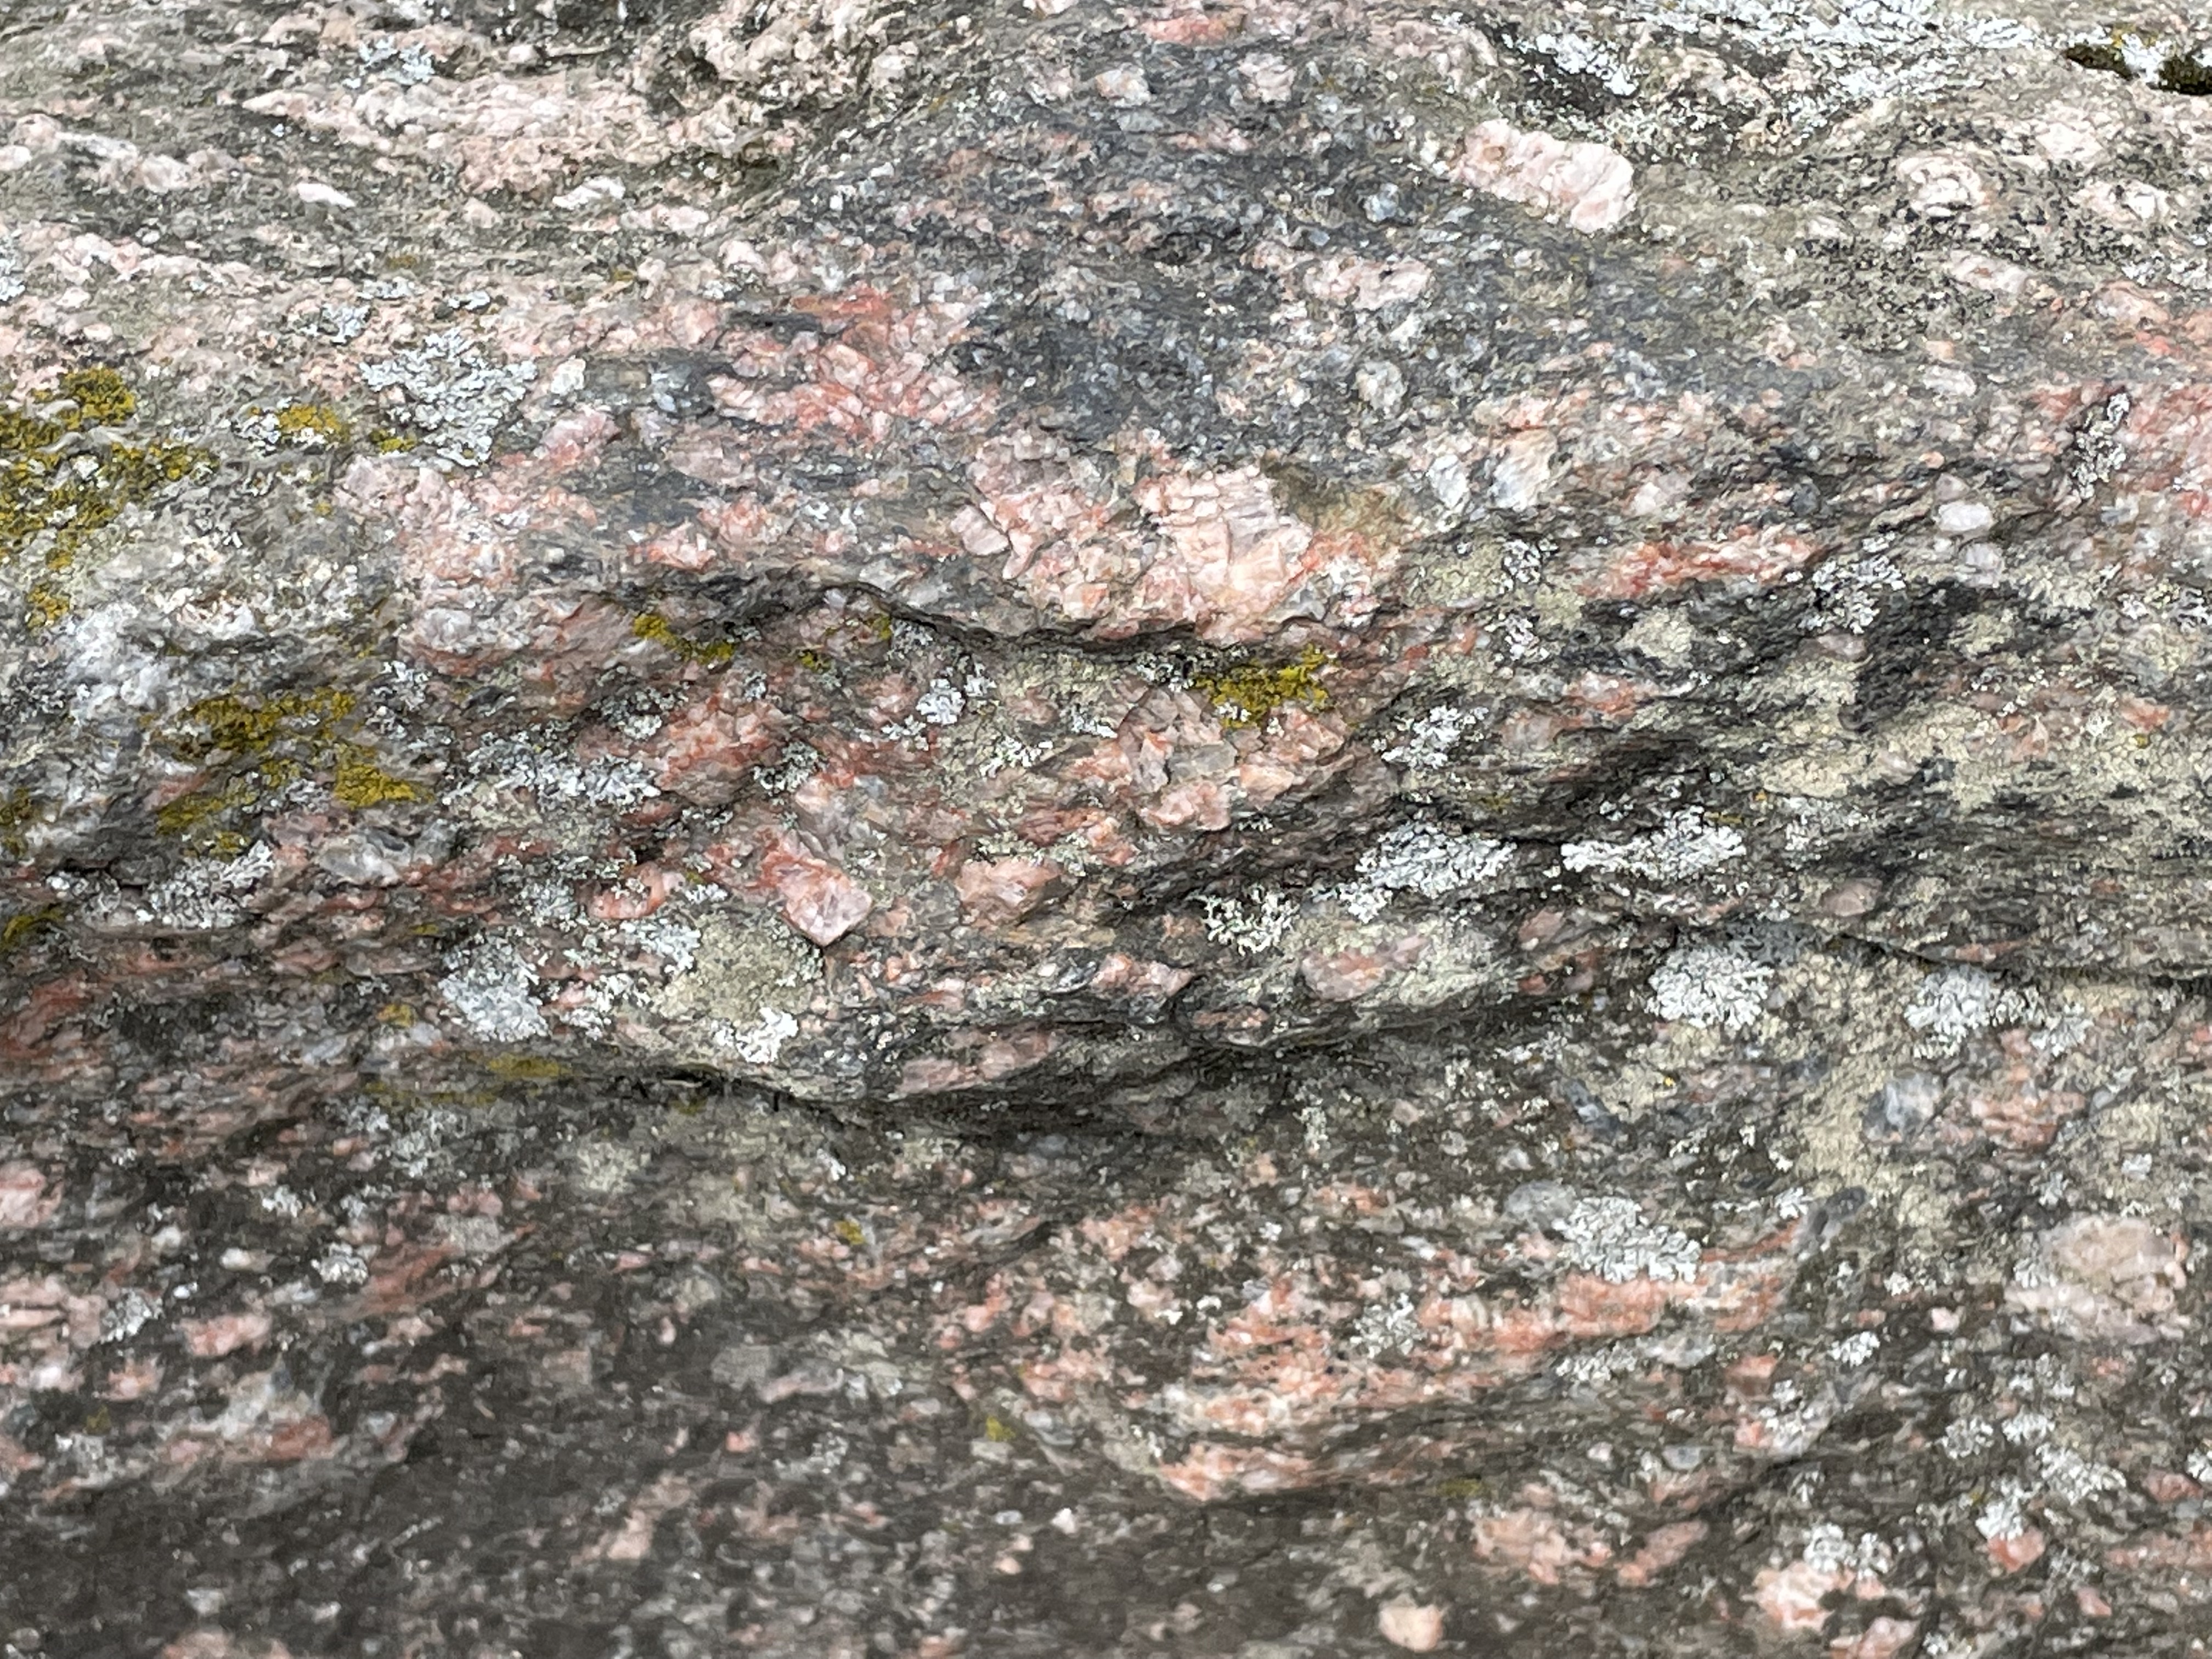
A quick look at the past. This area was covered by glaciers that filled the North Sea and transported rocks from Sweden to the north. These glacial erratics are rounded and scattered around the land in a random manner (thus the name). We found one used as street decoration in Husum (Fig. 4).
In addition to boulders transported during the ice ages (less than a million years old), there are remnants of sandy sediment from the Quaternary, before the area was overwhelmed by mud (Fig. 5).
The result of the sediment retention project can be seen in Fig. 6.

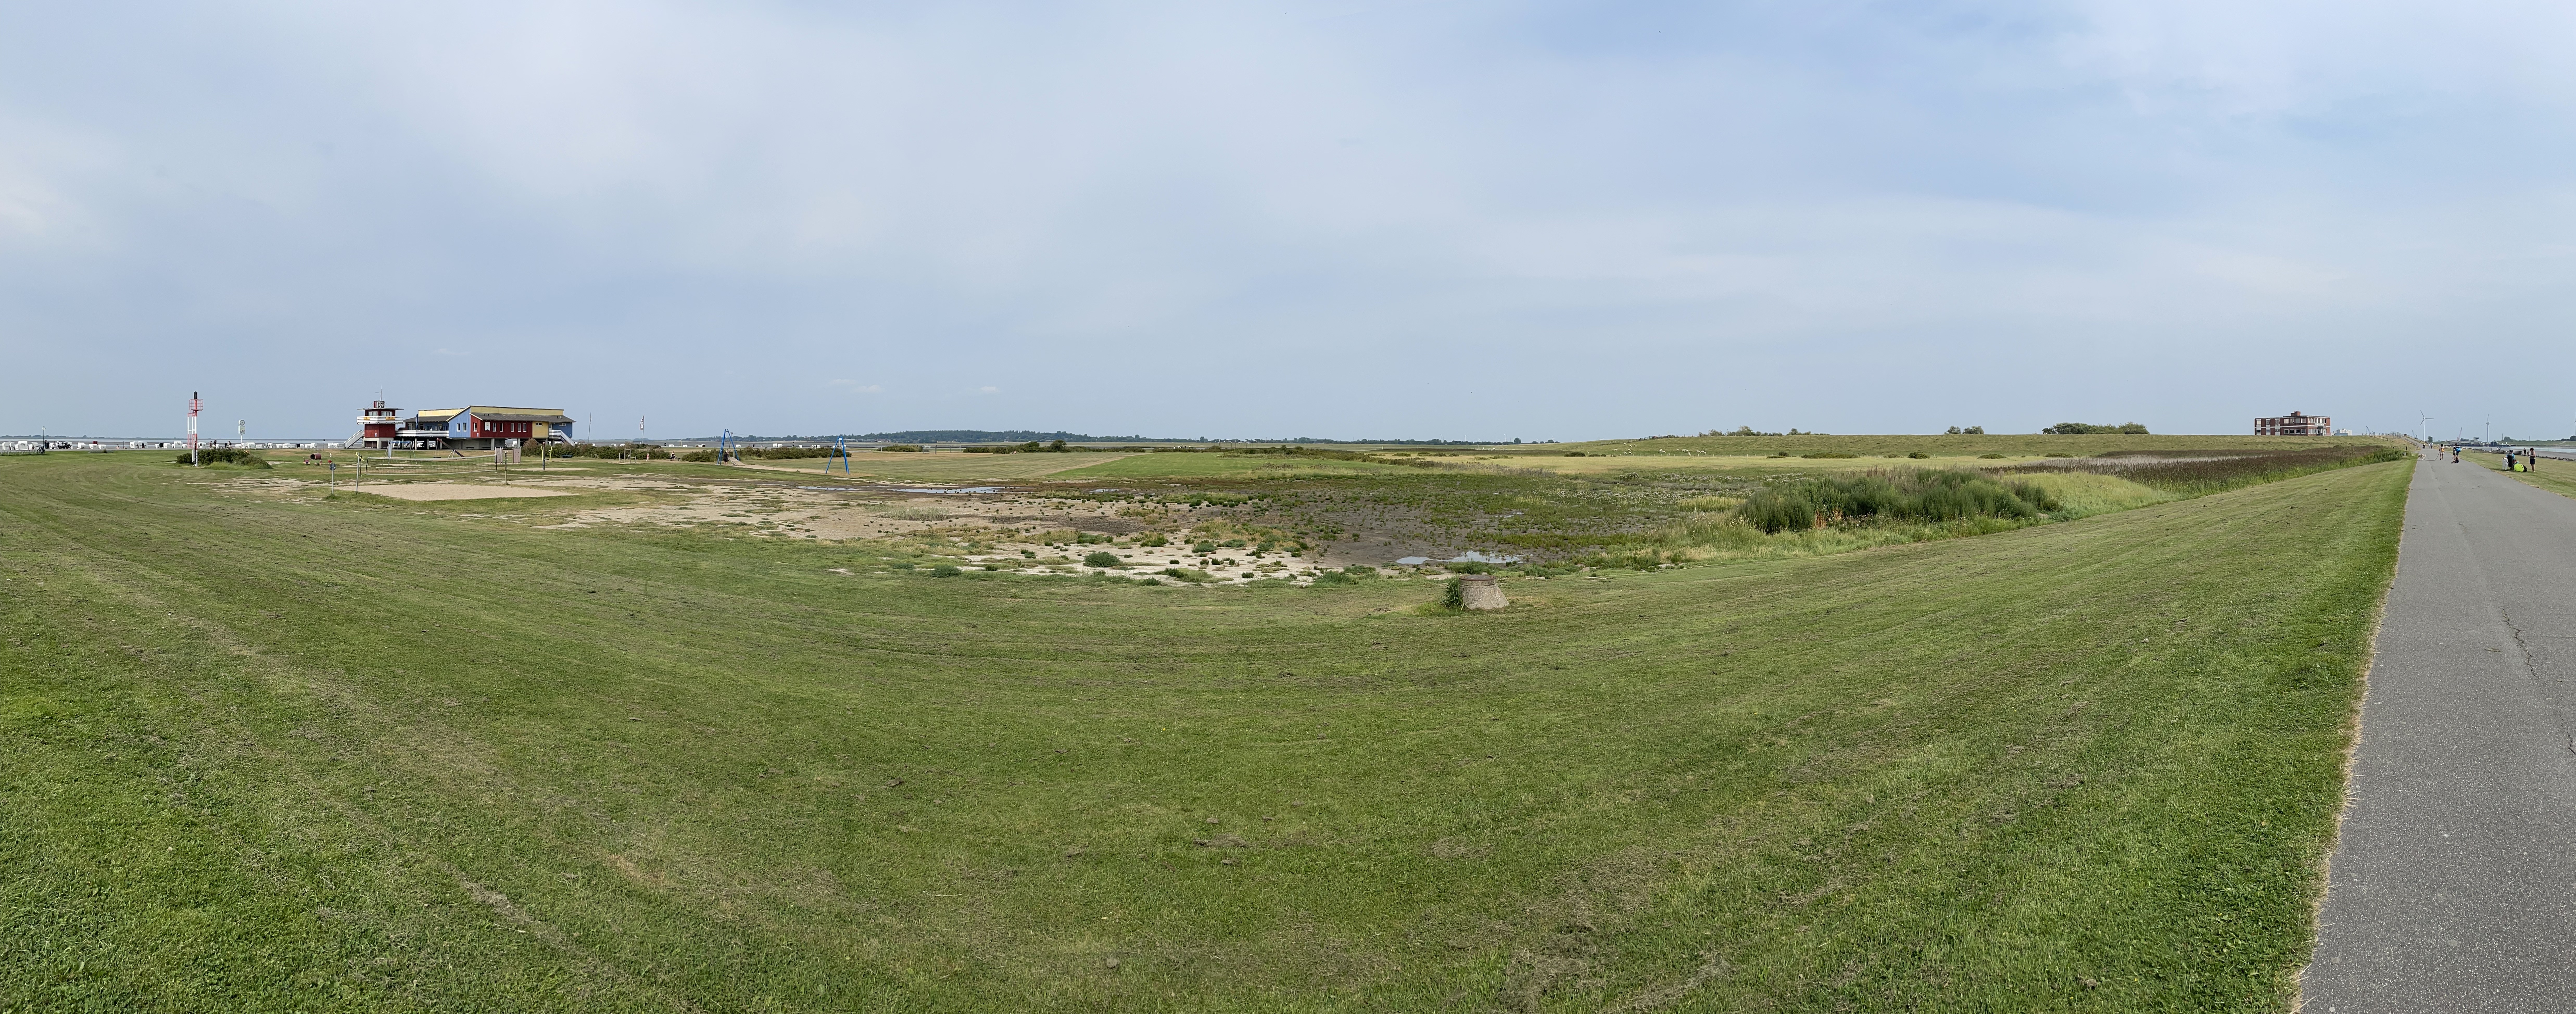
This are represents an attempt to reconcile the problem of coastal development (the port of Husum ships out grain) and the protection from storm waves provided by a wide mud flat (which dissipates wave energy). Another issue is the encroachment of sheep grazing, which appears to be legal (there are fences and gates, etc). And then there is entertainment; this is a popular swimming location during high tide. Not to mention environmental degradation and fish hatcheries. Several attempts at mixing these applications can be seen in the hardened and dredged channel leading to the port (Fig.7), and buried groins which were apparently intended to keep the shipping channel open (Fig. 8).
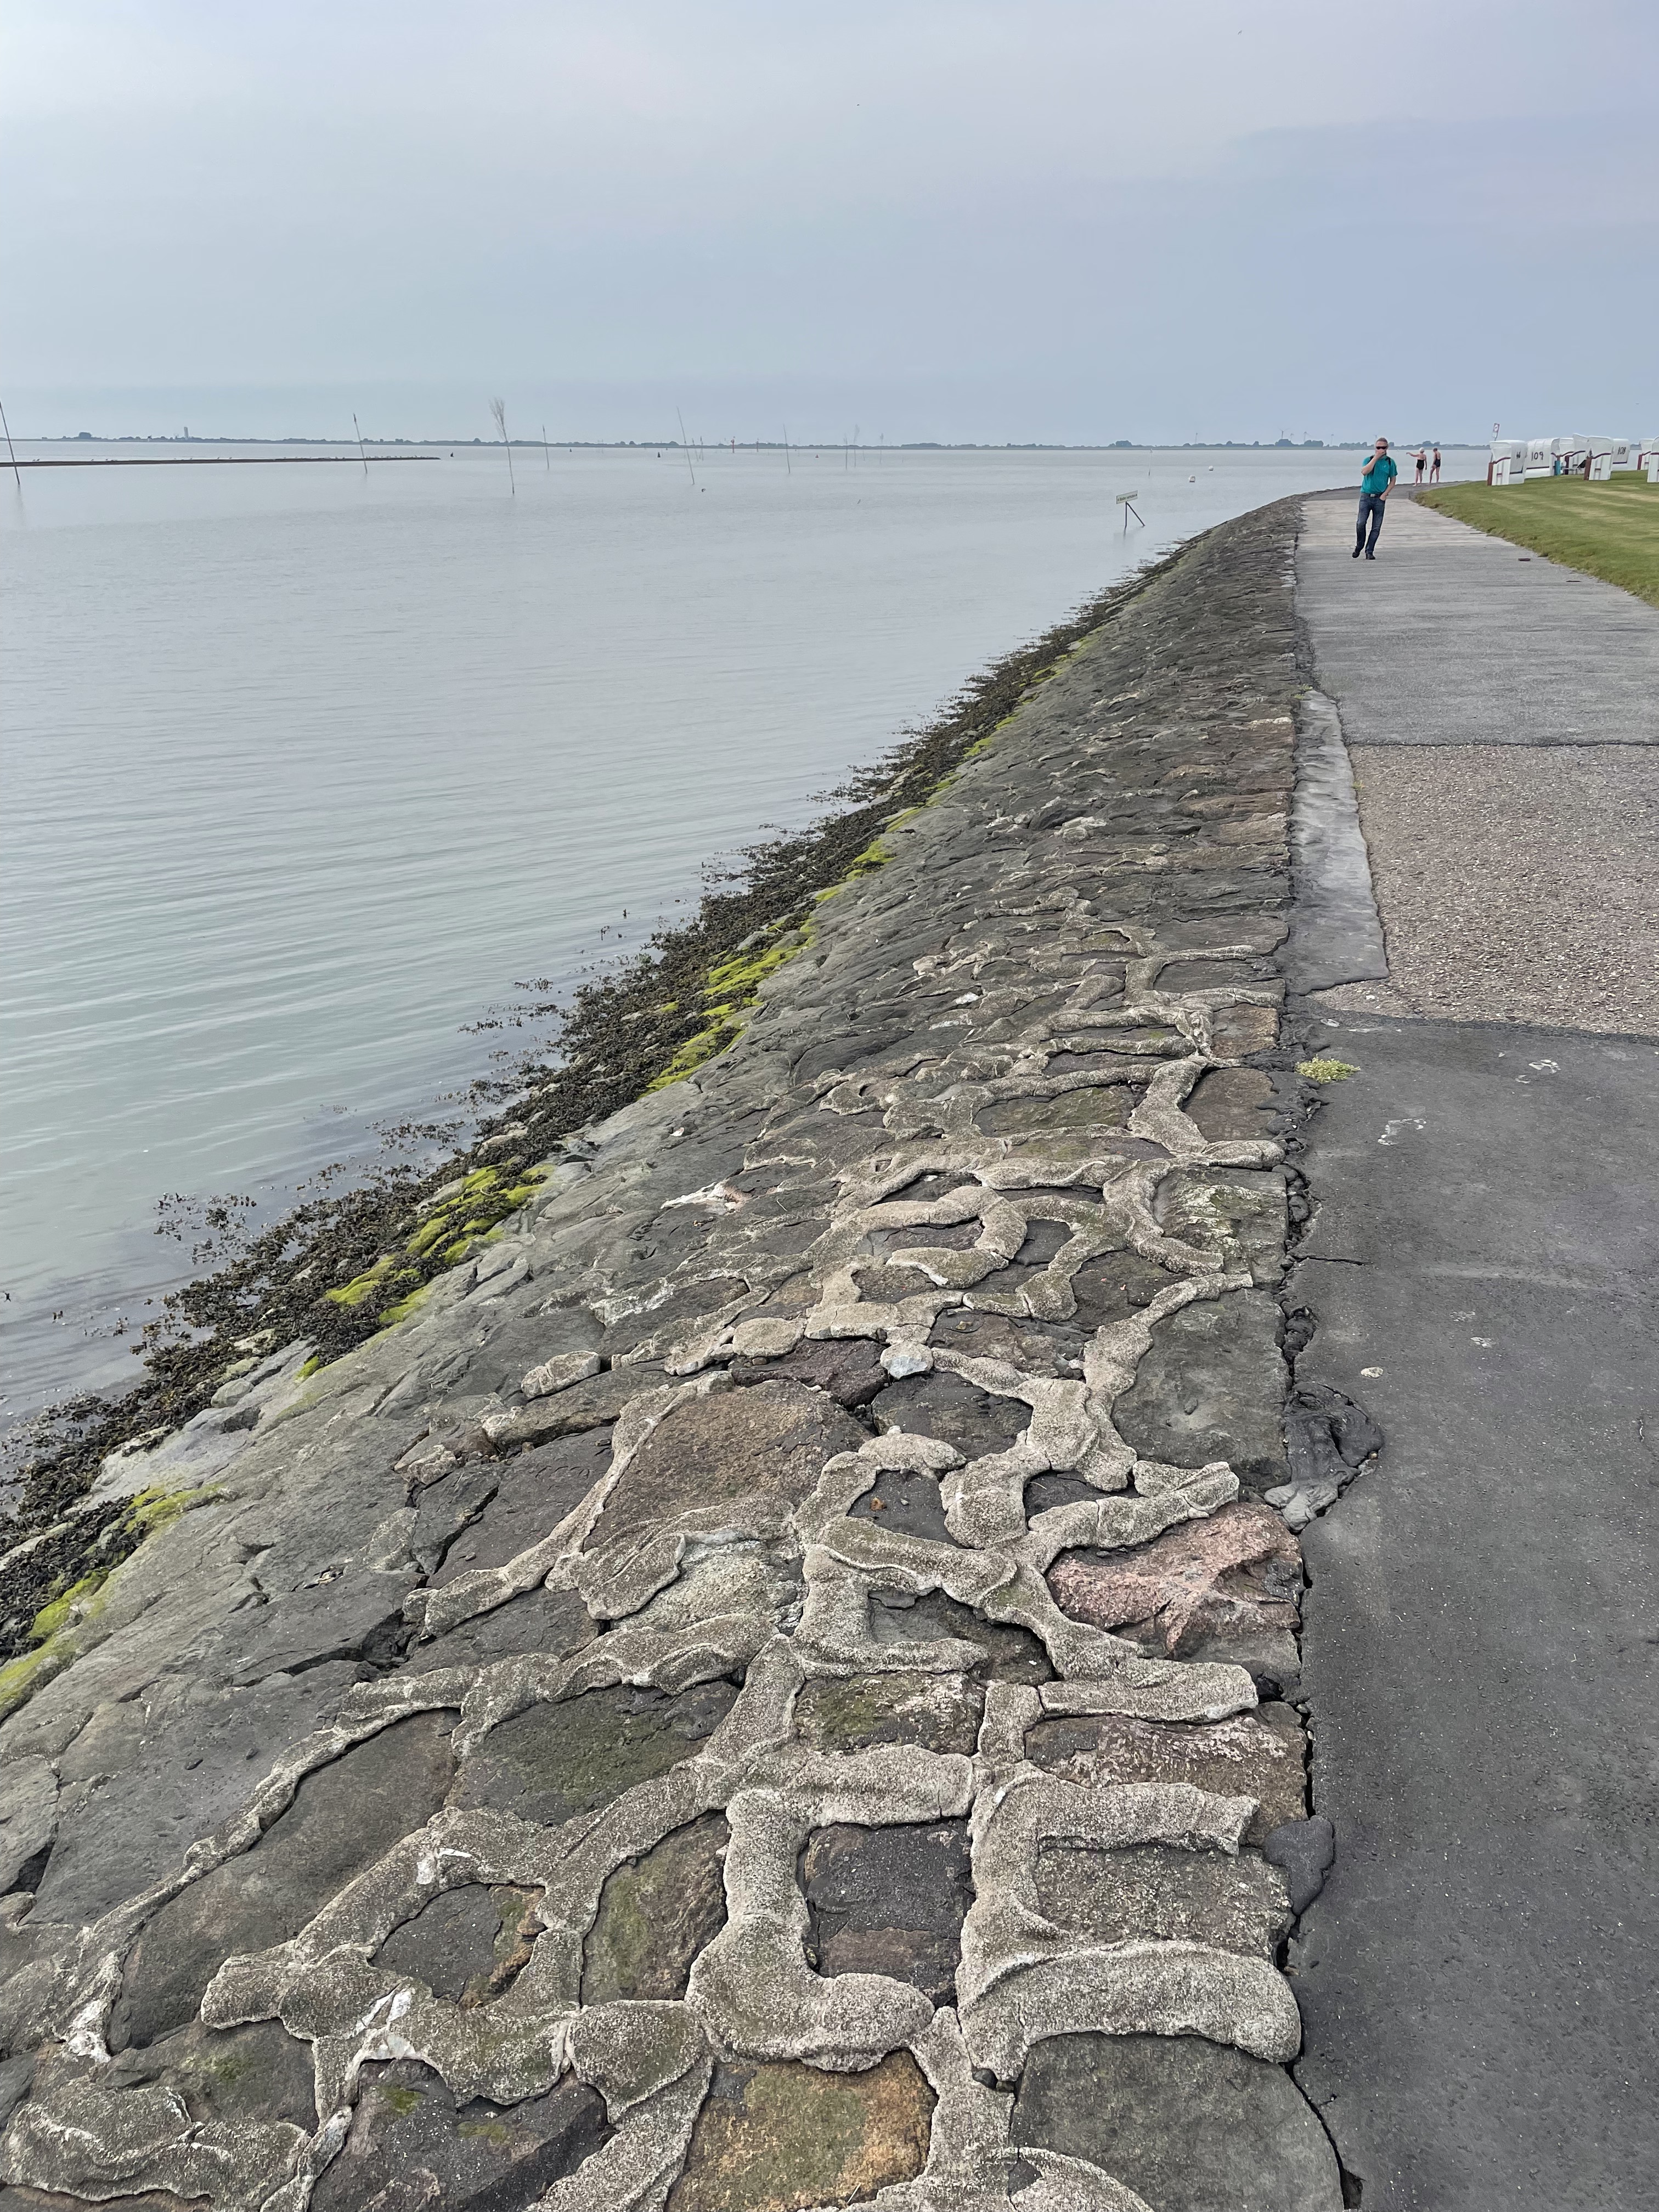

It is difficult to reconcile the many uses the coastline is required to fulfill. This trip revealed that it is unreasonable to mix methods designed to preserve the status quo (Figs. 7 and 8), and those intended to change it (eg. Fig. 6), especially when these techniques are mixed (Fig. 3). A difficult decision will have to be made soon, or the levee protecting the bustling cit of Husum will be in danger of breach during a severe storm, which is becoming more common in the North Sea.
The Last Few Miles
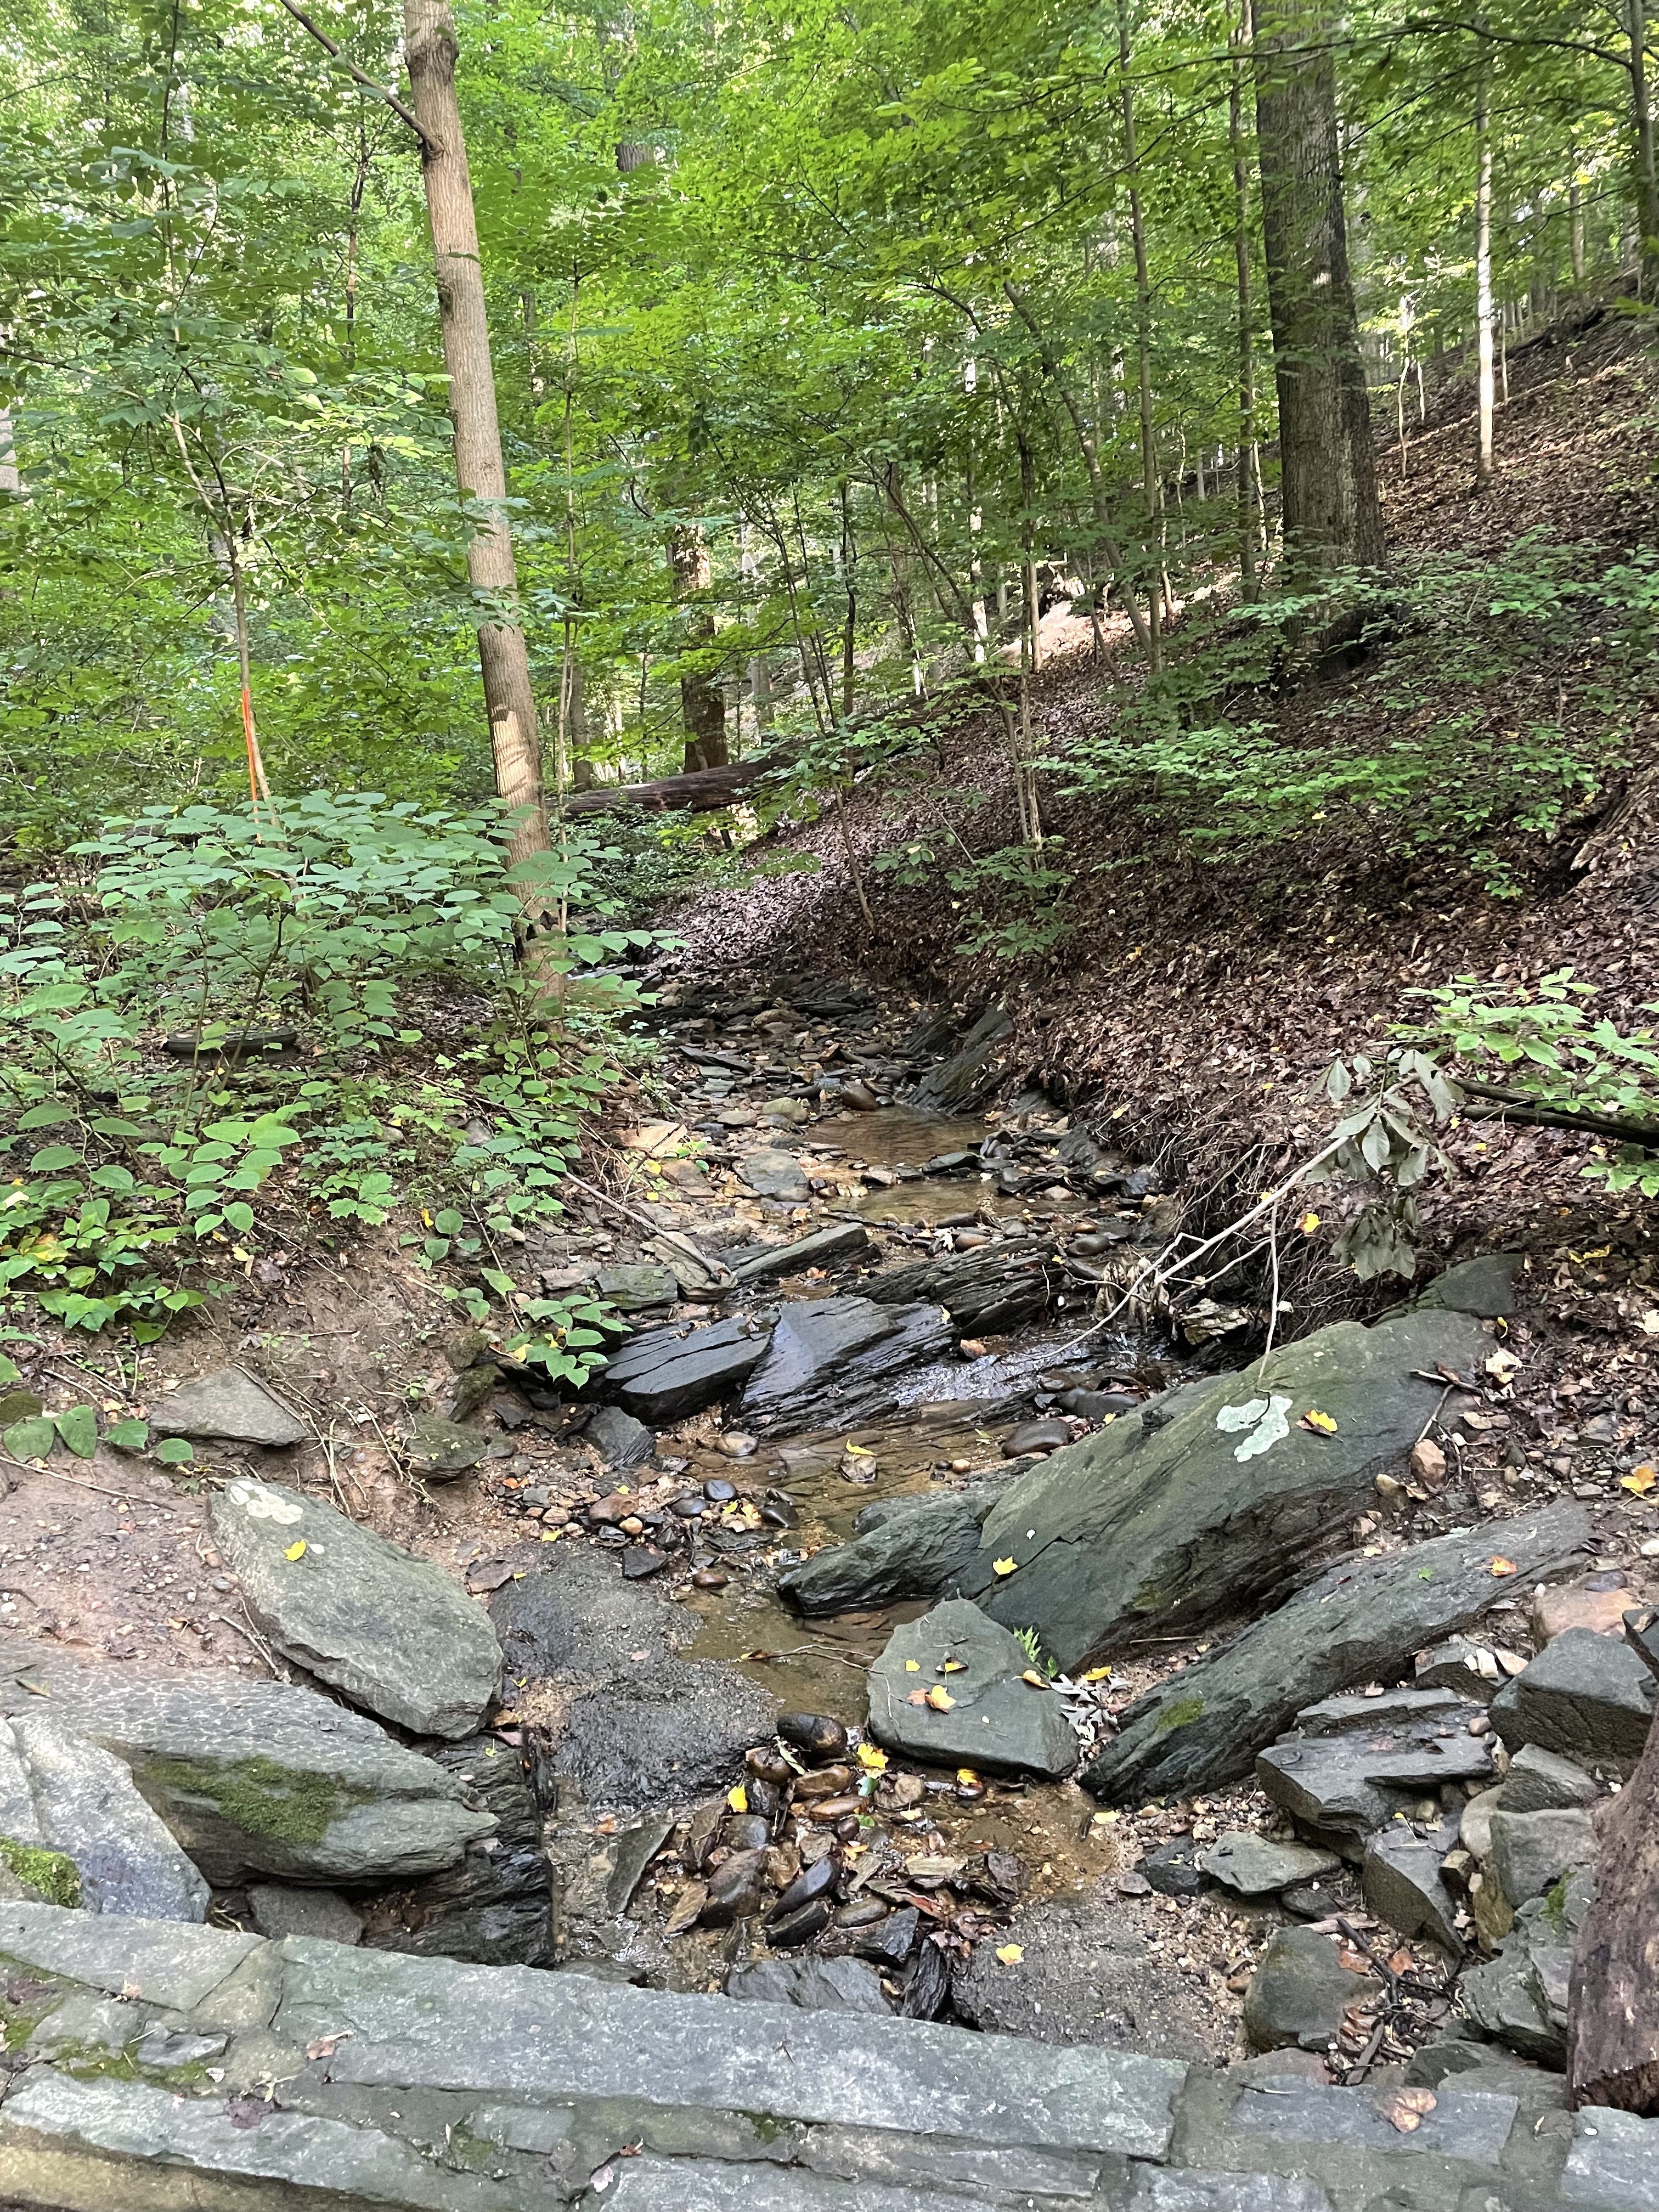
This is going to be a brief post, mostly because it is very difficult to convey what I want to communicate in photographs; the camera lens (on my iPhone) simply doesn’t capture image depth well. For example, Fig. 1 was actually pretty steep, but it looks as unintimidating as my driveway.
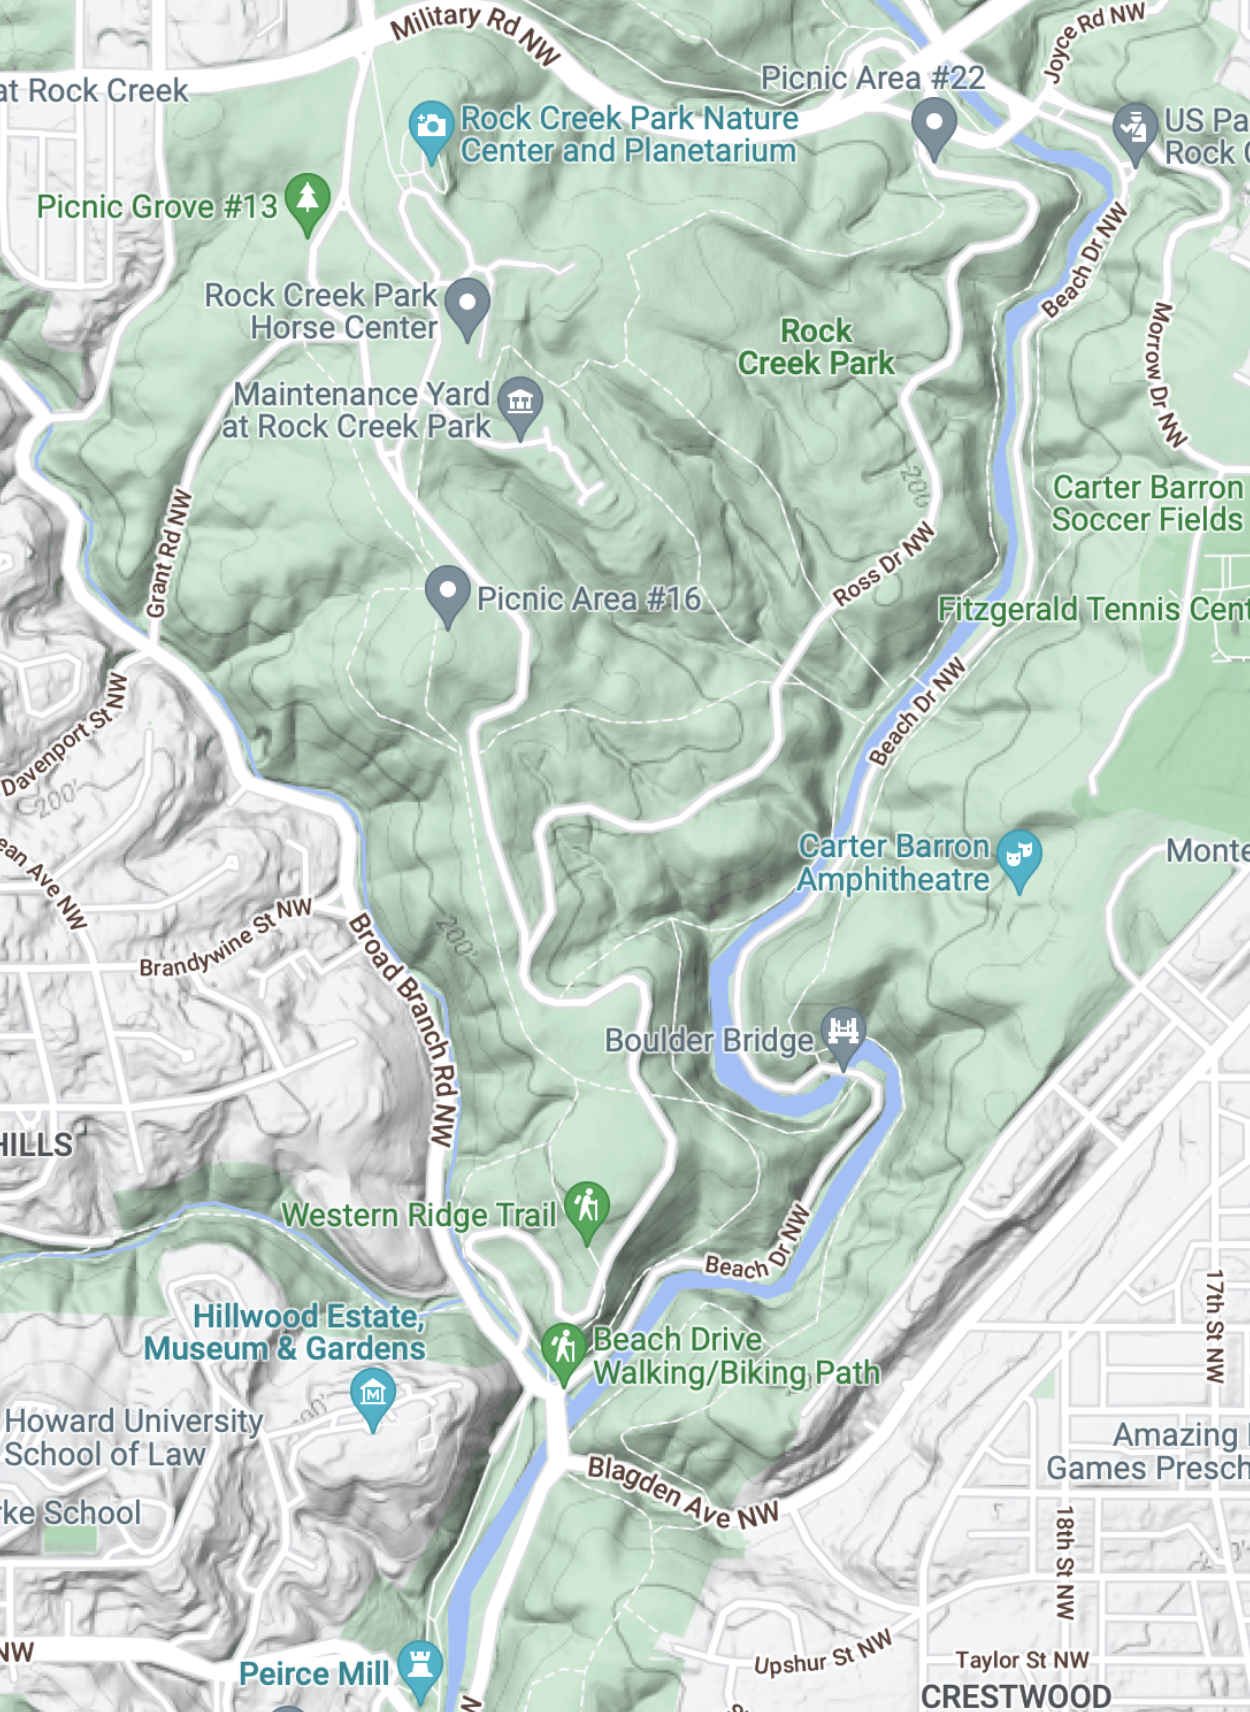
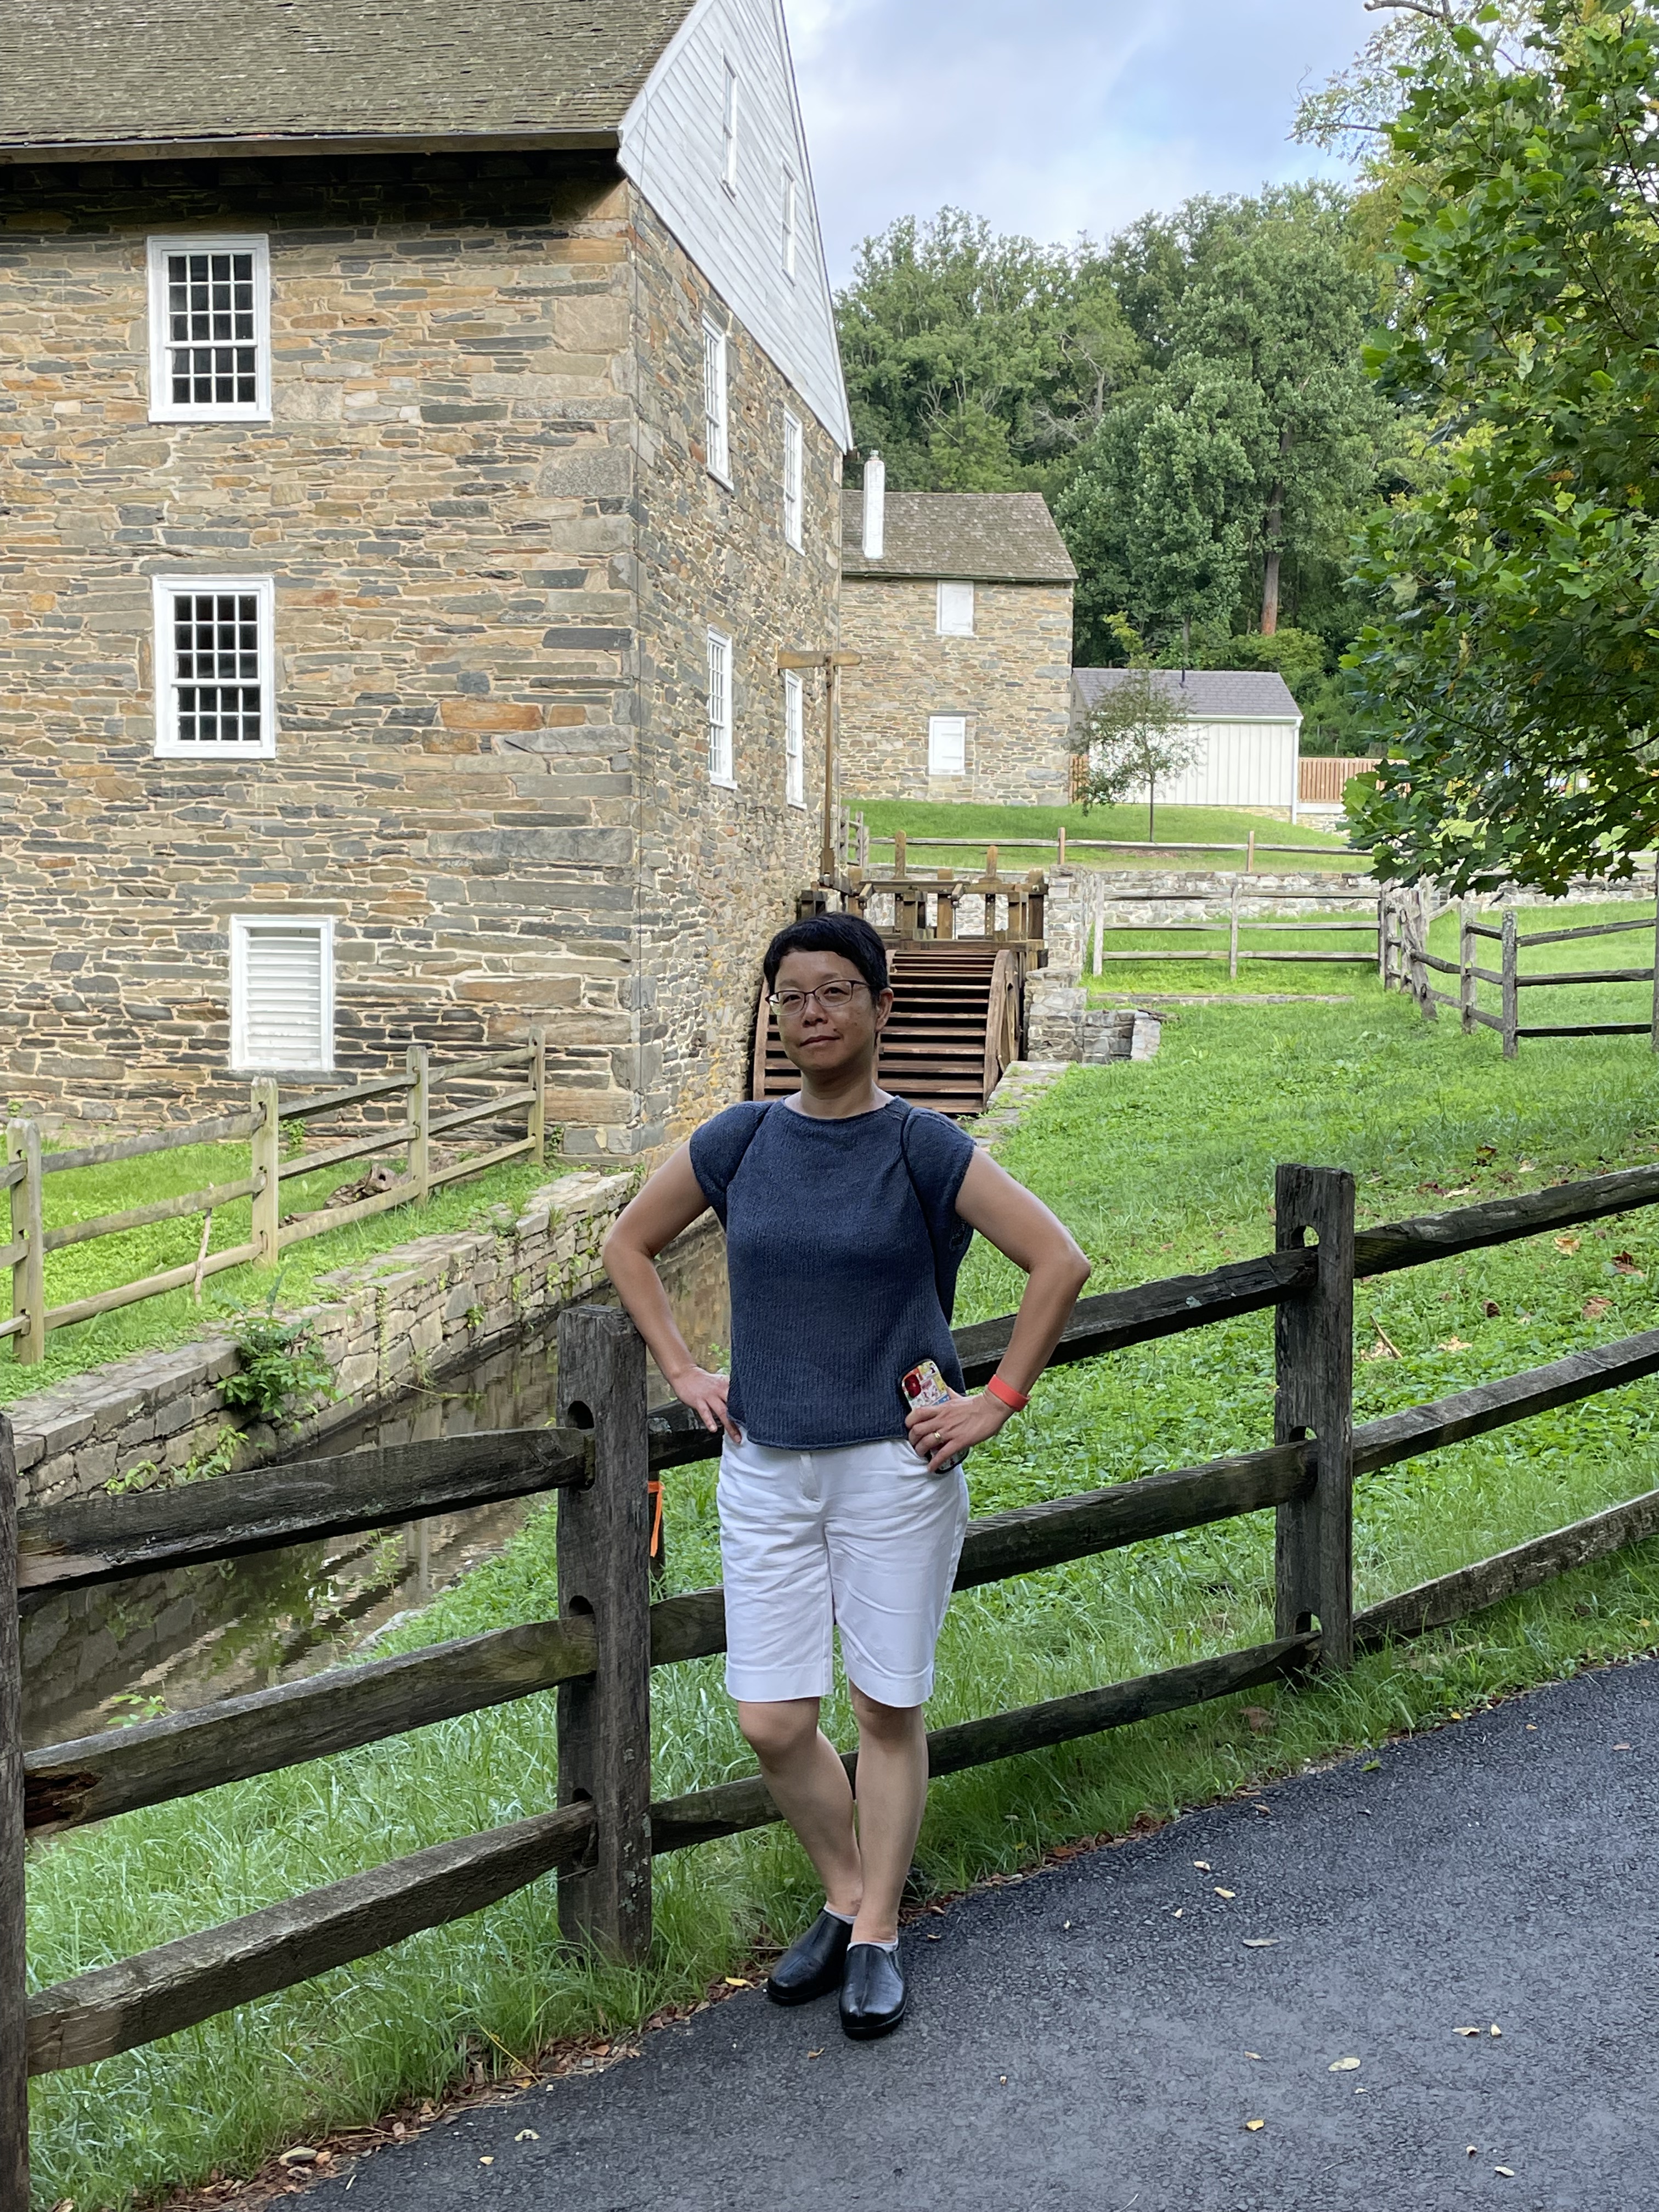
I’ve been talking about the bedrock exposed along the bed of the Potomac in several posts (e.g., Geological Bottleneck and Great Falls), but those are specific locations. Those significant drops in river elevation are part of a larger pattern, one that is displayed even at the scale of Fig. 1. It doesn’t take much of a drop to generate enough potential energy to spin a waterwheel (Fig. 3), which can do a wide variety of work–from grinding corn, to operating a machine shop.
The staircase structure of streams along the transition from crystalline rocks to coastal plains (aka the Fall Line) is so important to the ecosystem that artificial barriers were constructed within the park to ameliorate the impacts of road and bridge construction (Fig. 4).

Rock Creek National Park deserves its name, not just because of its rock bed. Cambrian sedimentary rocks exposure along the steep tributaries leading to the creek (river?) suggest that bedrock lies not very far beneath our feet (Fig. 5).

Water has been struggling with rocks for the last 200 million years, always trying to reach the sea. It exploits every nook and cranny in the bedrock until it forms a stream, then a river, and it cannot be stopped. Thanks to the perseverance of water, driven by the steady pull of gravity, the first European immigrants to North America were able to establish a toe hold on what was (to them) a new land…
Recap…
This is a quick post to summarize what I said about modern Japan being an analogue to the Taconic orogeny. For example, here’s a photo of Mt. Fuji, seen from the ocean (Fig. 1). (Imagine being in the back-arc basin during the Cambrian period.)
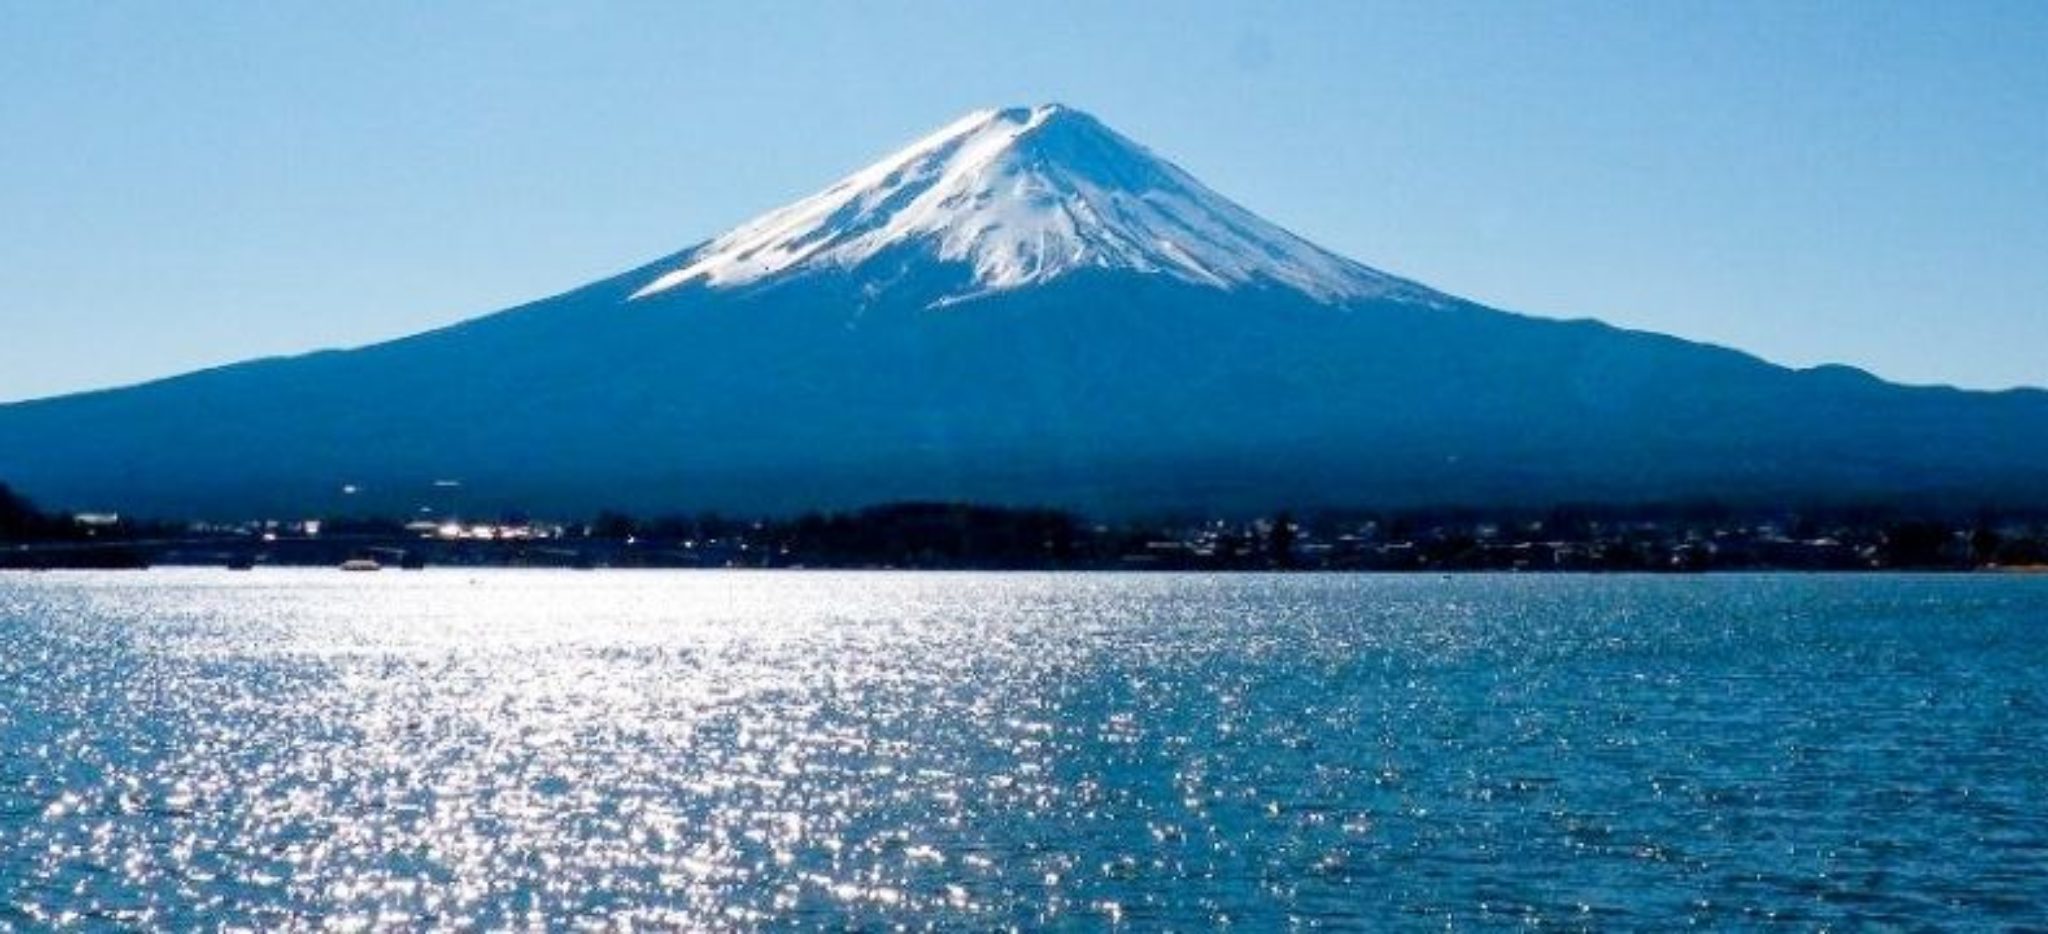
The Sea of Japan is more than 500 miles across at its widest point, so sediment eroding from the mountain chain that forms the backbone of Honshu is collecting along the western coast of Honshu as well as in deeper water offshore.
Here’s a schematic cross-section of the most-likely geography during the Taconic orogeny (Fig. 2). Imagine Honshu as the island arc shown offshore of the ancient North American continent (to the left in the cartoons).

Modern Honshu and the Sea of Japan are most representative of the Taconic orogeny earlier than 543 my, before subduction began on the western margin in the top panel. There is no subduction in the Sea of Japan today; in fact, spreading stopped about 20 million-years ago; details are hard to find because there are no easily accessible seismic sections of the Sea of Japan. Thus, to apply the cartoon from Fig. 2, ignore the subducting back-arc ocean crust (black layers) and focus on the deformed gray areas in the middle panel.
The lower panel is probably what will happen to Honshu in the distant future. For example, the Pacific plate is being subducted at ~10 cm/year (4 inches). We can use an average width of 1000 km (625 miles) to estimate that it will take 10 million years [1000 km/(10 cm/y)] for the lower panel of Fig. 2 to become reality.
With respect to the scale of the analogous processes occurring in the Japanese Islands and N. America (during the Taconic orogeny), we can do a simple comparison (Fig. 3).

This has been a very simple, hypothetical reconstruction, but I hope it helps you envision what the proto-north American continent was experiencing. The key point is that a massive mountain-building event, something like the Taconic-Acadian–Alleghanian orogenies, which lasted throughout the Paleozoic era, wouldn’t have been an earth-shattering event…


Recent Comments