Marine Regression in the Tertiary
It was a beautiful day to go to the beach, so we joined our neighbors on the foreshore. We headed SE along the coast, looking for some cliffs that we read about. We found them a half-hour drive from home. The geology that will be presented in this post has been discussed knowledgeably on weekendgeology.com, which I recommend because I’m limiting my comments to only what I’ve seen with my own eyes.
 Fig. 1
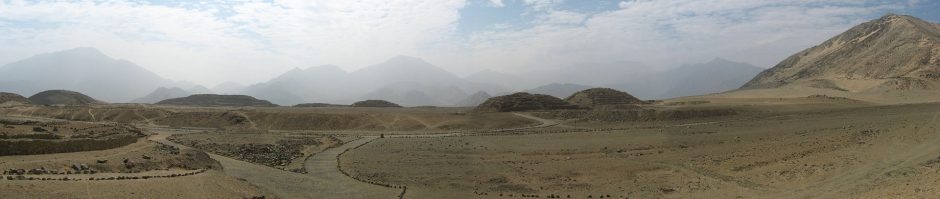
It was a nice day for a drive along the coast. The bicyclists were out in droves but traffic was light and we made good time, finally arriving in the coastal town of Bayside, which overlooks the Southern Ocean from cliffs about 100 feet in height (field estimate). Figure 2 looks out on Beaumaris Bay/Half Moon Bay.
 Fig. 2
At the bottom of a paved path, we found a sandy beach filled with sun seekers. It was a well-sorted medium quartz sand (field estimate) with shell fragments in the swash zone, with dark, fine-grained sedimentary rocks exposed during low tide (Fig. 3).
 Fig. 3
According to weekendgeology, these rocks have been dated using fossils to about 10 million years ago (MYA), which is within the Upper Miocene epoch. They looked pretty horizontal at this point. Turning around, to face the cliff, we discovered that they are conformably overlain by a reddish sandstone that gives the location its name (Fig. 4).
 Fig. 4
The contact is weathering faster than either of the two lithologies in Fig. 4, a pattern not repeated in a slightly different location (Fig. 5).
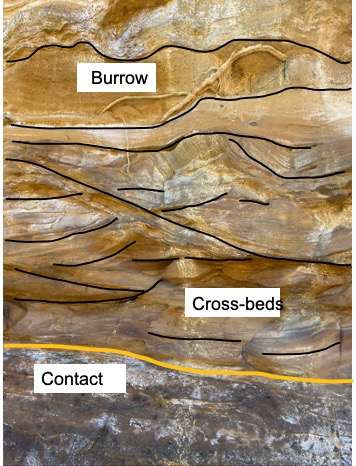 Fig. 5
The upper, yellow-reddish lithology is younger and there is no unconformity between them, so it’s only a little younger. Fossils within it have been used to place it within the late Miocene/early Pliocene (~5 MYA). A burrow is visible at the top of the photo. A trace fossil like this can be used to identify depositional environment and even age (roughly). This burrow was created by a worm of some kind, probably marine. The cross-bedding is typical for a nearshore marine setting, where waves are present but not dominant. This was not part of a submarine bar or a river, but an area influenced by both waves and steady currents. Possibly a sand bar in a river mouth.
The structures in Fig. 5 suggest that the sediment was being constantly reworked, possibly by tides and episodic flooding from a river. For example, Fig. 6 reveals irregular cross-beds that suggest more uniform transport to the left. But they do not occur in sets, only as individual beds, as if sediment were moving across the area briefly, followed by a quiet period.
 Fig. 6
Slumps of semi-firm sandy mud are outlined in Fig. 6 immediately above the primary color transition from green (marine) to reddish (terrigenous). The contact does not represent a sudden change over time but rather a horizontal shift; probably from a quiet, possibly lagoon, area represented by the green; to a more open channel flow where the river actually met the sea. Note the greenish areas in the younger rocks. Color in rocks has to be treated with caution, especially at scales less than the thickness of a major bed.
I’ve mentioned diagenesis several times in this blog. As sediments are buried slowly, over millions of years, and heated, the complex organic molecules they contain are slowly cooked. It’s like breaking down crude oil in a refinery; gunk goes in, and a variety of products come out at different stages of heating and pressure. Except, diagenesis isn’t as controlled, so the gunk produces byproducts of the diagenetic process intermittently and irregularly. The red-green color differentiation of terrestrial-marine sediments is like that. Red is due to oxidized iron and green is caused by reduced iron.
There’s a simple rule: red is land and green is sea. But it only works at large scale. When I first looked at the younger (red) rocks in Fig. 6, I assumed they were terrestrial, deposited in rivers. What probably happened is that sediment was deposited in a river delta, with sand spits, bars, and other transitional sand bodies.
Let’s return briefly to the slightly older “green” fine-sand sediments from ~10 MYA. They contained irregularly distributed, sub-round hollows where a dark inclusion may have existed (Fig. 7).
 Fig. 7
This is not a fossil, but a remnant of the irregular diagenetic chemical processes I alluded to above. They are very similar in origin to the concretions that we saw in an earlier trip. They are not like the burrow seen in Fig. 5.
Let’s estimate how fast sediment was accumulating here about 5 MYA. That’s not so easy to do because we’re not working with millions of years in this example; nevertheless, let us attempt to see what kind of depositional environment we’re looking at. First we observe that Fig. 6 is about 2 m (we’re using SI units now) in height. To constrain our estimate, let’s use a sedimentation rate of 2 mm/yr like before to calculate how much sediment would accumulate in a million years. We multiply 0.002 m/y and one million years, to find that a steady depositional rate of 2 mm/y would have produced 2 km of sediment. Obviously, that didn’t work. We’re looking at 2 m of sediment, so let’s estimate the apparent sedimentation rate using observations (treating the given ages of the rocks as observations because of the complex radiometric methodology used to constrain the geologic time scale), rather than guesses. We divide 2 m by 1 million years to estimate that (overall) there was very little sedimentation occurring (0.002 mm/y). A meaningless estimate for a geological process.
I alluded to accommodation space in previous posts. There doesn’t appear to have been much in this area about 5 million years ago. What was happening?
There was a lot of sediment available, as shown by the slumping sediments in Fig. 6. We get a clue from the lowest part of the exposure (Fig.8), near the contact with the reddish sediments in Figs. 4-6. The sunglasses (for scale) show that gravel particles (>2 mm in diameter) were sparsely mixed with fine sand. Note that the large grains in Fig. 8 are what is called sub-angular to sub-round in shape. These particles travelled along a river bed for less than 100 miles (wild guess); the point is that the source rock for these grains wasn’t hundreds or thousands of miles distant. There were mountains near the field site 5 MYA.
 Fig. 8
It isn’t just that there were mountains. This is a lot more complex than a developing foreland basin…no way…Australia was separating from Antarctica (according to current thinking) during the Tertiary period (Fig. 9).
 Fig. 9
Note that this map is dated at 94 MYA; the reason for including this model result is to show that Australia, Victoria to be specific, was moving away from other land masses (to the NW in the image) and there was no regional compression, like during the Paleozoic.
The sandy matrix seen throughout these rocks is consistent with the reworking of quartz-rich sediment for millions of years. However, Fig. 8 suggests that a new source of angular gravel was available in small amounts intermittently. There was uplift and erosion of rocks containing either igneous (plutonic) rocks or sediments deposited near a source in antiquity (e.g. during the Paleozoic). This probably occurred during isostatic adjustment, which would explain the low sedimentation rate we estimated.
Before addressing this question, I’d like to return to the rocks. Figure 10 is included in this post to make my point that stratigraphers deal with rocks at the scale of ten’s of meters but sedimentologists and geochemists are forced to get closer to the action.
 Fig. 10
I have nothing in particular to say about Fig. 10, other than this is an example of remineralization at small scale (image size is ~3 inches), which impacts observations at larger scales. Enough said. I debated whether or not to annotate Fig. 11…no reason to.
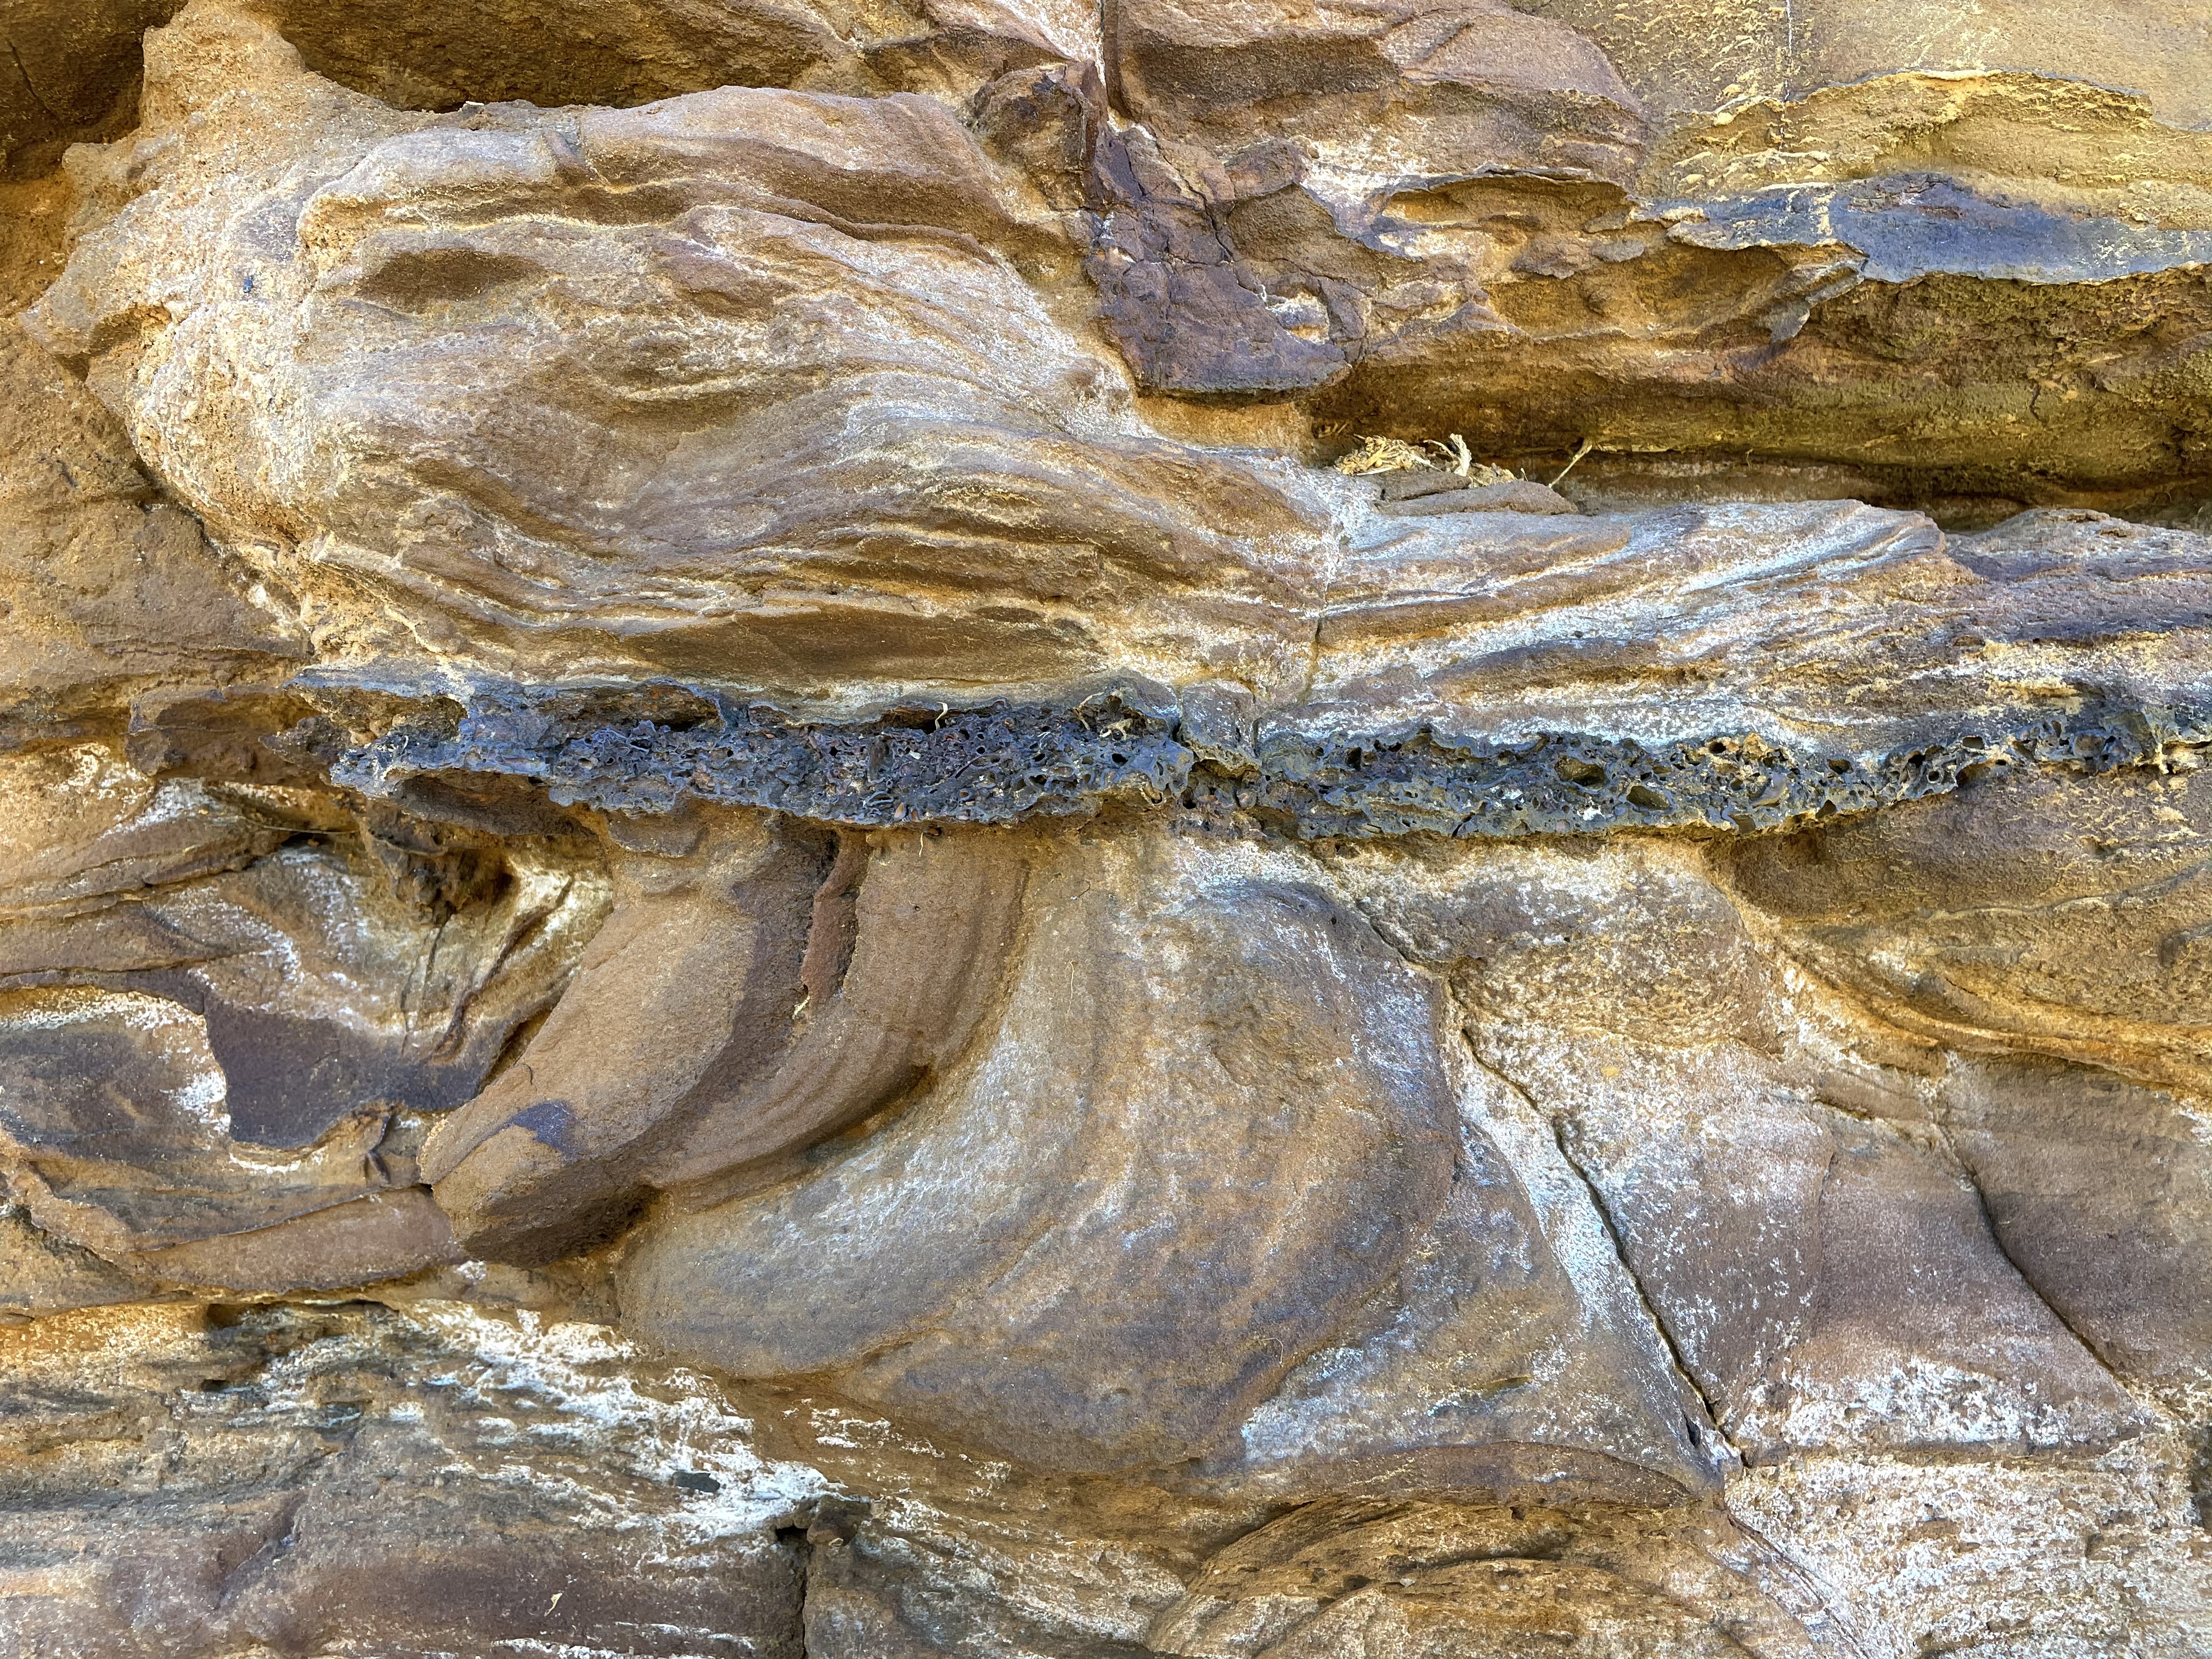 Fig. 11
The image size is less than 3 feet. These sediments were deposited during the change in location of the river mouth. The black layer that truncates cross-bedded sediments below and is overlain by them above, was an anomaly. A quiet period maybe. I have to look closer however.
 Fig. 12
These are trace fossils. The worms went crazy for a few years (maybe only months), burrowing and eating everything organic within this dark layer. They didn’t make it (at least not here), but that’s life. Spatiotemporal adjustment. The depositional environment became firmly planted in the terrestrial sphere (removed from the ocean) with no more quiet water, by the time poorly cemented and poorly sorted sands were deposited.
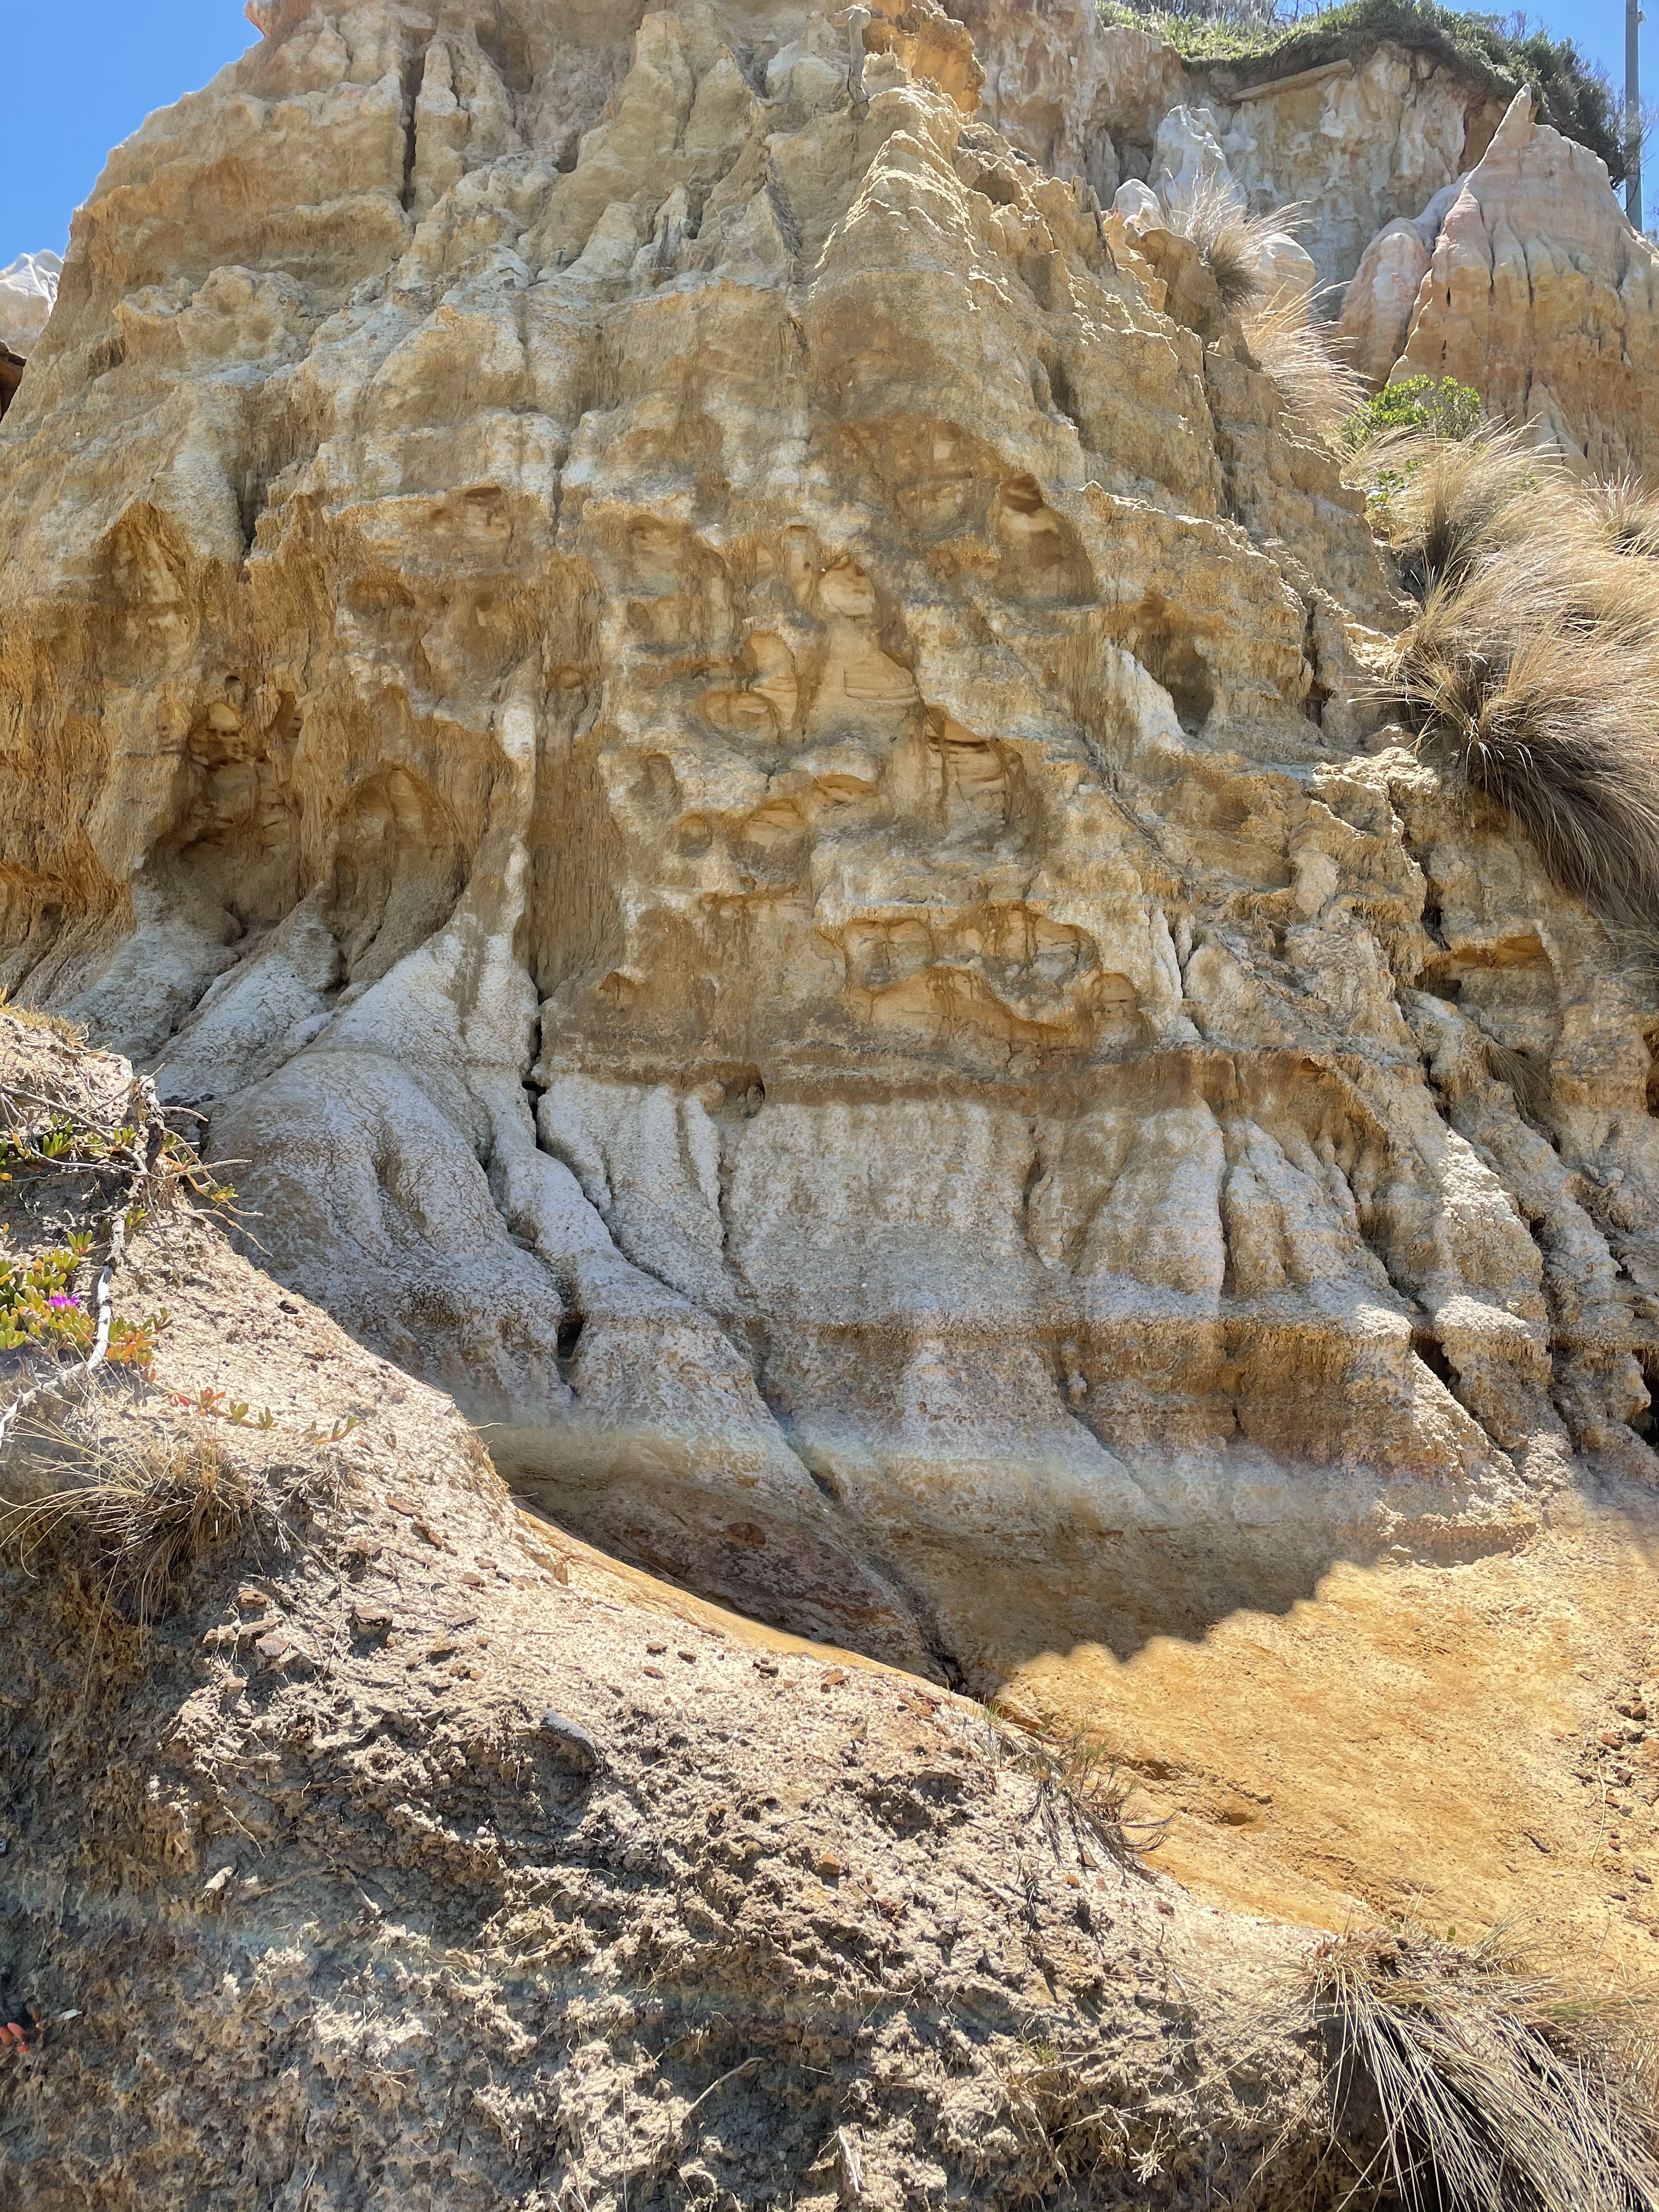 Fig. 13
Figure 13 shows the thick layer of weak sandstone that supports the bluffs, and mostly produces steep slopes. Here, at Half Moon Bay, they are a little stronger. The white layer could be nothing more than salt being concentrated during burial. They are the same rocks. But, what do they look like?
 Fig. 14
Figure 14 shows the contact with the nearshore marine sediments we’ve been examining. Obviously, this is a different depositional environment. Guessing, I’d say it was already arid, from the white deposits (salt is the most common of a few white chemical deposits, whether depositional or diagenetic), but there were flood events, just as several million years earlier.
 Fig. 15
Compare Figs. 15 and Fig. 8 to see that this region (probably a delta near a source of sediment, i.e. mountains) was in dynamic equilibrium for several million years; sometimes there was more coarse sediment (from an unidentified source), but one has to ask: Why are the sediments so poorly mixed and the coarse grains showing no layering?
 Fig. 16
Figure 16 was taken from the same area as Fig. 15, but from a greater distance. The image is about 3 feet high. It has been marked up to show the general lineation of the angular gravel deposits. The lines are not meant to imply a clear bedding; not by any means, but they are real because diagenesis does not recrystallize silica into new crystals at the shallow burial depths these rocks have seen (maybe 5 km?). I have seen exactly the same distribution of coarse fragments in a sand matrix in both rocks and recent fluvial sediments. Each marked line in Fig. 16 indicates a weak episodic depositional event, strong enough to move some gravel around but not sufficient to form cross-bedding. Nevertheless, the (admittedly crude) analysis suggests that flow to the left (i.e. river transport) was important.
We made one more stop on our field trip into the Tertiary, another cove within Half Moon Bay. We had hoped to follow an unimproved path down to the shore, examining beds rich in fossils; but our plans had to be modified when we found the path closed because people had been destroying the cliff in a search for the very fossils that made it a treasure trove of life here 5-10 MYA. We drove further south (the dark-blue dot in Fig. 1) and hiked along a path as far as we could. Figure 17 shows the beach here.
 Fig. 17
This particular cove, for oceanographic reasons (e.g. waves and coastal currents) collects seaweed from throughout the eastern shores of Half Moon Bay. There was a sign announcing a project to “save” the shore from what is probably its natural state. Fig. 17 reveals the cause of my cynical analysis; the pathetically small amount of sand deposited (at great cost) has not and cannot prevent the algae (dark area larger than the beach) from collecting. Some beaches are not meant for human occupation.
We came here to get a look at evidence of deformation after these Miocene/Pliocene rocks were deposited. Let’s start with Fig. 18,
 Fig. 18
Figure 18 has been marked-up with yellow lines indicating bedding surfaces estimated from along the coast (see the inset map). This is the stretch of coast that we couldn’t access because of the trail closure. To my eye, there is a low-amplitude anticline visible in these Tertiary rocks. The orientation of the compression that would have created such a feature (in modern coordinates) was apparently from the SW. Study the inset map, assuming that the anticline marked in Fig. 18 is approximately orthogonal to the coast seen in the inset.
As noted above, Victoria was not in a compressional stress regime after these sediments were deposited. Nevertheless, we cannot argue with the rocks. I’ll add here that a map of anticlines is consistent with our observations. There was mild compression in this area at about the same time as basalts were being created and flowing over the land to the west. We discussed those already.
The deformation seen in these rocks occurred less than 5 million years ago, when Australia was in a tensional tectonic regime, being dragged by upper mantle convection to the NW (see Fig. 9). I would propose that the mild fold seen in Fig. 18, and reported en mass,are nothing more than drape folds. These coastal/fluvial sediments were being buried suddenly, as the upper cliff sediments were deposited, probably during a period of volcanism that was sporadic in Victoria about a million years ago.
It’s all consistent, which is a critical criterion in any geological study. These rocks record a transition from shallow marine to deltaic and then to riverine, the transition having accelerated when the upper, poorly consolidated, sands were deposited. In My Opinion (IMO), this was the result of Australia being picked up by a mantle plume, which lifted this area and created a lot of volcanism. Half Moon Bay slid off the elevated mantle plume before the sediments, produced by erosion of isostatically uplifted granites, could properly lithify.
Volcanic Fabric at the Seashore
This is a short note to show what we found along the rocky coast at the mouth of the Yarra River, on our return from Organ Pipes National Park. We didn’t have to go far as shown in Fig. 1.
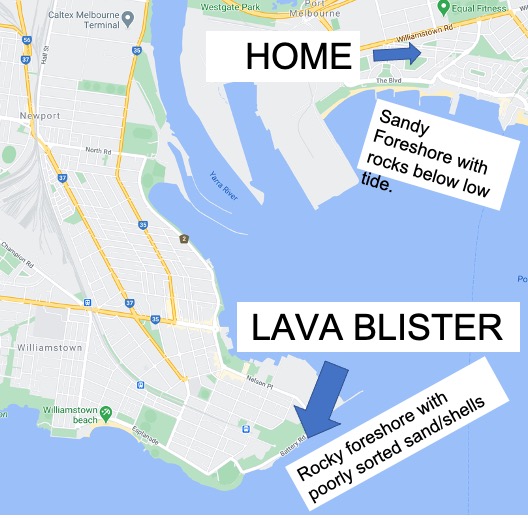 Fig. 1
The rocks on the south side of the Yarra River are slightly higher than on the north side and are exposed at all but the highest tide. Figure 2 shows what the shoreline looks like and Fig. 3 shows the sediment texture of poorly sorted sand and gravel.
 Fig. 2
 Fig. 3
A Lava Blister is defined as: “The surficial swelling of a plastic lava flow crust in response to the puffing up of gas or vapour from beneath the flow. Blisters may also form through hydrostatic or artesian forces in the lava. They are usually 1–150 m in diameter, with a maximum height of 30 m, and are hollow. Compare tumulus.” (Oxford Dictionary)
Here’s what the one we found looks like at mid-tide (Fig. 4). I have outlined the rim. Note the smooth surface of the fractured basalt lining the rim.
 Fig. 4
Apparently, this volcanic field is one of only three locations known where these features occur. I admit this isn’t a very good example, but it has been subjected to coastal erosion form almost a million years. Here are a couple other photos, now that you know what you’re looking at.


Cool Pleistocene Basalts
The title of this post, besides being a bad pun, refers to the fascinating secondary fabric we found in some basalt flows not far from our house in Melbourne. An hour-long car ride took us to Organ Pipes National Park, near the Melbourne International Airport. The sign at the park entrance gives an overview of the park (Fig. 1). We’re going to see some of this for ourselves.
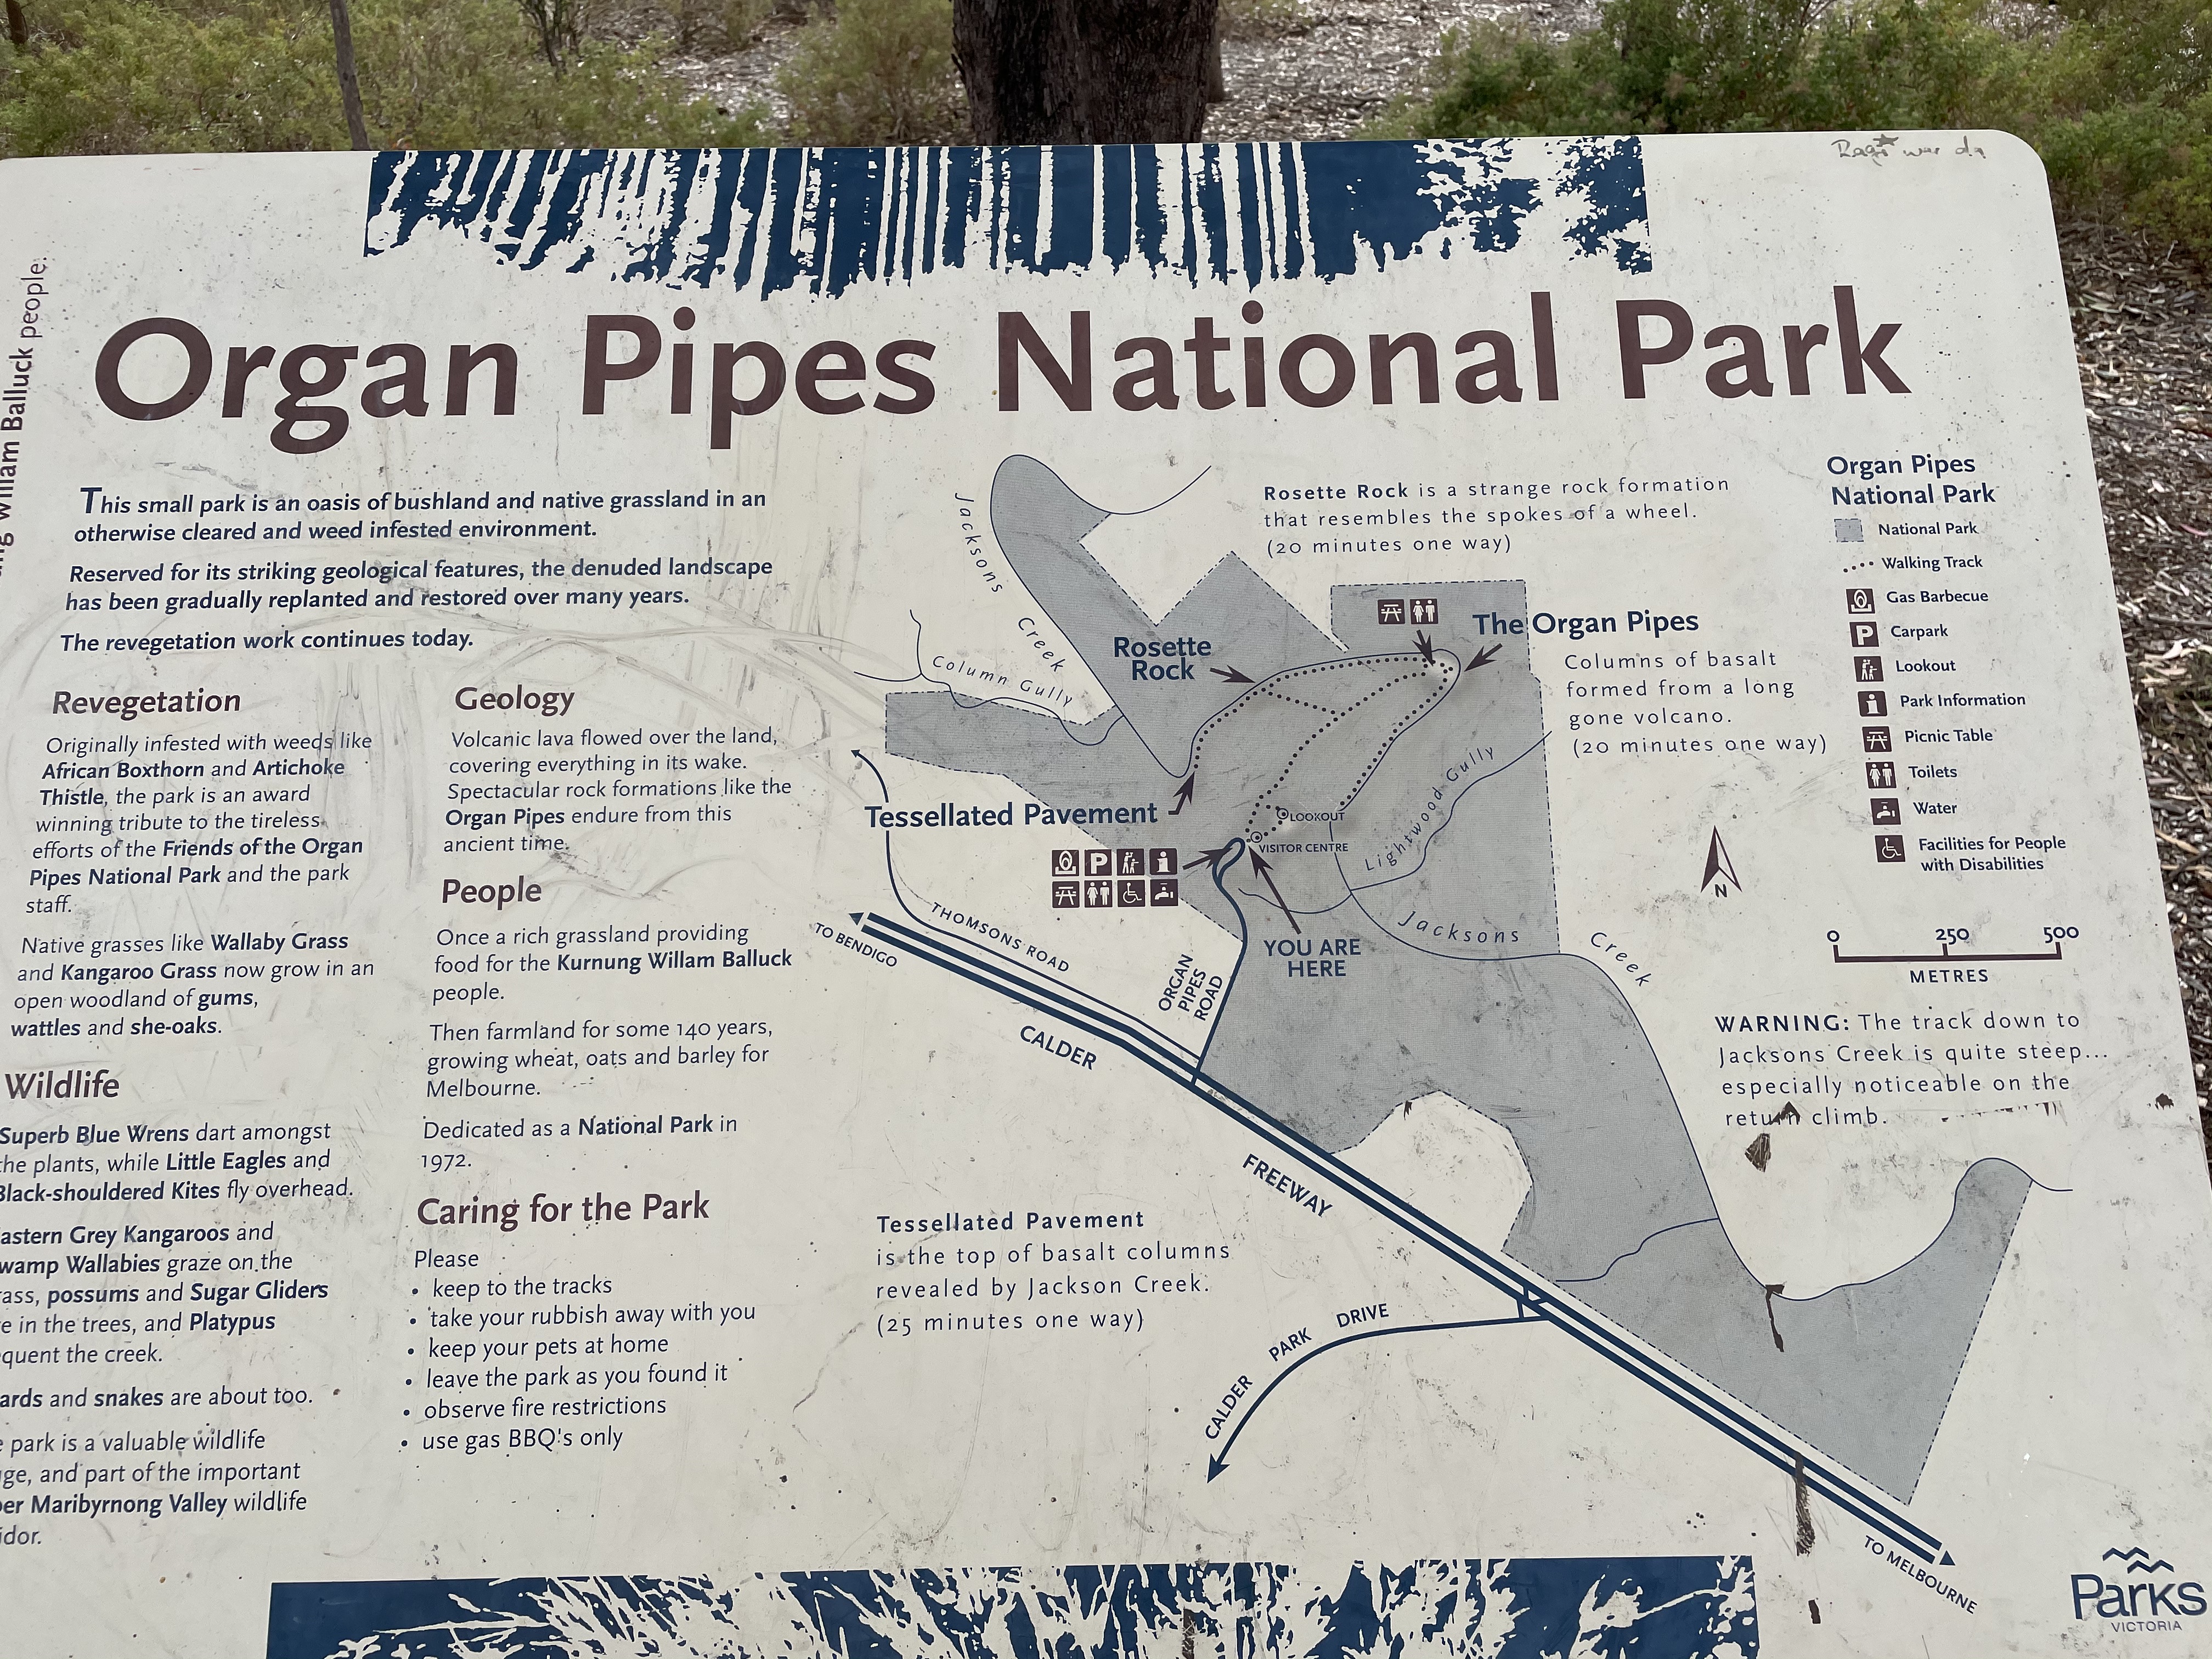 Fig. 1
The now-familiar Victoria geologic map (Fig. 2) reveals that the park is located well within the Pleistocene volcanic field, with radiometric ages of approximately 700 ka to 1 ma. Note also the thin slice of Paleozoic sedimentary rocks in the area (indicated by the purple color). We’ll see those as well today.
 Fig. 2
The terrain consists of a plateau dissected by streams like Jacksons Creek running through Organ Pipes National Park (OPNP). The flat surface was created by the lava flows that emanated from numerous volcanic cones. The landscape seen in Fig. 3 hasn’t changed that much since these flows covered the land, filling creeks and leveling the terrain.
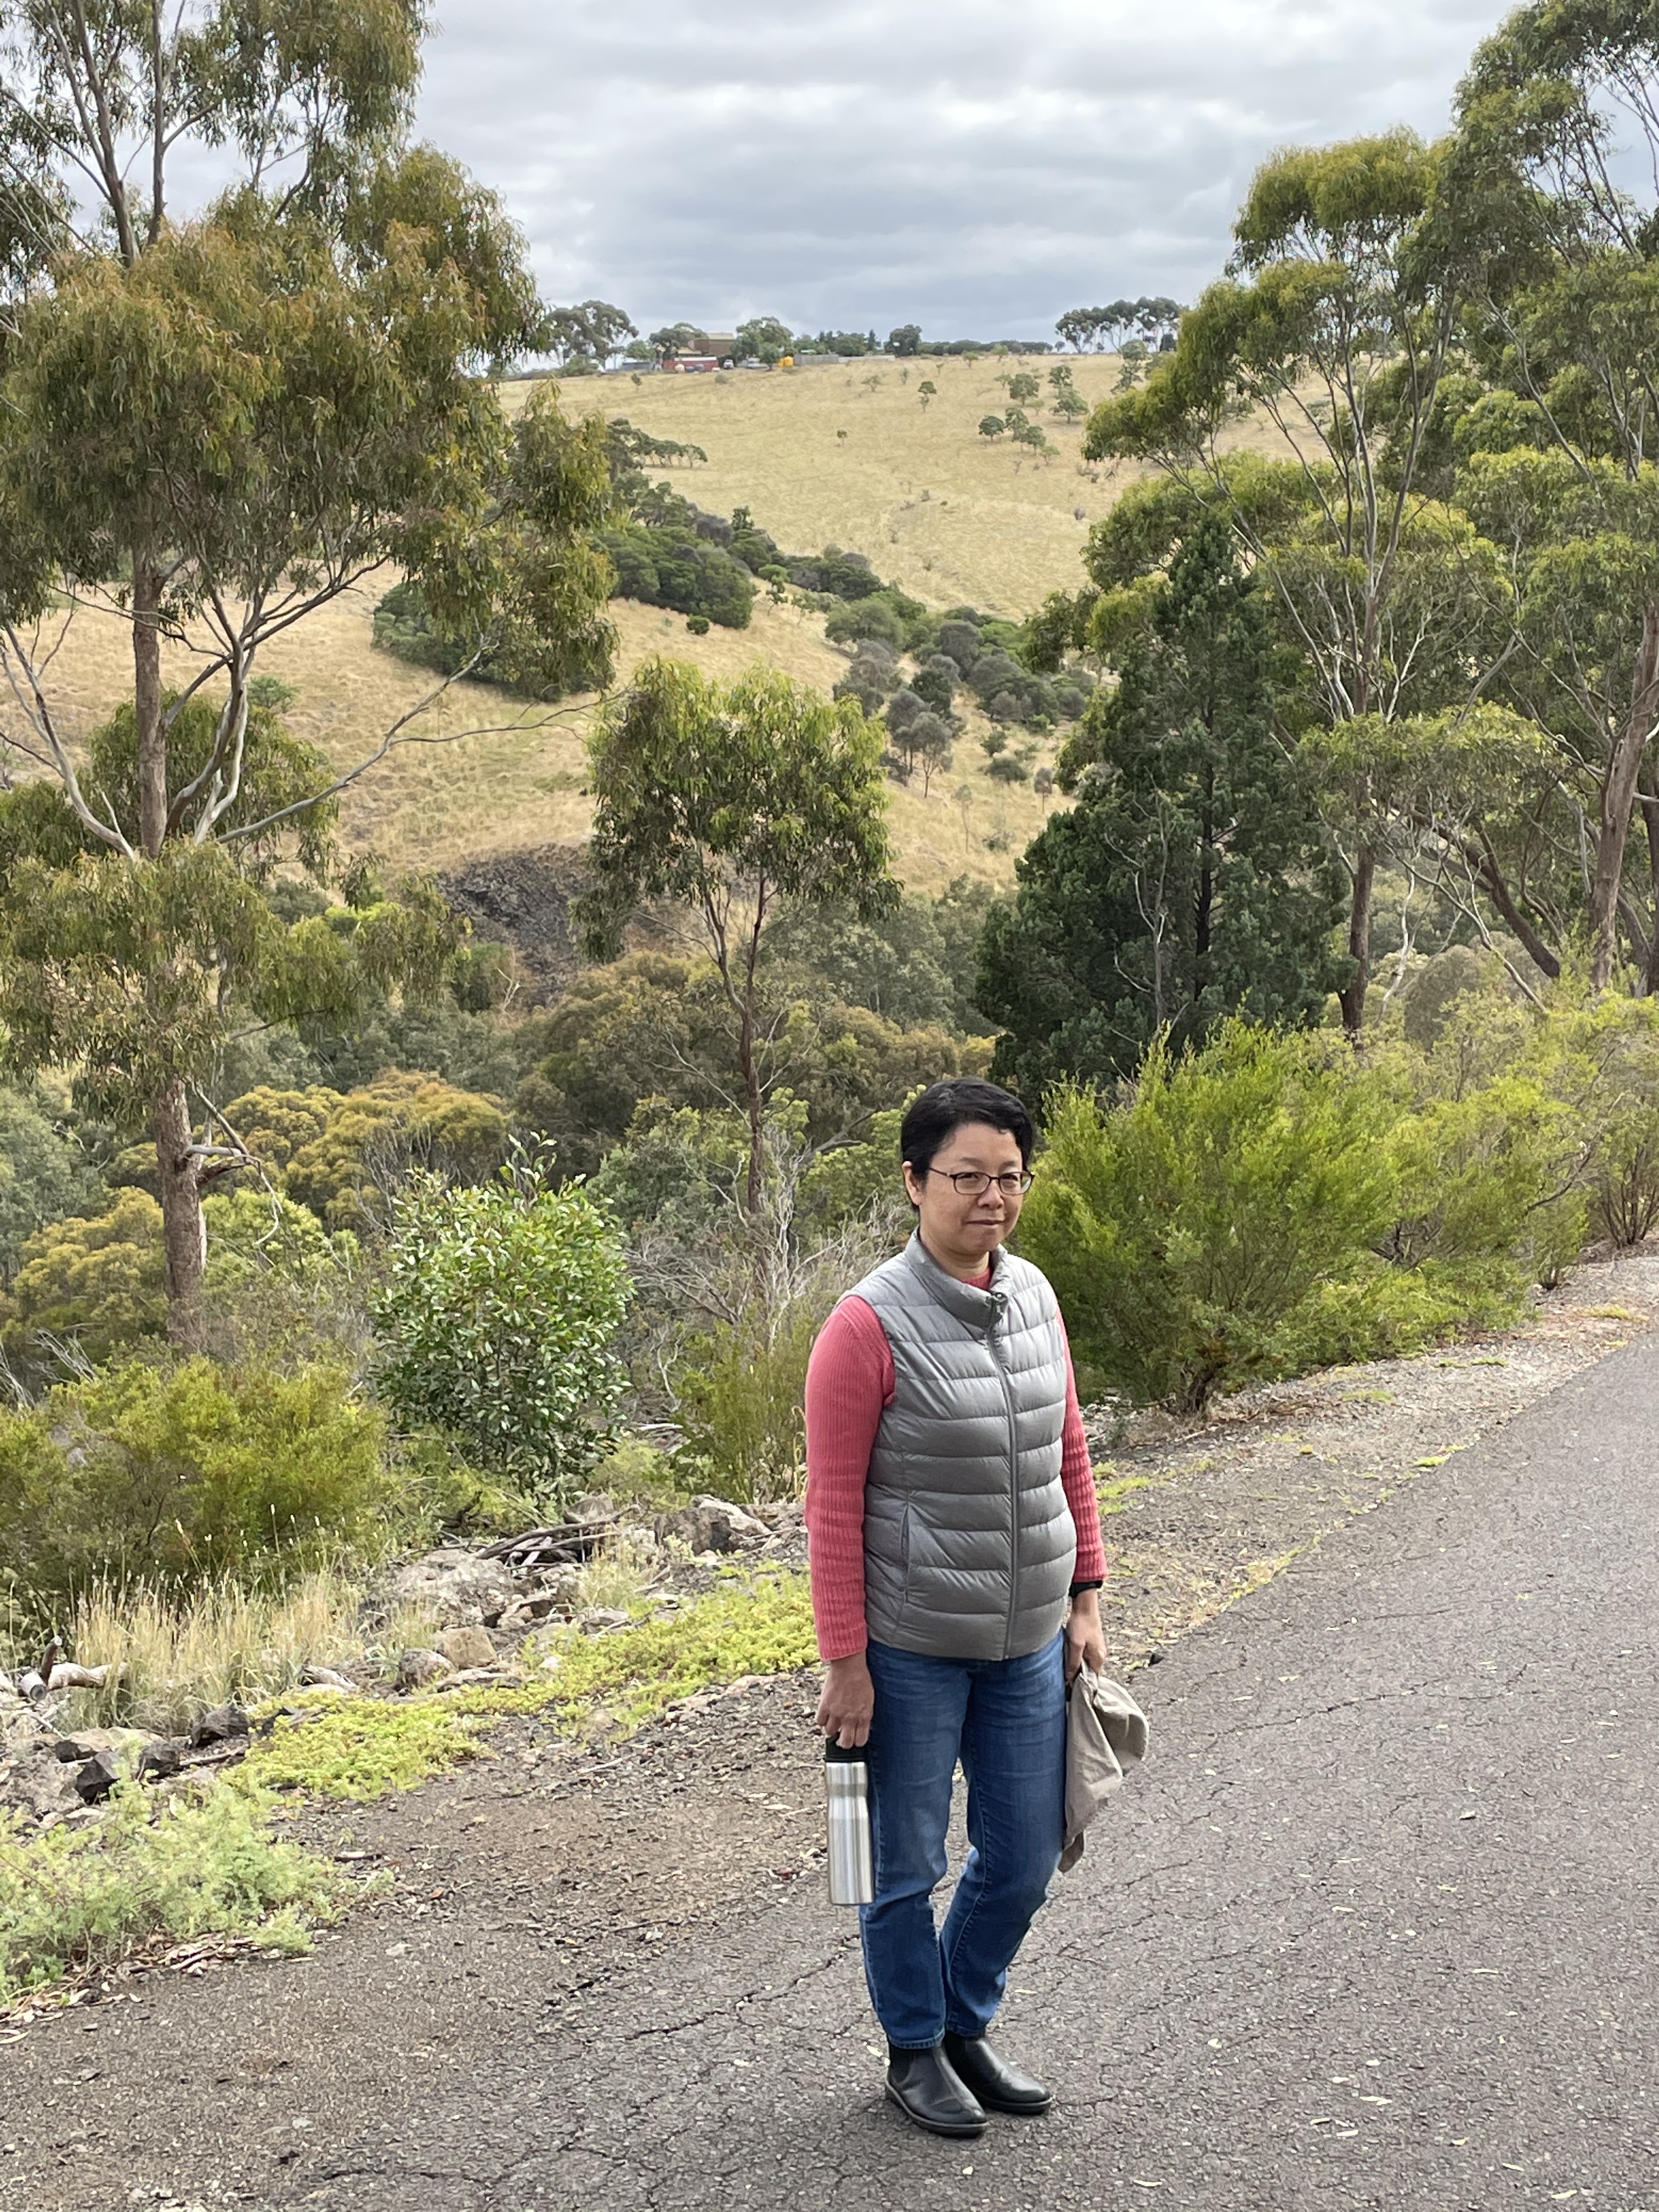 Fig. 3
The asphalt path seen in Fig. 3 leads down a steep slope to Jacksons Creek, ~150 feet below the pediment level. We’ll take a look at the basalt from the top of the plateau later. This week, we’re going to start from the oldest rocks and work our way upward. So let’s get going.
Jacksons Creek, about twenty feet wide and probably no more than a few feet deep, winds its way along the canyon. On the other bank, where we couldn’t get, we discovered Silurian sandstones (according to the park info about 420 million years old), with an apparent dip of more than 60 degrees to the NE (Fig. 4 is looking towards the SE).
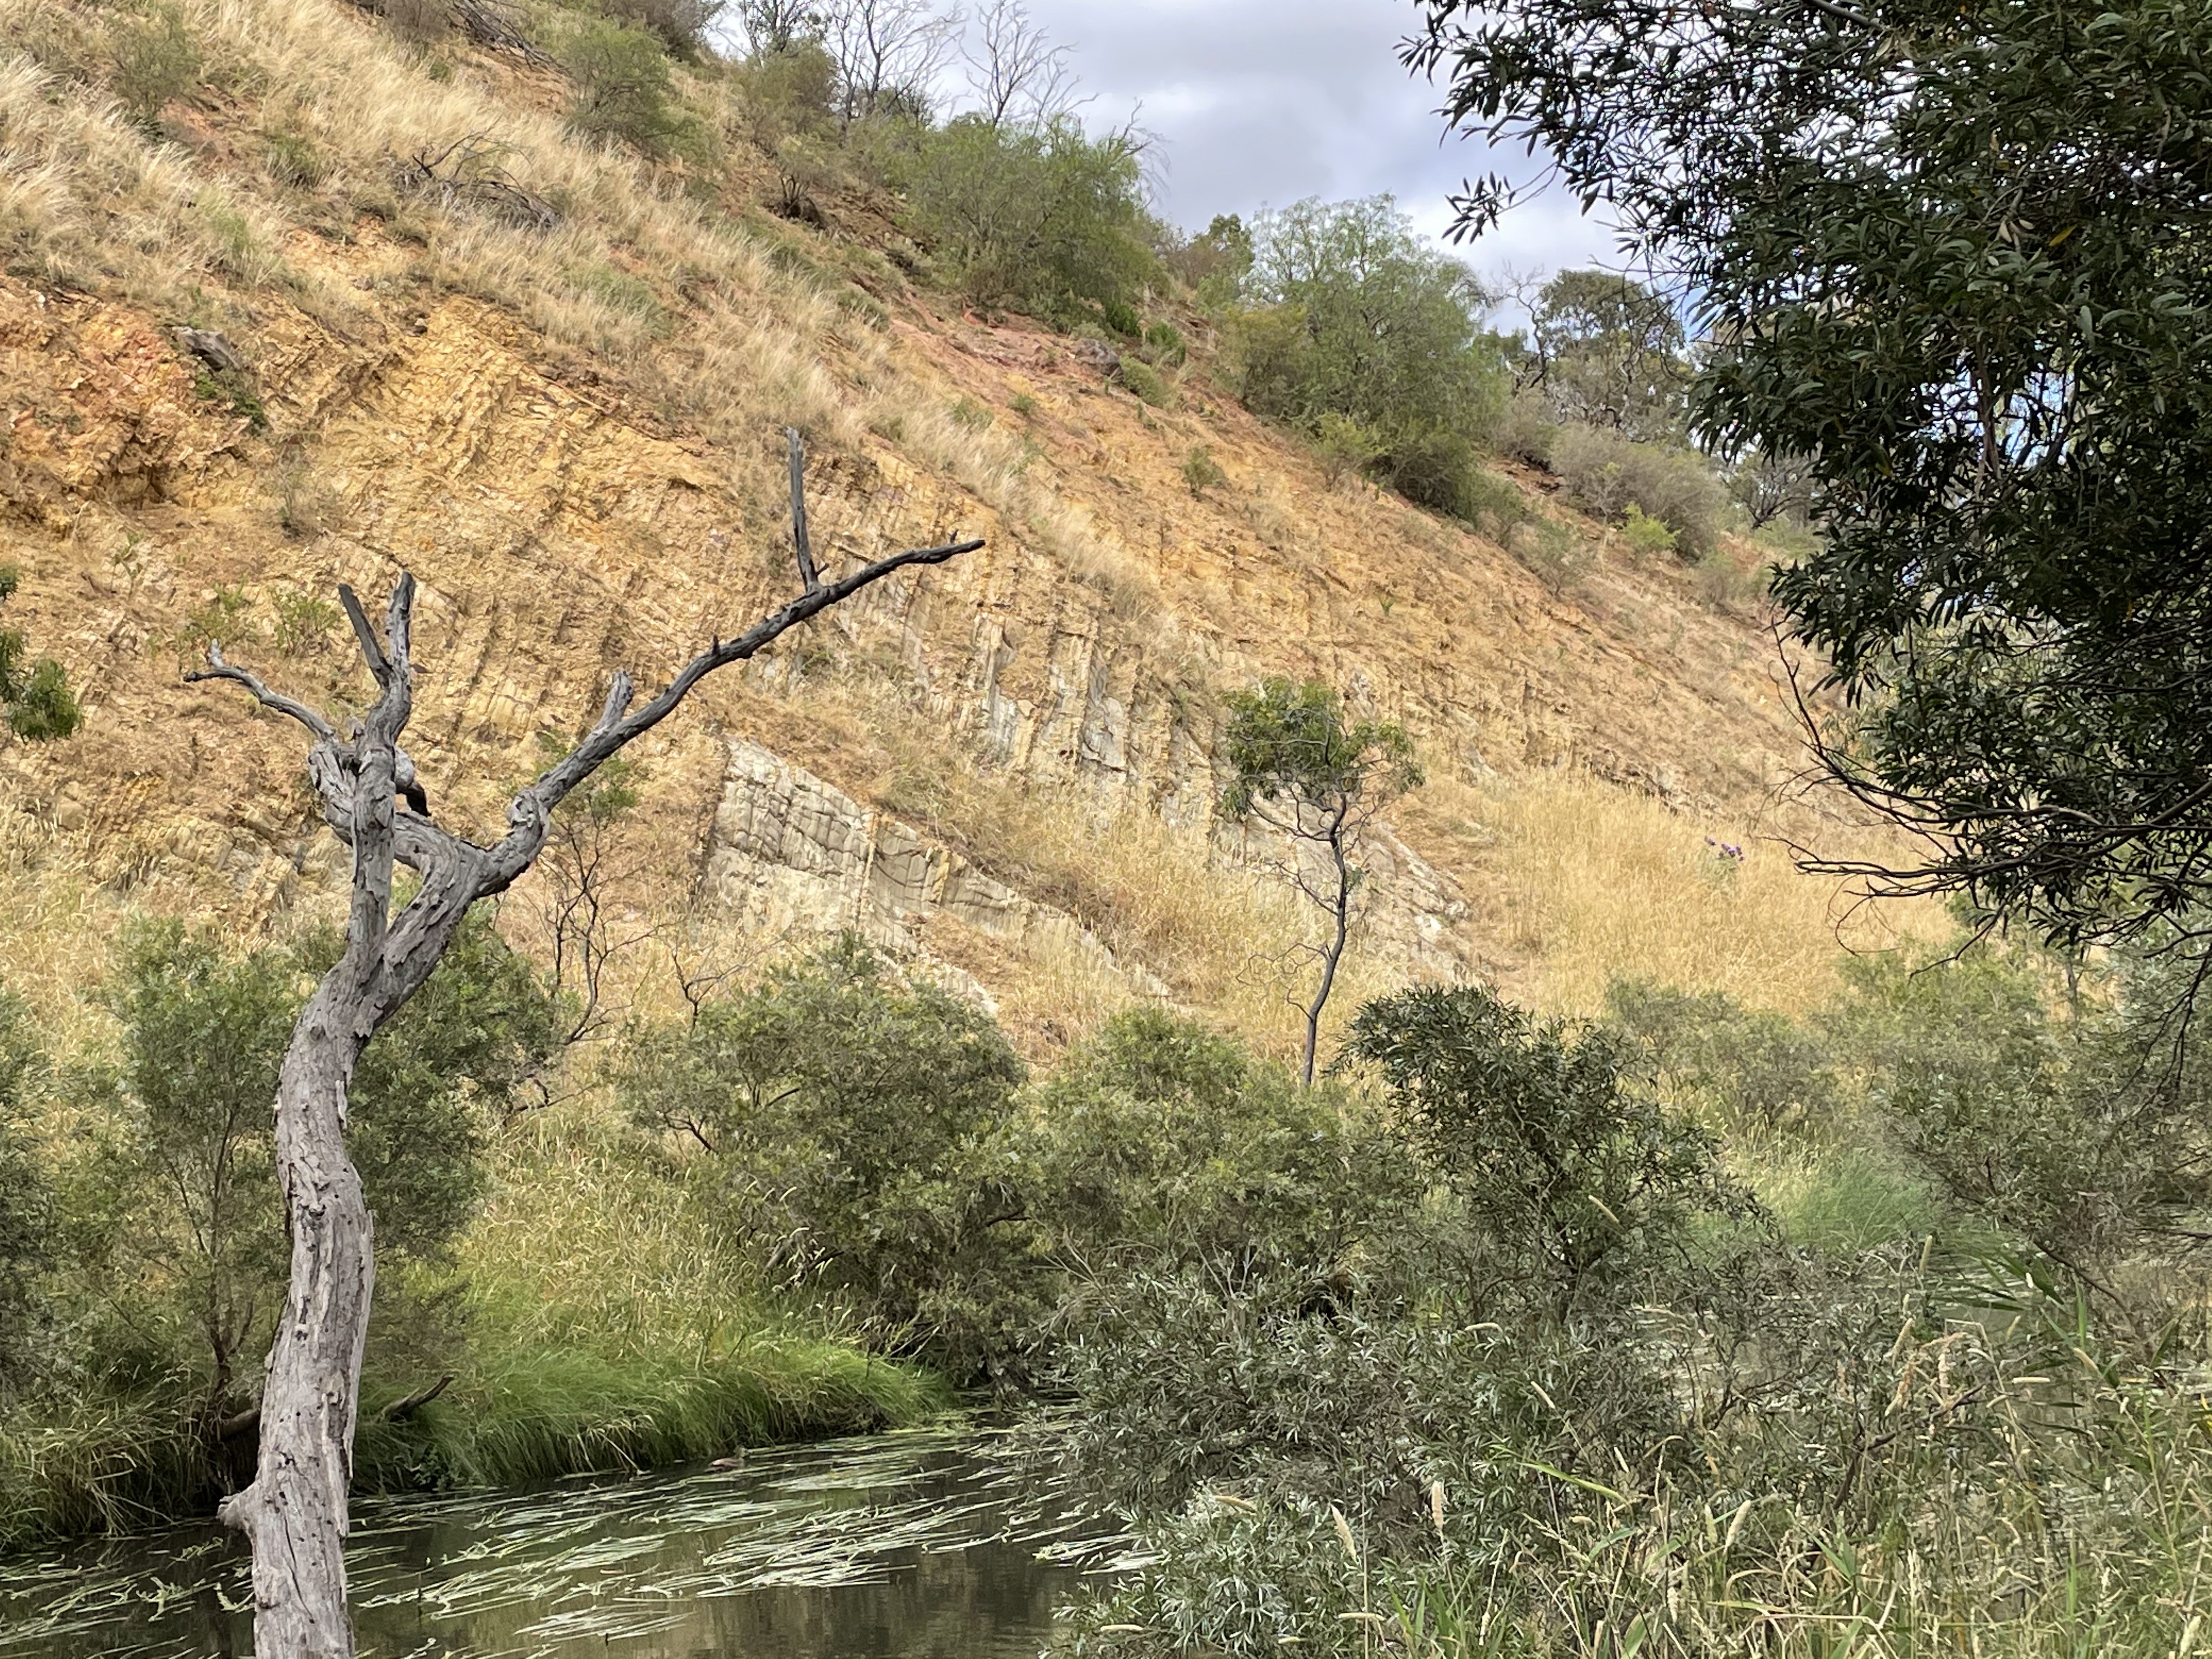 Fig. 4
This is as close as we could get. These sedimentary rocks were tilted (folded and faulted) during collision with suspect terranes and finally Gondwana throughout the Paleozoic, ending in the early Mesozoic period (about 200 MY ago). The red color of these sediments suggest that they were nonmarine, probably deposited in a river floodplain, which is consistent with the nearshore marine depositional environment we saw in Ordovician rocks we encountered in a previous post. Those were of late Ordovician age, only a few million years before these nonmarine sediments were deposited. The land was rising (relative to sea level) about 400 MY ago, but not suddenly.
The Ordovician marine rocks from the last post were also tilted and even overturned. They showed evidence of compression shifting from SE early to SW during a later episode of deformation. We can’t be certain of the direction of compression of these Silurian rocks, but it appears to have been (in OPNP anyway) directed along a NE line, i.e., about 90 from the viewing direction of Fig. 4. Before we leave this fragment of the distant past, let’s see what else we can get out of these rocks. Figure 5 shows a very simple analysis of the compression directions I have estimated from these rocks and the Ordovician sediments from last week.
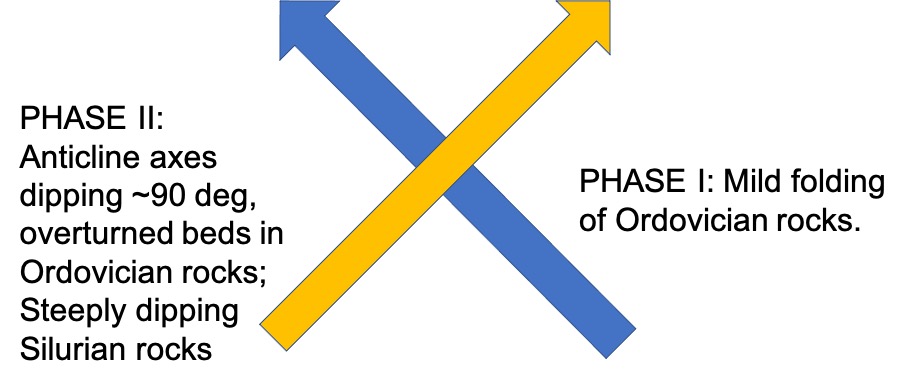 Fig. 5
This analysis comes with (at least) two warnings: 1) deformation has nothing to do with the age of the rocks except that it couldn’t have occurred for millions of years after deposition of the youngest deformed rocks (Silurian); and 2) I have put an arrowhead on the stress line for Phase I based on what I know of the Tasman Orogeny. Phase I occurred first and was mild, based on low-angle anticlines seen at Yarra Bend Park. Phase II was later and stress was towards the NE (present coordinates) because of the steep dip angle of an anticline axis at Yarra Bend. This is for certain. The Silurian rocks at OPNP may reflect Phase I deformation, but we couldn’t see them, or any evidence, from across Jacksons Creek. However, they are consistent with strong compression towards the NE.
No younger sedimentary rocks are found in the area, so it is assumed that whatever rocks were deposited or erupted (volcanic) in this area between Silurian and Pleistocene were eroded away. So, we’ll skip over the Mesozoic and focus on this post’s titular rocks.
Figure 6 shows an unconformity between the tilted Silurian rocks and younger volcanic rocks that overlay them. This could probably be called an angular unconformity because lava is deposited in layers, just like sediments.
 Fig. 6
The viewing angle is different from Fig. 4, but the general bedding of the Silurian sedimentary rocks is indicated by yellow hand-drawn lines. The black line is the approximate contact between the older rocks and the Pleistocene volcanics. That was the approximate land surface ~one million years ago. Pretty cool (another bad pun). The white square indicates Fig. 7.
 Fig. 7
The viewing angle has changed again, but the bump of the black line in Fig. 6 is the point in Fig. 7. The angular fragments of basalt in Fig. 7 indicate the thin soil that has developed over a million years in this semi-arid climate. It isn’t very often that a contact like this can be seen, a hiatus of more than 300 million years unobscured by soil and vegetation. Alas, it was hidden from us by logistics and our unwillingness to find a way to get over/around the creek, in violation of the law, to get a closer look. Before we move on, I want to share an interesting photograph of this exposure (Fig. 8). It demonstrates how dangerous it is to use color in assessing a rock from a distance. The white exposure is the same as the yellow rock but something was different when it was buried and became cemented…diagenesis is a complex process.
 Fig. 8
Moving upstream, and higher into Pleistocene basalt, we see some interesting features of this particular lava flow in this particular location. This is tricky because we don’t know how thick the flow is; nevertheless, let’s go to the feature that gives the park its name to begin.
 Fig. 9
This is classic columnar jointing. It is thought to occur during uniform cooling of igneous rock. A famous example is Devil’s Tower, Wyoming. The rocks of OPNP are definitely extrusive, unlike other examples. We have seen the contact between this basalt and the surface it flowed over. If experts cannot agree on how an igneous rock that never saw the light of day formed this unique structure, they certainly aren’t going to agree on these basalts, especially the more spectacular fabric seen throughout the park.
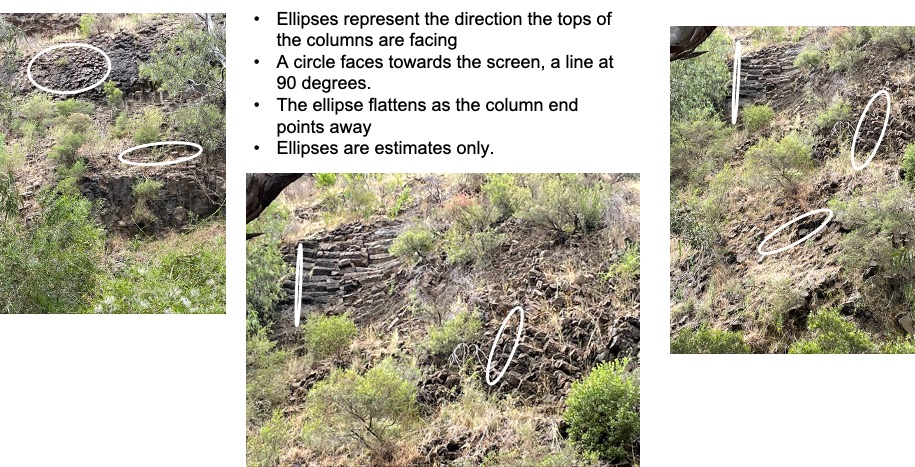 Fig. 10
This is a back-of-the-envelope estimation of the orientation of the columns visible at the main exposure along Jacksons Creek. I’m not going to talk about the mechanics of the analysis because there are some notes on the figure. The white ellipses, representing the ends of columns, tell a story too unbelievable to accept if the pictures weren’t telling the story. Within a few hundred yards (at most) from their contact with the land surface this basalt flowed over, they were cooling so uniformly that these elongate fractures formed. More unbelievable, the cooling joints are twisted. It gets more bizarre.
Figure 1 indicates a site called “Rosette Rock.” We went to take a look. Figure 11 shows what we found.
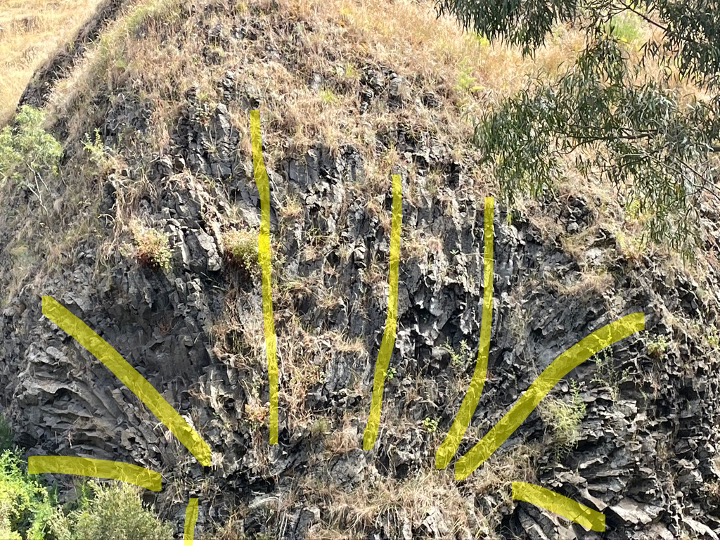 Fig. 11
For scale, this is an exposure of basalt approximately 50 feet in height, along Jacksons Creek. The yellow lines represent the directions of the cooling joints. I didn’t use ellipses because there was very little variation out of the plane orthogonal to an axis pointing at the observer. In other words, this is a wheel, with the joints radiating from a central point, a hub if you like. I have no more explanation of this now than I did when I first saw it in person. I don’t think anyone does. This makes Devil’s Tower look like a stick figure. We followed the creek to see these curious structures up close.
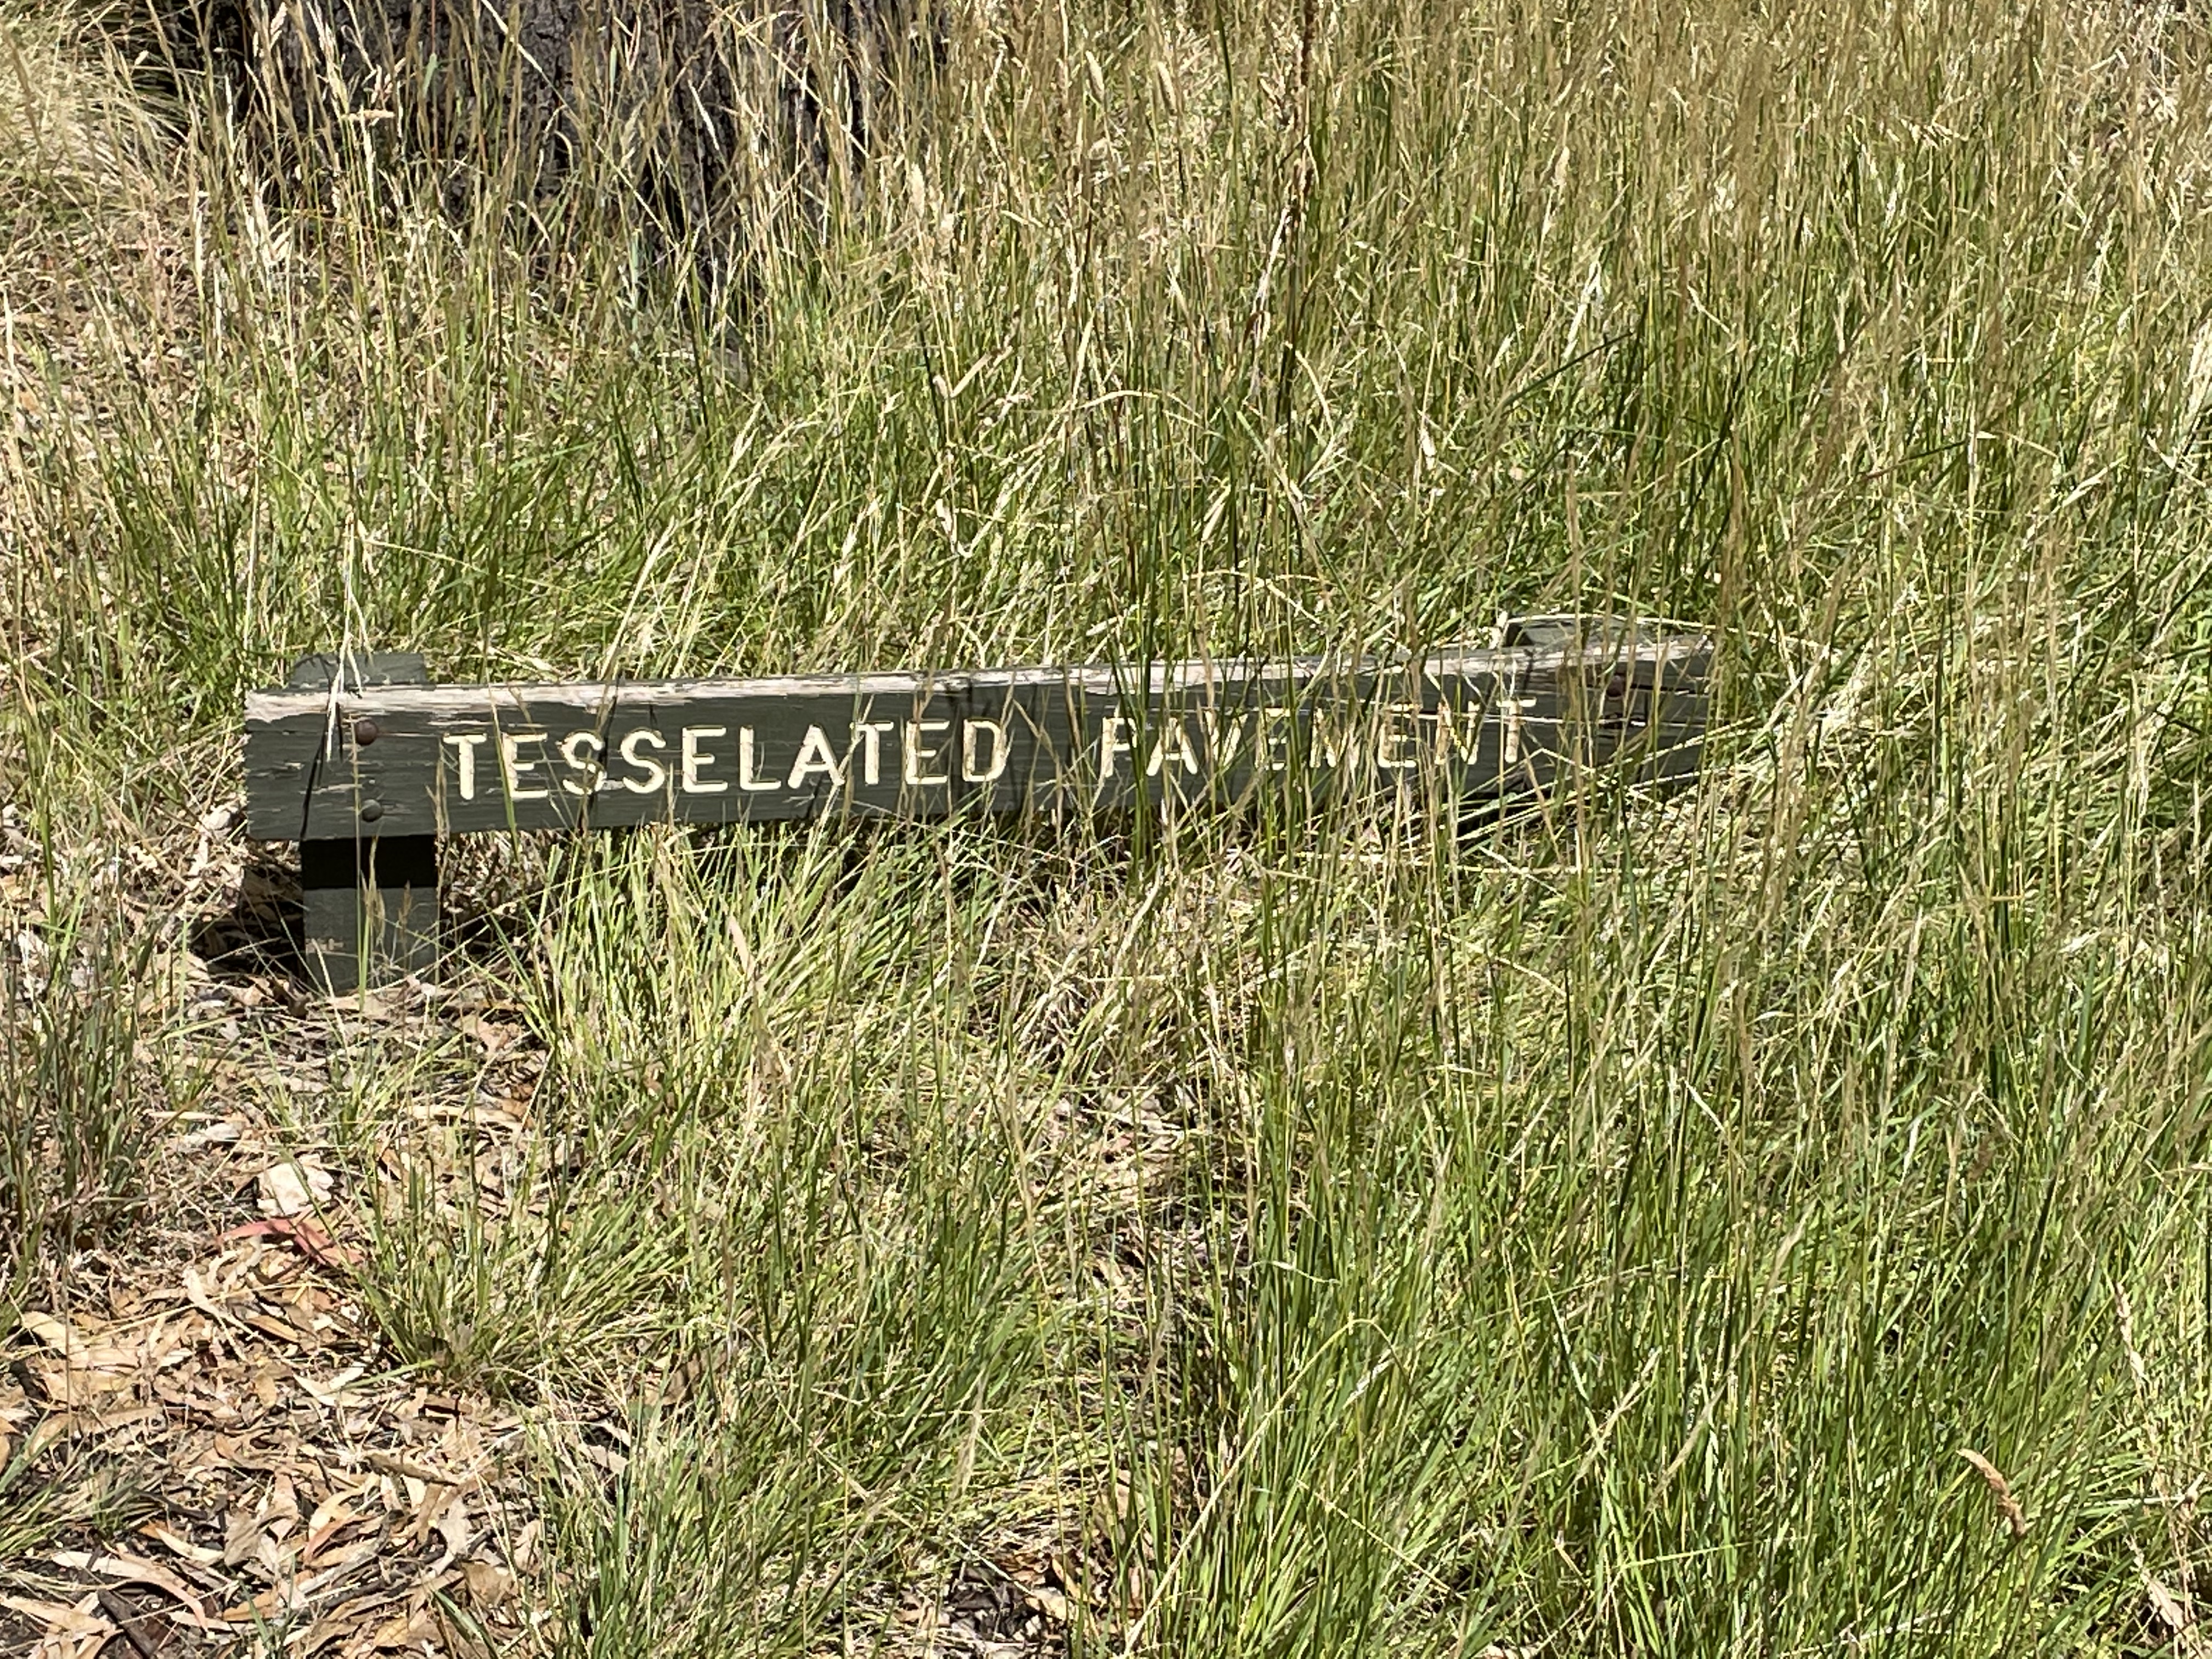 Fig. 12
About 500 yards upstream, around a meander (See Fig. 1), we came upon the “Tesselated Pavement” (Fig. 12), a “bedding plane” of the basalt probably created by the pounding of basalt boulders and pebbles over the millennia (Fig. 13).
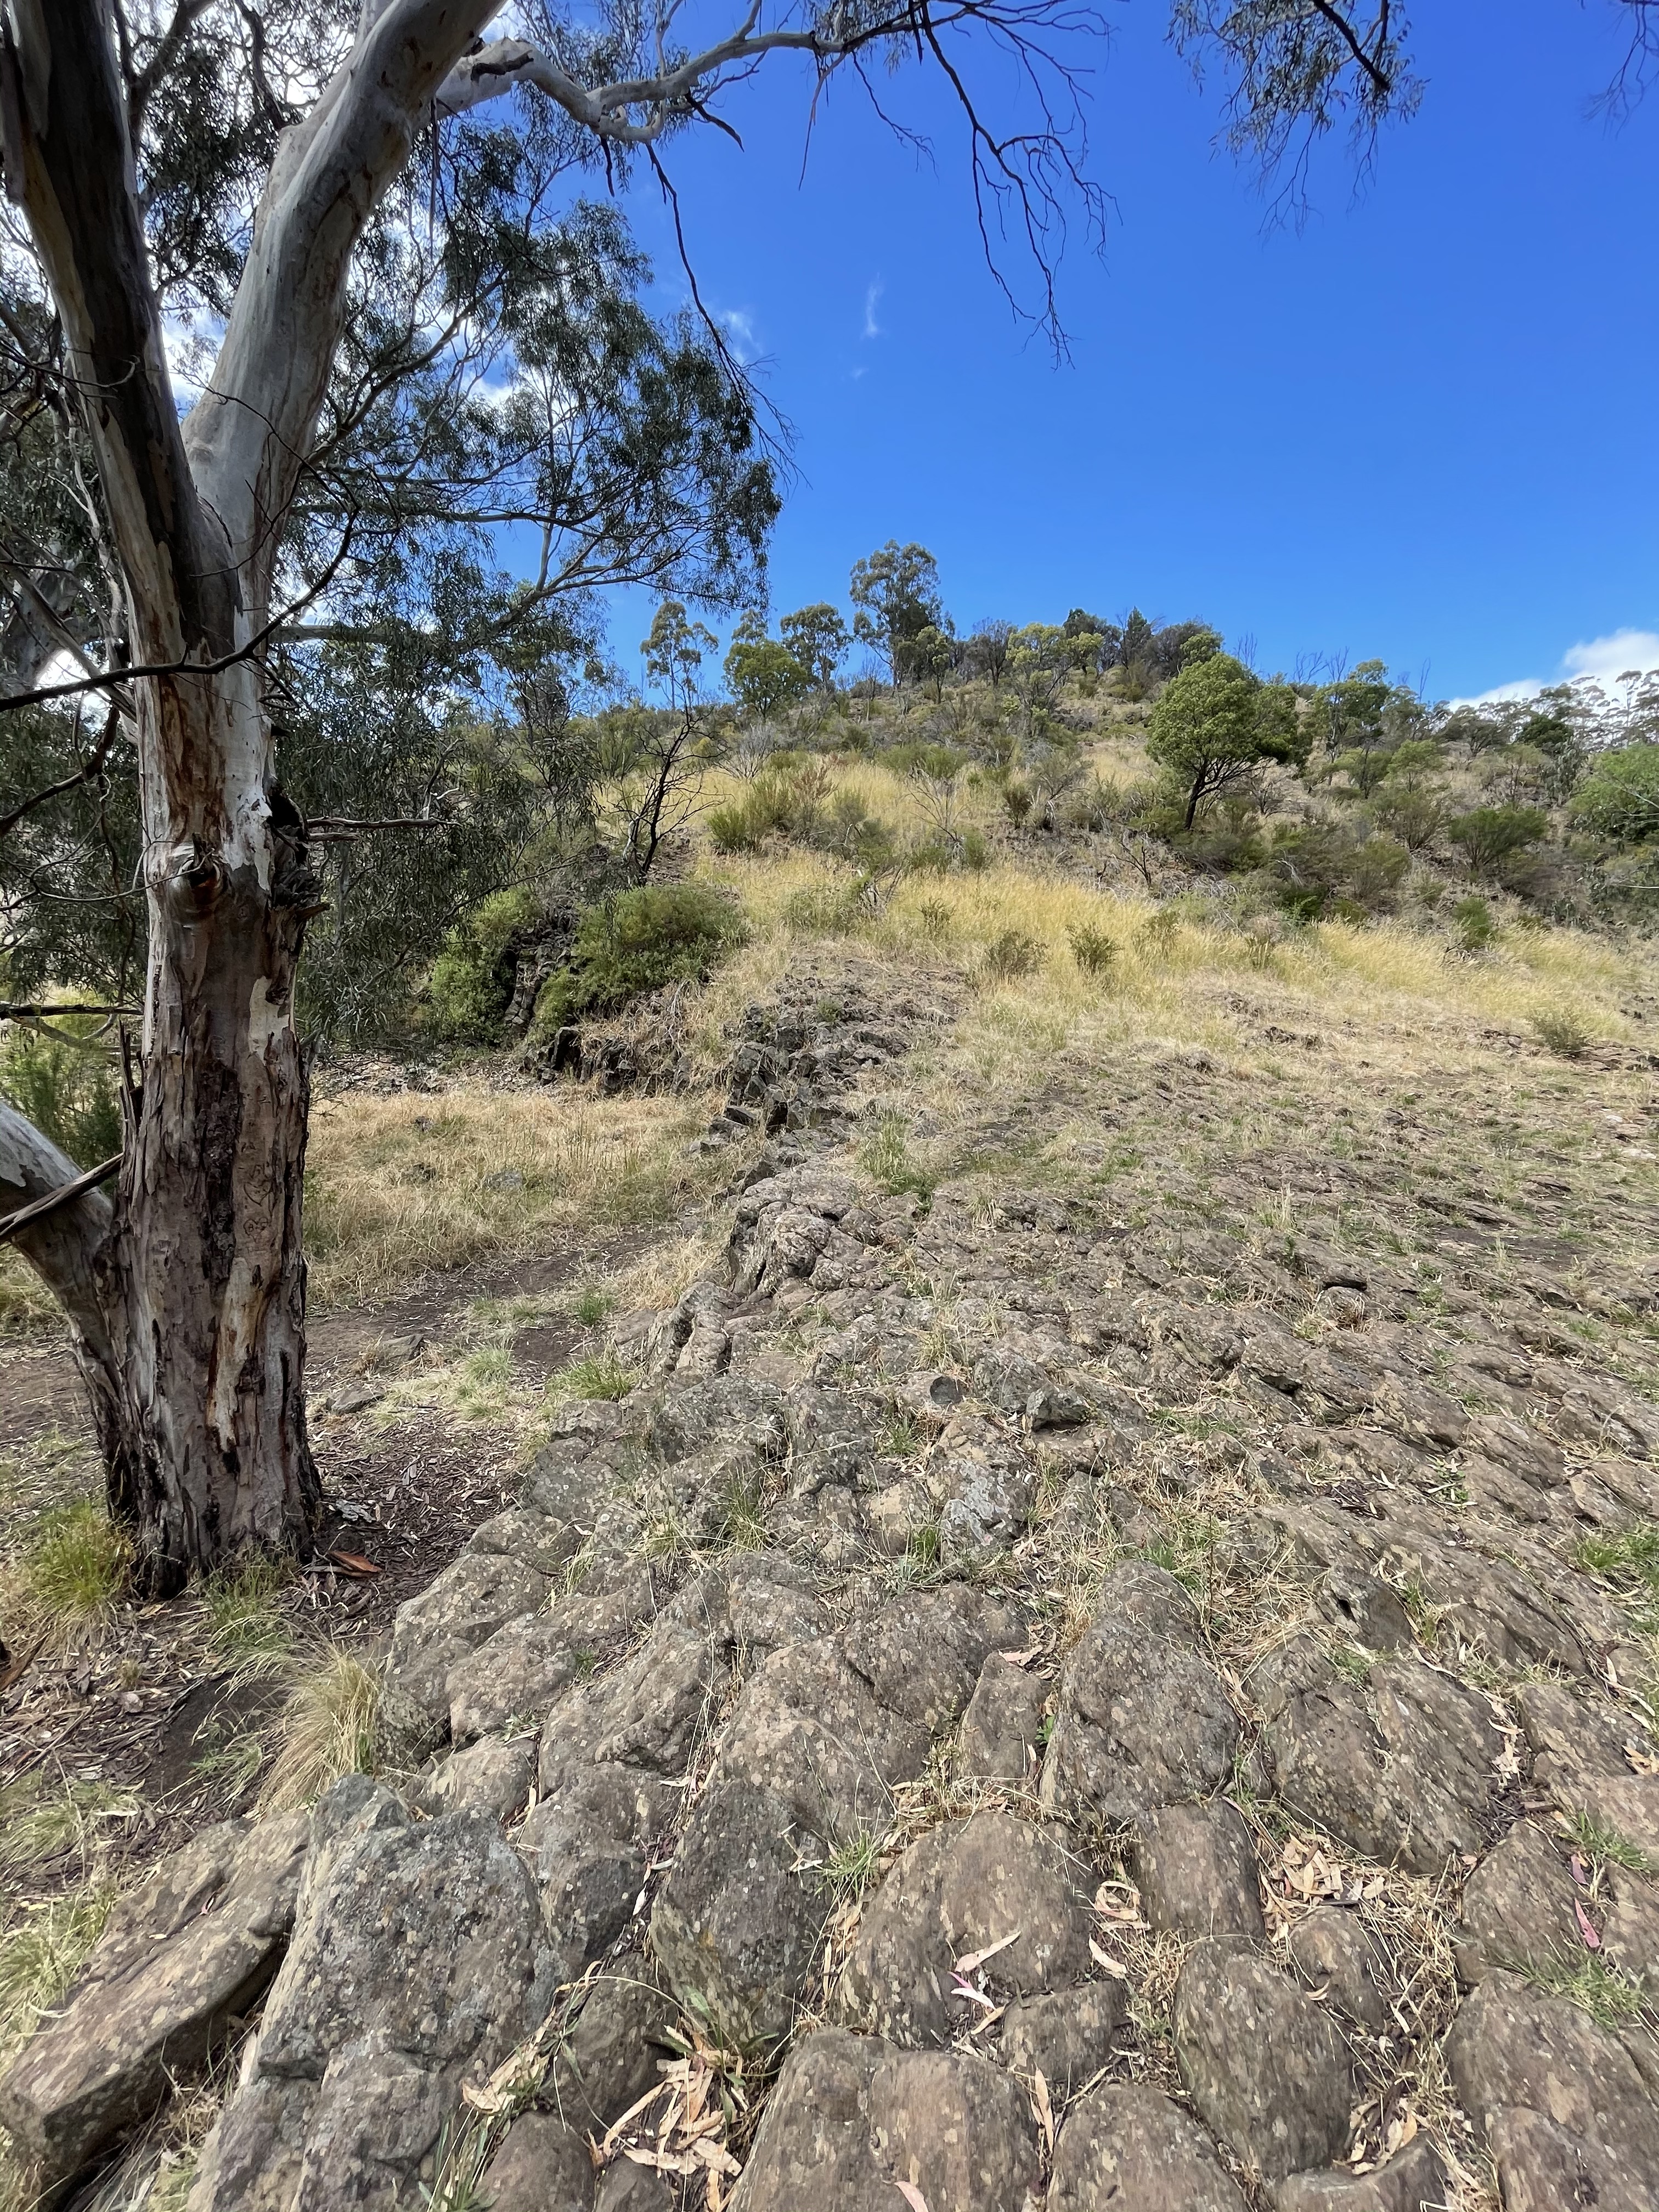 Fig. 13
This exposure seemed to be part of a resistant tongue protruding from the thick flows supporting the hill in the background of Fig. 13. There were several other such resistant tongues along a couple of hundred yards of Jacksons Creek’s quiet surface. The exposure in Fig. 13 was continuous with the massive outcrop seen in Fig. 14.
 Fig. 14
This rock wasn’t as columnar and it was fractured badly. It was threatening to collapse on the trail. The length of Jacksons Creek was a surreal geological experience. For example, the rocks shown in Fig. 14 were crumbling, yet there is no scree collected at the base of the low cliff. Very strange, especially in a protected national park. The smooth surface in Fig. 13 was less than 100 feet from Fig. 14 and at the same elevation, at creek level. Very strange. It’s as if someone built a scene for a movie but didn’t understand geological processes. Very strange, especially in a semiarid environment.
I looked for evidence of paleosol within the basalt, but all I found were irregular areas of remineralization (Fig. 15).
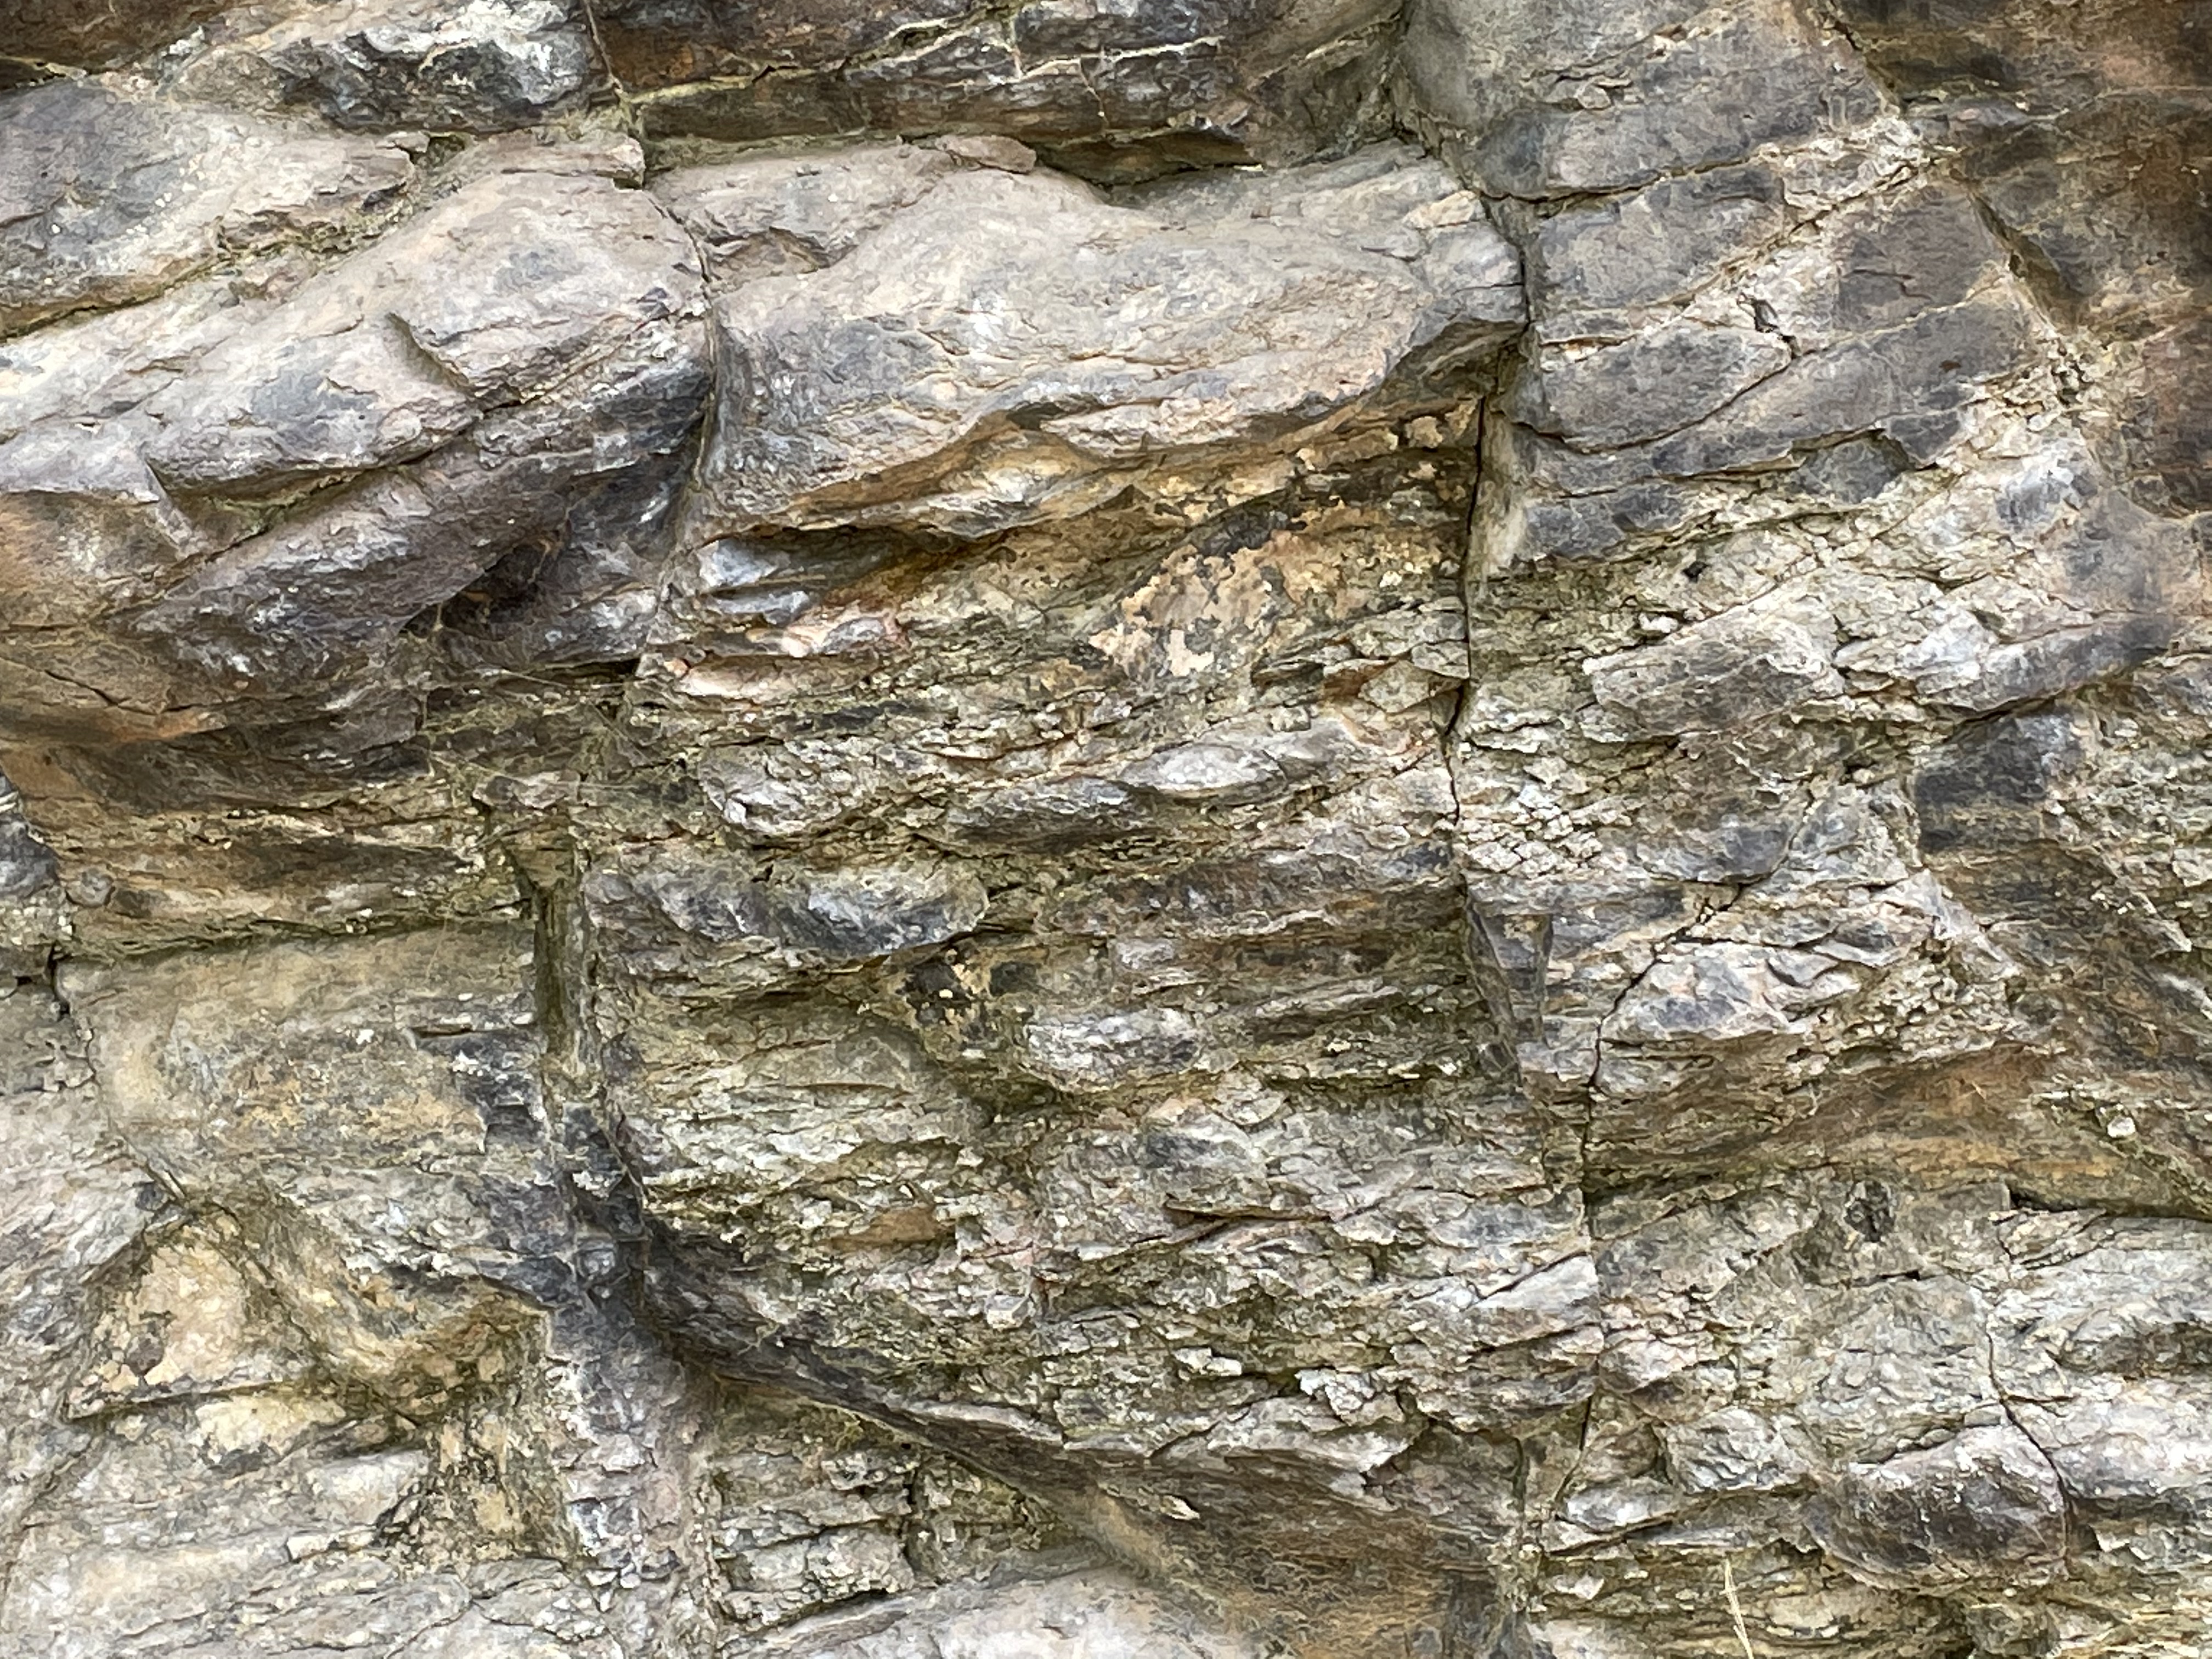 Fig. 15
This was either a single flow, or a series that occurred before weathering had proceeded enough to leave evidence. However, the erosional terrace seen in Fig. 9 suggests that there were multiple flows. We retraced our steps back to the top of the basalt flow at OPNP and noted changes in the rock that support rapid deposition of all of the basalts observed in the area.
Figure 16 reminds us of the columnar jointing deeper within the flow. Note the top of the photo shows the present surface.
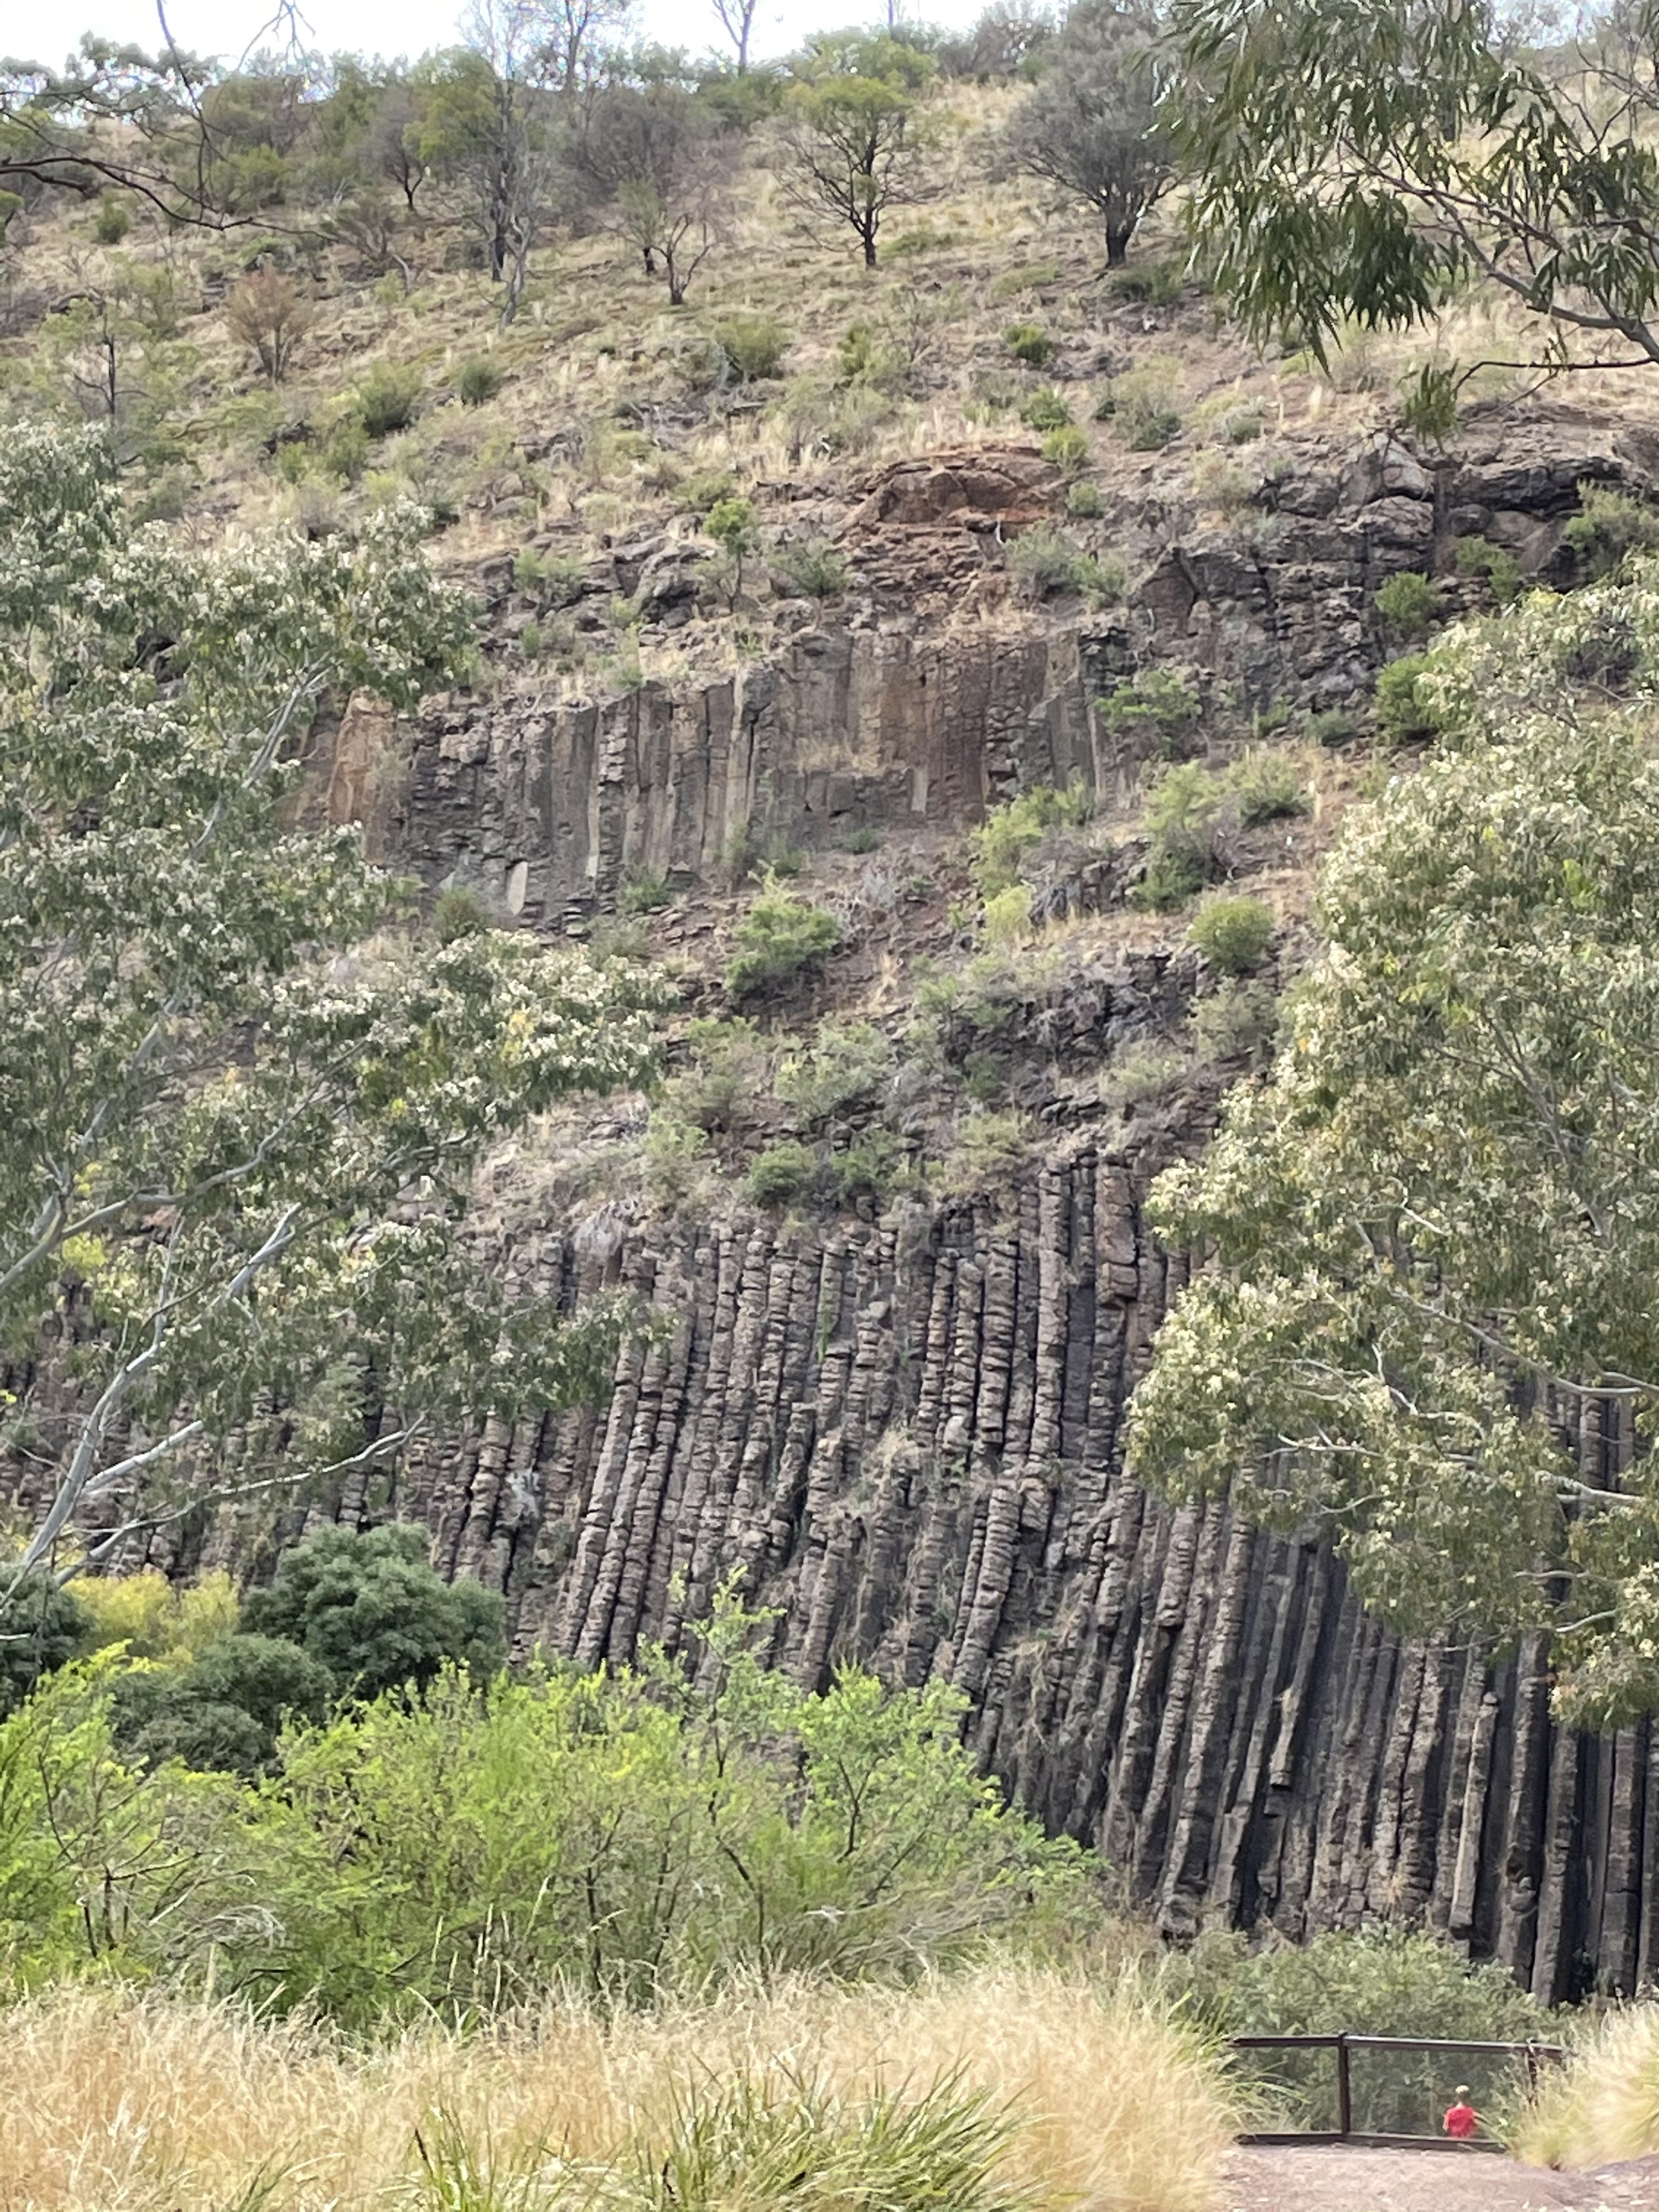 Fig. 16
Here are some photos of exposed basalt from near the top of the sequence (Fig. 17). Note brittle fractures (left photo), and thin bedding reminiscent of the blocks seen in Fig. 14, but weathered.

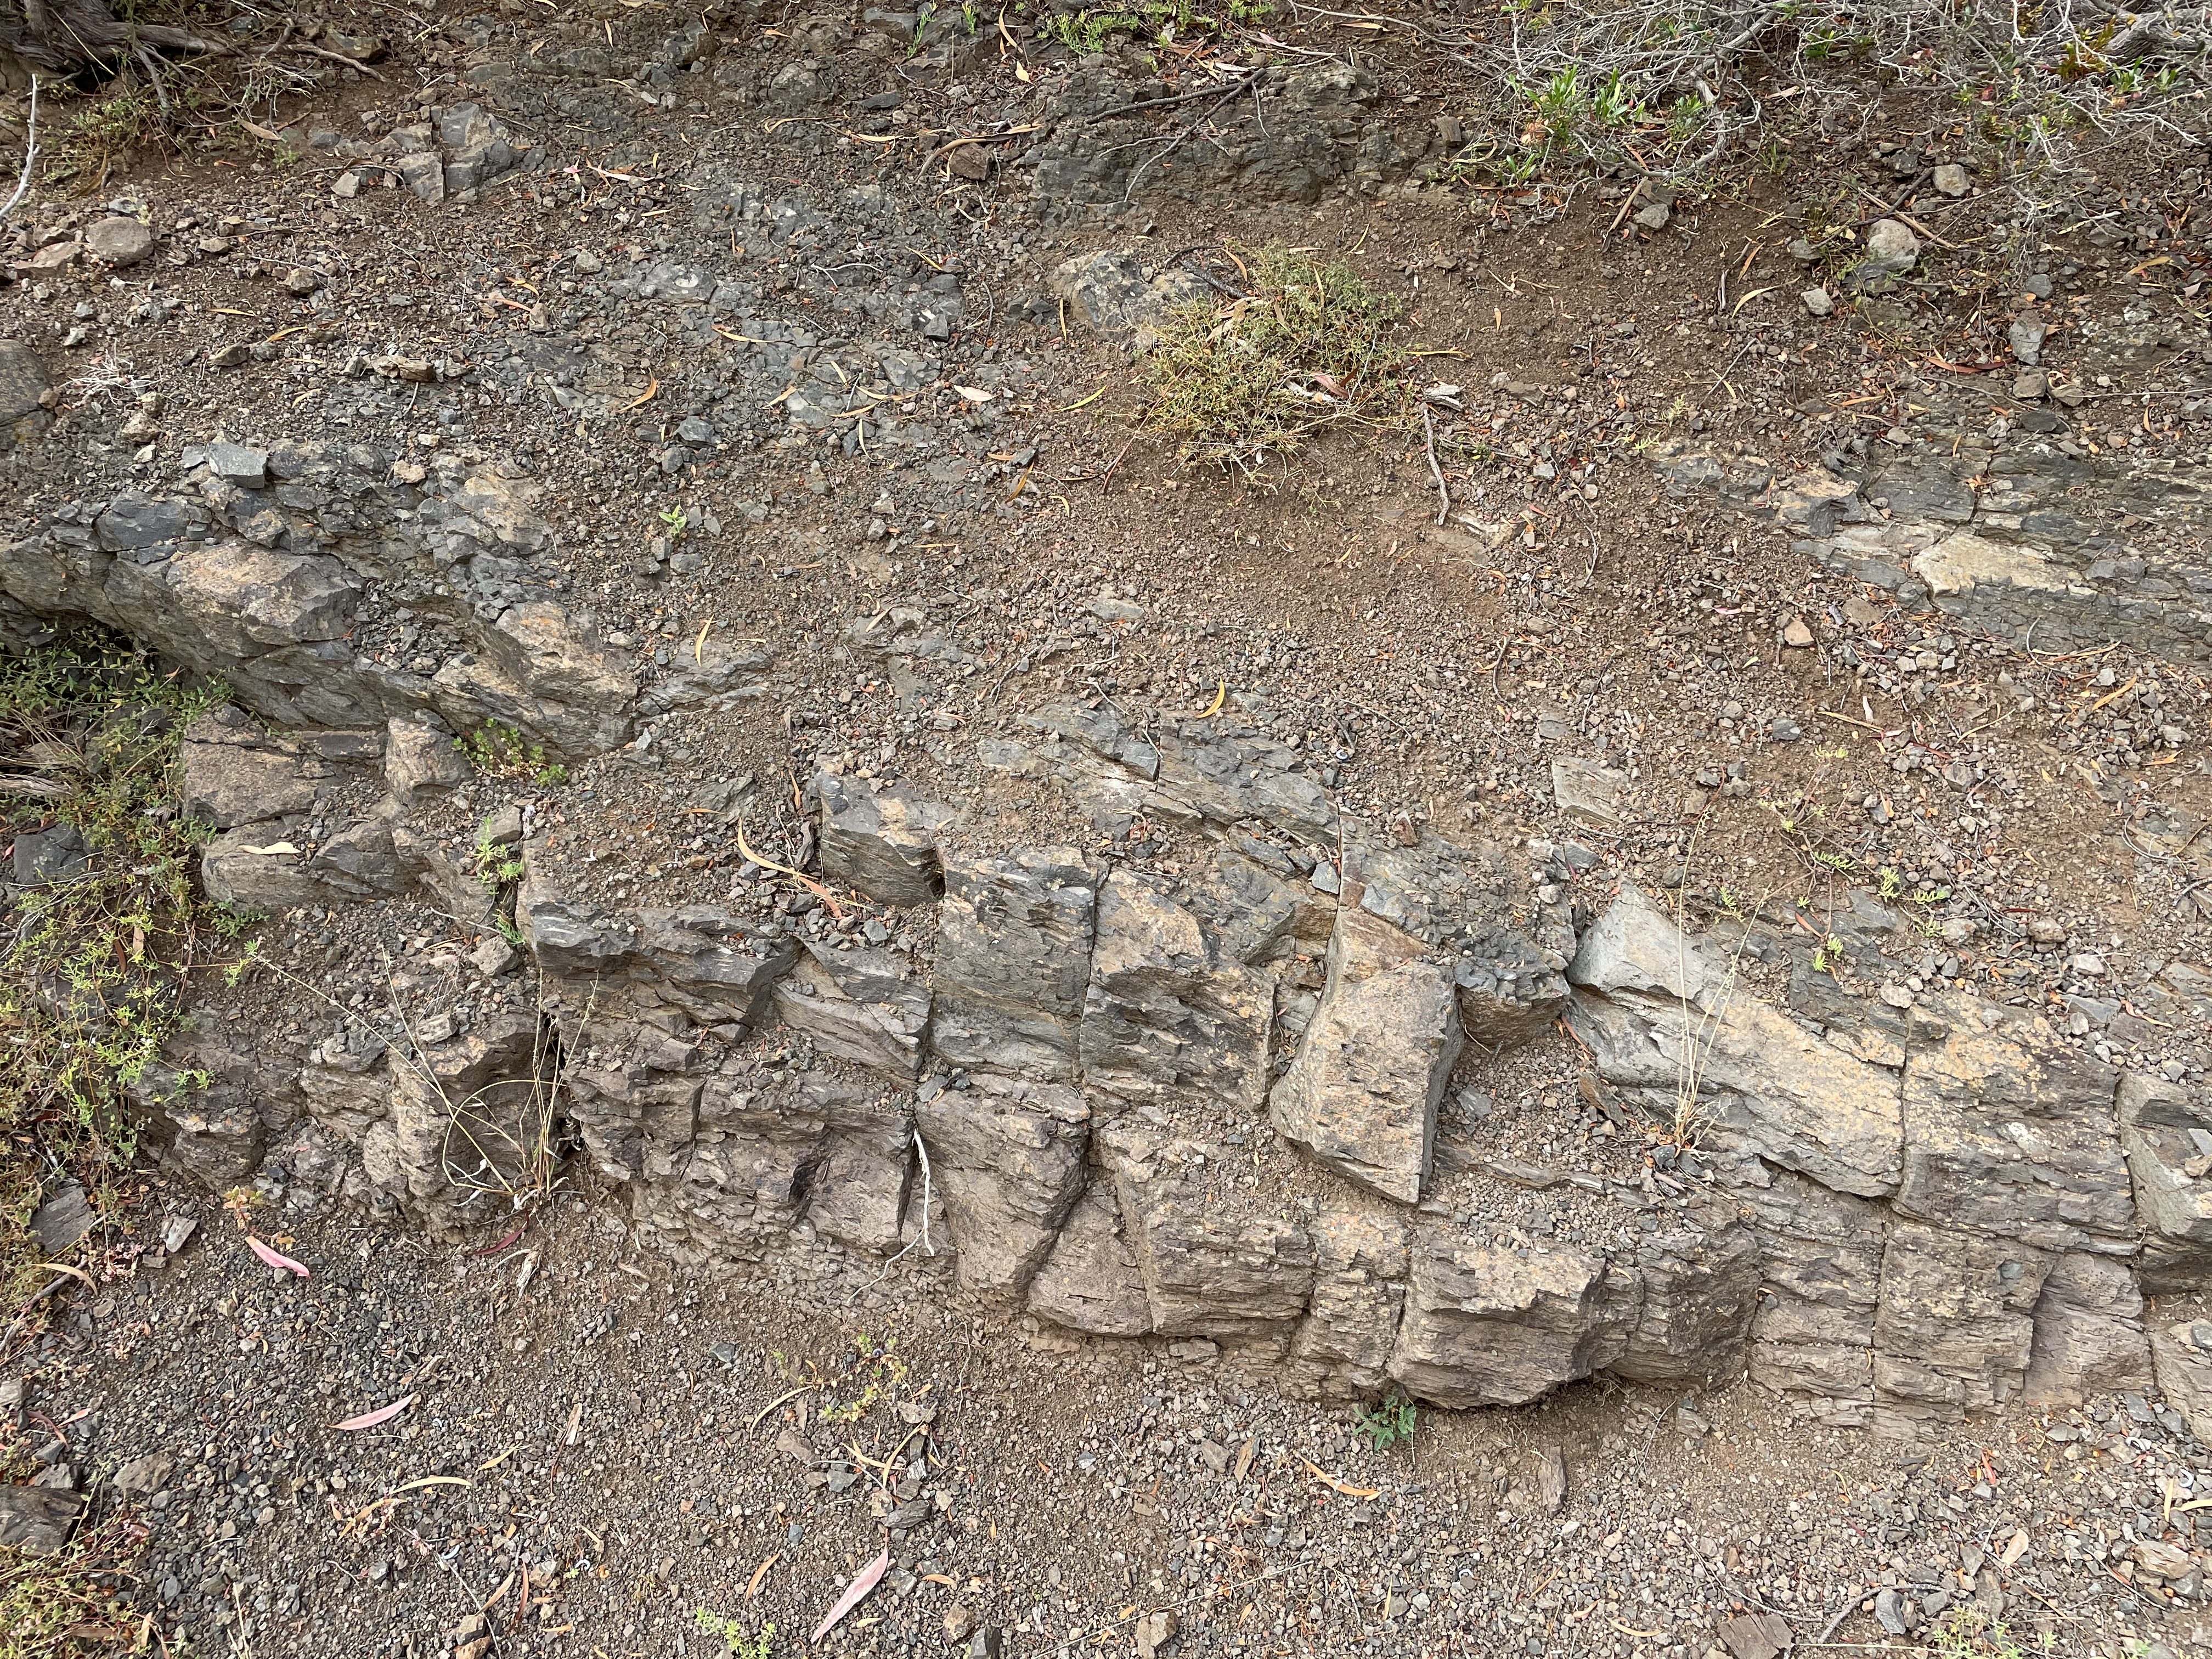 Fig. 17
A close-up view of the rocks seen in Fig. 17 reveals vesicles and a hint of depositional flattening, as if the lava were dense enough to condense (Fig. 18).
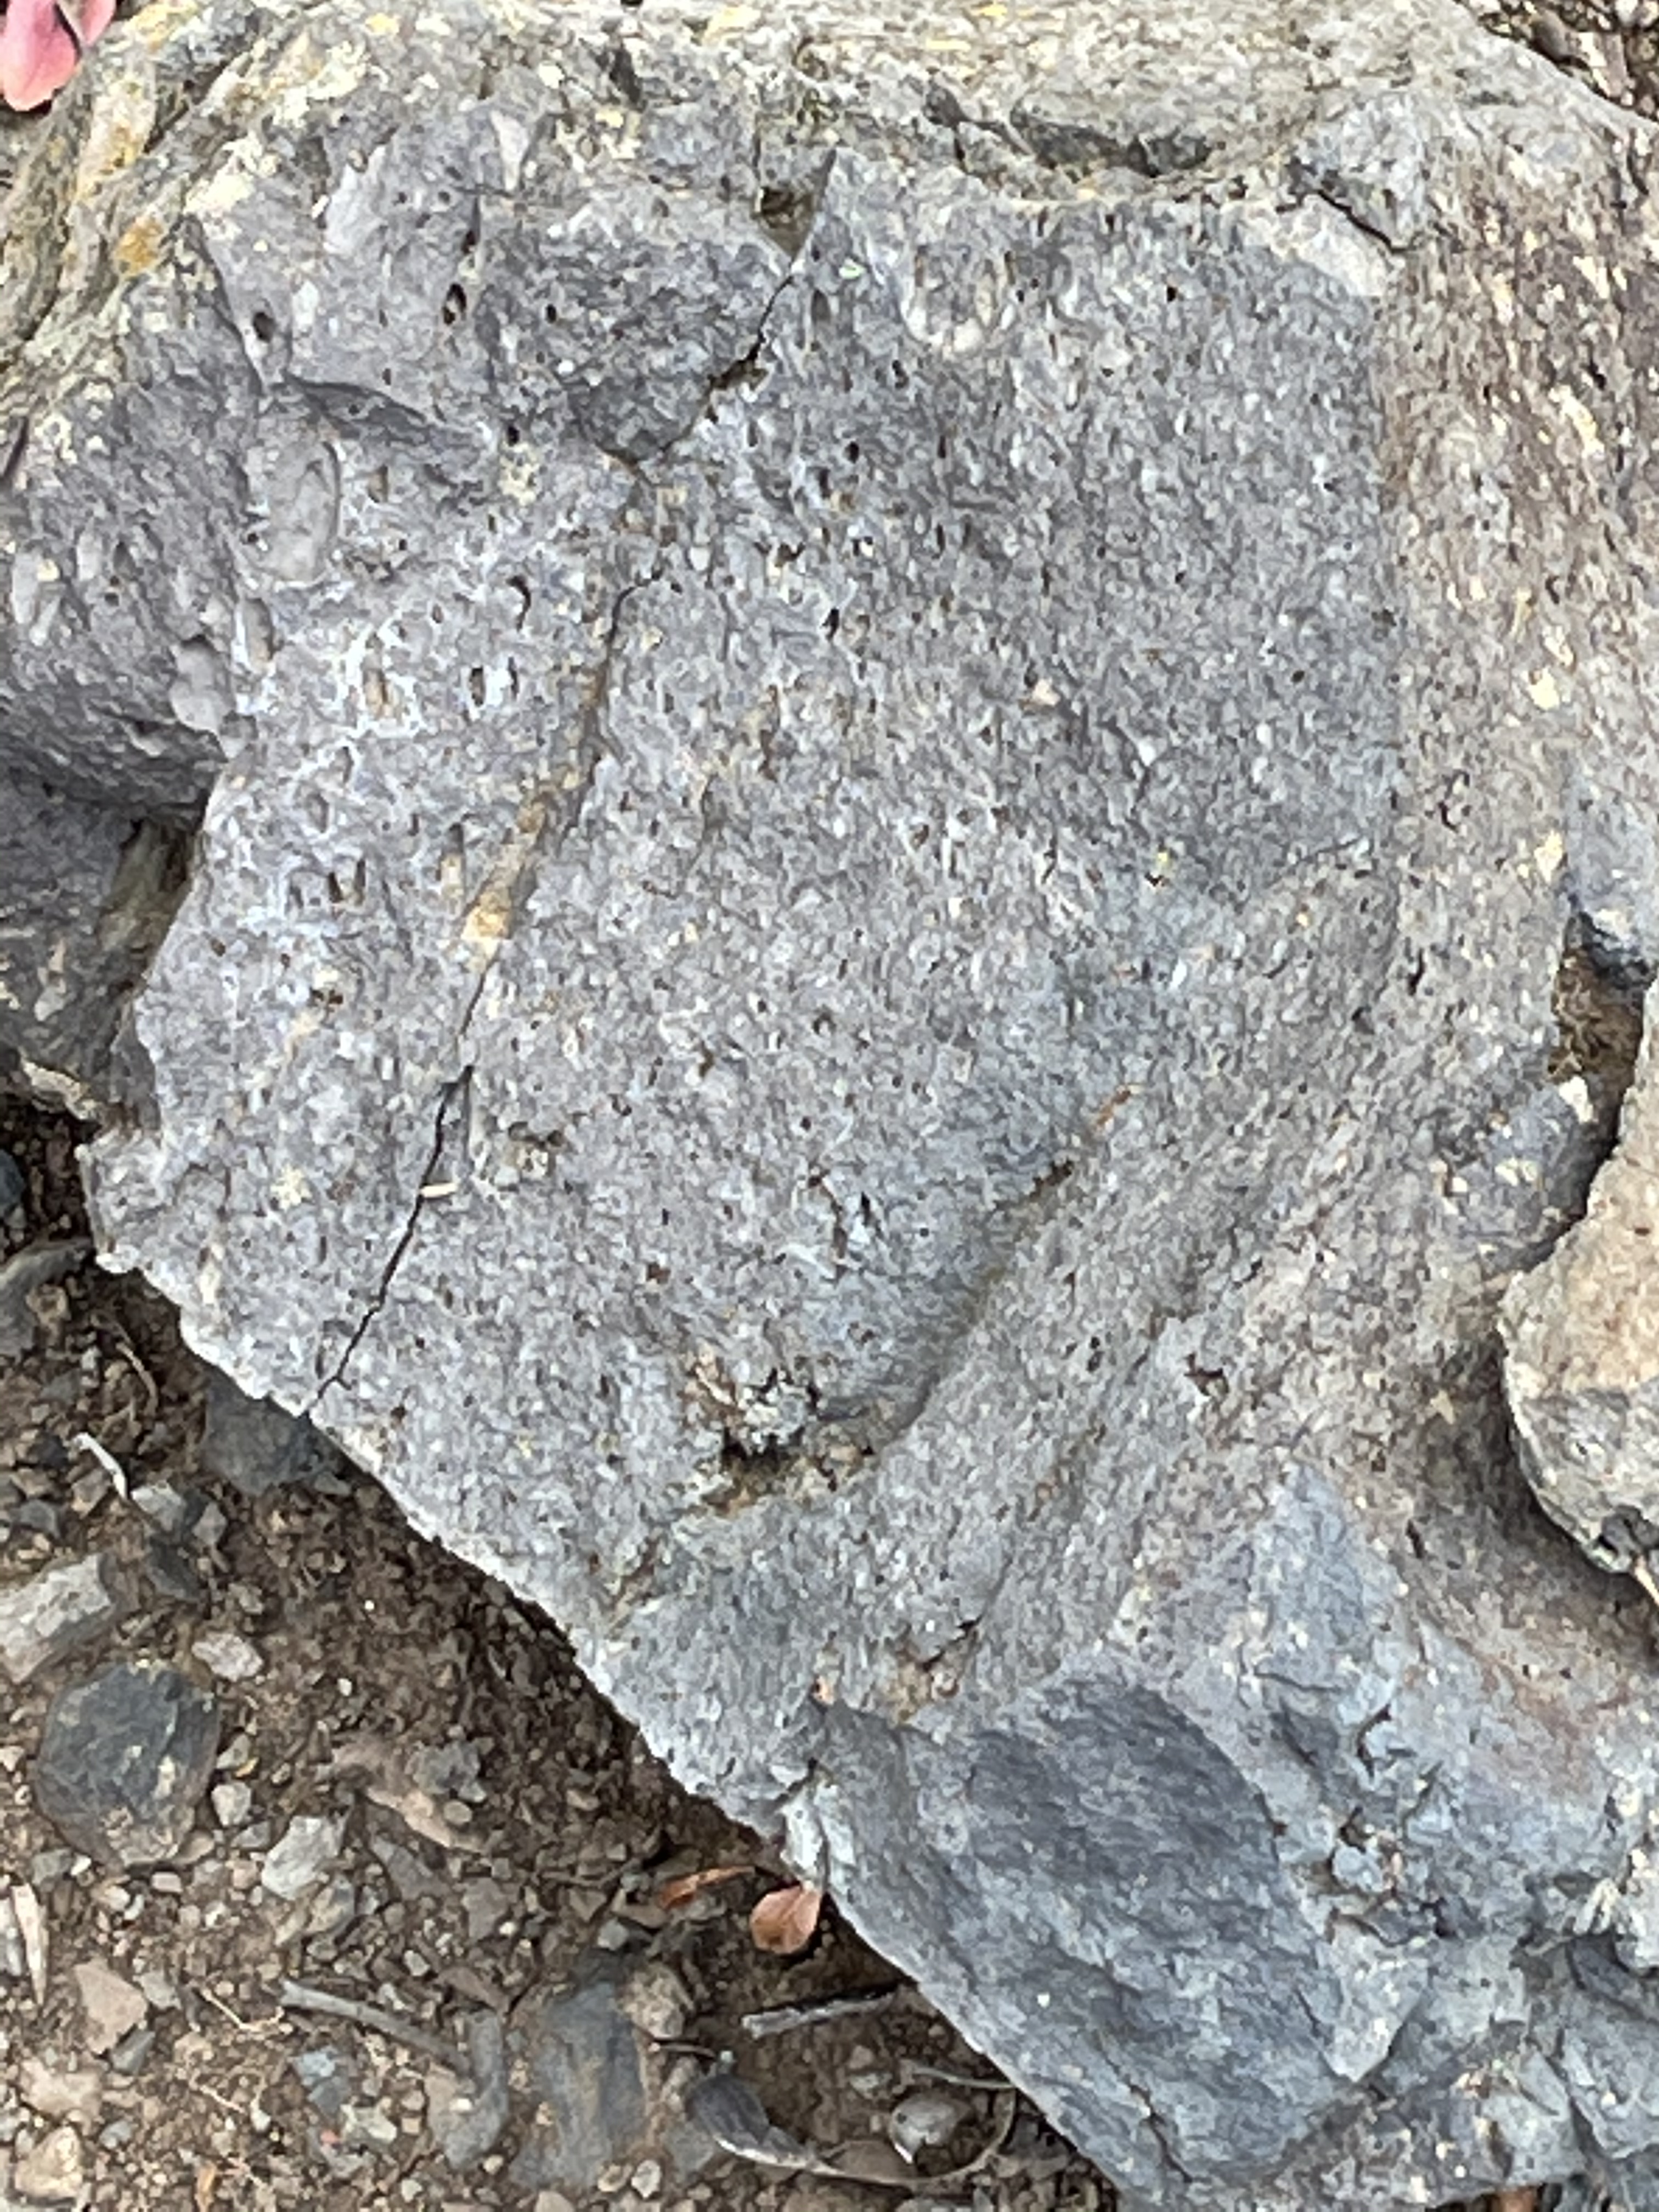 Fig. 18
At the top of the plateau, the basalt contains more vesicles and shows no sign of compression under its own weight (Fig. 19).
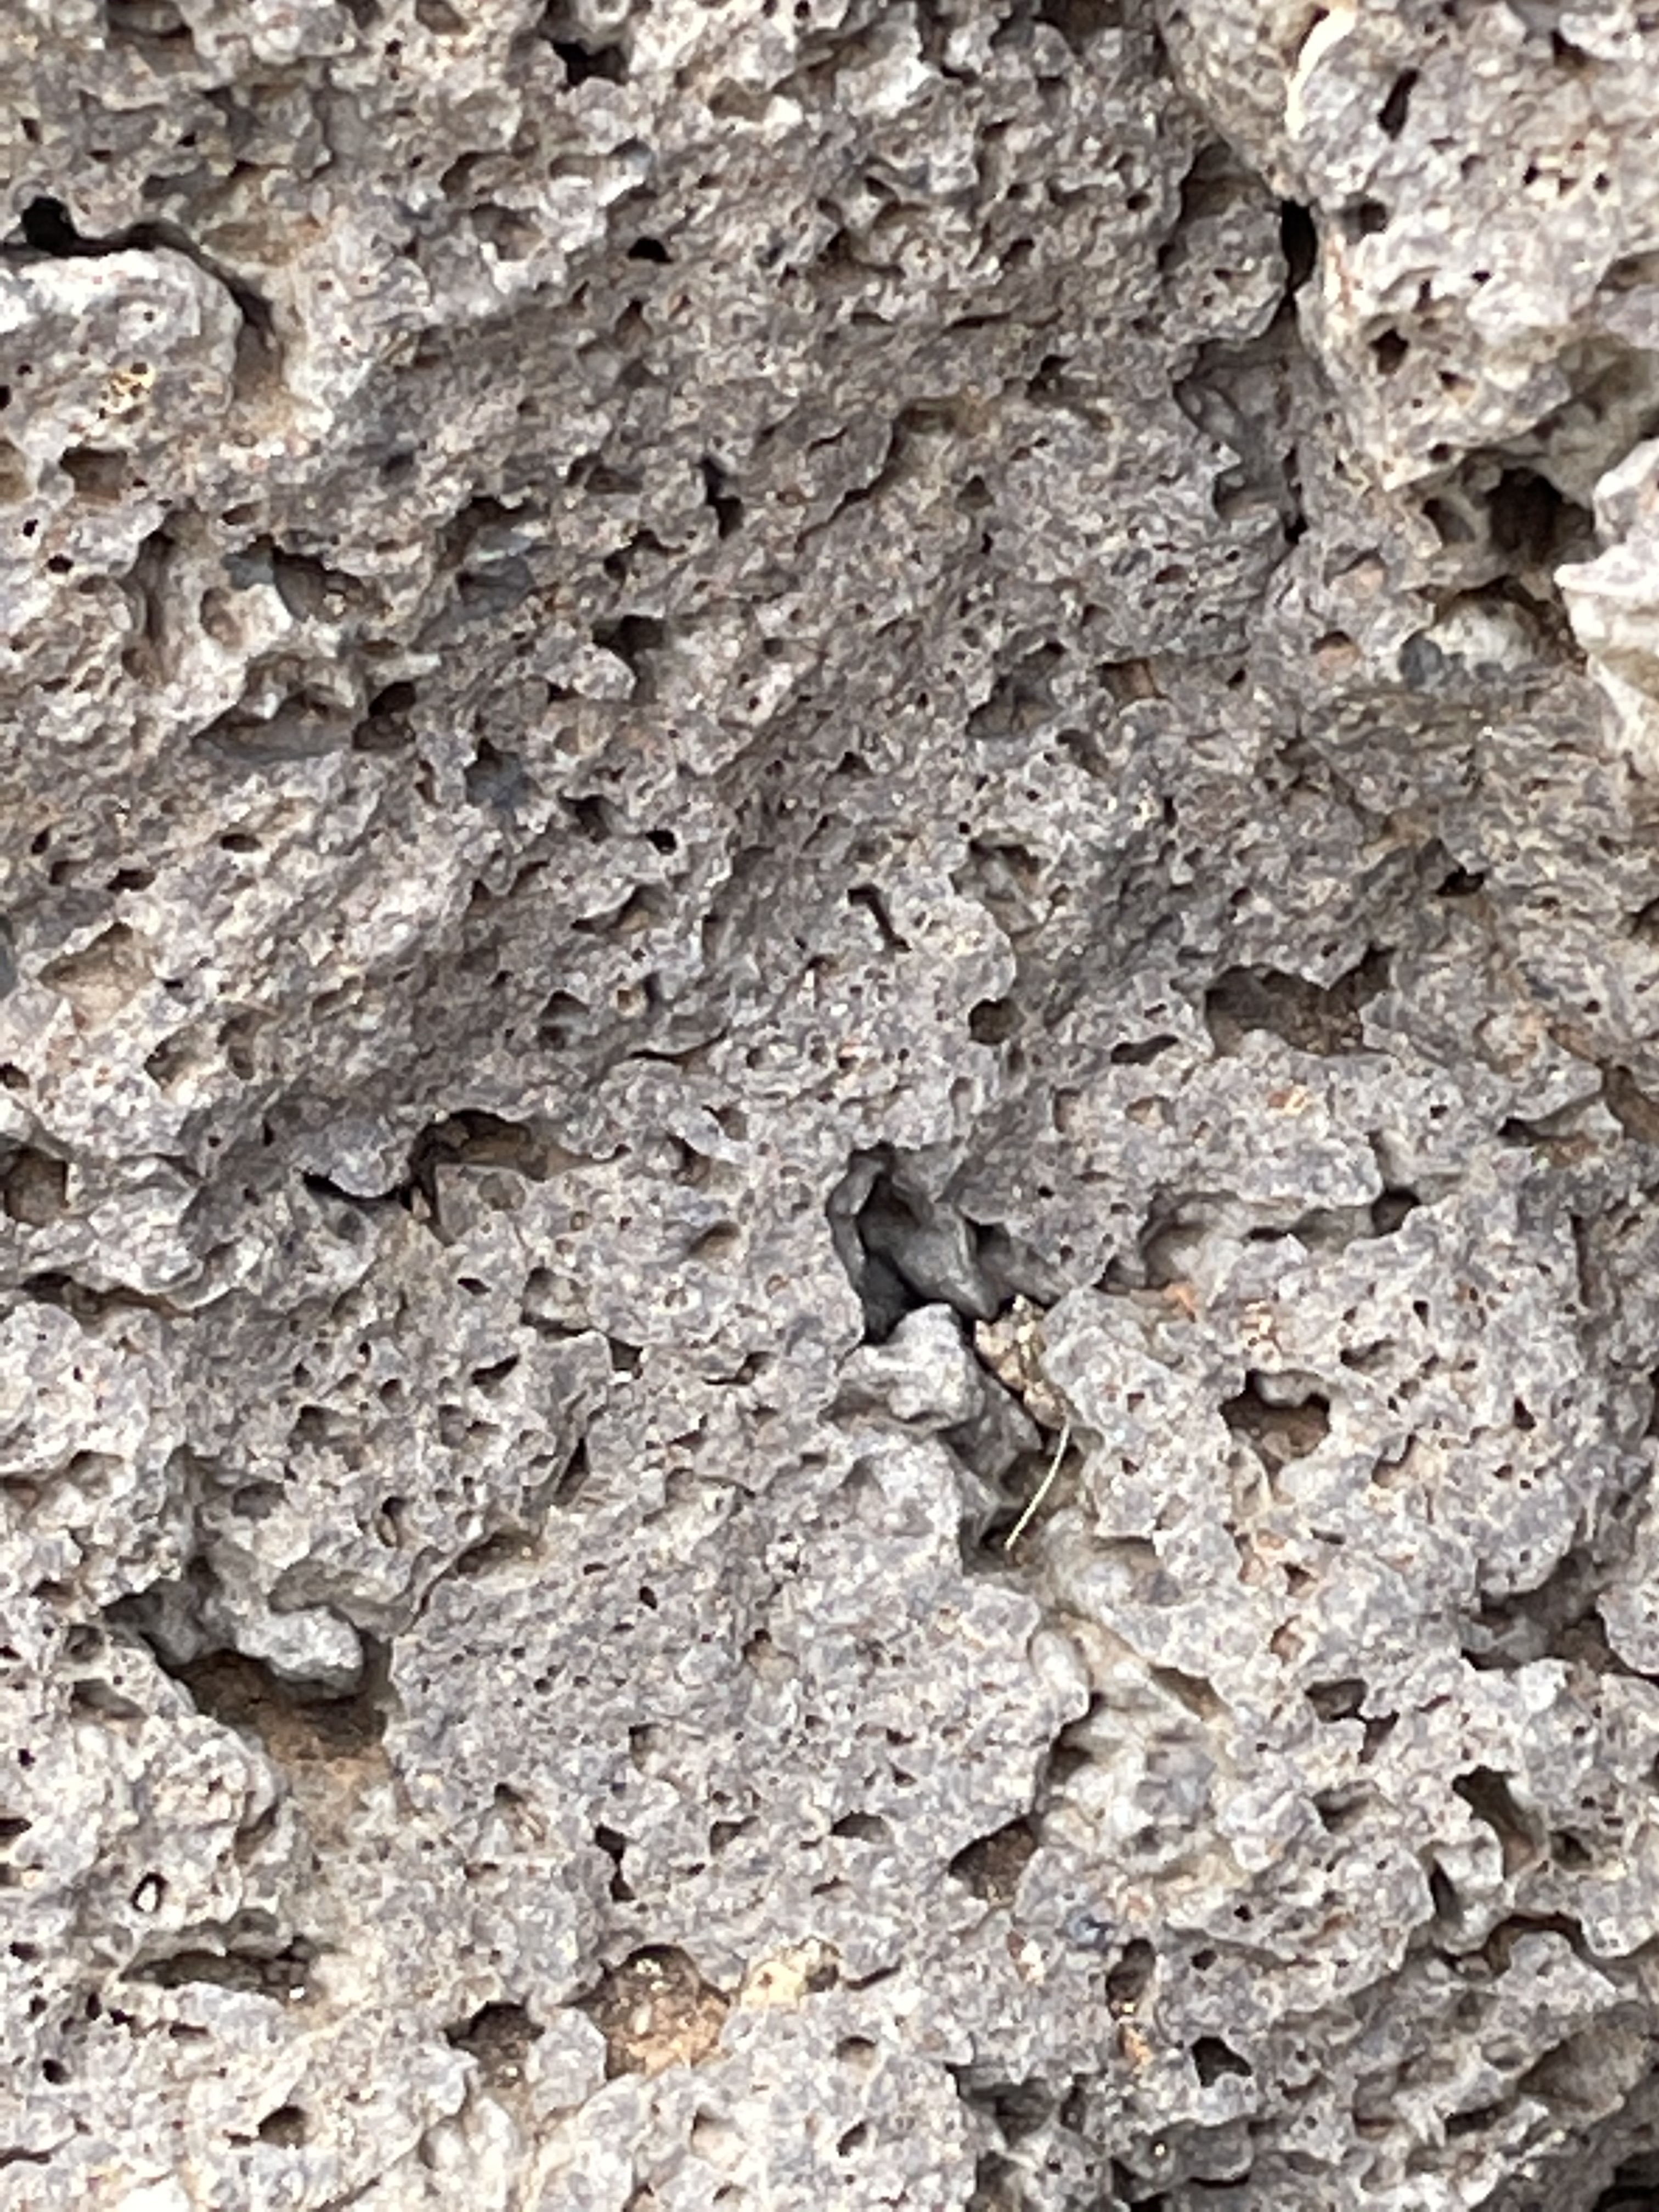 Fig. 19
To summarize this trip, which covered more than 400 million years, most of it unrecorded, what is today Organ Pipes National Park was a river plain that was buried before being deformed by the pressure of tectonic plates colliding to form Gondwana. This took several hundred million years. Whatever rocks were pushed up to form mountains were long gone, leaving an erosional surface not unlike that today, which was covered by lava flows that filled every gully, creek, and canyon in the area. Erosion had to begin again to erode Jacksons Creek anew. It seems to me that OPNP is filled with a single flow that ended with gaseous magma capping a fine-grained volcanic rock that cooled and later fractured by mechanisms that are not well understood.
The rocks tell us it is so.
Deformed Ordovician Nearshore Marine Rocks in Melbourne
We didn’t have to travel very far to observe an interesting geologic exposure, on the outskirts of Melbourne. We went to Yarra Bend Park, situated along the banks of the Yarra River, where a small stone dam creates some rapidly flowing water.
 Fig. 1
Our location in Fig. 1 is at the confluence of the Yarra River and Merri Creek, the smaller stream on the left (western) side of the map, where the highway first enters the park area (colored in the map). The Yarra is a meandering river here and reverses direction, thus the name of the area (Yarra Bend). There is an exposure of interbedded sandstone and mudstone along the southern bank of the river, at the entrance to the park, near an observation deck. Figure 2, taken from the northern bank shows the exposure nicely.
 Fig. 2
A plaque mounted on the observation deck summarizes the geologic history of the area (Fig. 3).
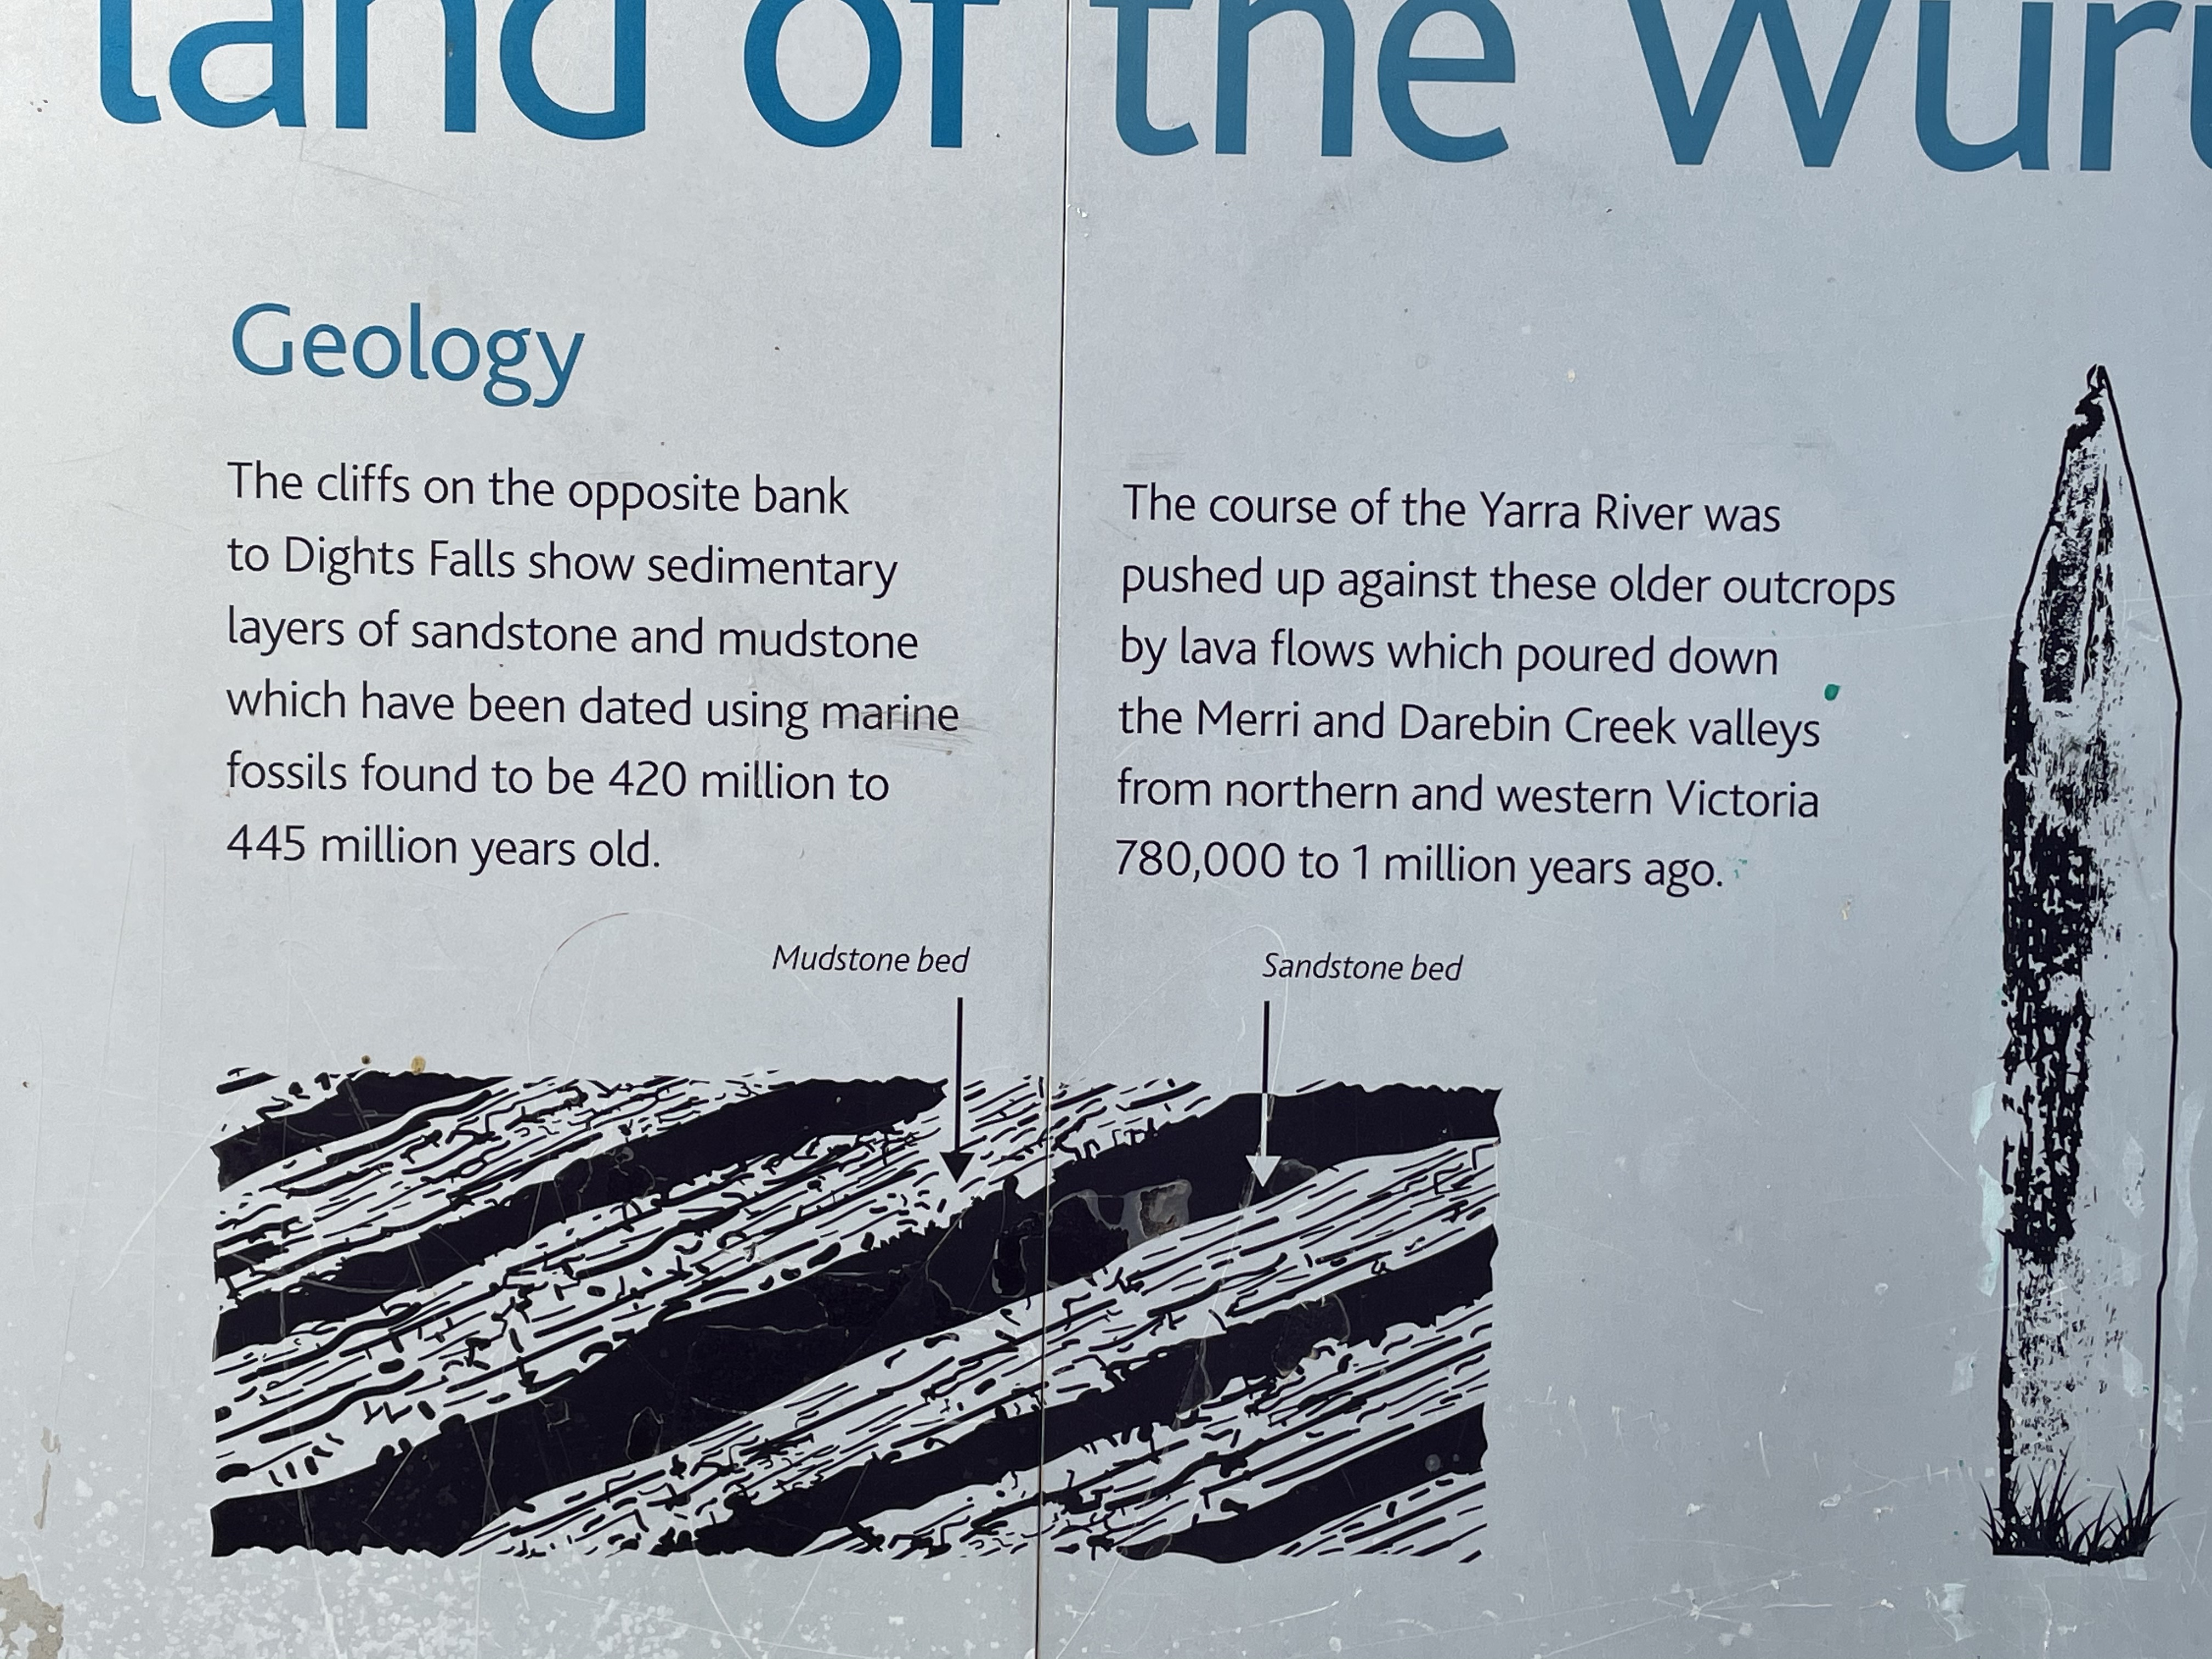 Fig. 3
  Fig. 4
The dark and light layers in Fig. 3 schematically represent the tilted sandstone/mudstone sequence seen across the river in Fig. 4. However, there’s more going on than that. Let’s look at the geologic map to get an idea (Fig. 5).
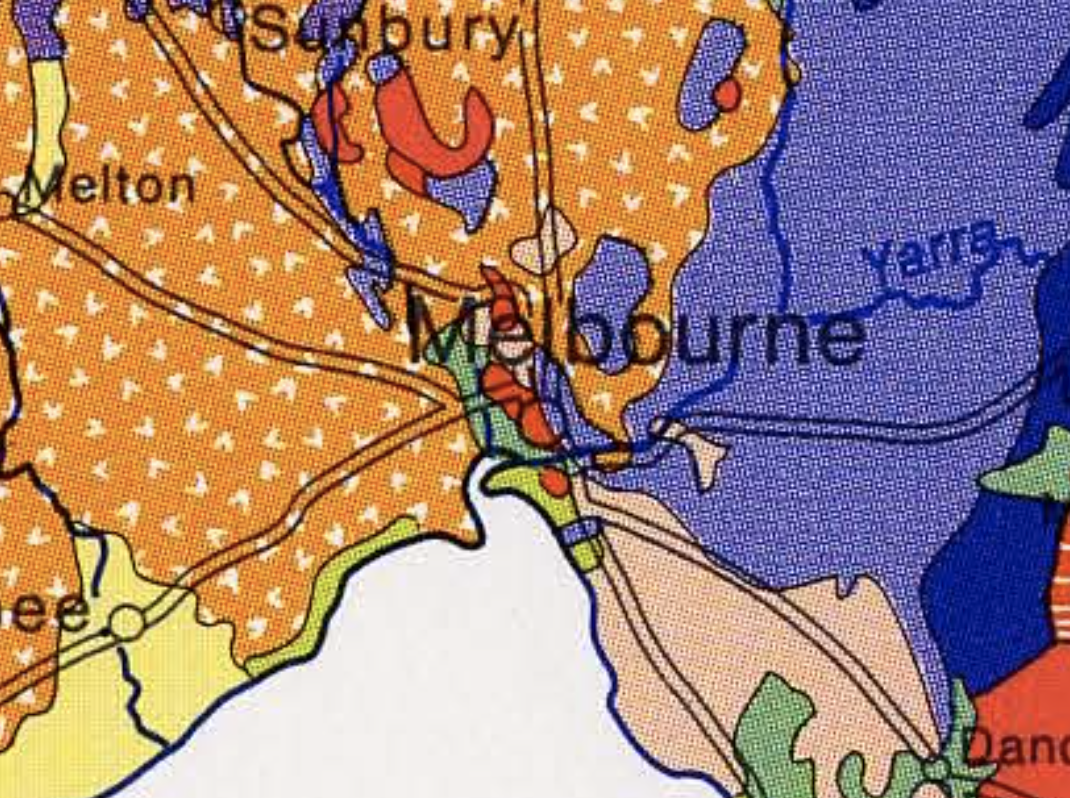 Fig. 5
This report describes rocks ESE of Melbourne, where the orange (volcanic) rocks are in contact with the purple sedimentary rocks in Fig. 5. Yarra Bend park is located where the volcanic rock field forms a point that touches the main road (below the “o” in Melbourne). A previous post identified some older basalts along the coast to the SW, but those were about 30 MY old. These are much younger. They came from a volcanic field to the west, as suggested by the massive field of volcanic rocks west of Melbourne (see Fig. 5). In other words, Yarra Bend is at the eastern edge of a volcanic flow. There were no exposures of these basalts in Yarra Bend, however, because the rocks had eroded to form slopes and a black soil. Figure 6 shows some loose boulders used to reinforce the bank of Merri Creek under a highway overpass.
 Fig. 6
They ranged from a few feet across to the size of a small car.
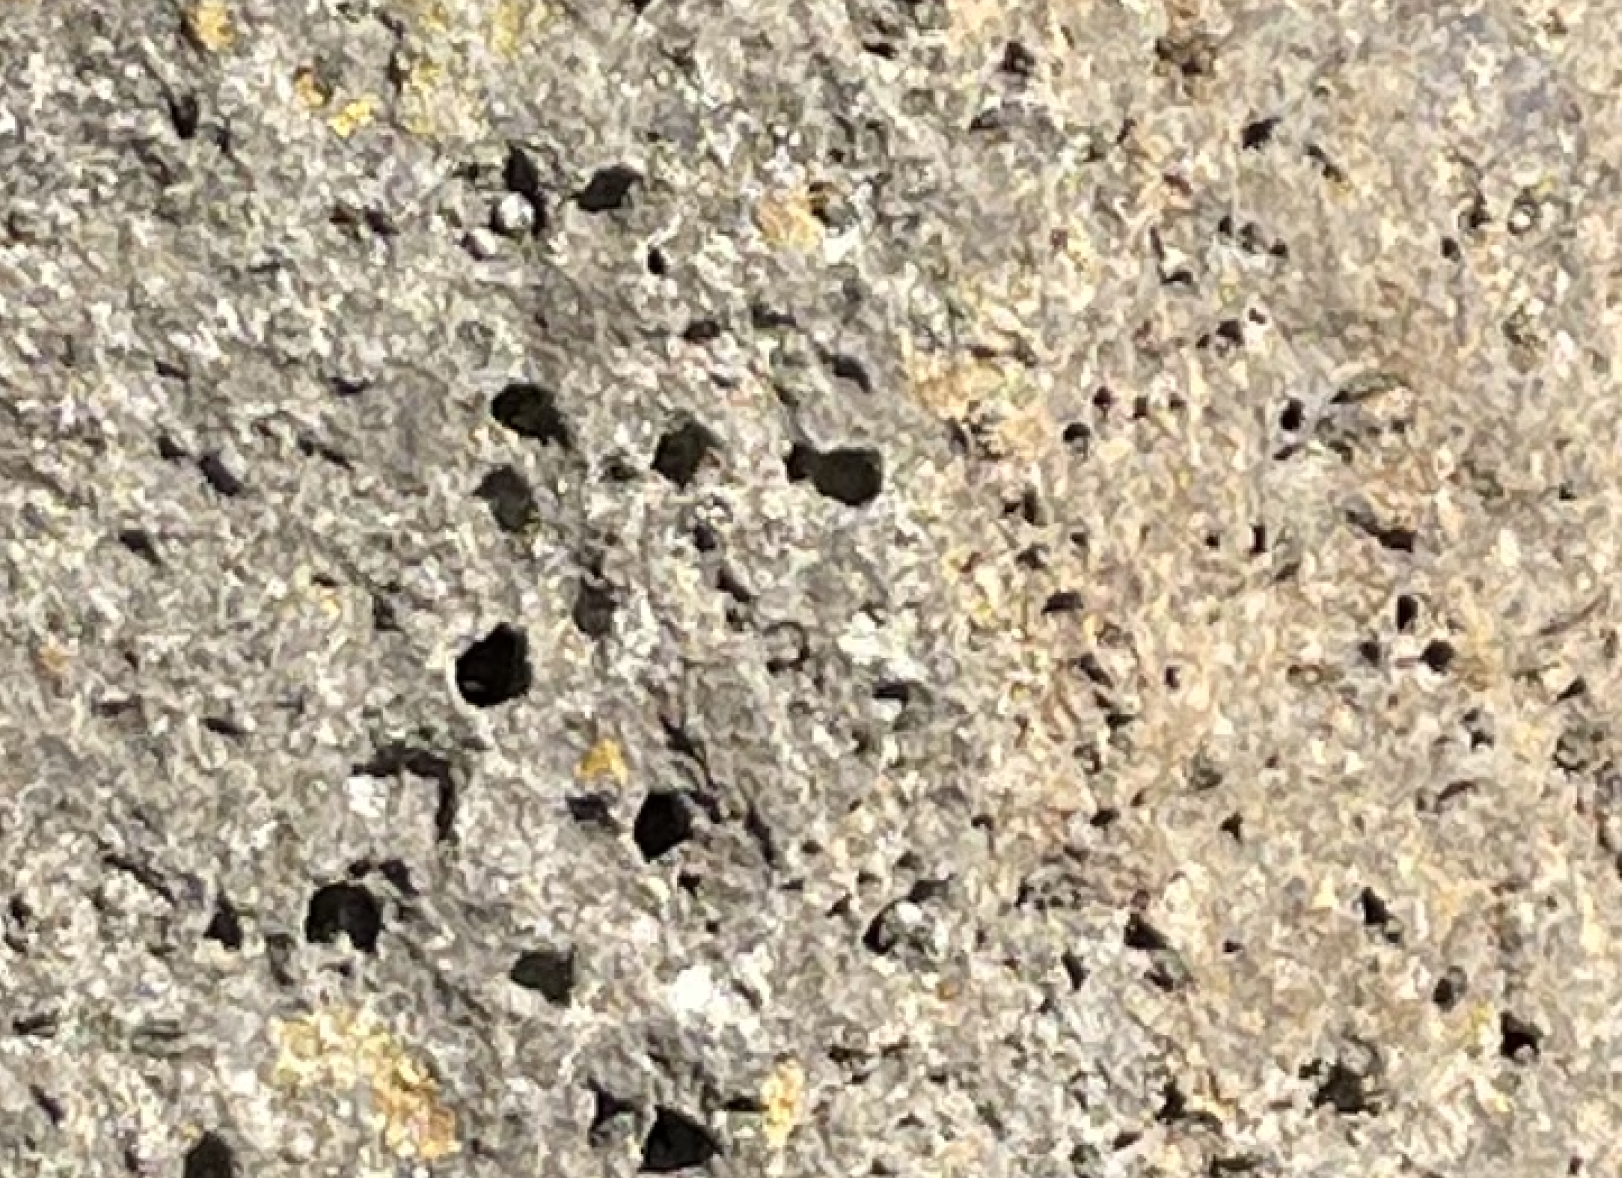 Fig. 7
Figure 7 is a close-up of a boulder. Note the holes (vesicles), suggesting this was a gaseous basalt. Large phenocrysts are not visible. The rusty surface suggests that the lava contained significant iron-bearing minerals (probably amphiboles or pyroxenes). There is no evidence of older sedimentary rocks on the north side of the river. In fact, elevations are much lower on the north side. Thus, the north and south banks of the Yarra River have completely different geology. According to the sign (Fig. 3), the basalts redirected the river against the bluffs to the south, implying that the different geomorphology existed at that time.
We drove to the south bank of the river and parked the car at the top of a ridge (seen in the background of Fig. 2), on a paved road less than a hundred feet above the river. We walked along the paved road that led down to the river, following a footpath (dash-dot line in Fig. 1) to the river at the extreme left of Fig. 1. Ridges of resistant rock formed the northward pointing headlands that defined the river’s meanders.
The ridge where we parked was directly underlain by thin-bedded sandstone/mudstone beds tilted in a generally SE direction (no strikes or dips were measured). However, small-amplitude folds were visible (Fig. 8, looking to the north).
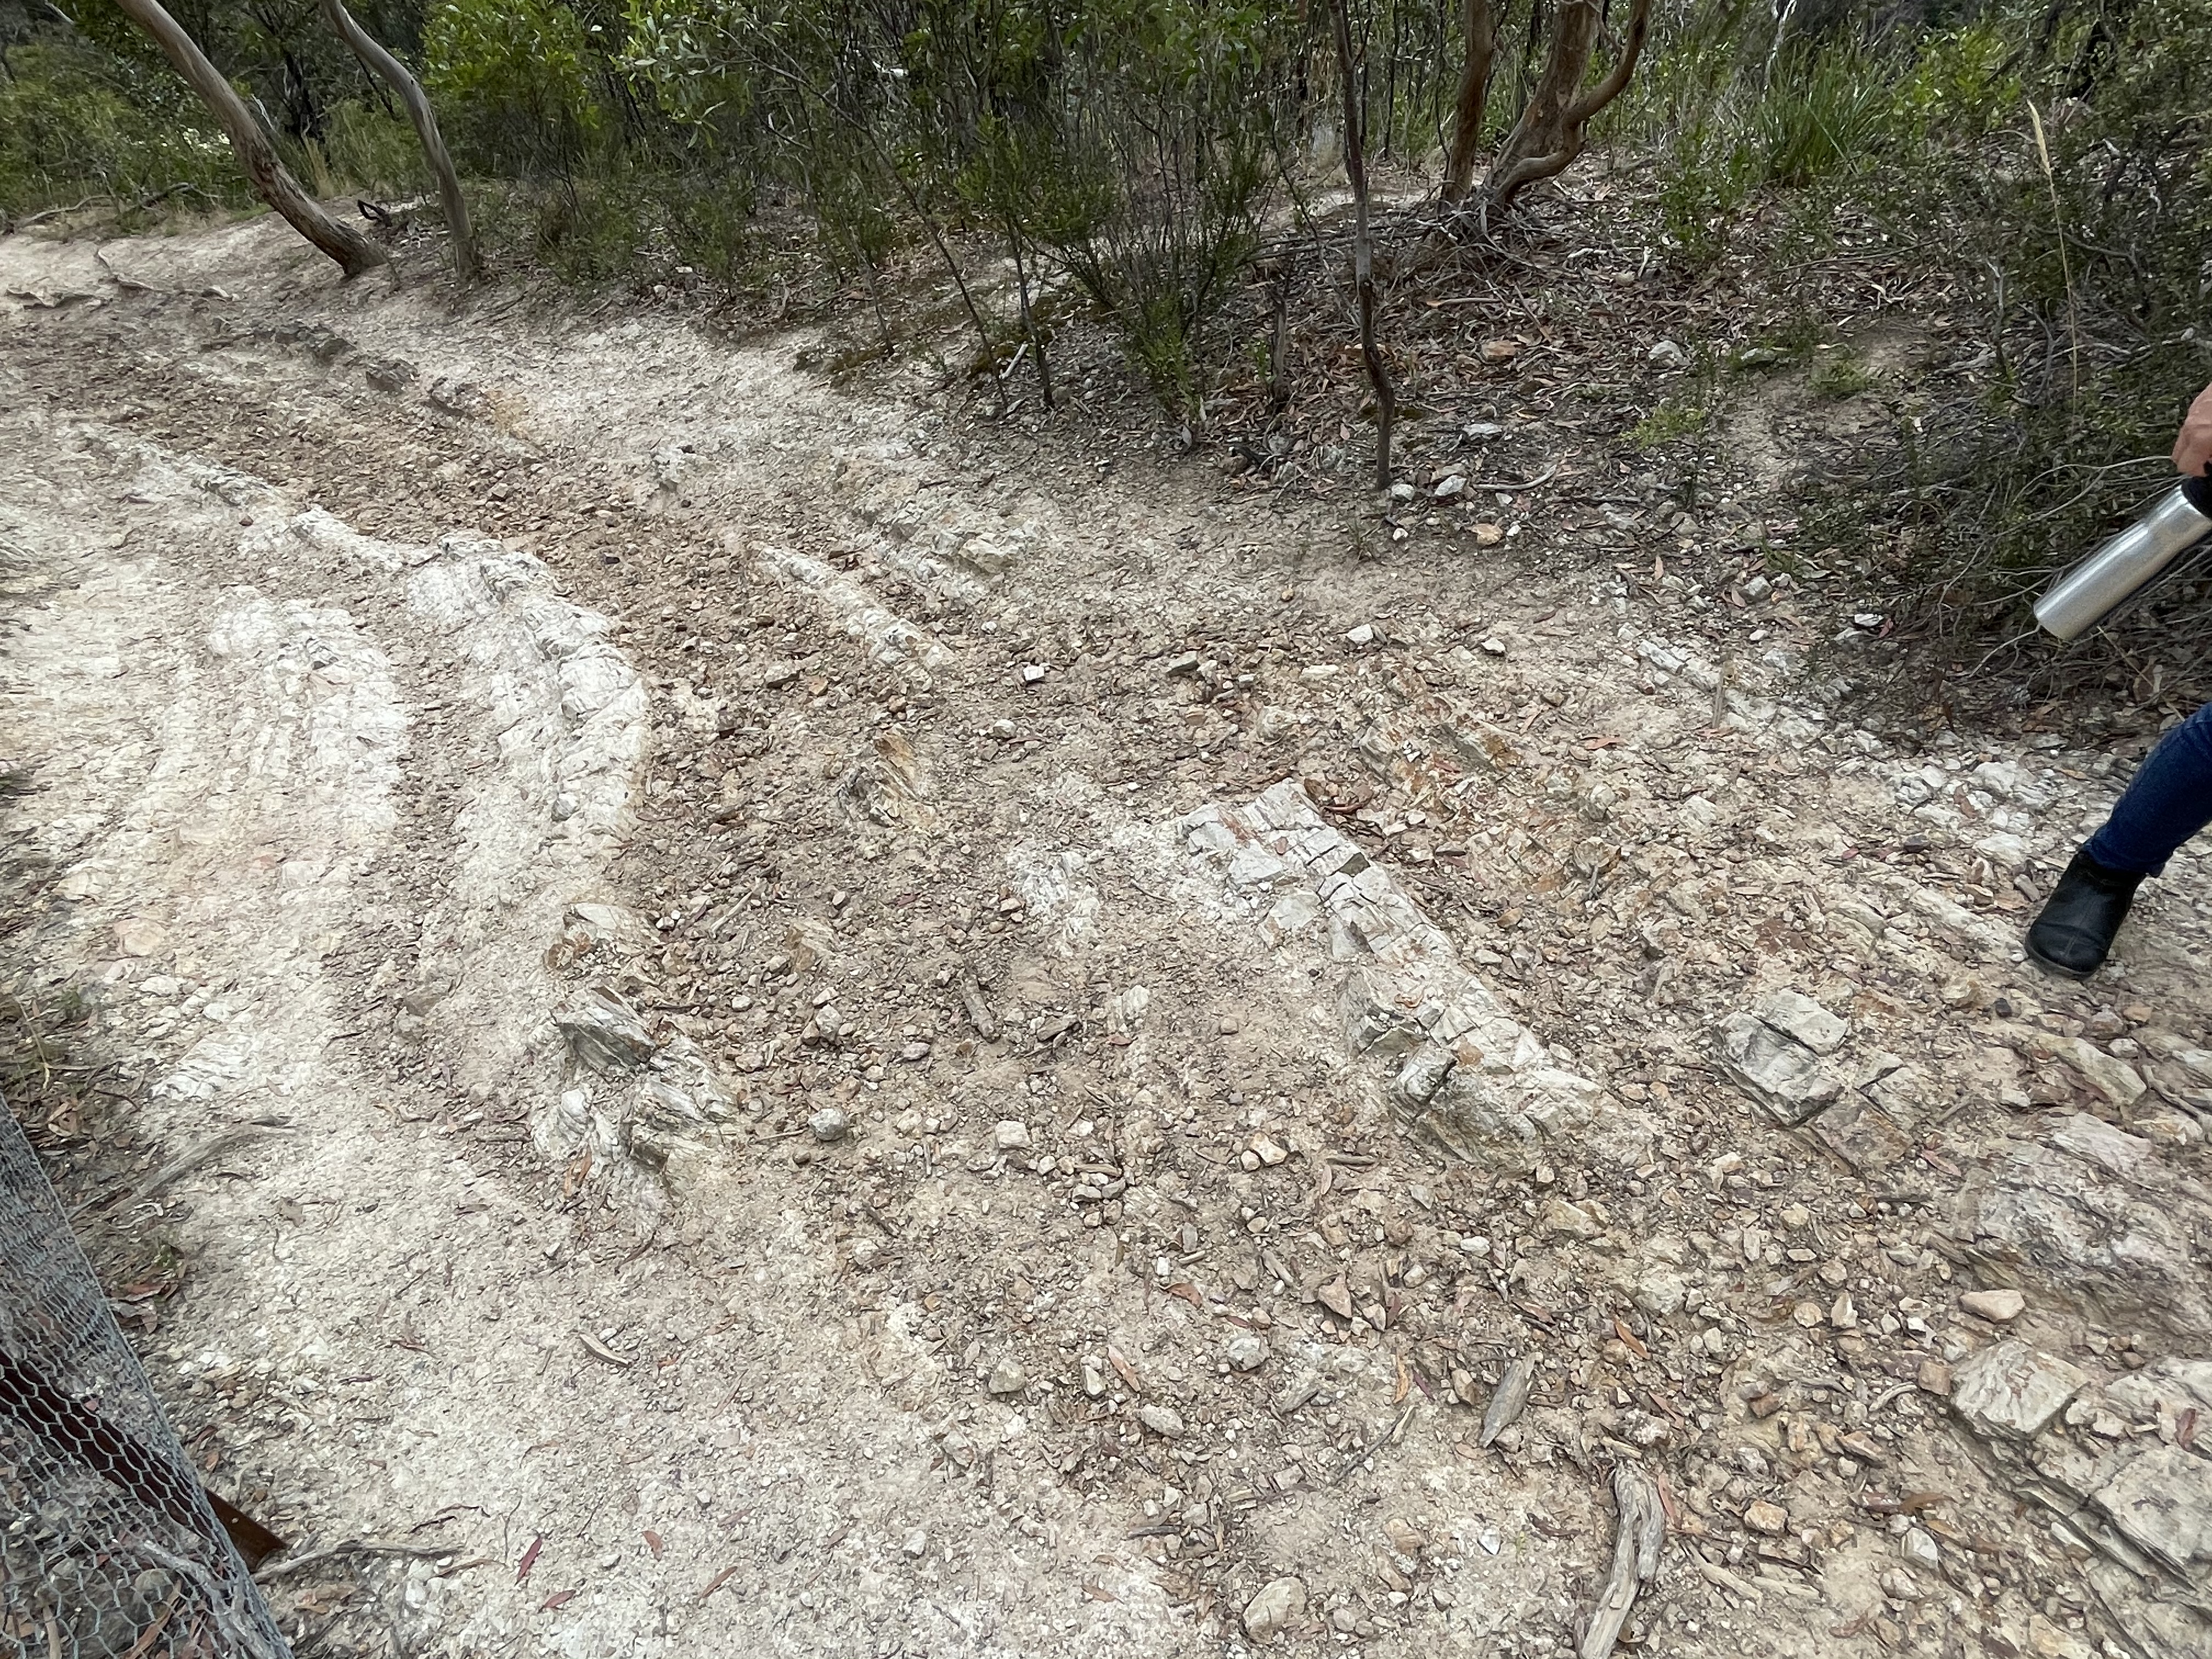 Fig. 8
The SE dip angle varied from about 45 degrees to vertical. The variation of bed orientation by so much over distances of less than twenty feet suggests that the sediments were very ductile during deformation. This inference is supported by remineralization, as seen in Fig. 9. Note that this thin bed was protruding from the layers shown in Fig. 8.
 Fig. 9
There was also evidence of brittle deformation, including hexagonal fracturing (not shown), which probably occurred during uplift and a reduction in temperature and pressure.
Without reviewing the geological literature on SE Australia, especially the Tasman fold belt, we can use our field data to construct a preliminary structural history of Yarra Bend Park. First, sand and mud were deposited about 420 MY ago, during the Ordovician period, along a coastline not that different than that existing today in the area.
Over an unknown time interval (certainly millions of years), the layers of sand and mud were buried 6 to 50 km beneath the surface (detailed mineralogy would limit this depth range substantially) and cemented to become rock. The entire region was then compressed along an approximately N-S axis and the lithified rocks seen here were folded. Only small folds are visible in this area (wavelengths less than 10 m and amplitudes less than 1 m), but they certainly would have been associated with larger scale folds during regional compression. The sediments were heated and compressed enough during this interval (lasting possibly millions of years) for the original sediment grains to remineralize as seen in Fig. 9.
The anticline seen in Fig. 8 was tilted more than 45 degrees in a generally easterly direction. A key observation for these rocks is that they were overturned after being folded; i.e., the fold itself was compressed along its axis and became nearly vertical. Rocks buried many kilometers beneath the surface rotated more than 90 degrees (overturned) indicates compression, usually associated with extreme folding. However, this small exposure reveals two compression directions, oriented at right angles, from N-S and E-W (rough estimates), which suggests a rotational stress regime. The rocks only recorded two members of what was probably continuous (but variable) compression while the tectonic plate carrying Yarra Bend Park rotated, dragged along by upper mantle convection.
Imagine slapping two balls of play dough together and rolling them (slowly) in your palms, in a circular motion. That is what happened to these sediments/rocks. But we don’t know when, not from our observations. Such a complex squeezing explains the fabric of these rocks. They were first pushed (like a rug that folds up) from one direction, then another.
There is another problem, however. Did the second compression regime occur when the rocks were ductile (folding) or when they were brittle (faulting)? Answering this question would tell us a lot about the timing of the compression; e.g., whether it continued while these rocks were being unburied by erosion of overlaying rocks; or if the stress changed direction while the rocks were still deeply buried. Since our observations don’t include microfabric analysis, and no faults are evident, we have to use indirect methods to address the problem.
The top of the low hill seen in Fig. 4 reveals thin layers of sandstone (Fig. 10).
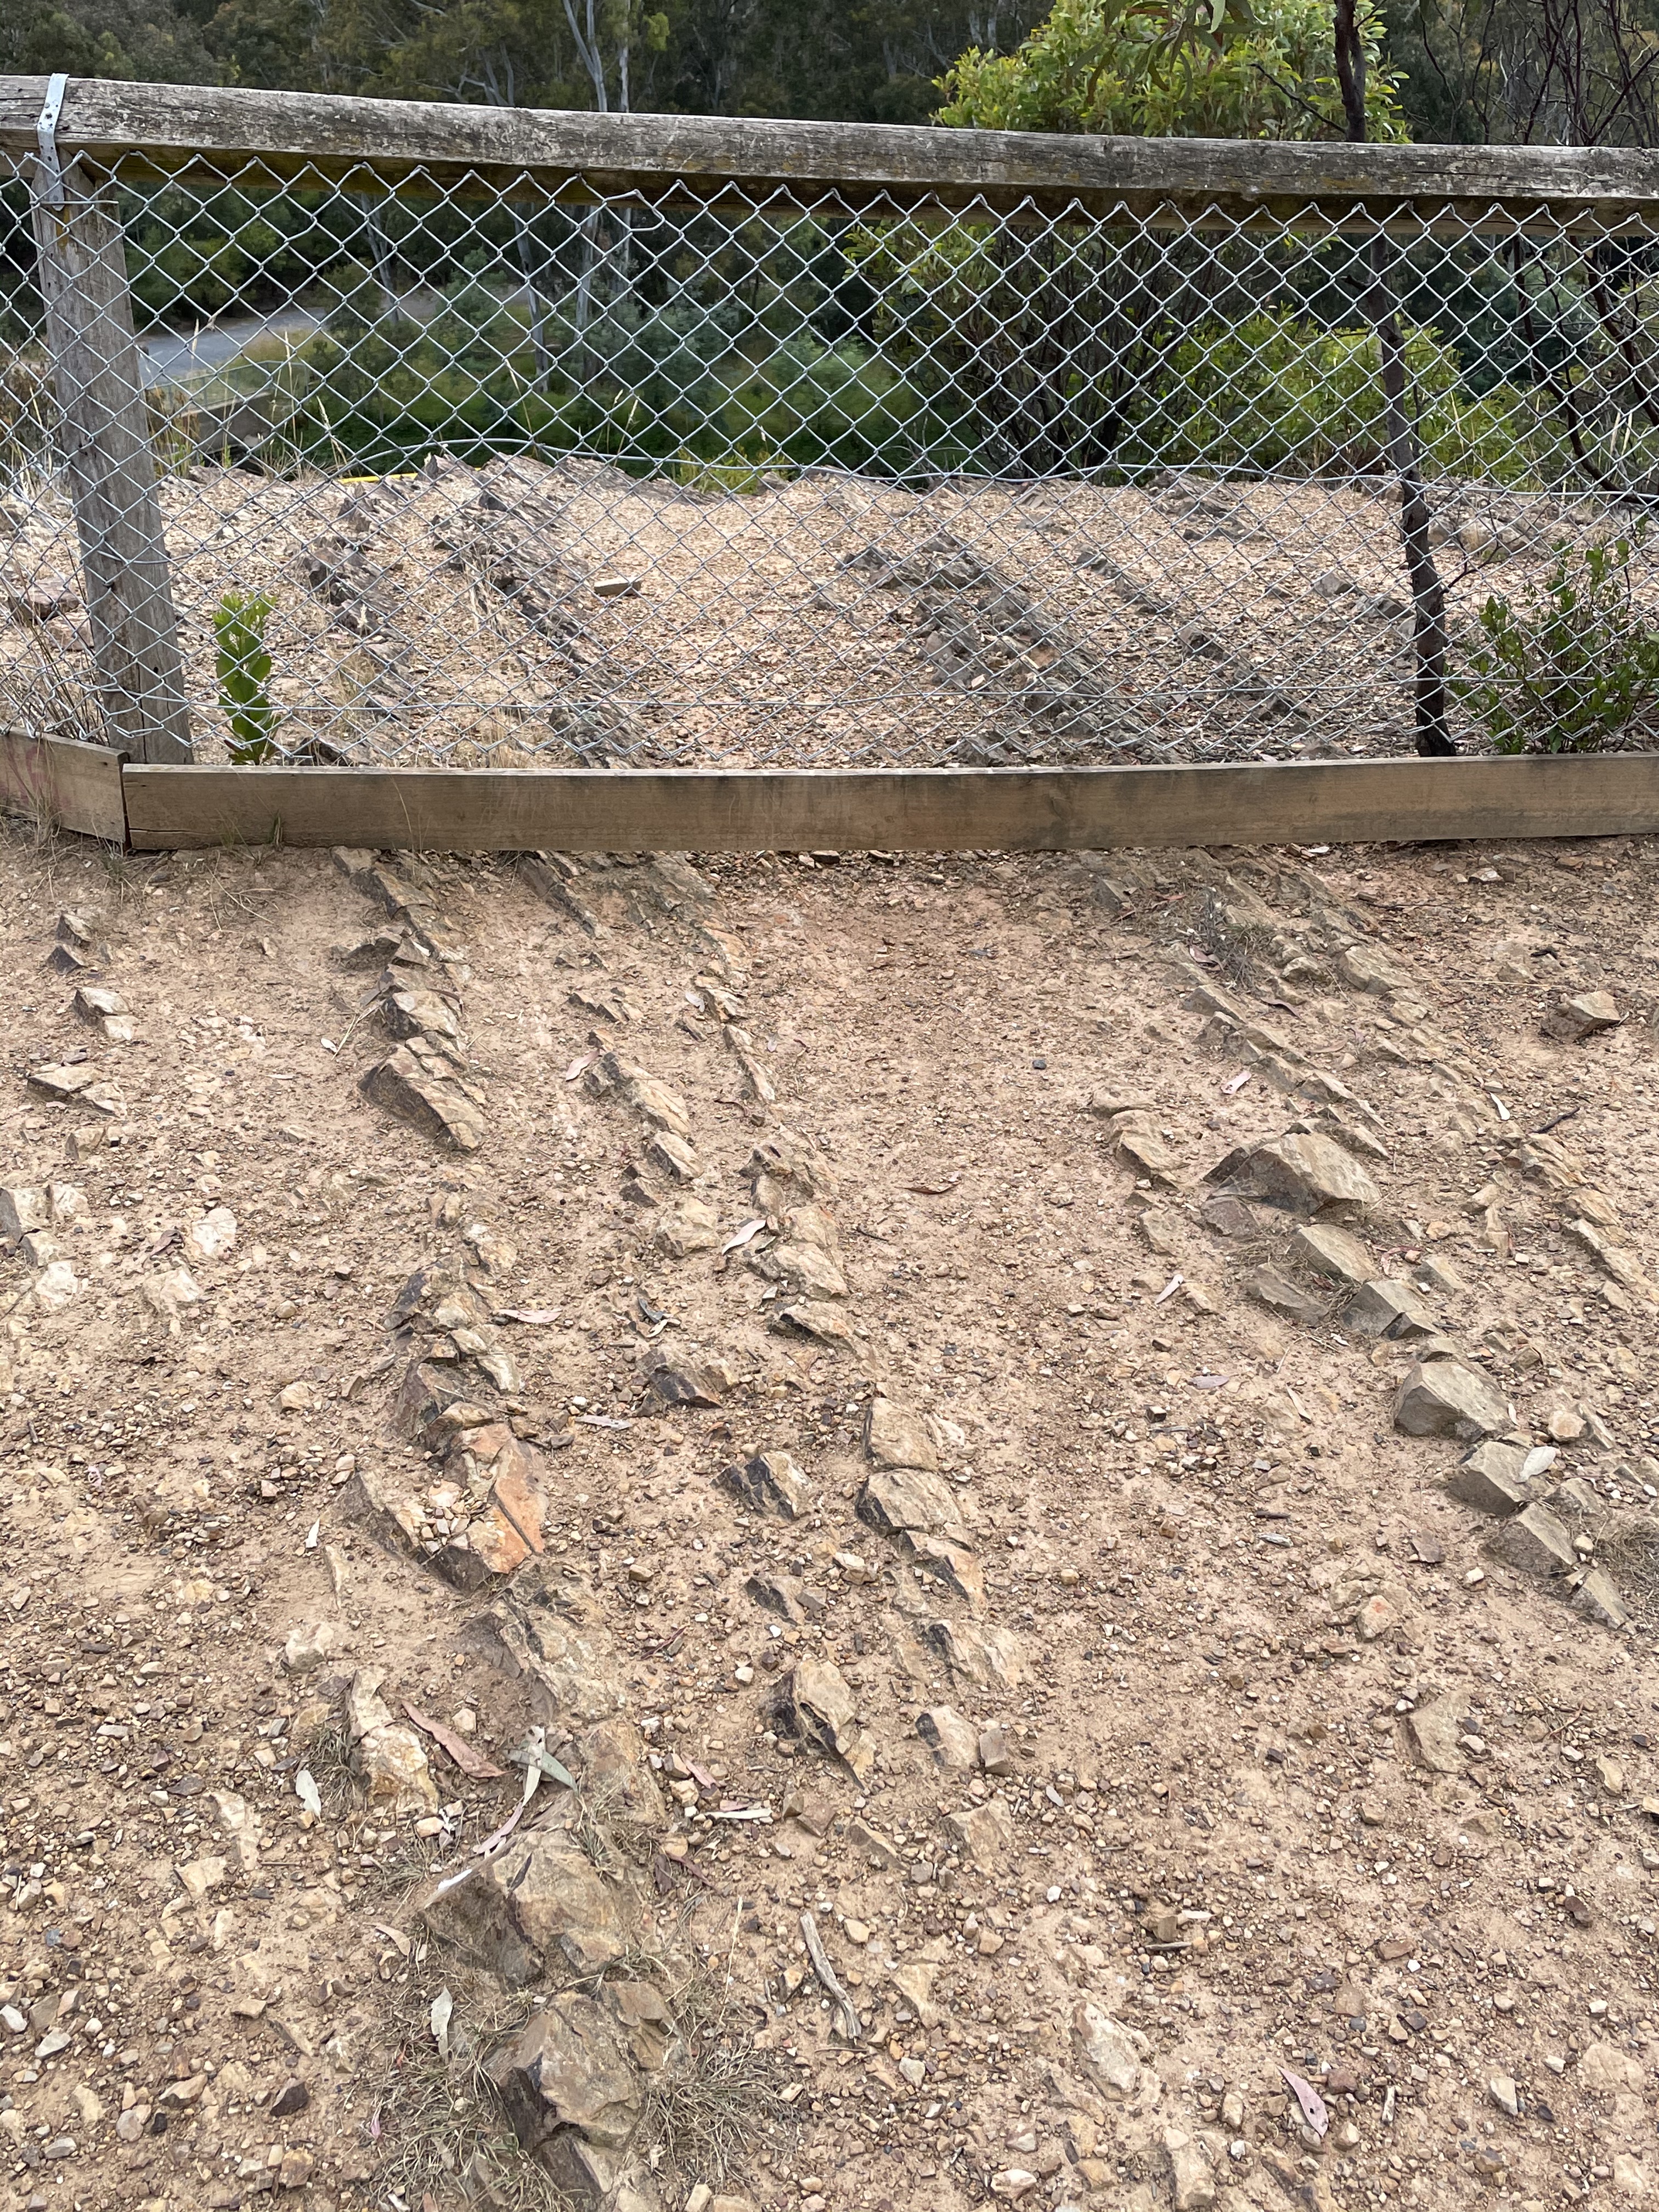 Fig. 10
The apparent dip on these beds is consistently 30-40 degrees and there is no evidence of folds (compare Fig. 10 to Fig. 8). There is also no sign of the variability in dip angle that was seen further up the hill, much less overturned beds. Folding is not uniform throughout a thickness of sedimentary rock. Invariably, different kinds of sediment/rock compress at different rates, depending on lithology, water content, etc. Thus, there is always some slippage along low-angle delimitation planes (usually bedding surfaces) whenever a thickness of rock is compressed. The difference in deformation style cannot therefore be used as evidence of brittle deformation during the second phase of compression, although it is consistent with the substantial difference in dip angle, especially overturned beds.
Indirect support for inferring brittle deformation also comes from the difference in geology and geomorphology across the Yarra River. The absence of Paleozoic rocks on the north side, taken in concert with the lower elevations there, suggests the presence of a fault underneath the river. This could be a normal fault, with the northern side of the river dropping to form a graben. However, the lengthy compressional stress suggested by the deformation of the sediments is more consistent with a reverse fault, with the south bank being the hanging wall. There is no basalt on the south side, and only a few cobbles along the river bank.
Figure 11 shows a thick bed of massive sandstone exposed 100 feet further along the trail, maybe 20 feet down-section. Closer examination of the photograph reveals low-angle cross-bedding, i.e., generated by waves with very little transport of sand.
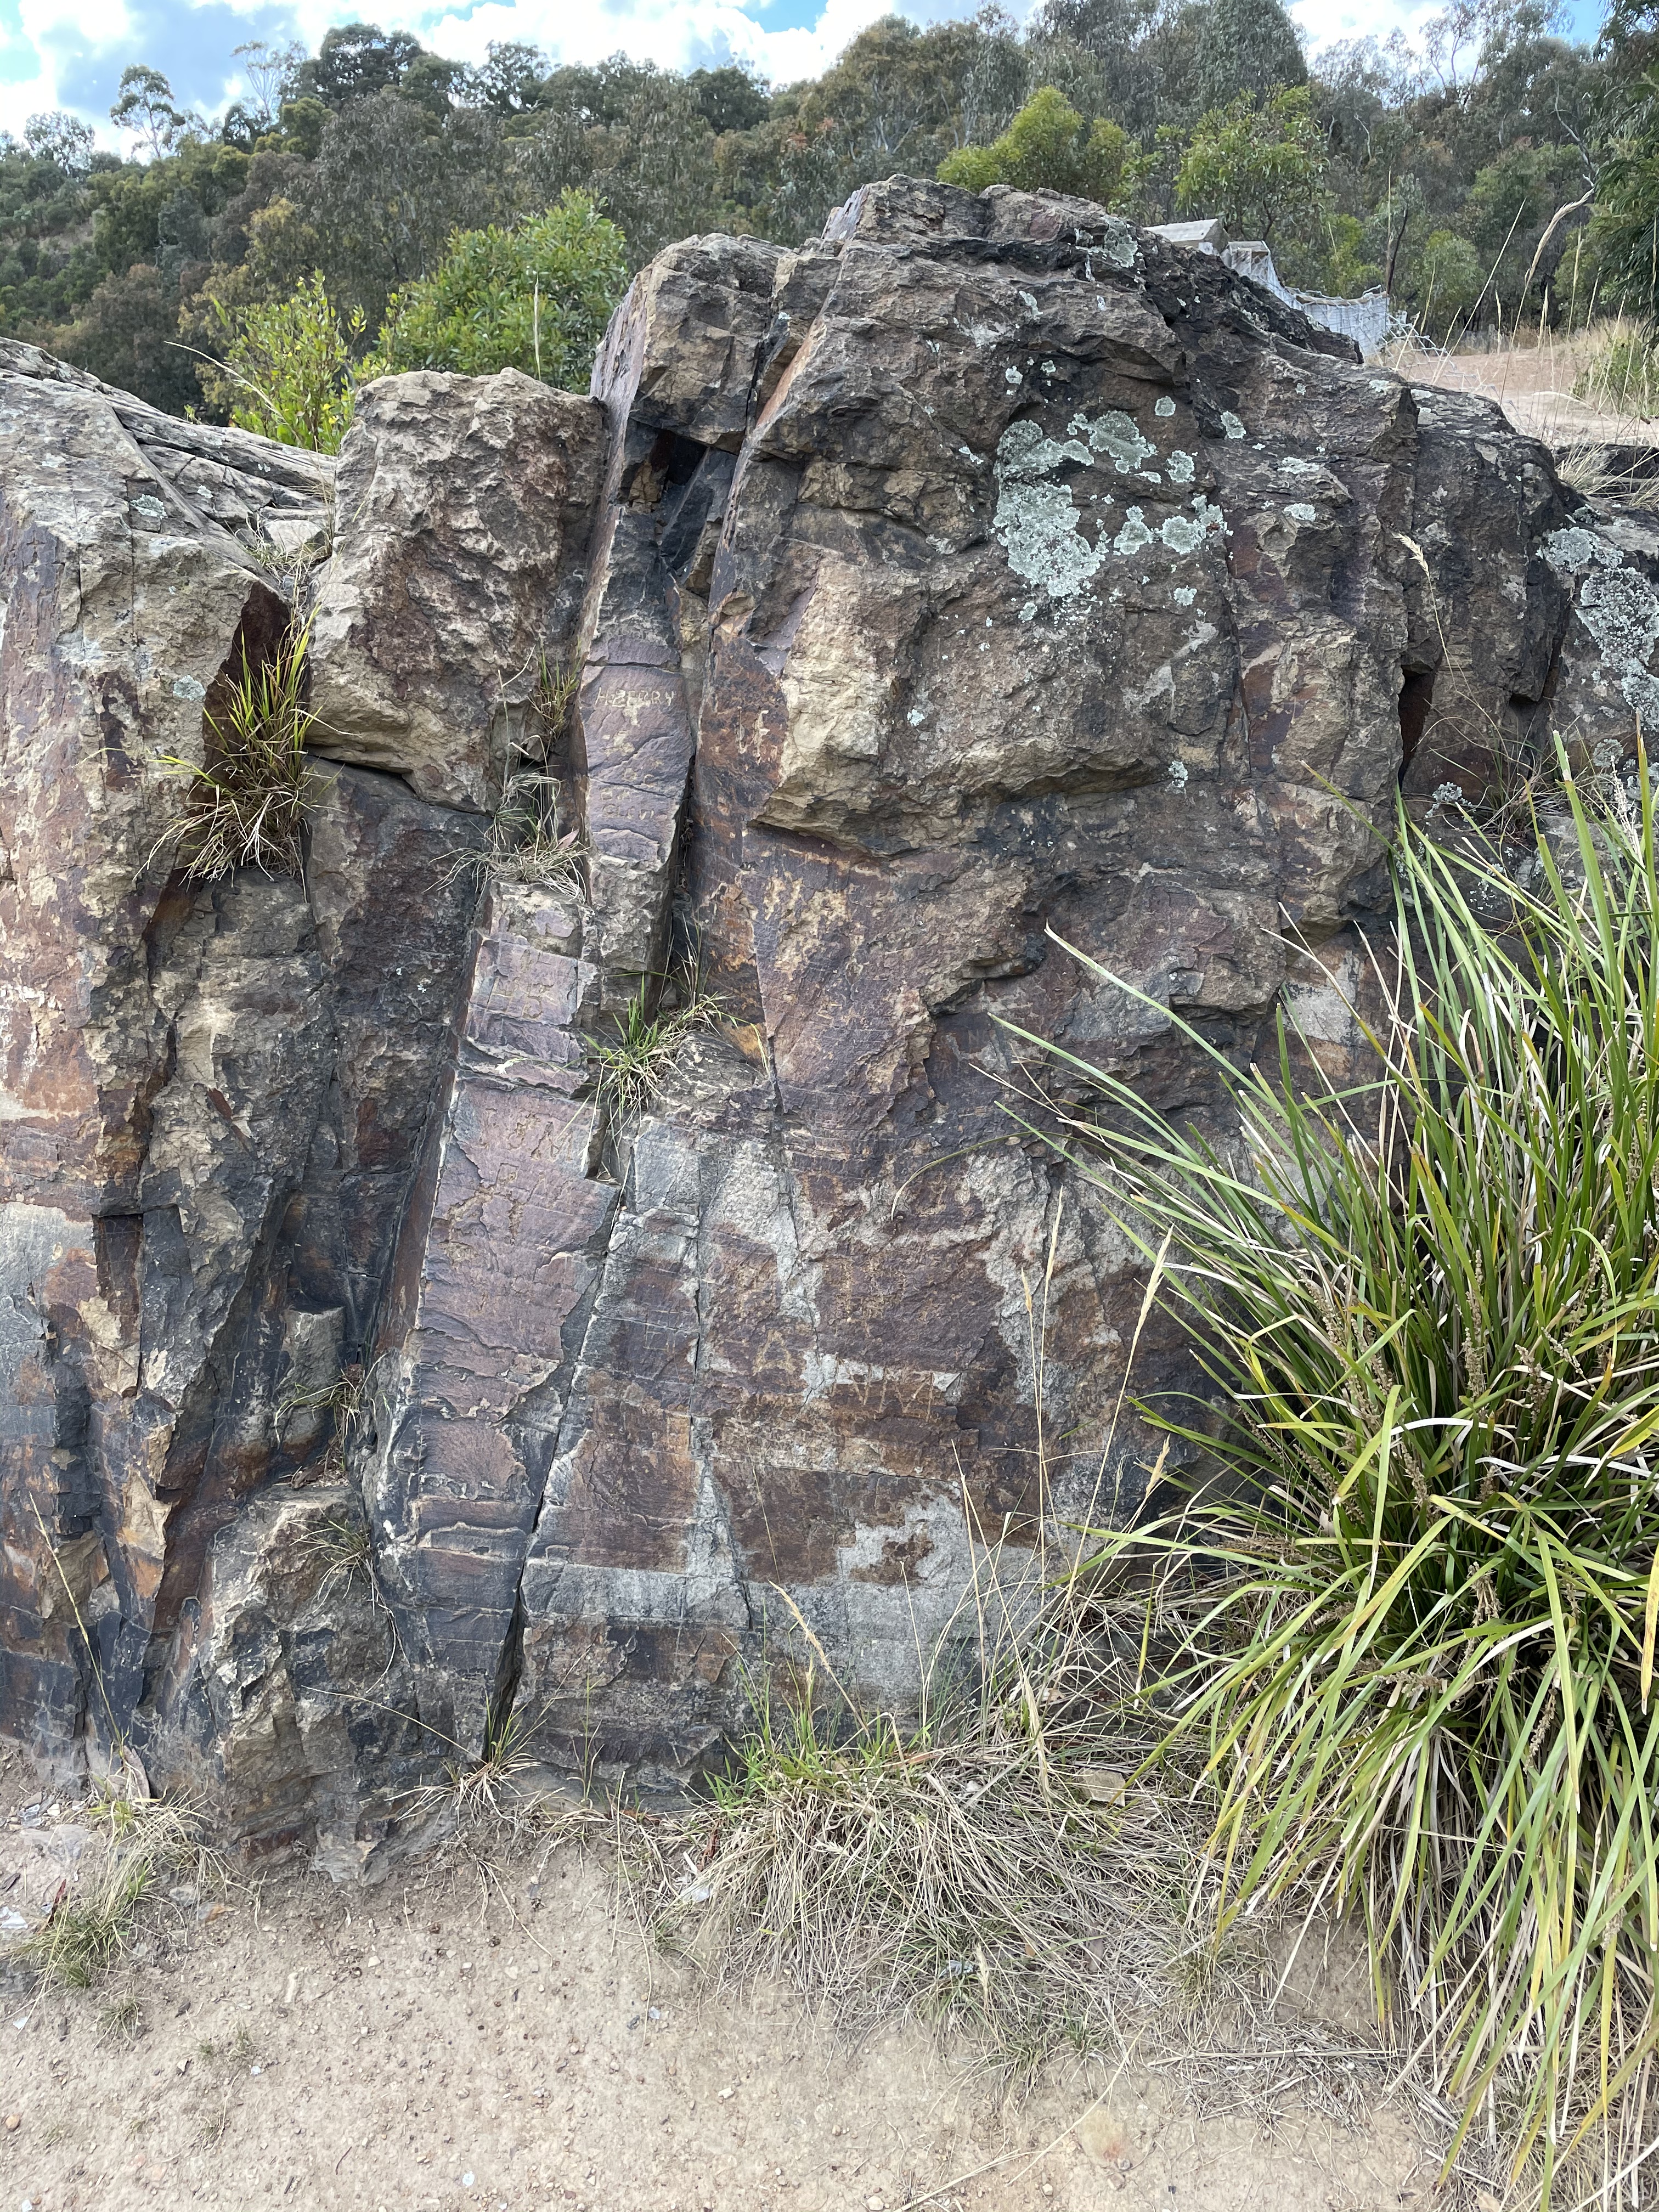 Fig. 11
We can do a back-of-the-envelope calculation (aka guesstimate) to get an idea of the time between the massive nearshore sand and the later deposition of alternating sand and mud. I’m going to use SI units because they’re easier for estimating. If my field estimate of 7 m (about 20 feet) is okay (not likely), then we can easily estimate the time in years between the thick sandy layer in Fig. 11 and the interbedded sand/mud layers in Fig. 10. Using a conservative sedimentation rate for a deltaic environment (like the central Gulf of Mexico) of 0.002 m/year (2 mm/year), we can confidently calculate a reasonable age difference. Dividing 7 m of total sediment by a sedimentation rate of 0.002 m/year means that only 3500 years were required to go from the depositional environment represented by Fig. 11 to that seen in Fig. 10.
The sediments immediately below the massive bed (Fig. 12) are like those above.
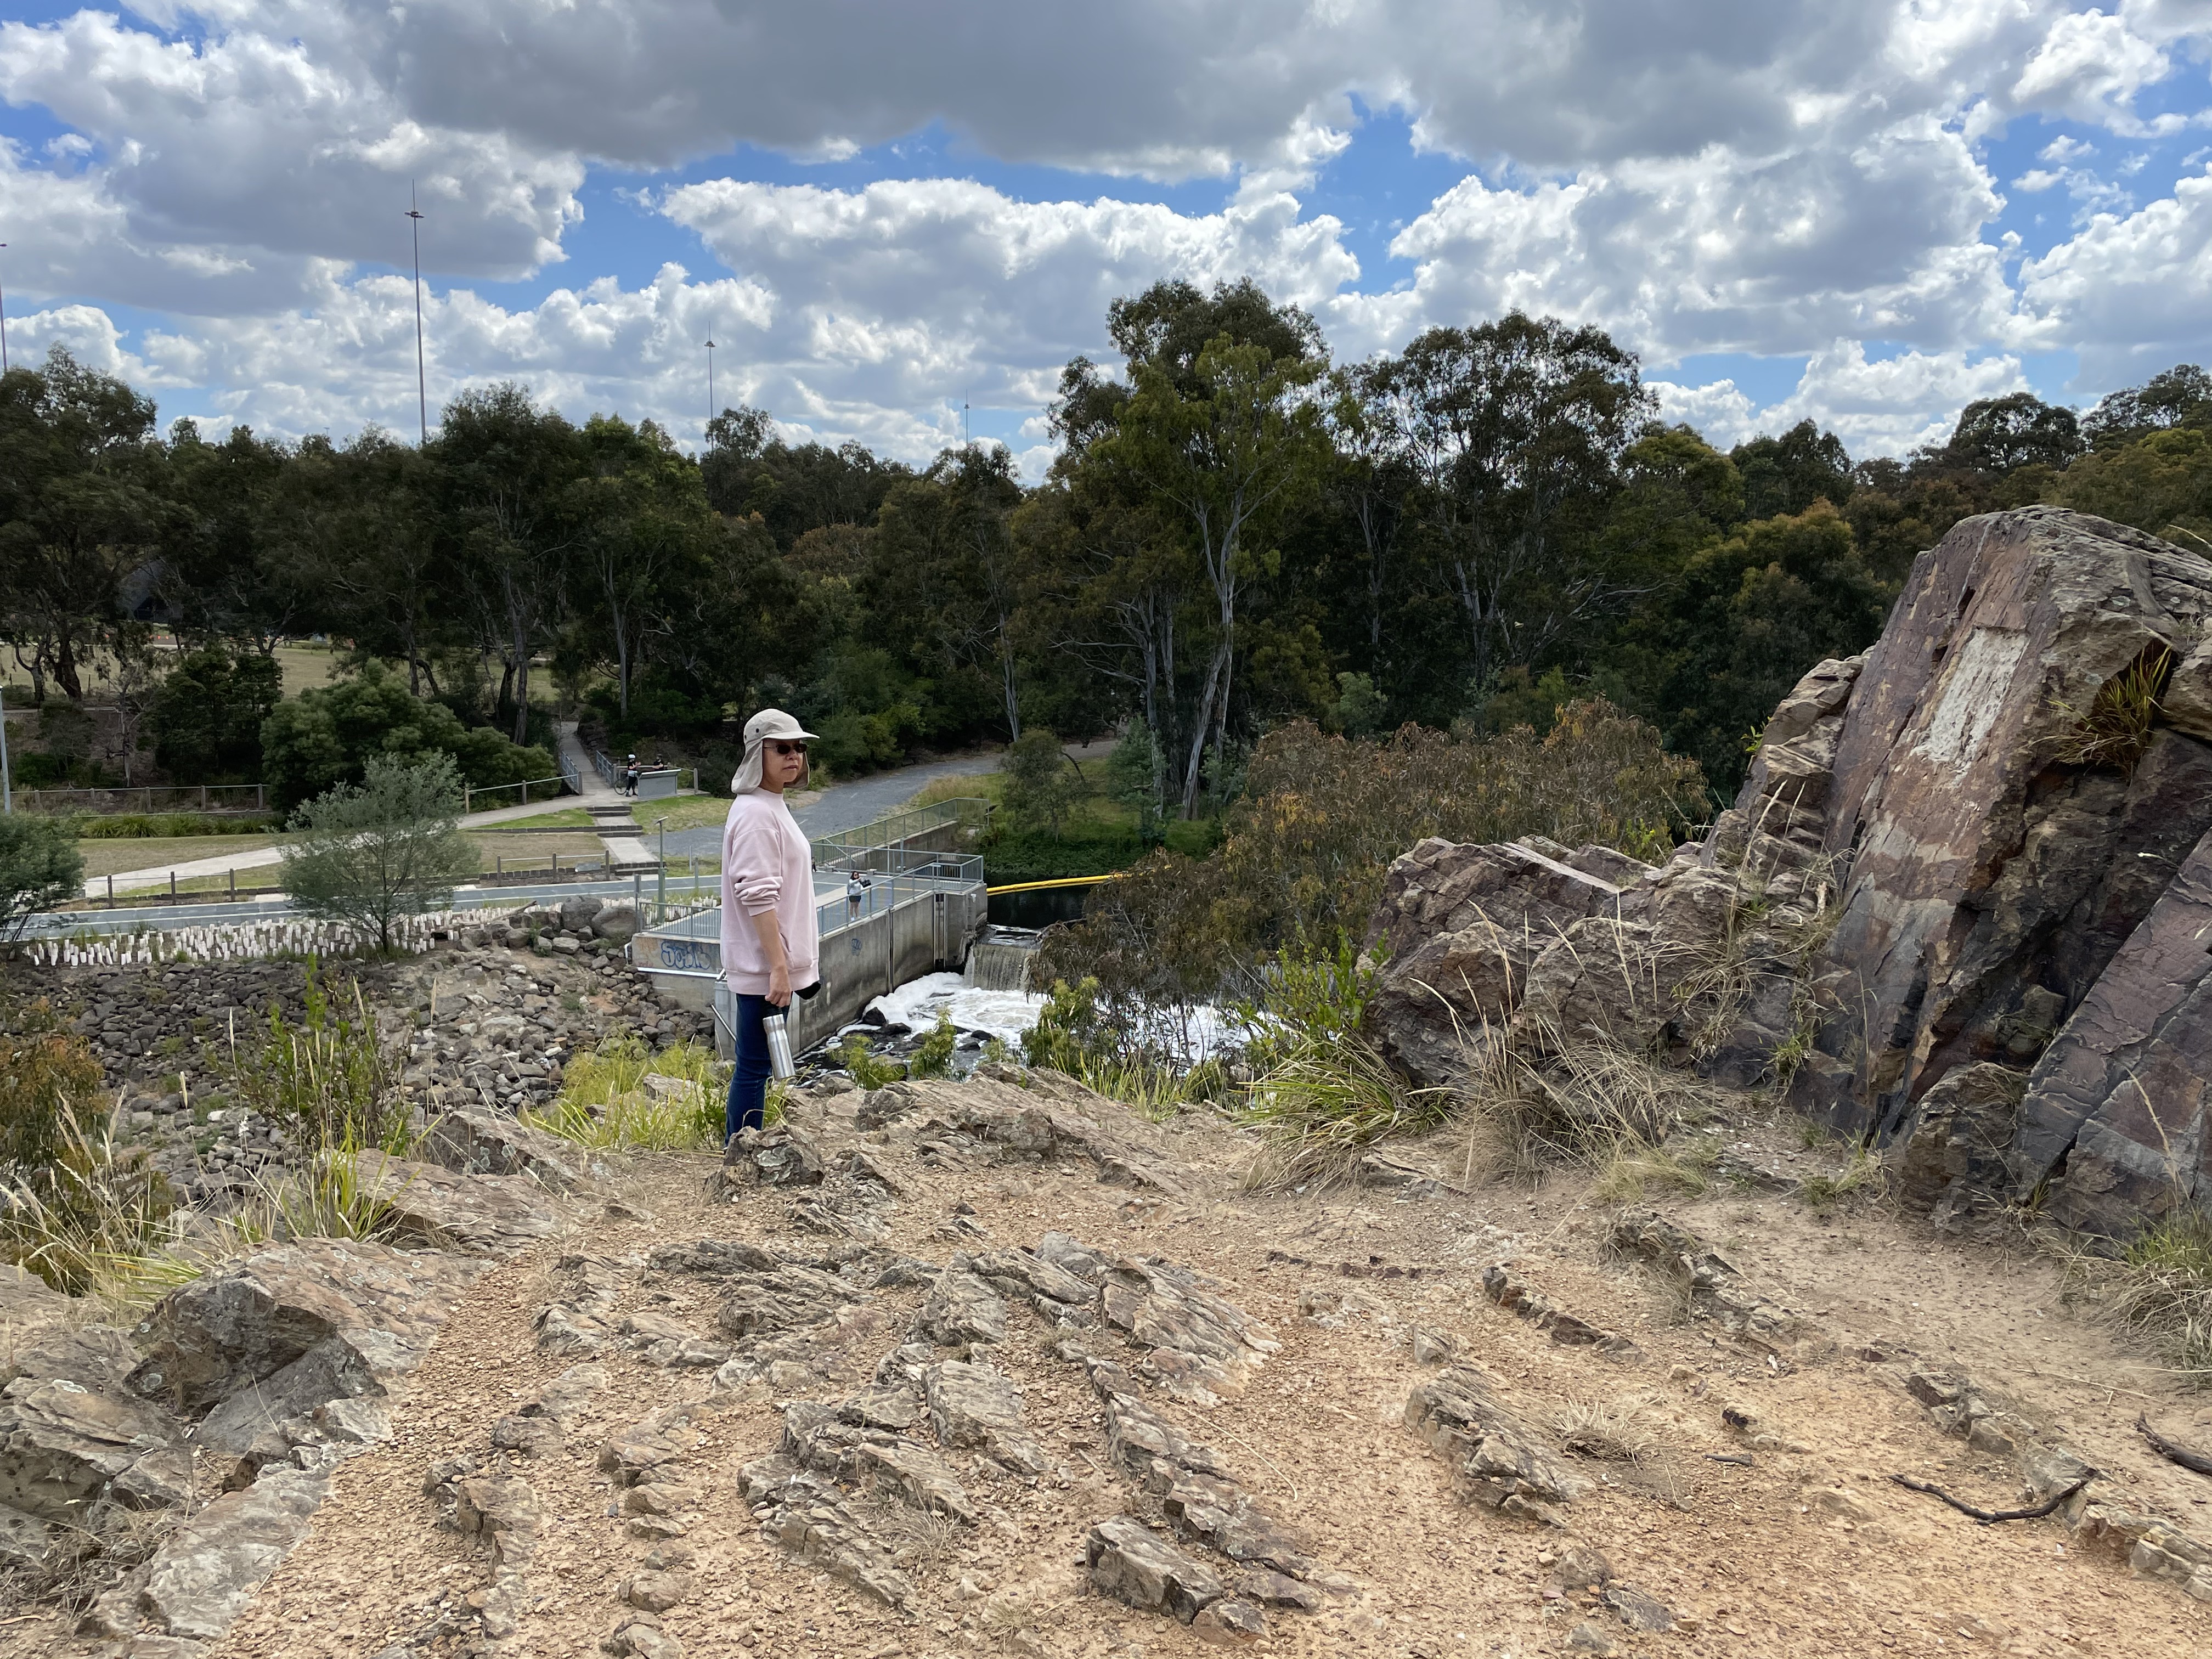 Fig. 12
That thick (more than 6 feet) layer of sand was deposited in a sandy nearshore environment, as indicated by thin bedding (visible by zooming in on the photo) and no mud at all. Figure 12 suggests that we should be wary of projecting a single stratigraphic section (one-dimensional) into three-dimensions, i.e., it is very likely that a massive bed as seen in Fig. 12 was deposited someplace else at any time during the time span represented by these rocks. The low-angle crossbedding suggests that this may have been a shoal or bar deposited on a mixed clastic coastline. It’s time to go further down section, into the past.
We followed a trail (including some cement steps cast into a flood-control levee) to river level. This short hike took us another 60 feet down section, which means we travelled ten-thousand years further back in time from Fig. 12. Here’s what we found.
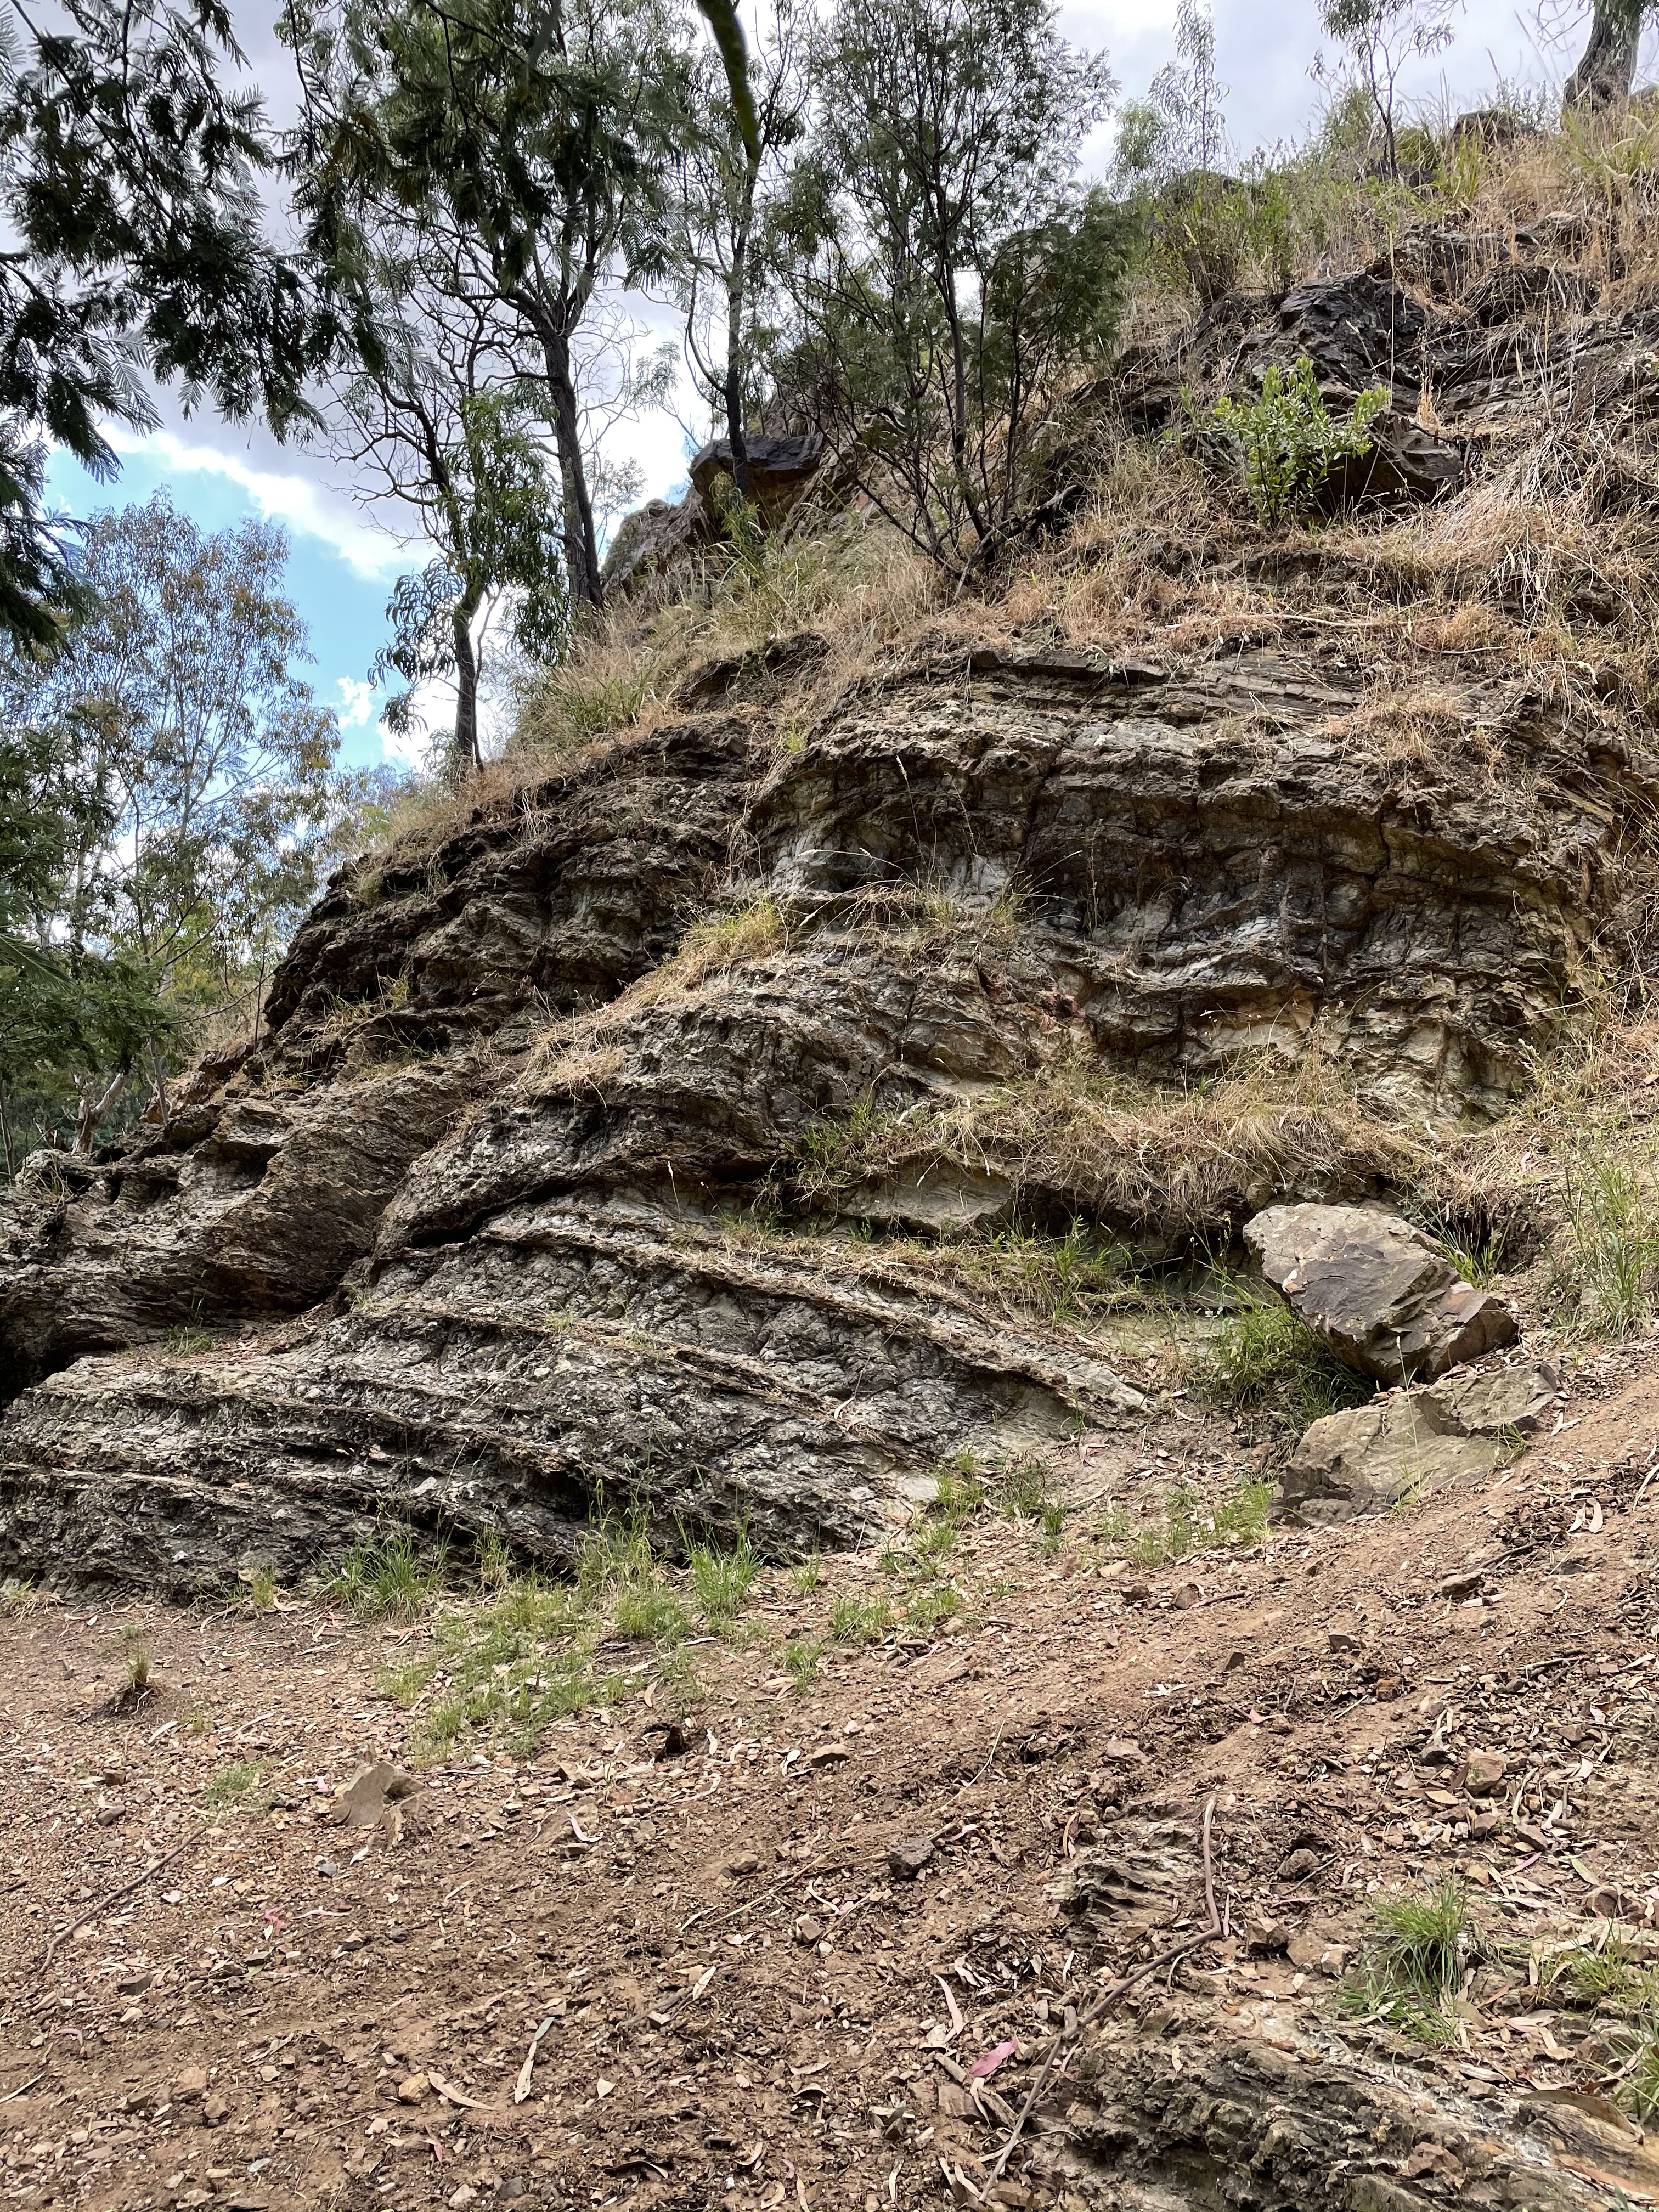 Fig. 13
This is a section that could be taken straight out of the northern Gulf of Mexico, in another ten-million years. Sand and mud are equally available. That only happens when there is active erosion in an upland with a variety of rocks available, and plenty of accommodation space for the sediment; i.e., relative sea level is rising, whether due to sea level increasing or subsidence. Yarra Bend Park was located in an active delta. Let’s look at those sediment layers closely.
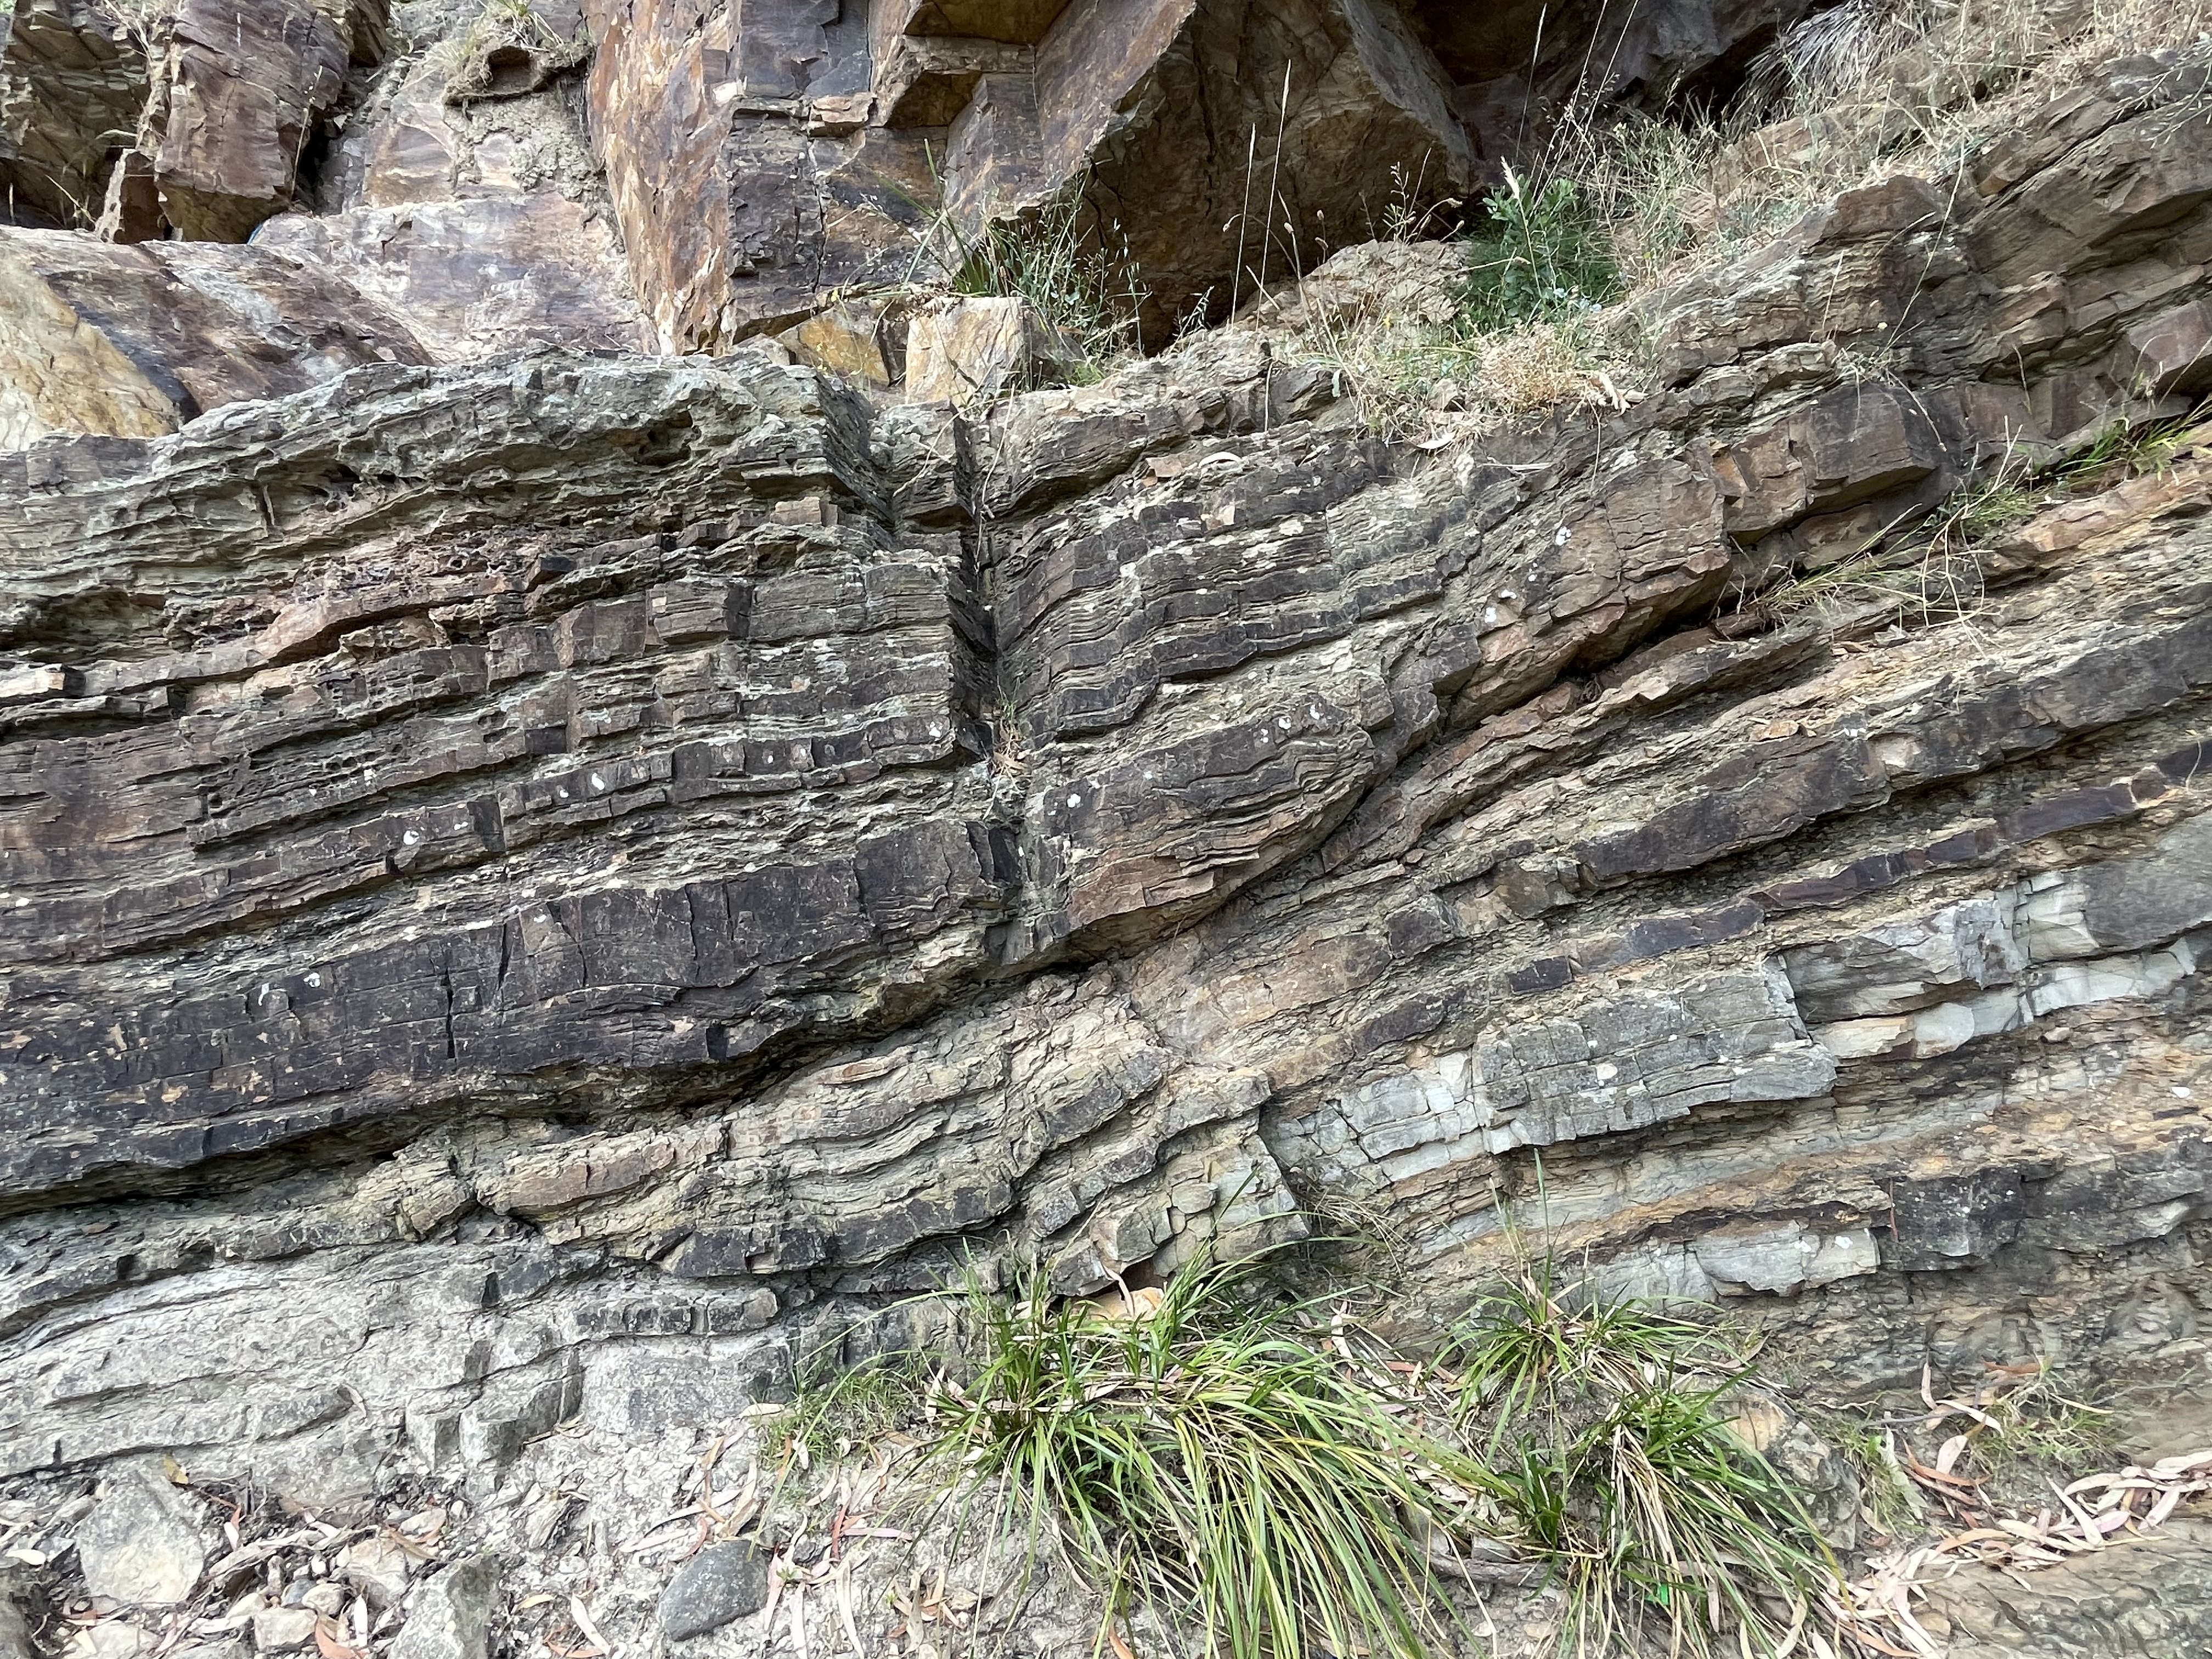 Fig. 14
Figure 14 is a close-up of the strata in Fig. 13, which reveals irregular bedding typical of nearshore marine sediments. Finer grained sedimentary particles have weathered out to reveal low-angle, planar cross-beds. There was plenty of mud available. I want to emphasize that this exposure is less than an acre in horizontal extent, so this entire thickness of maybe 50 m represents on the order of 25 thousand years of deposition and erosion of sand and mud on an acre of seafloor. In other words, the sedimentary environments represented by Figs. 11 and 12 were certainly found within a few kilometers of each other at ANY given time.
The massive (almost 6 feet) thick bed in Fig. 11 can be examined at river-bank level because of the dip of the sedimentary rock layers (see Fig. 4). We went down-section and then turned to go back up section, but at a different angle, which is why I’m estimating distances and ages. These could all be much more accurate with some geometry. Figure 15 shows a 3-foot thick cross-bedded section at approximately a right angle to Fig. 11. This allows us to examine two different potential flow directions at the same time, albeit separated by maybe fifty feet.
 Fig. 15
Note how the dark/light lineations (laminae) are tilted slightly towards the left, the angle decreasing from the bottom of the “bed” to the top. Figure 15 suggests weak bedload transport with a leftward component. This transport weakened upwards. This is consistent with sand being transported along the bed by weak currents that varied irregularly, preventing consistent cross-bedding sets to develop. The more planar nature of lamination in Fig. 11 supports this conclusion because the flow would have been approximately “into” the rock surface in Fig. 11. This is an environment typically encountered below fair-weather wave base (e.g. deeper than 30 feet). The sediment size is uniform, suggesting continuous deposition rather than episodic. Storm and flood beds tend to have a lag deposit at the bottom and fine upward.
Using a “standard” deltaic sedimentation rate of 2 mm/year, we can [switch back to SI mode and] estimate that this meter-thick sand layer was deposited during five thousand years of continuous input from a land source. However, average sedimentation rates are meaningless for a sand body like Fig. 15 because sand will be concentrated by waves and currents into shoals at any given time. Furthermore, our estimate assumes a steady rate of subsidence; space had to be made between the ocean surface and bottom for this sand to accumulate.
Figure 16 reveals a sand layer with similar crossbedding to the overlaying bed but a different color and appearance; it is more rounded and less massive. This is probably an artifact of diagenesis that tells us nothing about its depositional environment.
 Fig. 16
A little further down-section (Fig. 17) shows crossbedding similar to Fig. 14, but with less mud.
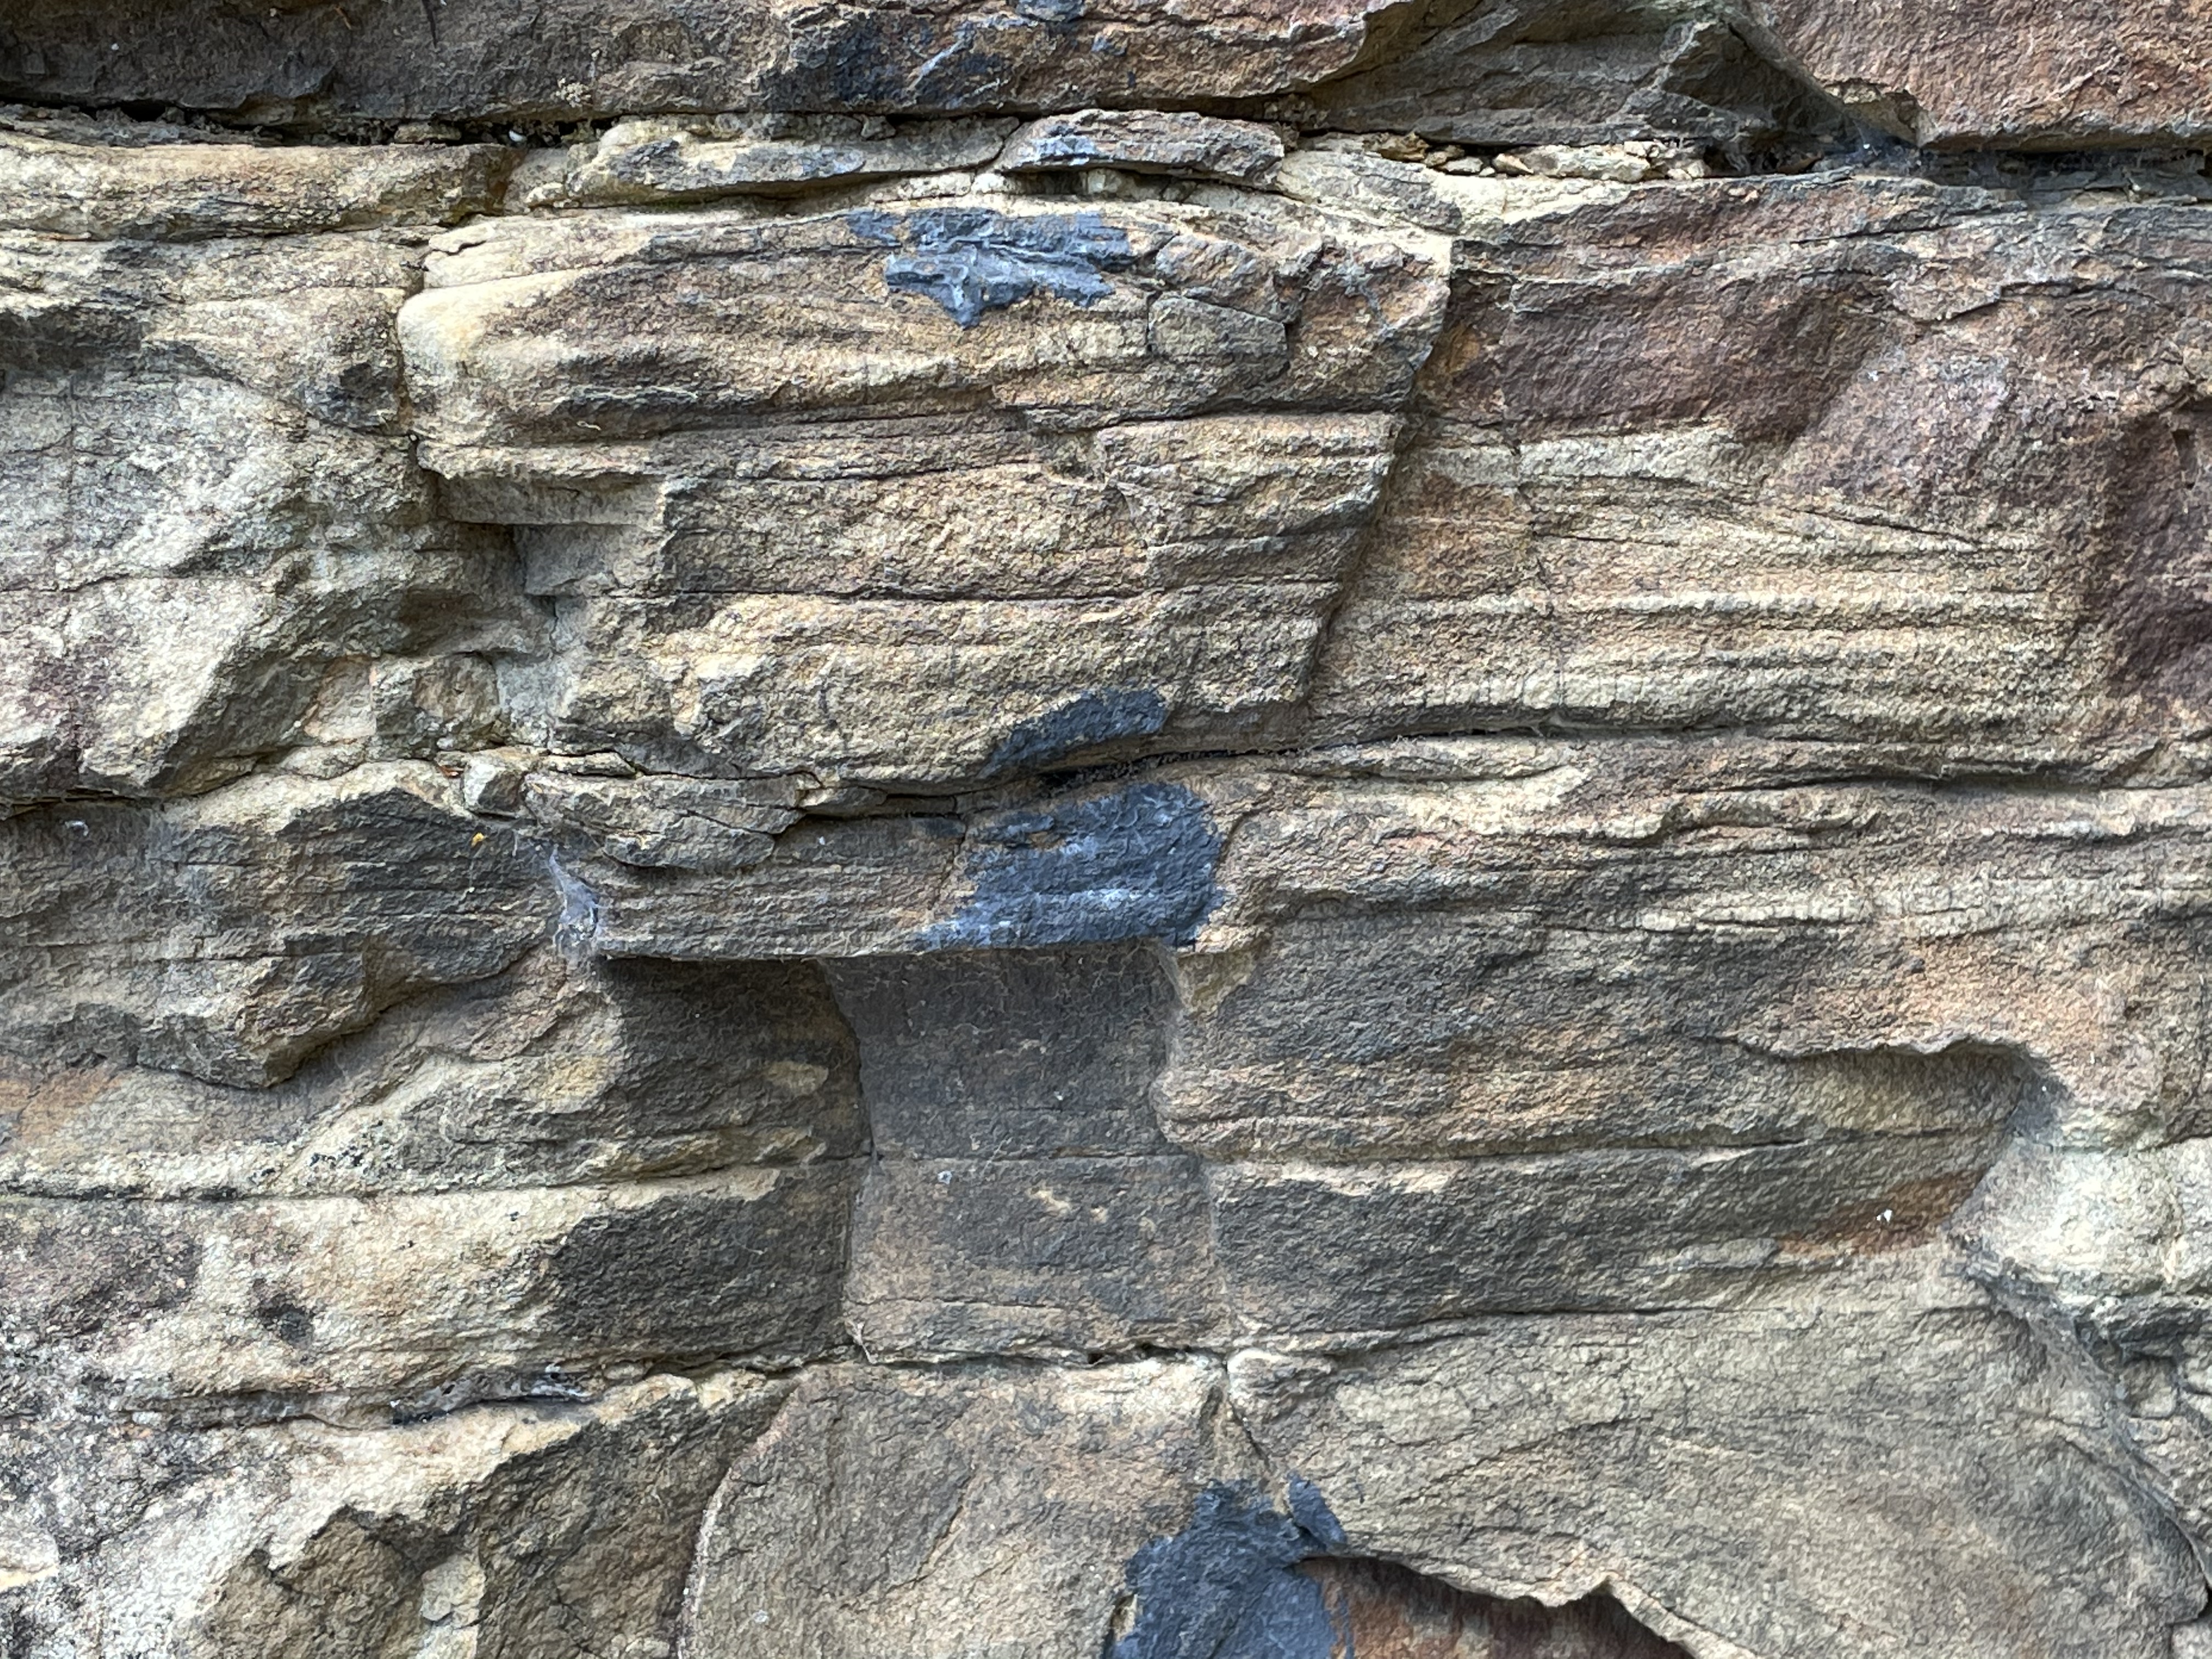 Fig. 17
I have described the sedimentary rocks of Yarra Bend Park in the order they were encountered in the field. Rather than rewrite this post, I’m going to summarize the geological history and refer to the photos in chronological sequence. I won’t make this mistake again.
Around 420 million years ago, the study area was receiving predominantly muddy sediment, with sand being deposited in thin beds (Figs. 13 and 14). Sand increased for several thousand years as the muddy layers decreased in thickness (Fig. 17), until an interval of major sand deposition occurs over a very short time span (Fig. 12), producing several massive, cross bedded layers (Figs. 4, 11, 15, and 16). These were probably shoals or barrier islands, possibly due to the river mouth migrating to the local area (delta switching). Subequal sand/mud deposition resumed in discrete beds (Figs. 8 and 10) for tens of thousands of years. If these rocks are 150 m in thickness, Yarra Bend Park was part of a stable clastic shelf for 75 thousand years.
Deposition continued and the sediments were buried to at least 6 km, where they were cemented to become sandstone and shale. This almost certainly took several million years. Compression, probably caused by collision with Gondwana, more than likely occurred during deposition of these sediments in a foreland basin. They were first folded from current south while still deeply buried but the direction of collision rotated ninety degrees clockwise as the rocks were unburied. With lower pressure and temperature, the deformation changed from ductile to brittle and faults would have occurred along planes of weakness, leading to a fault that defines the Yarra River’s modern channel.
Volcanism was continuous for the last 30 million years, culminating with the basalt flow that reached Yarra Bend Park about 700,000 years ago, pushing the river against this promontory of hard, Ordovician sedimentary rocks. They resisted erosion as the basalt weathered away from their flank, leaving us to ponder the amazing history of this unknown park on the fringe of civilization, buried in one of the most complex orogenic belts in the world.

Recent Comments