Ecology Notes from Tacoma Nature Center
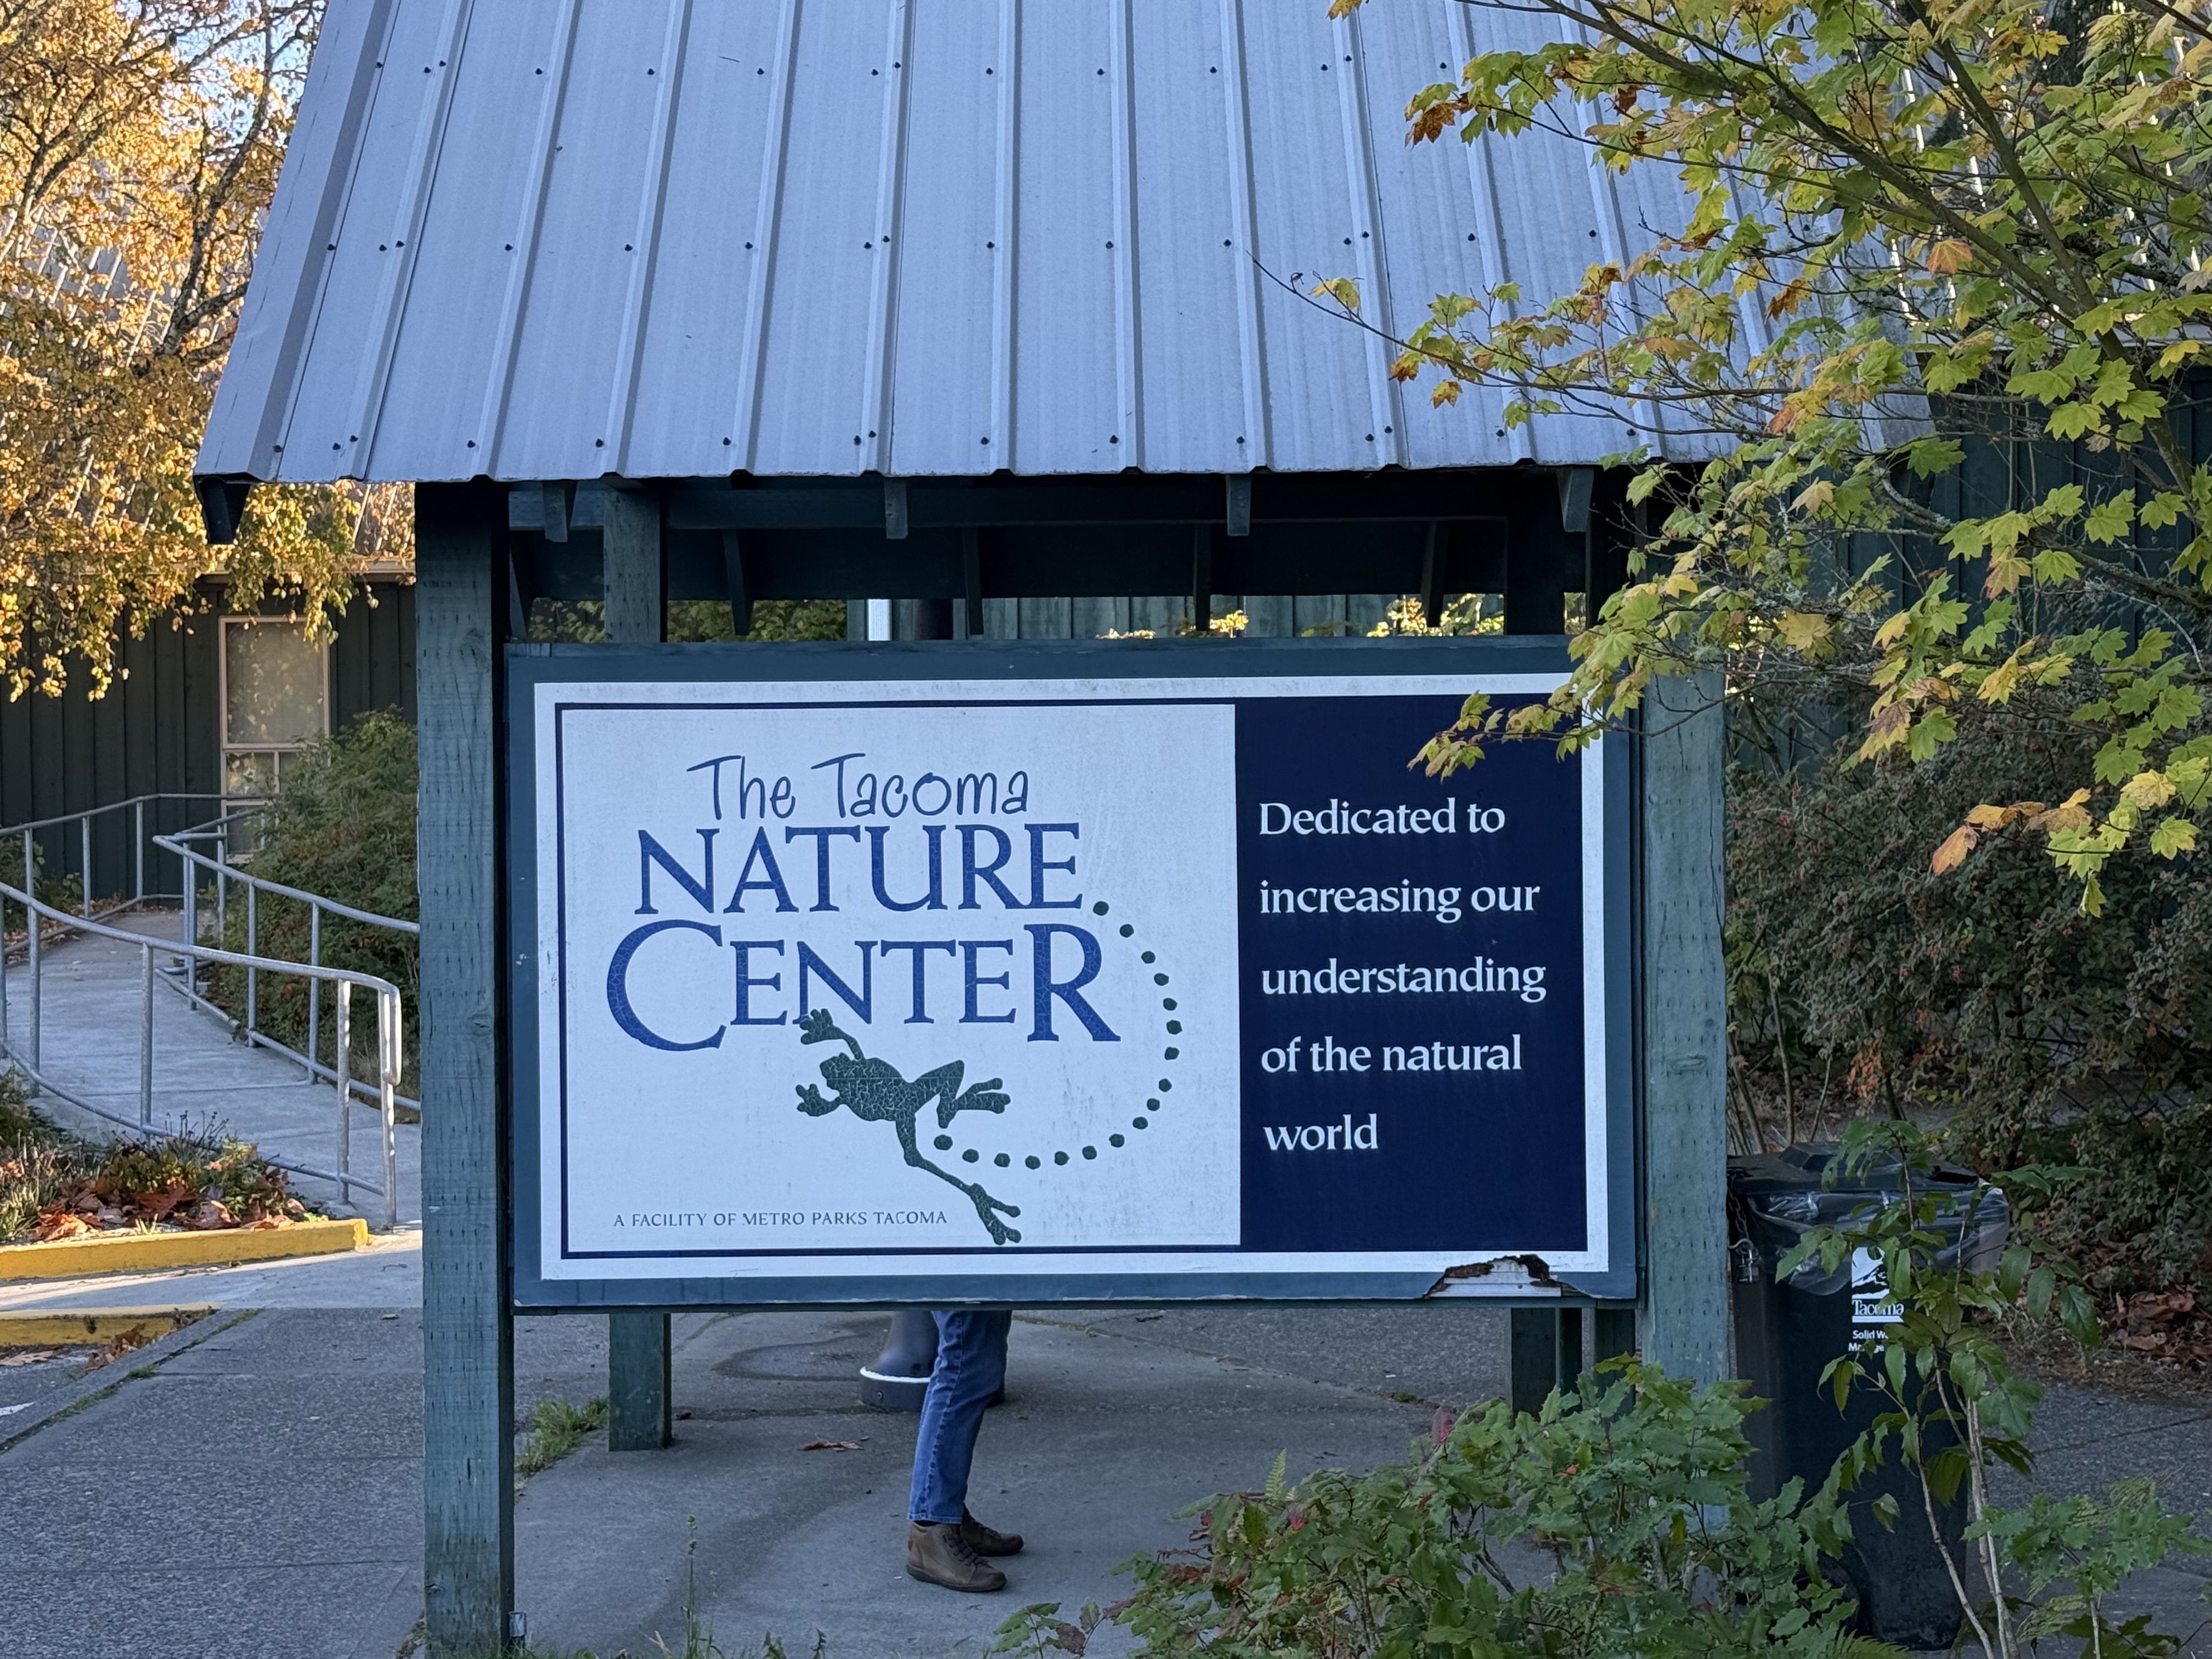
Today’s field trip took us to the center of Tacoma, where the city operates a nature center focused on education and outreach programs.
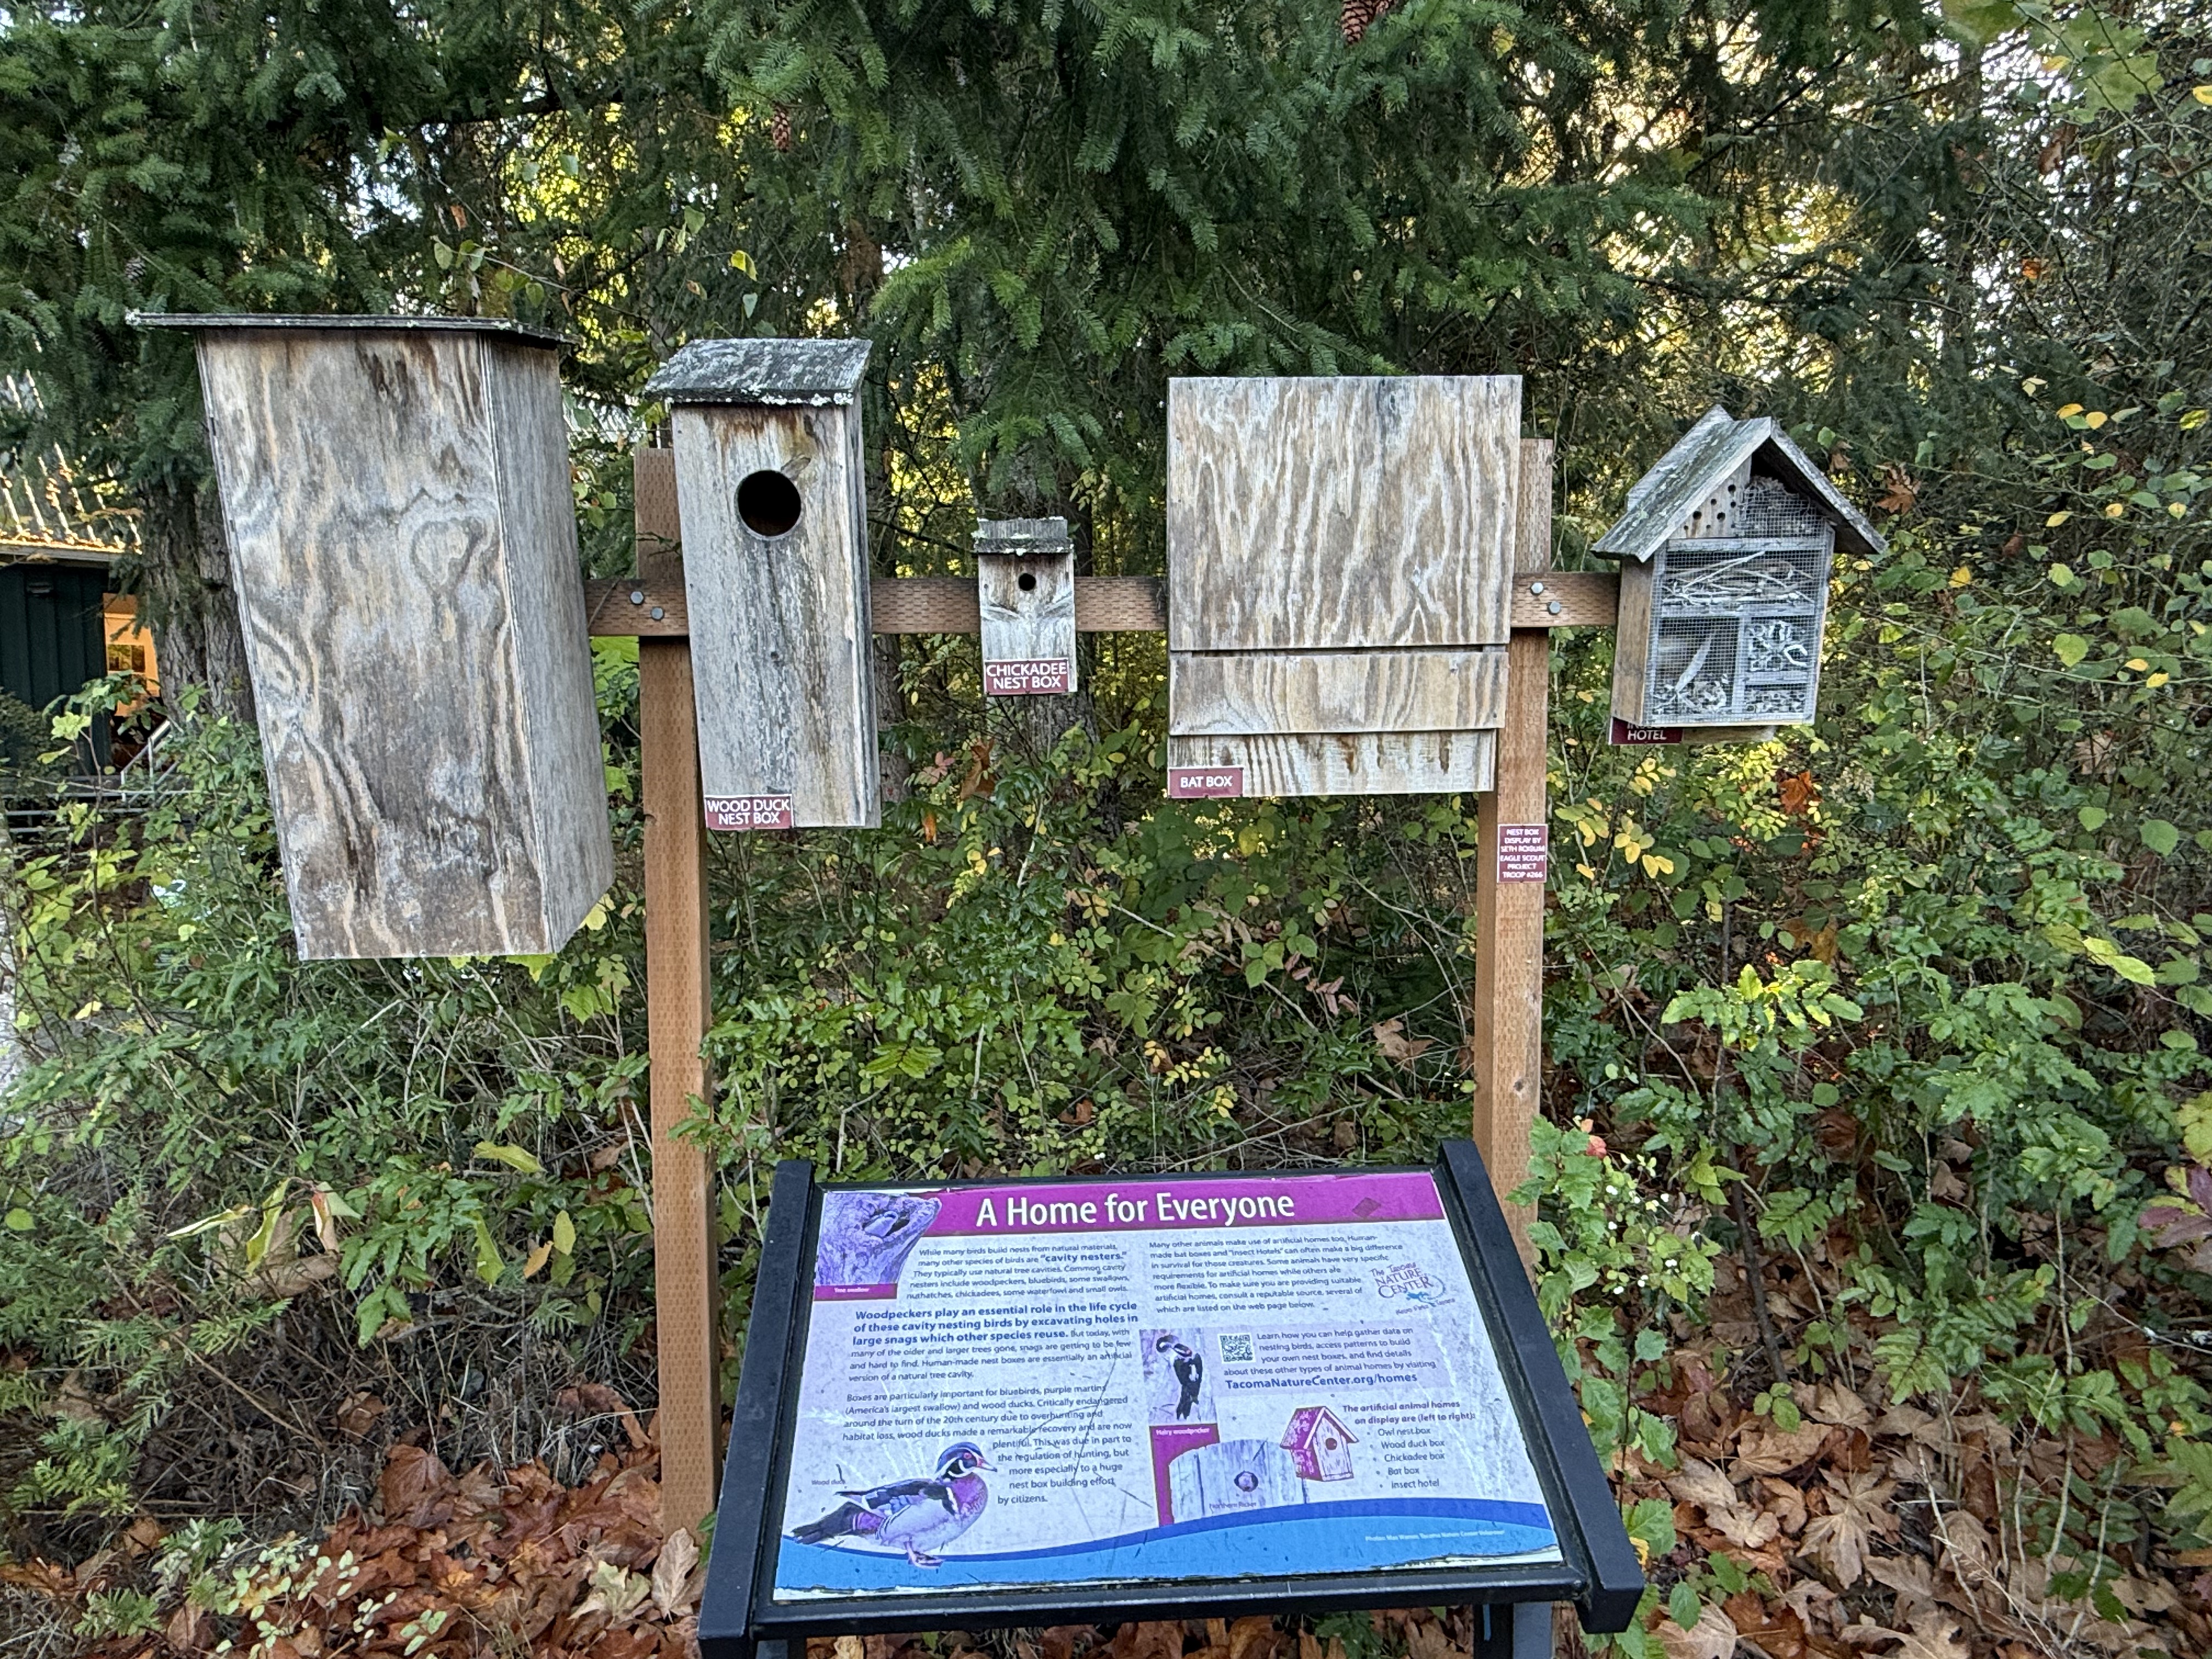
We weren’t looking for birds, but this display showcases some of the birdhouses constructed within the area.
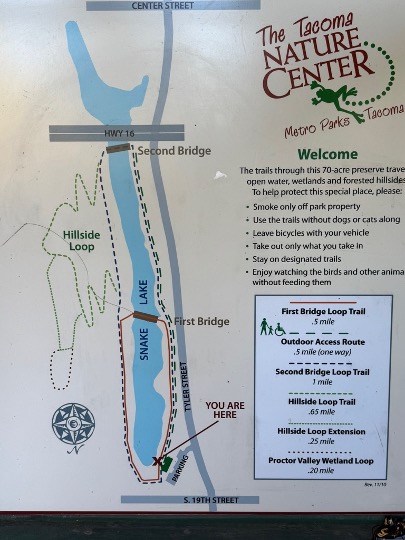
We walked the entire trail system, which is almost three miles, and noticed several signs indicating stops on different self-guided tours. Unfortunately we didn’t have a guidebook. This post is about learning from experience. (LOL!)
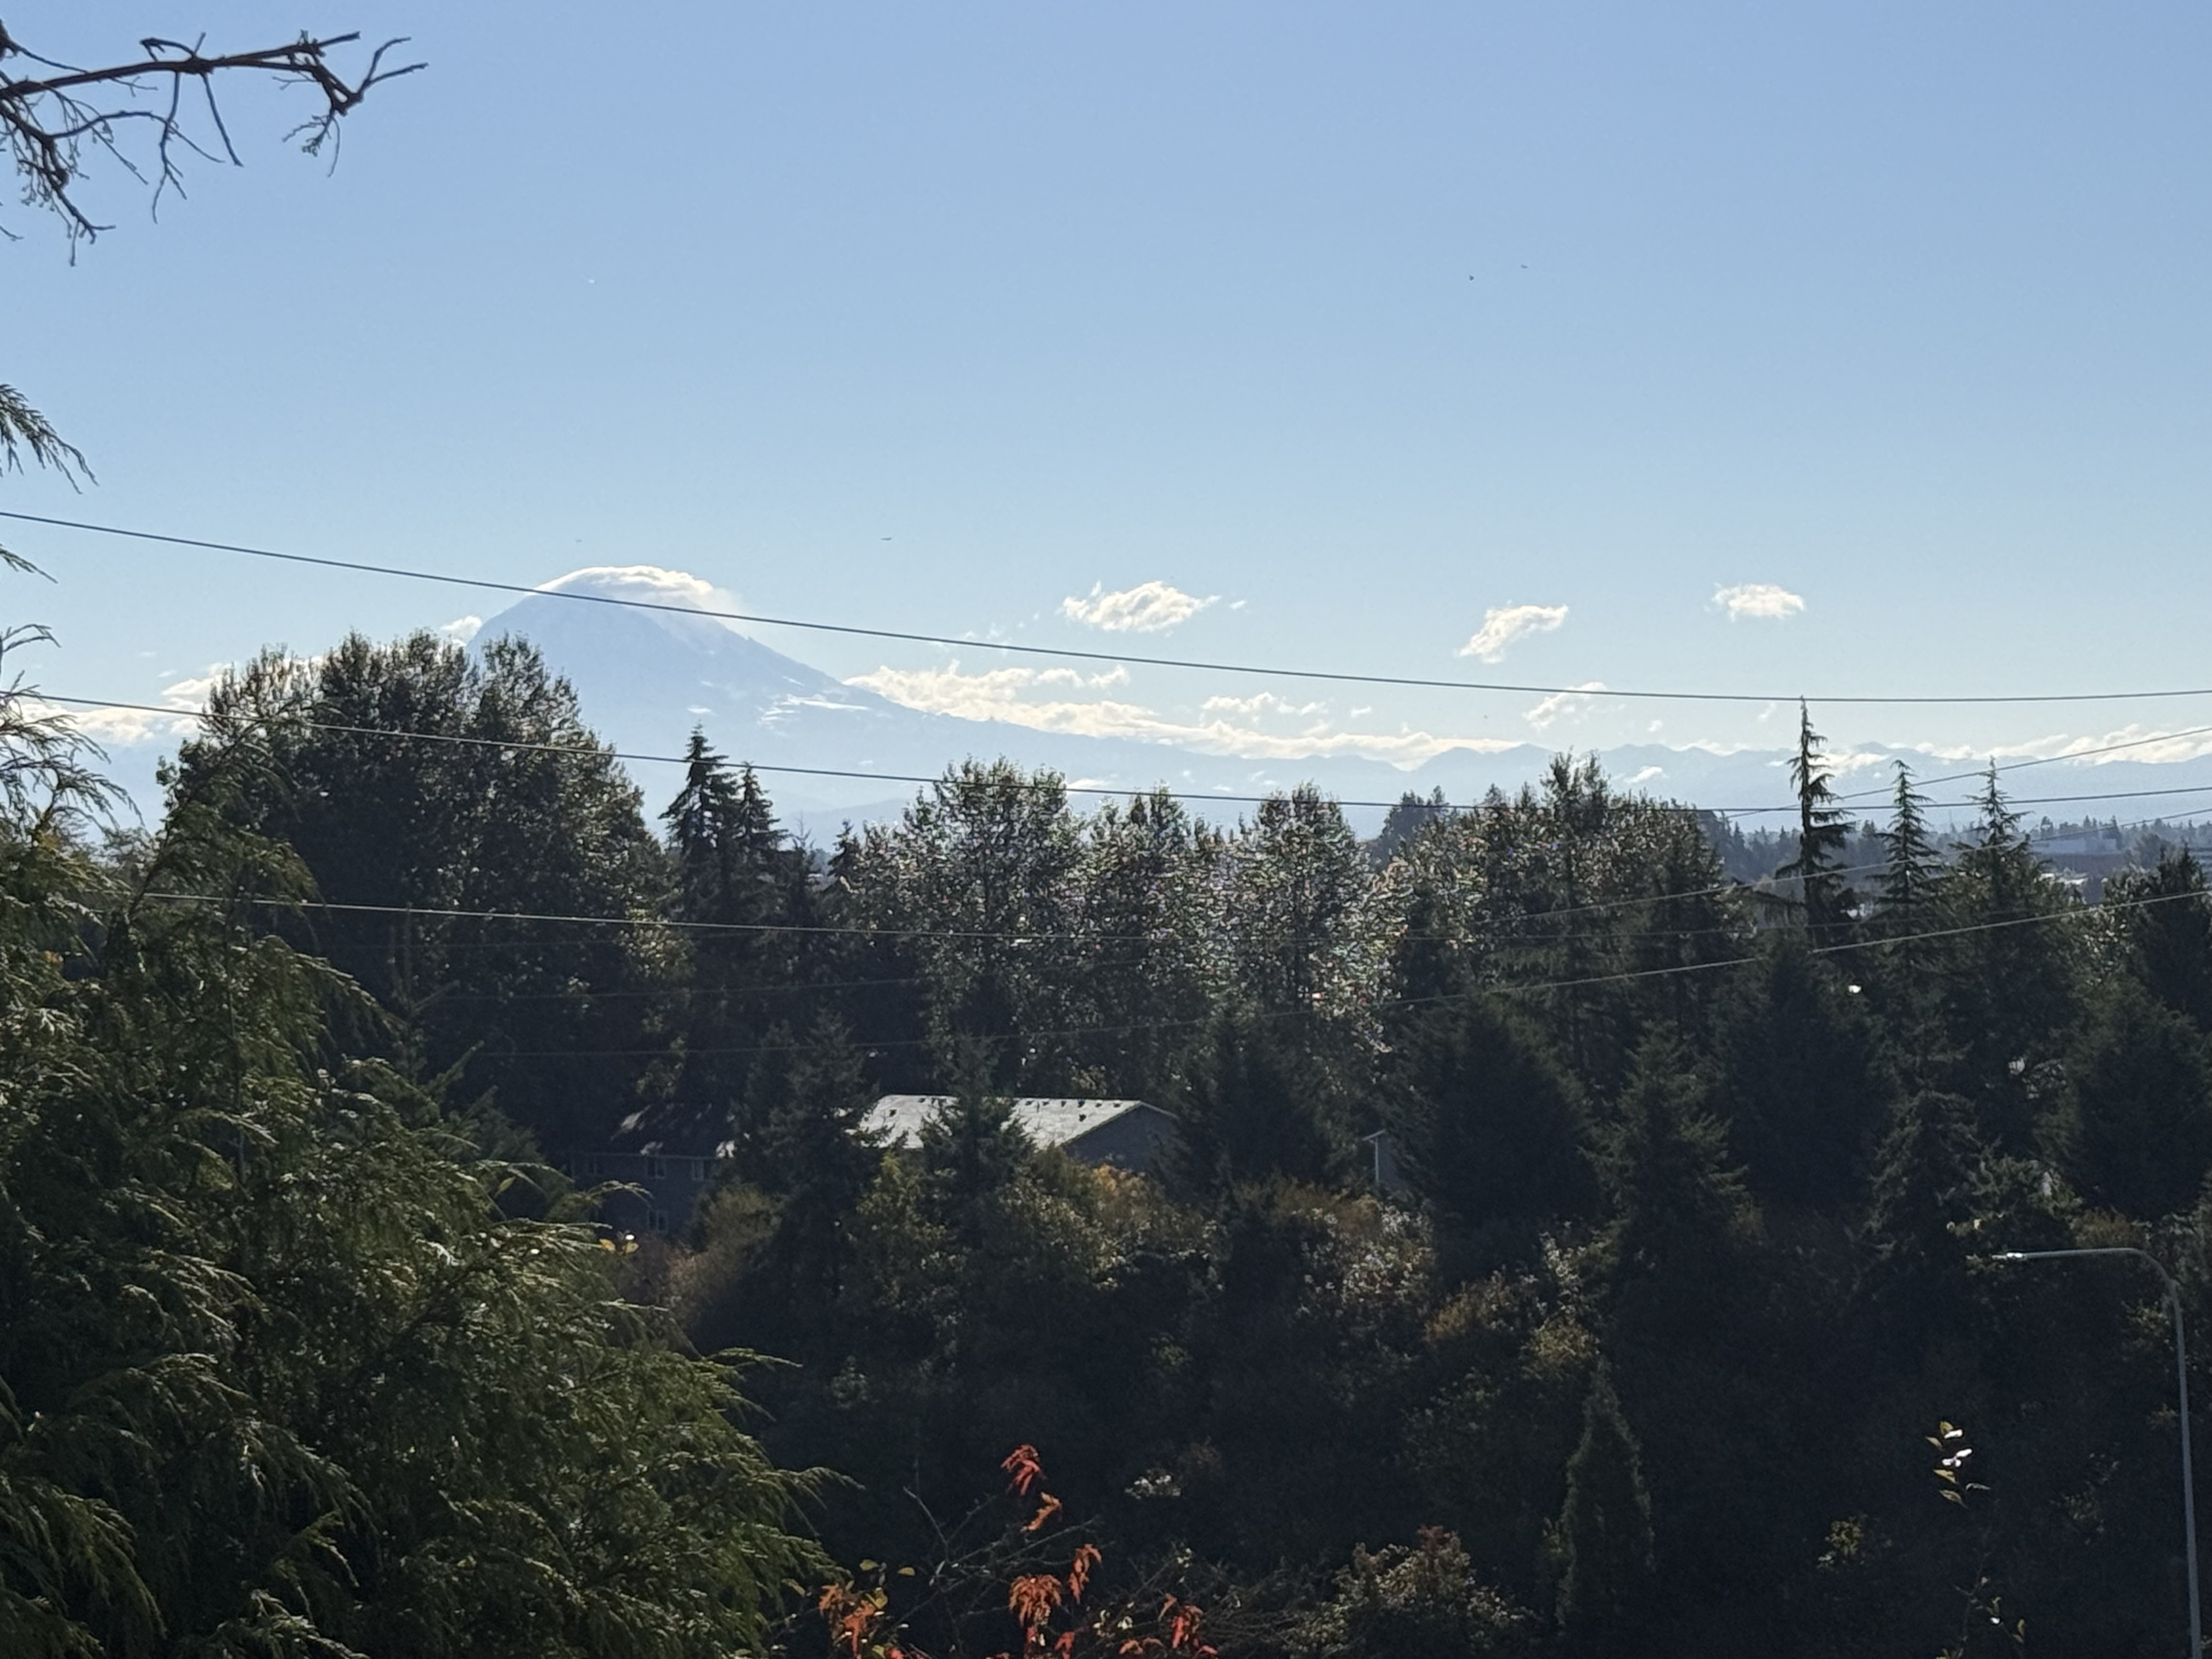
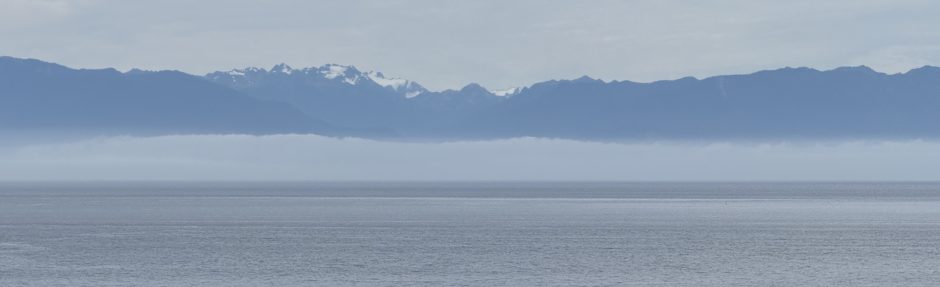
The trail climbed about 100 feet to a ridge that gave a great view of Mt. Tahoma (aka Mt. Rainier) on a beautiful day. Note the cloud trailing off the top of the mountain in a northerly wind.
Snake Lake was dry and the deciduous trees in the wetland were losing their leaves, so I didn’t take much interest in them. It wasn’t until we followed the Hilltop Trail that I began to notice the different ecosystems juxtaposed in this seventy-acre site. The rest of this post, therefore, will focus on trying to salvage something intellectual from what started as simply a walk in the woods.
Tacoma Nature Center supplies a catalogue of the flora and fauna located within its limits. I took a couple of photos and, when I got home, discovered the lists they supplied on their web page. Thus, instead of guessing what I’d seen, it was more like a homework assignment with a limited number of choices.
Trees
This is a list of the trees known to exist at Tacoma Nature Center. The ones I identified are in bold typeface.
- Sitka Alder
- Oregon Ash
- Cascara Buckthorn
- Black Cottonwood
- Douglas Fir
- Pacific Madrone
- Scouler Willow
- Garry Oak
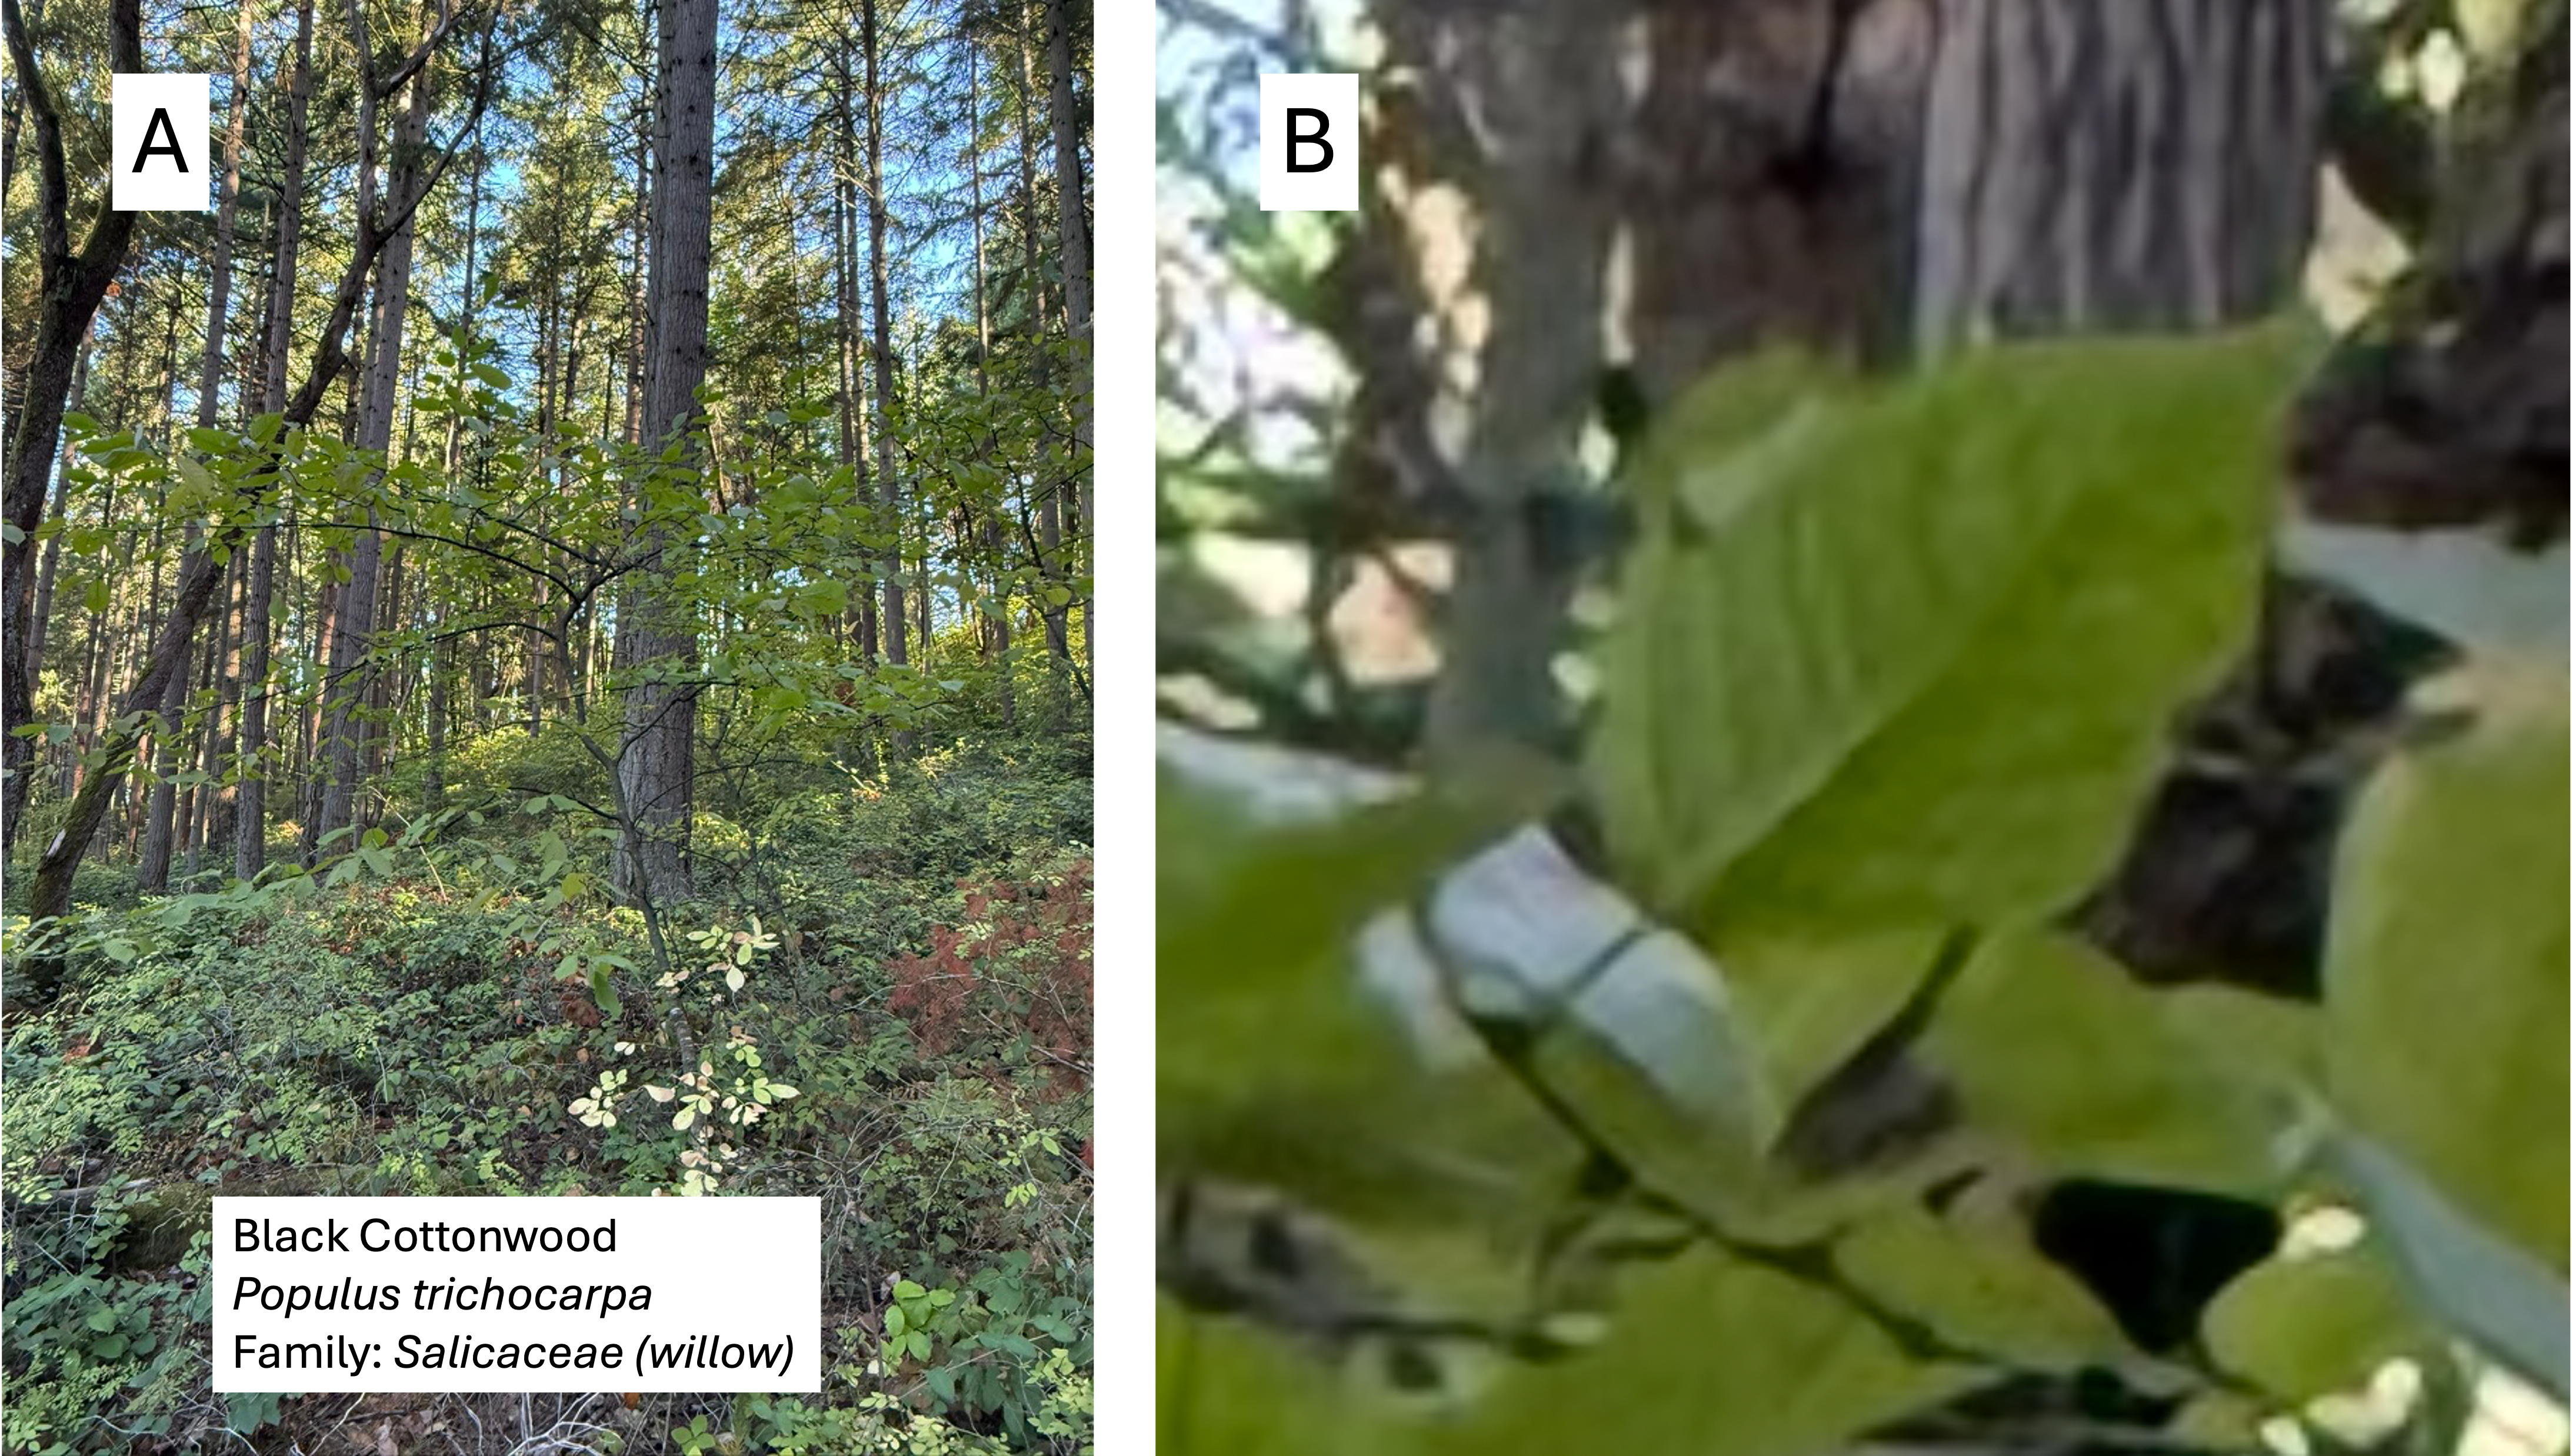
(A) This young tree still had all of its leaves, so I used my copy of Pacific Coast Tree Finder to identify it. (B) The leaf shape and vein structure was critical. If I hadn’t already had a list of possible choices, however, this would have been a lot harder; in fact, my answer may well be incorrect.
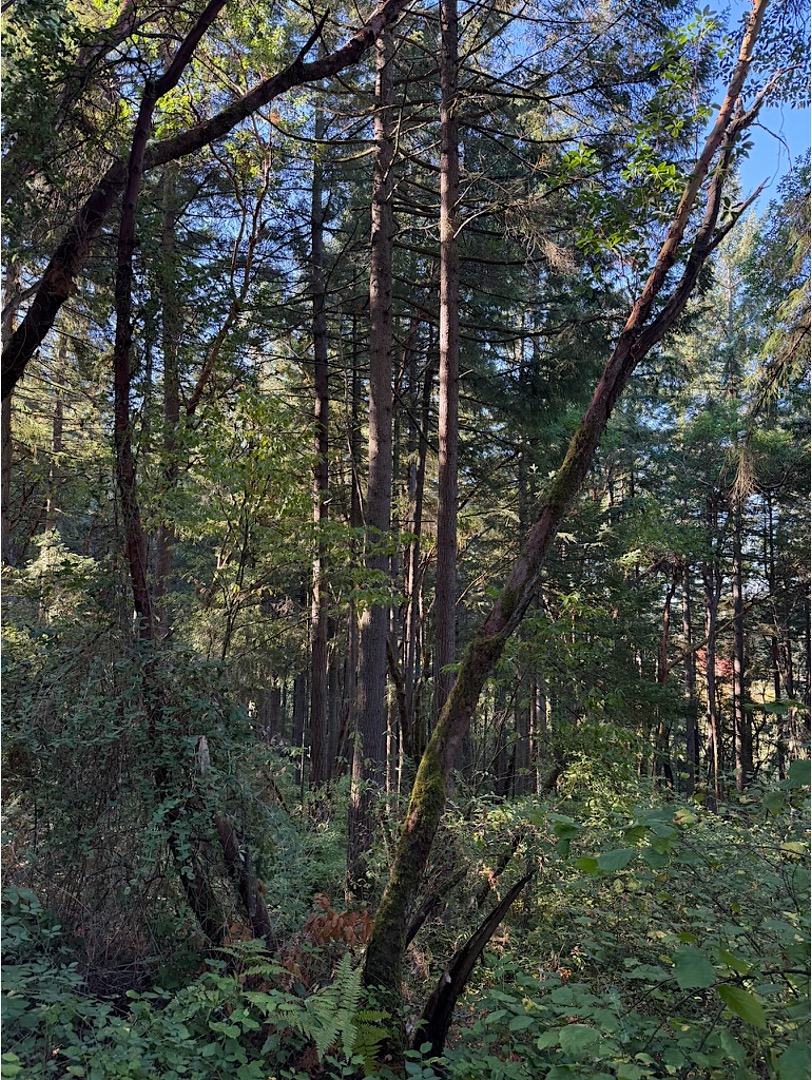
I’ve seen enough Douglas Firs to guess these conifers, especially since it is the only native conifer found within the nature center; all of the old-growth forest was clear cut and this species planted because it grows fast and is a good source of lumber.
Shrubs
This is where my homework got very difficult. So I asked for some assistance from ChatGPT, but I fact-checked everything it said and, after a long discussion, we agreed on the final identifications. It may have read everything ever written, but it can’t see what isn’t visible in a photograph, and it is prone to making things up–just like people.
As with the trees, I’ve emphasized my answers in bold type.
- Baldhip Rose
- Beaked Hazelnut
- Black Twinberry
- Bracken Fern
- Clustered Wildrose
- Common Snowberry
- Creeping Snowberry
- Douglas Spirea
- Dwarf Oregon Grape
- Evergreen Huckberry
- False Lily-of-the-valley
- Indian Plum
- Oceanspray
- Orange Honeysuckle
- Red Elderberry
- Red Huckleberry
- Salal
- Sword Fern
- Tall Oregon Grape
- Trailing Blackberry
- Western Trillium

This bramble of shrubs contains five separate species of shrubs or ground cover from the list. I’ve circled examples of each and discussed them below. I supplied ChatGPT with close-up images to get its input. It was very useful, but not infallible. In fact, I identified (A) and (D) on my own, after taking a closer look at the photo–and using Wikipedia as a reference.
(A) Bracken Fern (Pteridium sp., family Dennstaeditaceae) is the oldest known fern, with fossils from the Eocene epoch (~55 my). If you zoom in on this area, you’ll notice that each branch has perpendicular stems, which then have perpendicular leafs. The entire plant reminds me of what I’ve heard about fractals in nature; a simple pattern repeating over and over.
(B) Baldhip Rose (Rosa gymnocarpa, family Rosaceae). There are two roses on the list, but their leaves are very different.
(C) Dwarf Oregon Grape (Mahonia nervosa, family Berberidaceae). Wikipedia redirected my reality check of ChatGPT’s identification to Berberis nervosa. The explanation was that Mahonia is an alternative scientific name to the accepted one. Not being a botanist, I don’t care about such subtleties. The name, Berberis, certainly fits the family lineage better. I’ll leave the name as is and include these notes.
(D) Western Sword Fern (Polystichum munitum, family: Dryopteridaceae). This more modern cousin (note the different family) of the Bracken Rose has a simpler leaf design: it has one broad leaf growing perpendicular to the main stalk. I didn’t notice such a blatant difference when the two plants were right in front of my eyes!
(E) Creeping Snowberry (Symphoricarpos mollis, family Caprifoliaceae) is my best estimate after a long conversation with ChatGPT, examining photos of several species, and comparing their growth habits. This example is more like ground cover than an erect, woody plant. I wouldn’t bother with the species name except that the catalogue lists two species. I’ll look for the other one next time I get to the nature center.
Final Thoughts
I hope that everyone who reads this takes more notice of the plants they encounter wherever they go. And you can always take a picture.
And don’t be afraid to ask a Large Language Model (e.g. ChatGPT, Claude, Gemini) for help identifying whatever you find. They are knowledgeable, unassuming, and fun to work with.
And they will readily admit when they are wrong…
Mount Saint Helens Revisited: Ape Cave
We made it to our destination (Fig. 2) and explored a rare lava tube at Mount Saint Helens. This lava was erupted 1900 years ago as part of the same sequence that destroyed the forest a short distance away.
A full discussion of this fascinating natural feature is available from Washington Department of Natural Resources.
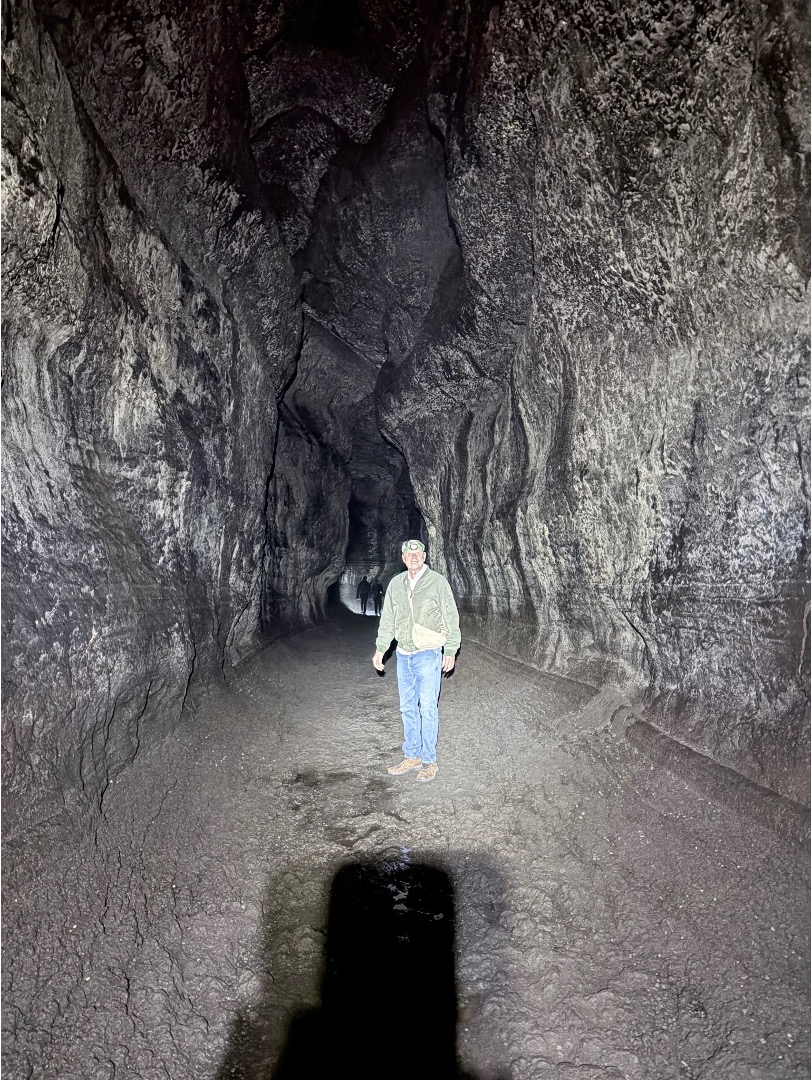
Figure 1. This lava tube is a lot larger than the tree casts we described in the last post. This immense cavern, which is more than 2.5 miles long, was created when a single basaltic lava finger flowed over the landscape. The outer material cooled in the air and insulated the interior, like an oven, allowing the remaining lava to exit the end of the tube. This left a void to be filled by subsequent lava flows. According to the information displayed at the site, the entire eruption lasted about 100 days.
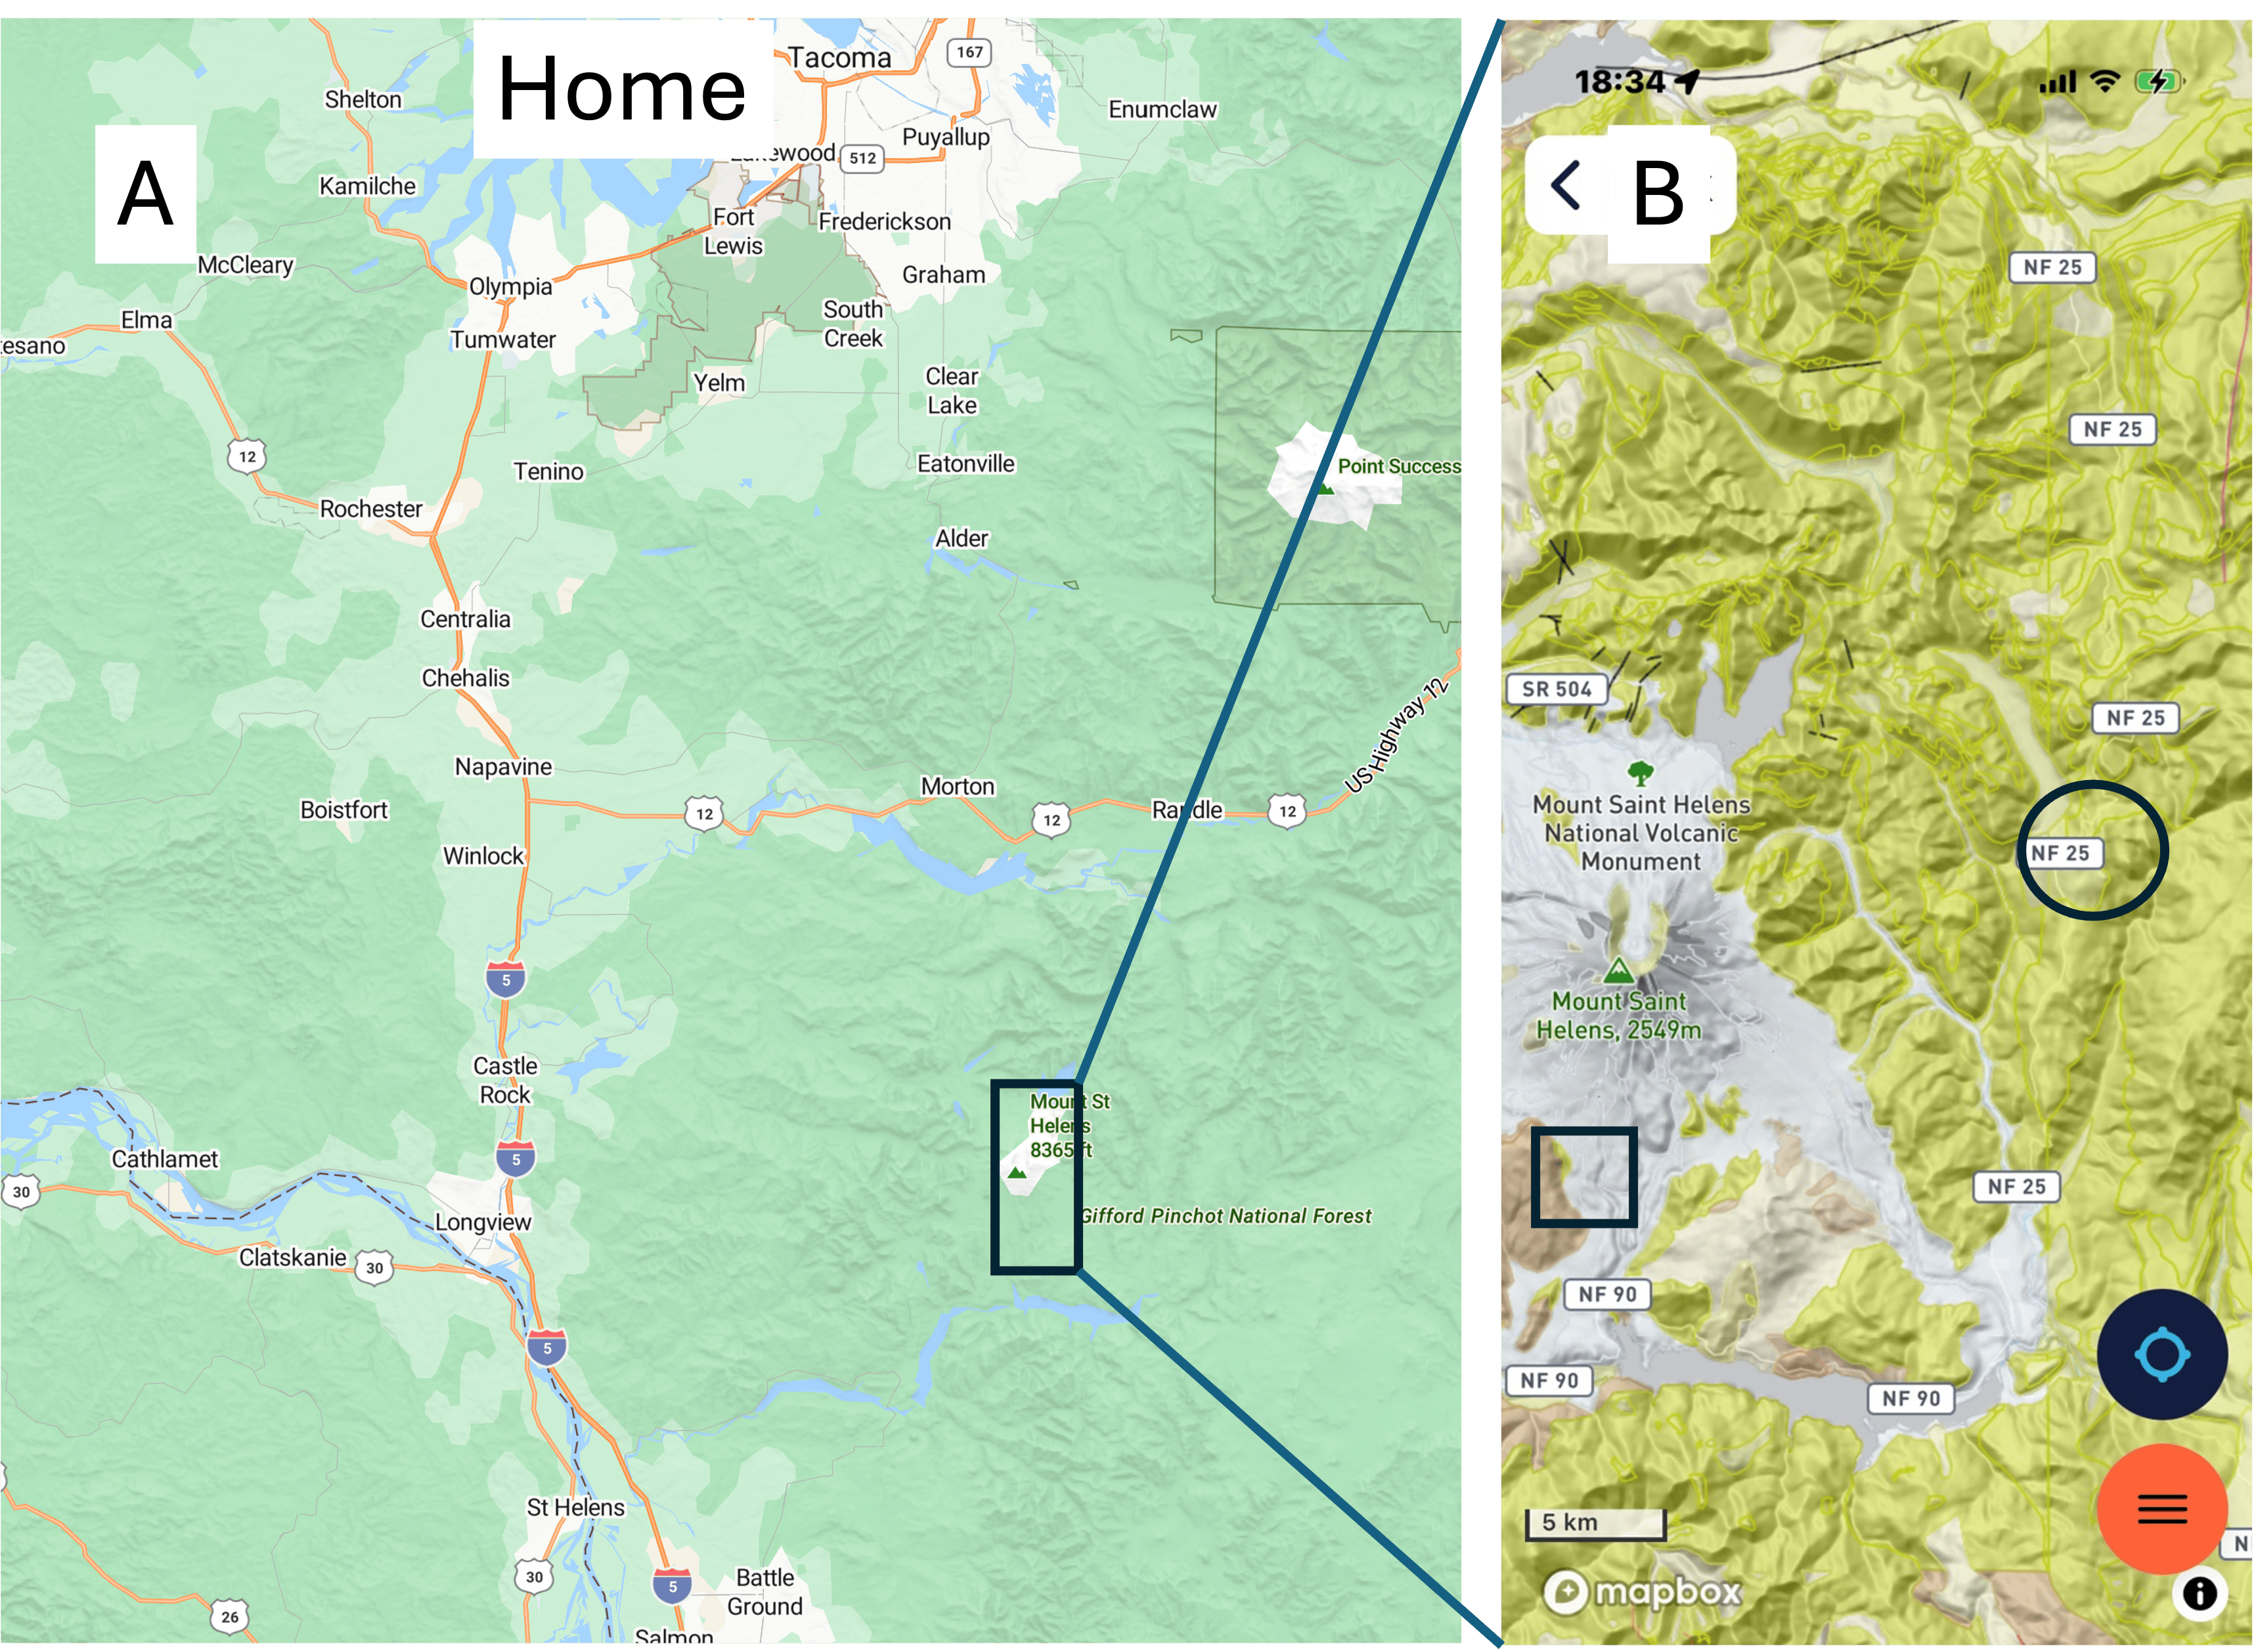
Figure 2. Ape Cave is presumably named after the first eruption sequence of Mount Saint Helens, dated about 40 Ka. I didn’t find an explanation for this confusion, but it might have something to do with the Bigfoot legend associated with Ape Canyon, not far away. At any rate, the lava tube is indicated by the square in (B).
This video captures the scale of one of the many chambers better than any image. My narration isn’t very technical.
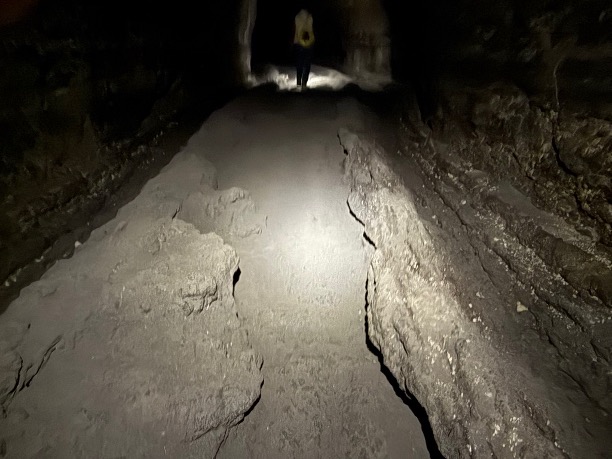
Figure 3. These parallel ridges running along the bottom of the cave near its terminus are the remnant of the last flow to use this conduit to reach open air.
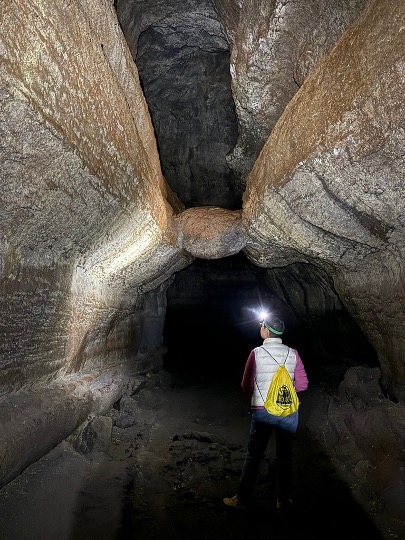
Figure 4. A block of basalt transported through this narrow passage became stuck where the walls of a previous flow almost meet, leaving it stranded. It looks like it partially melted into the walls, however.
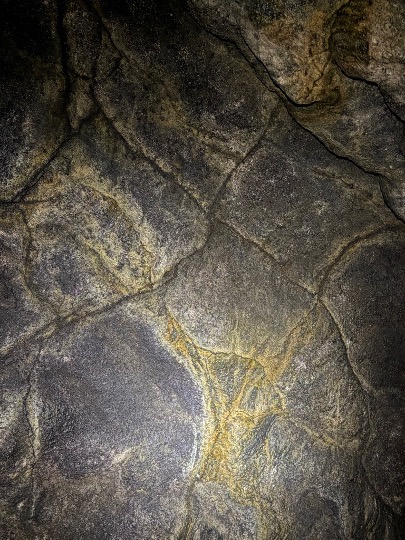
Figure 5. This view of the ceiling reveals a joint pattern caused by cooling of the outer layer of lava. Several generations of fractures occur throughout the cave, created as individual flows cooled differentially.
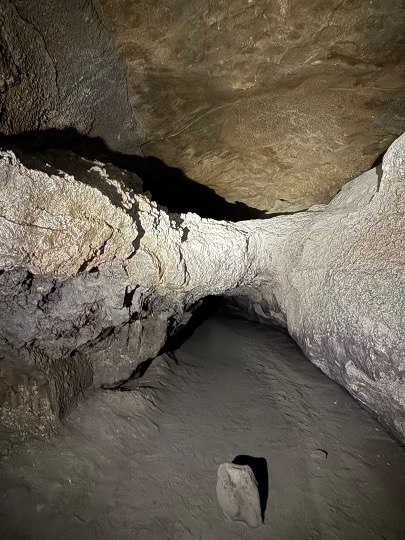
Figure 6. This is the end of the tube as it exists today. Apparently, there is no modern opening; it probably collapsed during the last 1900 years.
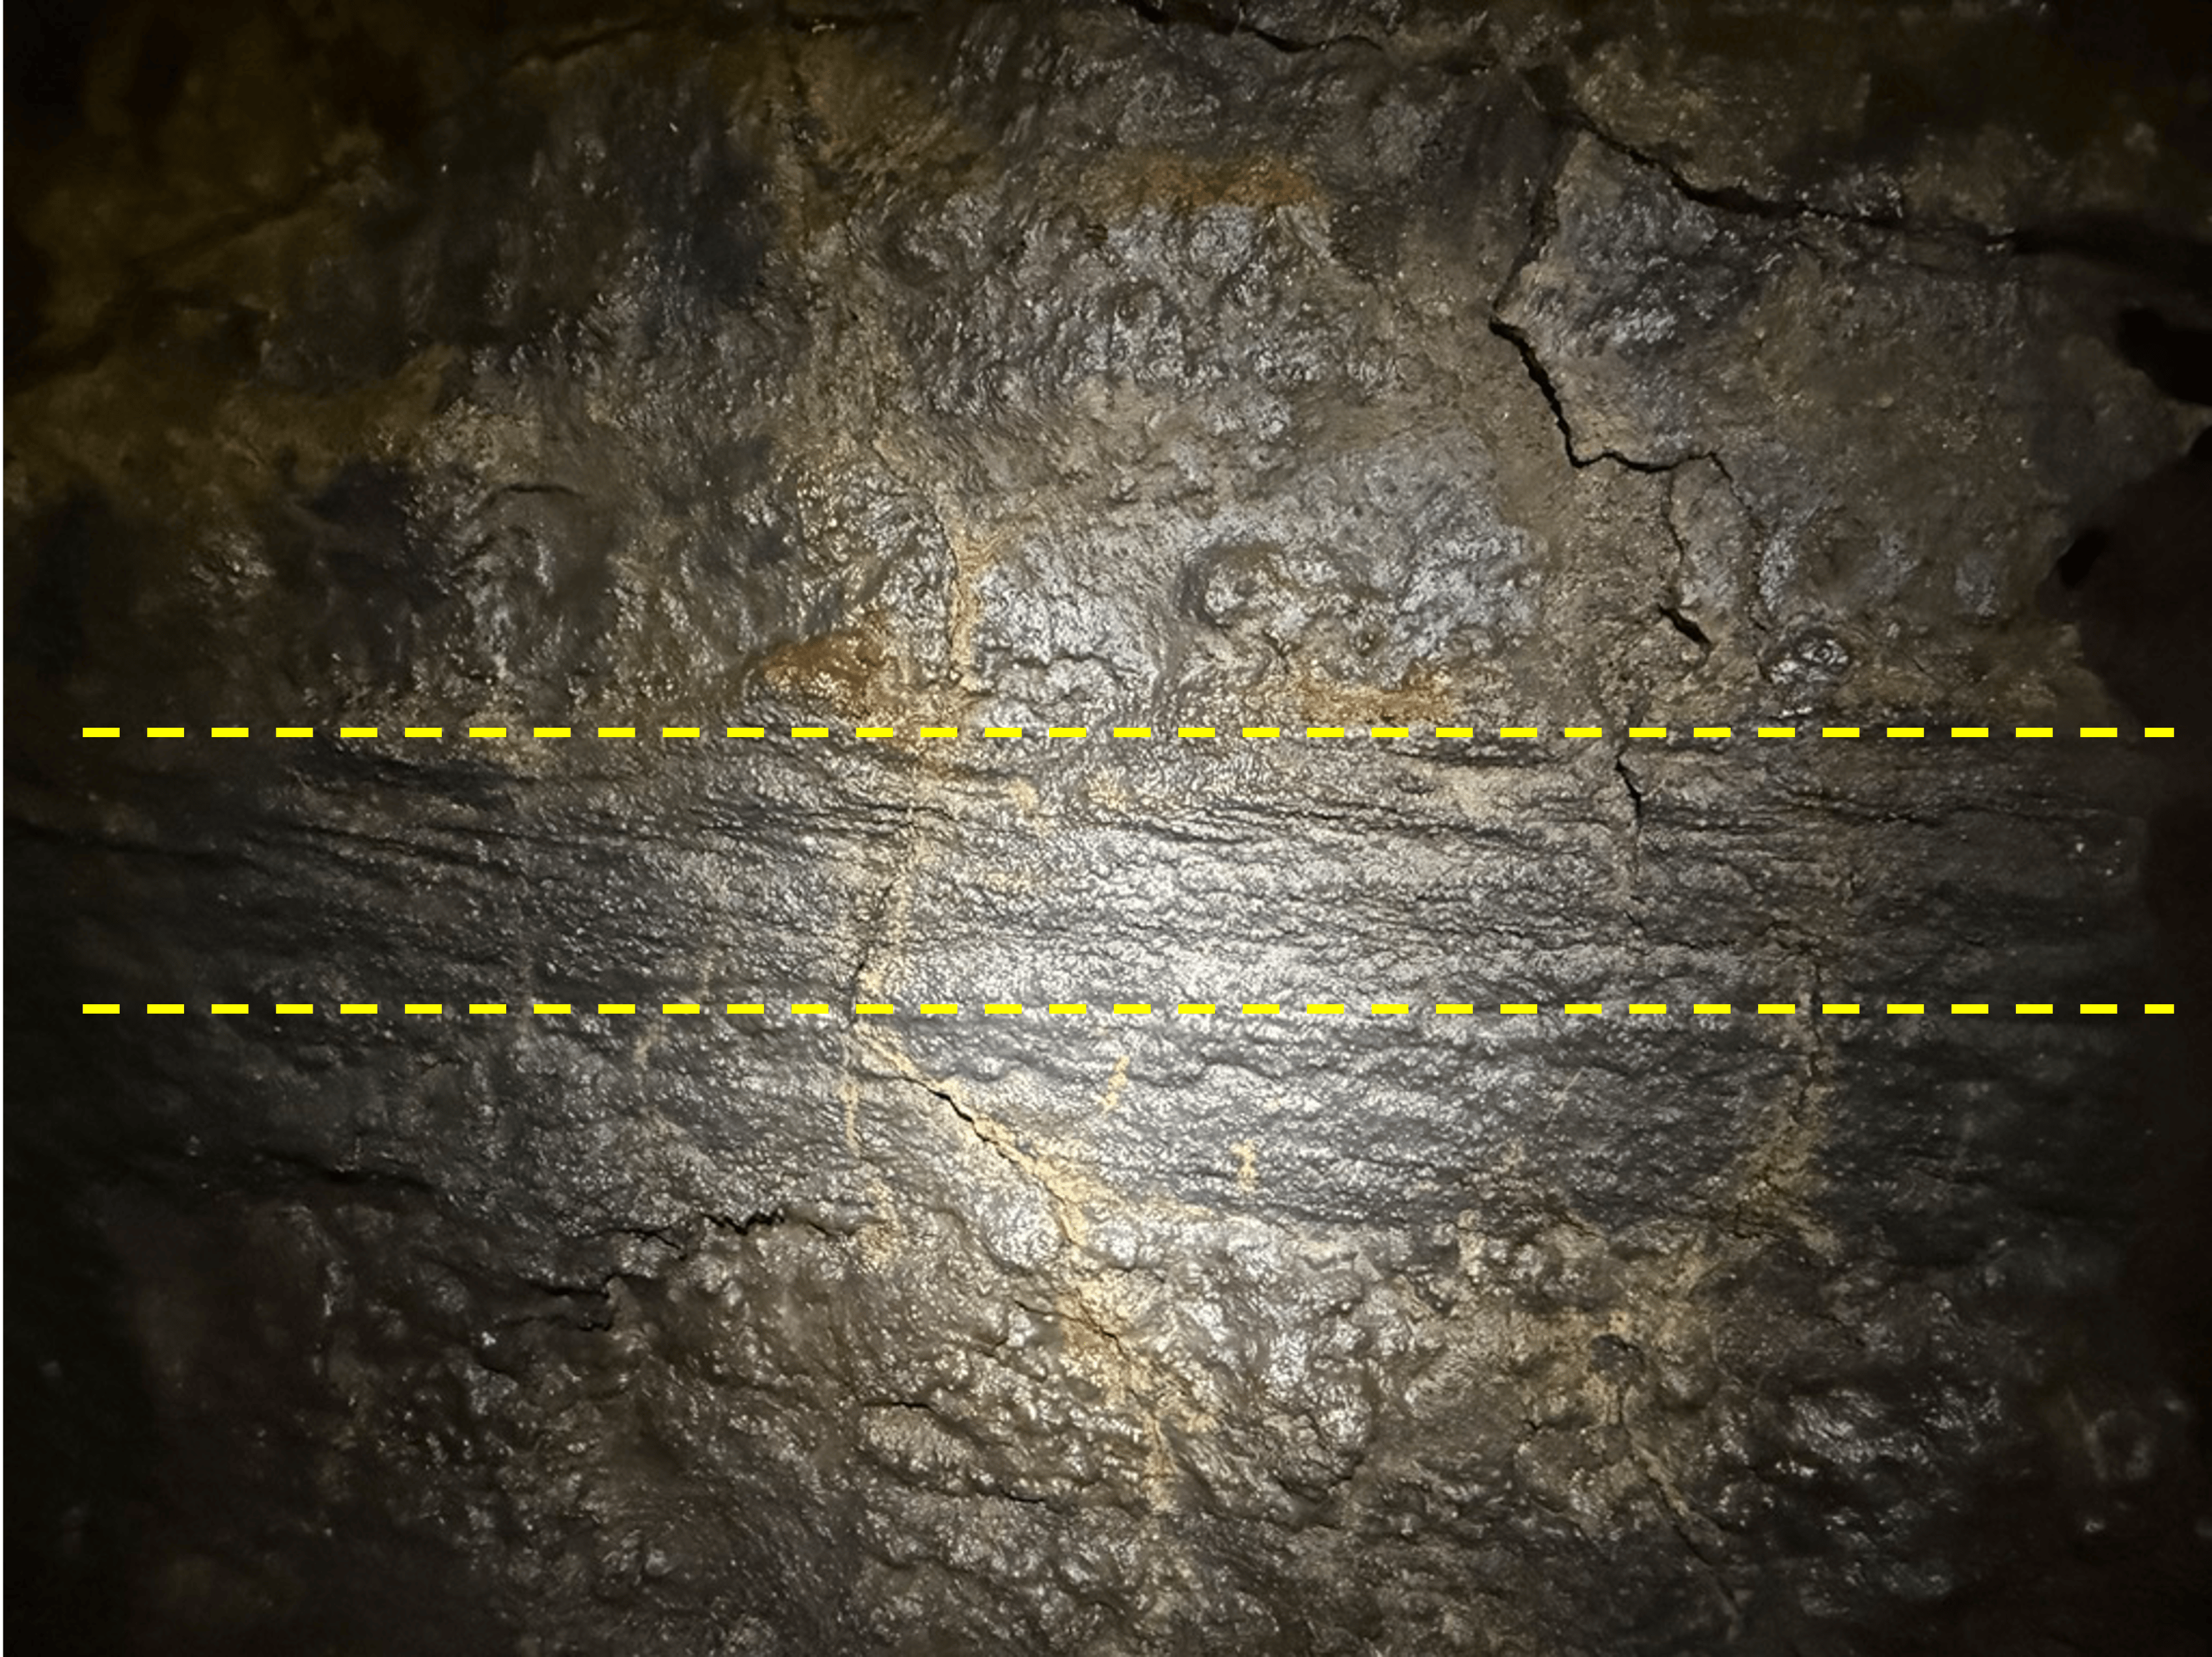
Figure 7. As a retired sedimentologist, I immediately noticed the layer outlined by the dash lines. This looks like cross-bedding; the layer fills a depression below the line, and is truncated by an overlying flow. This is interesting because cross-bedding is associated with particles being transported by wind or water; how it appears in a lava flow is an intriguing problem–perhaps heavy minerals like pyroxenes and lighter plagioclase feldspar?
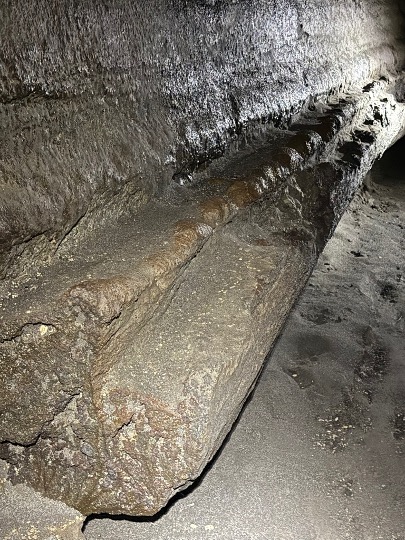
Figure 8. This is a good time to briefly explain how the ledges seen in Figs 1, 4, and 6, and the video, were formed.
Once the lava tube was created by cooling of the surface of the original flow, subsequent flows ran through, but didn’t fill, an insulated tube. Their surface was usually below the original ceiling. The coolest parts of this conduit would have been the sides (heat dissipates more quickly through older, cooler basalt than the superheated air above the lava river). Thus, ridges like these formed where the molten basalt hardened. Of course, these subsequent flows were of different volumes and the rules of stratigraphy cannot be applied. Geologists have worked out these relationships but that is beyond the scope of this report.
Let’s just say that many rivers of magma flowed through this channel, like stormwater through a sewer pipe–some larger than others.
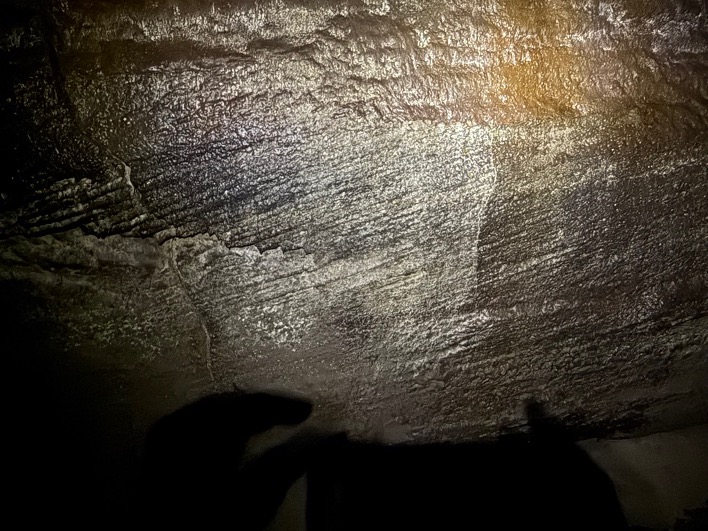
Figure 9. This is an enigmatic photograph because I don’t remember which wall it was on. I didn’t notice the detail when I took the photo, and now I can’t say if this is an excellent example of cross-bedding (always tilts downstream) as in Fig. 7. or a total mystery. My only excuse is that it was TOTALLY BLACK in the cave and I was disoriented the entire time.
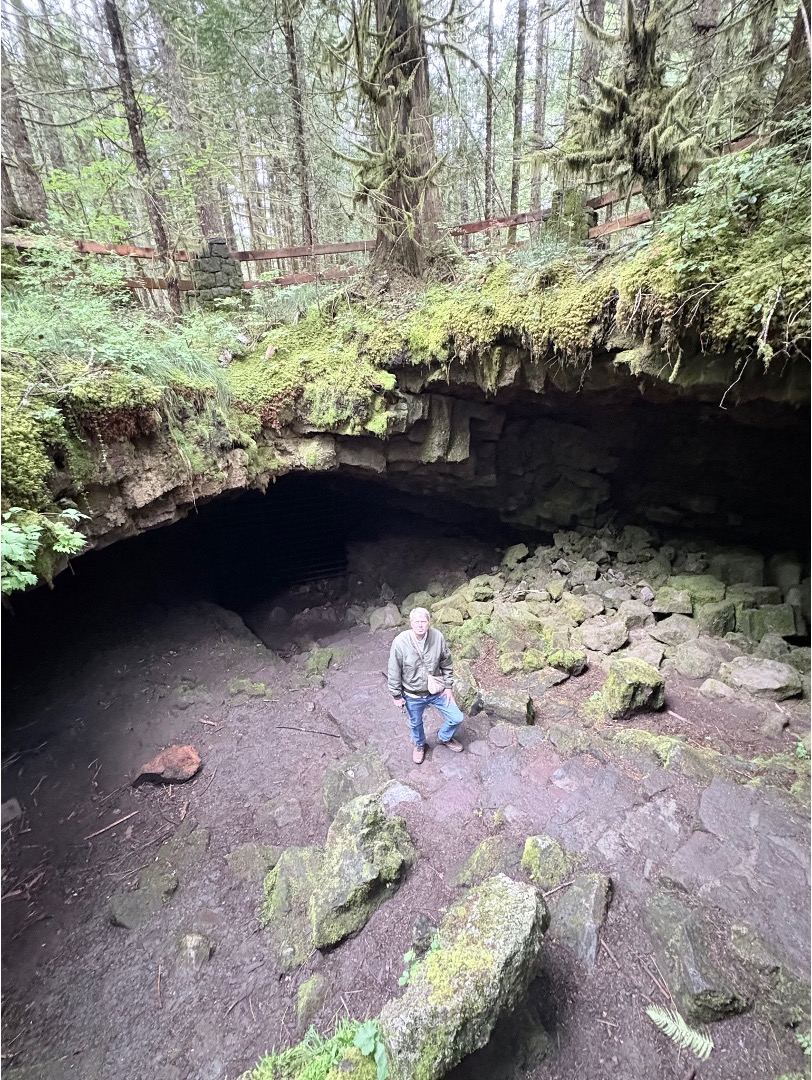
Figure 10. We made it out without spraining an ankle or hitting our heads. This cave-in is the only entrance/exit for the downstream part of the tube. There is another one 1.5 miles upstream, but that route is difficult (according to the park information).
Final Thoughts
The Ape Cave lava tube, and the missing forest from my previous post, are part of the Spirit Lake eruption phase of Mount Saint Helens, which began about 1900 years ago and continues to this day. The magma chamber didn’t erupt at the center of the stratovolcano, but instead found an opening along one of the many cracks in the thick pile of volcanic rock that had accumulated during at least 50 million years.
Lava tubes present a unique eruption environment. Ground water that finds its way into the magma chamber cannot escape, thus pressurizing the conduit and altering the lava’s behavior. Imagine lava as thin as water surging through this passage, sloshing around, encountering obstacles, rushing headlong downhill towards what apparently was a small opening, if Fig. 6 is any indication of the narrowing channel.
It was a great drive through a wild terrain to reach Mount Saint Helens, and the destination was worth the effort.
Mount Saint Helens Revisited: A Missing Forest
My last post reported on Miocene (23-5.3 Ma) volcanic rocks on the eastern flank of Mount Saint Helens. Those rocks predate the creation of Mt St Helens, however; we reached our destination and, before exploring a lava tube called Ape Cave, we examined some interesting geology that is part of the most recent eruptive stage of this active stratovolcano. The Spirit Lake stage began about 4500 years ago. There were three earlier stages, beginning about 40,000 years ago; each lasted less than 5000 years.
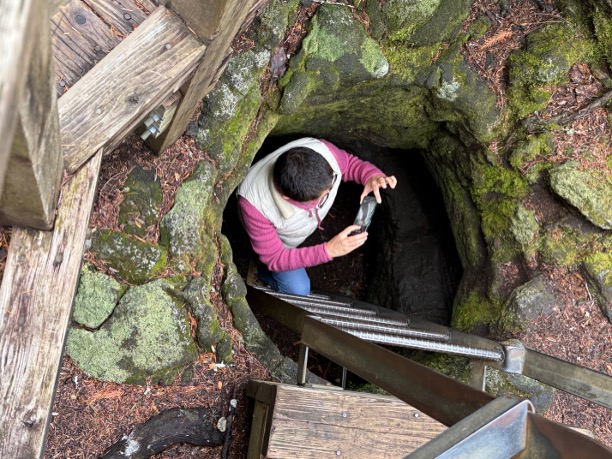
Figure 1. About 1900 years ago, a large amount of basalt lava flowed from a fissure on the south flank of the volcano (indicated by a square in the inset map of Fig. 2). The lava was hot (~1200 C or 2200 F) and set the forest on fire; when the wood had been turned to charcoal, the lava cooled to leave casts of the trees. My wife is taking a photo of a small-diameter tube we’ll examine it more closely below.
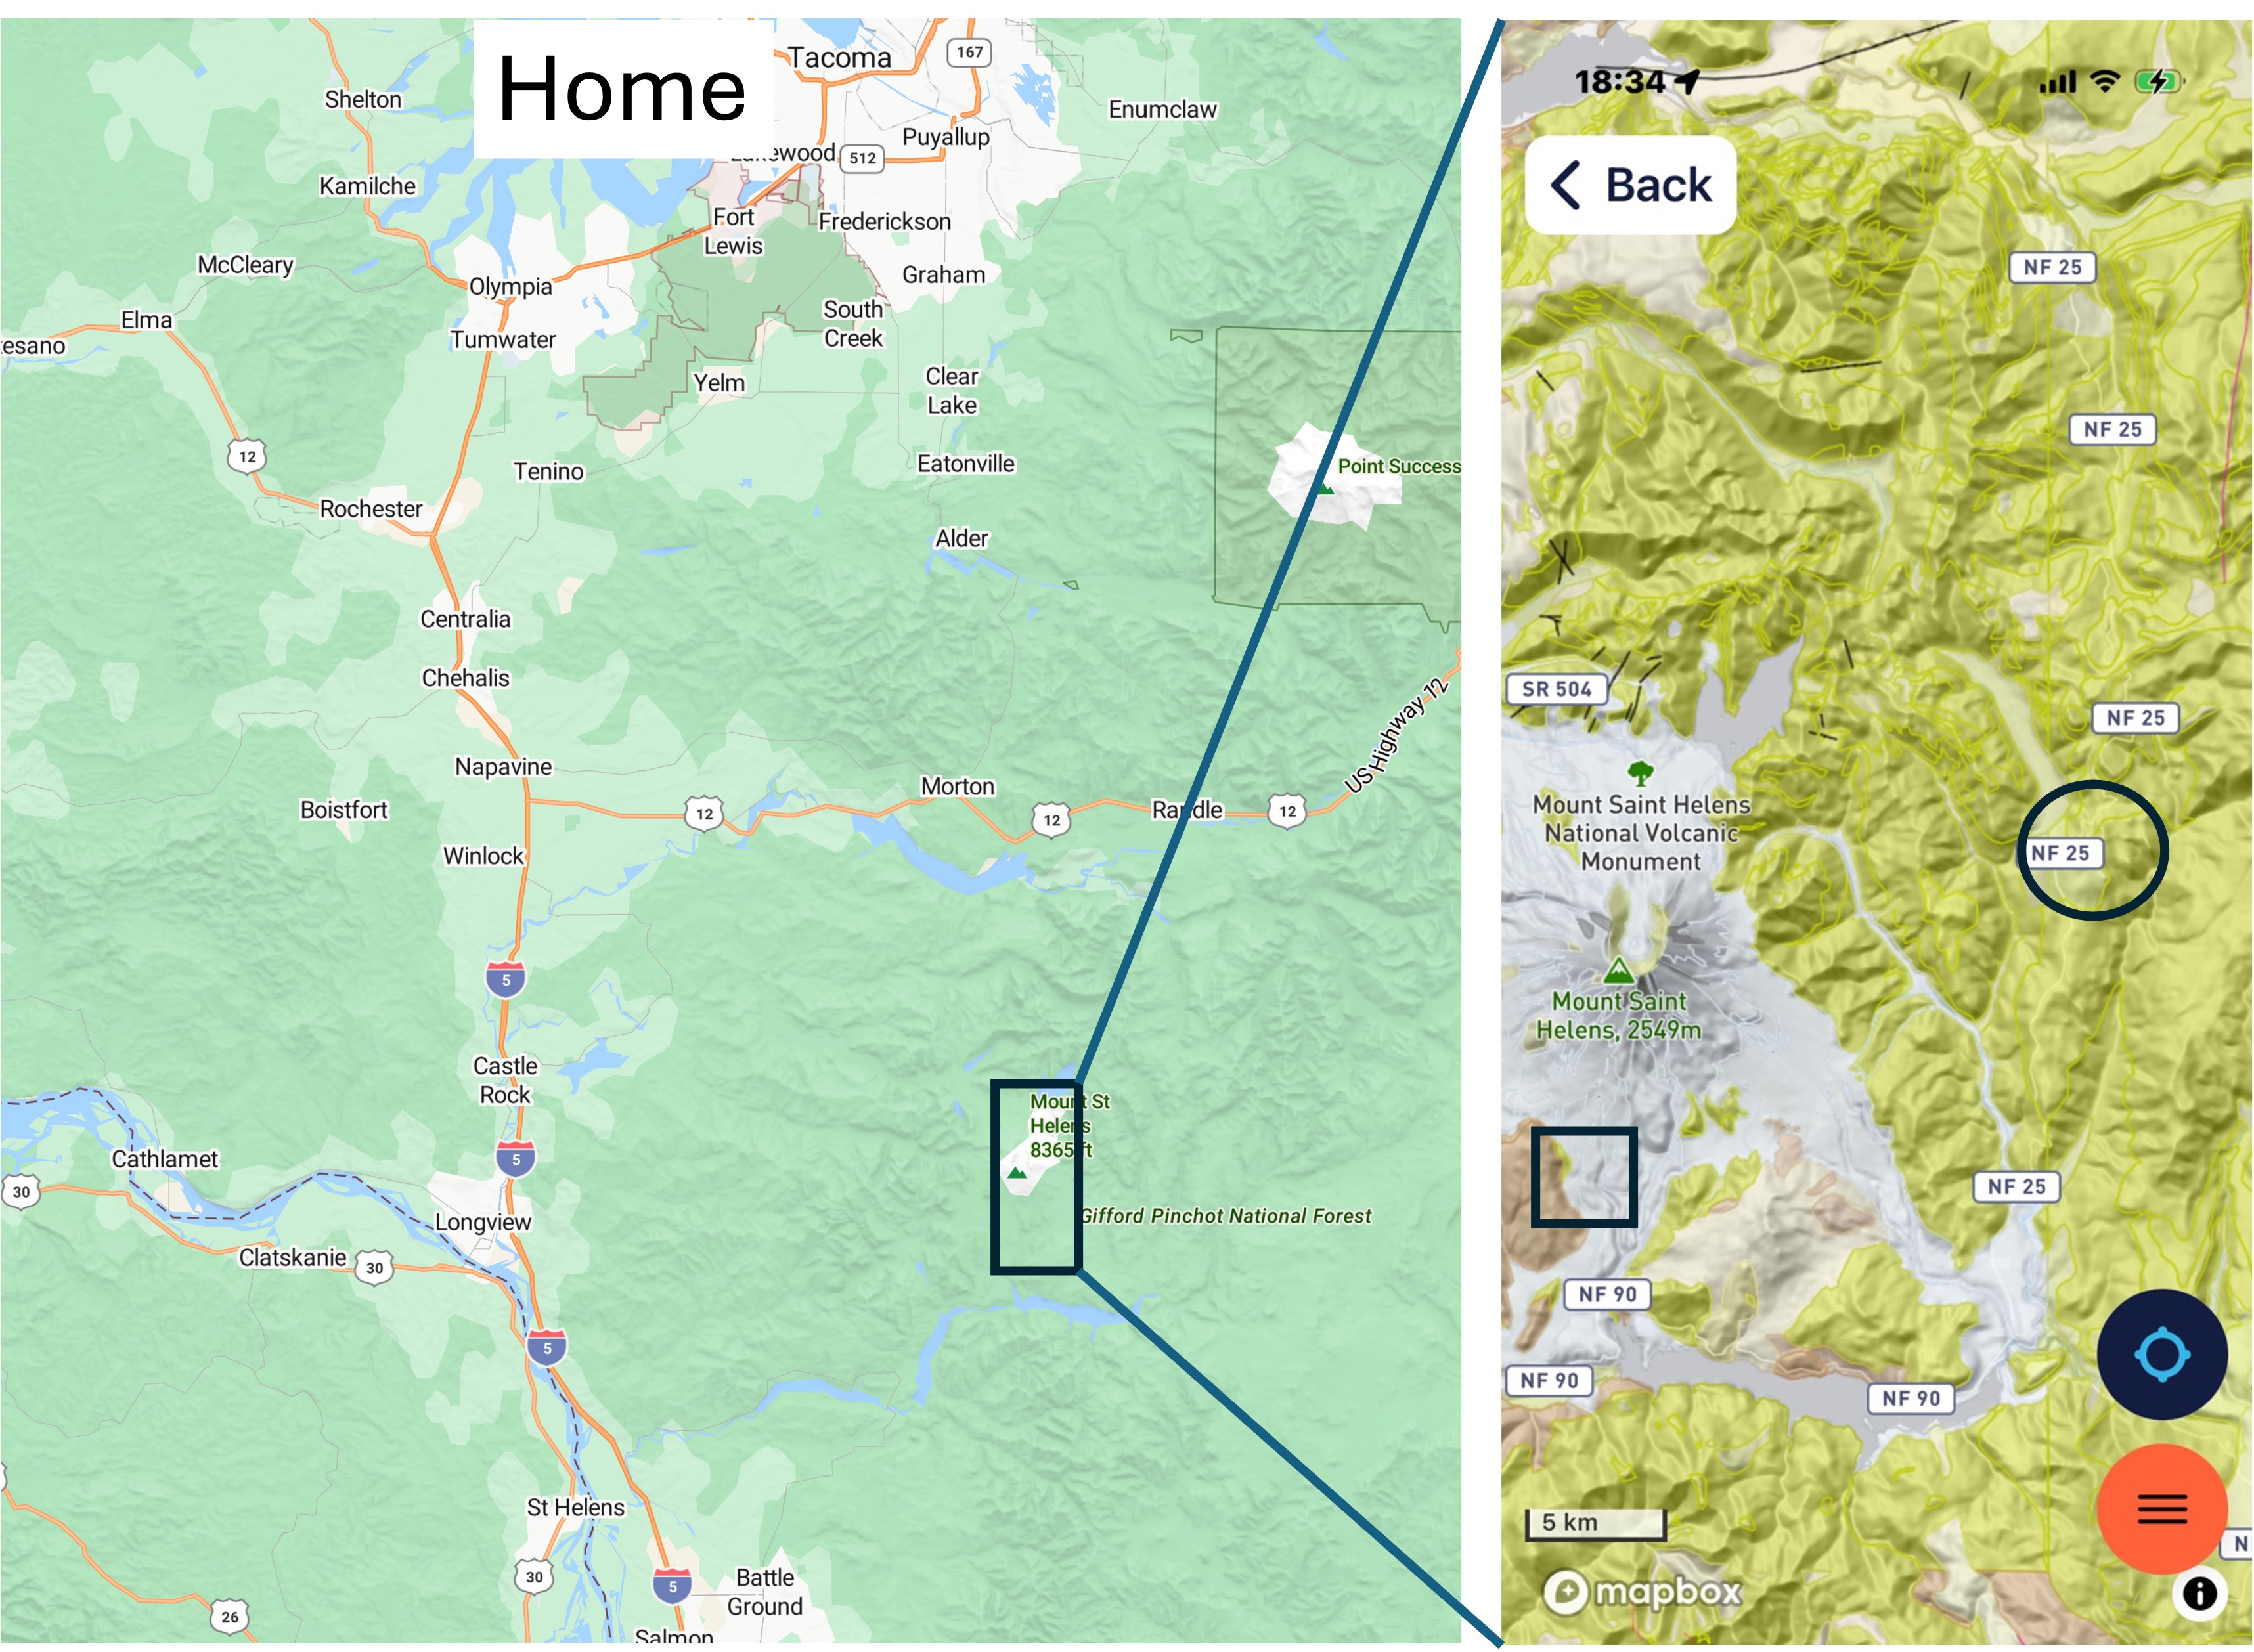
Figure 2. Mount Saint Helens is about 70 miles south of Tacoma (Home in the right map), but the route we followed, around the north and east flanks, takes 3.5 hours to drive. The yellow areas in the inset map are mostly andesite lava flows older than 5 Ma. The circle is where we looked at them in the last post.
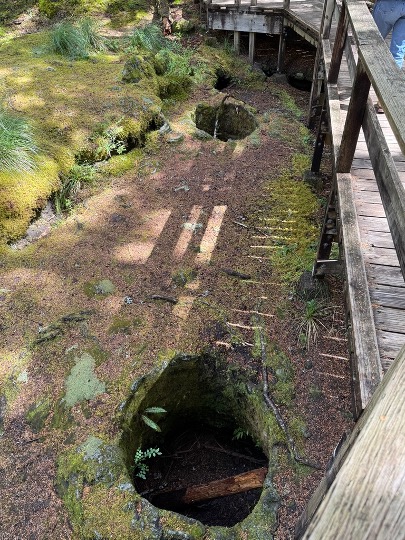
Figure 3. These holes were everywhere, forming a hazard for people walking, so a walkway was constructed over the area where the tree holes are densest. They haven’t been cleaned out and most are 3-4 feet deep.
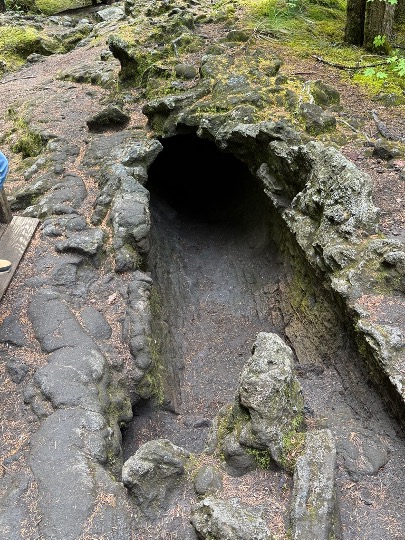
Figure 4. This is the cast of a fallen log. The entrance is shown in Fig. 1; visitors are encouraged to crawl through it, about 40 feet, but it was too tight for us. However, several children I met there had braved the dark, tight tunnel.
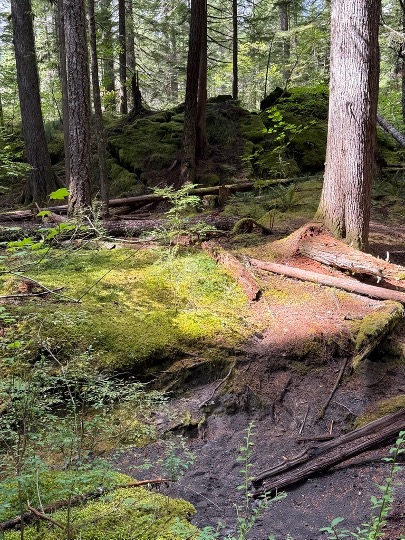
Figure 5. This photo was taken a couple-hundred yards from the missing forest. The background reveals the leading edge of a lava flow that’s about ten-feet high. The foreground shows a stream being incised into the landscape, probably created along a collapsed lava tube. Regrowth of the forest is slow in the lava surface; however, there was no mention of whether or not this area was logged in the last century–it probably was, given the documented greed of the forest industry when it came to cutting down trees. However, I didn’t see any large stumps, so maybe it wasn’t worth the effort.
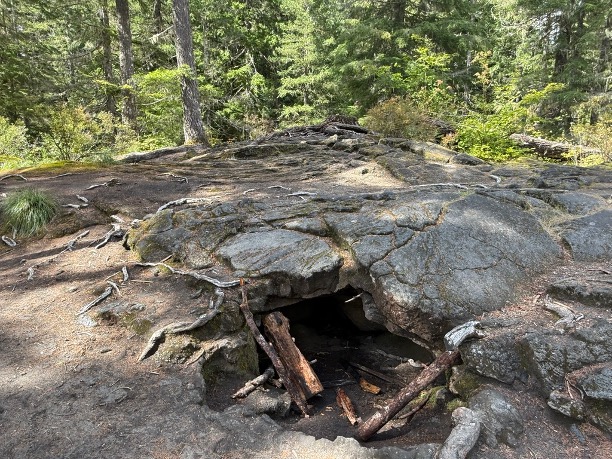
Figure 6. This is a mound of lava projecting up to 8 feet above the surrounding landscape. Several features are worth mentioning: 1) it is circular in plan and about 30 feet in diameter; 2) the upper-center of the image shows concentric bands of ropy lava known as pahoehoe, from its common occurrence in Hawaii; and 3) there is a small cave beneath it where lava ran out of the hardened surface. We’ll see a lot more of that in my next post.
Final Thoughts
Our journey along the backroads took us through a vast terrane of andesitic volcanism created more than five-million years ago. Then, about forty-thousand years ago, a new phase of volcanism began and Mount Saint Helens was created from this rugged ground.
Stratovolcanoes don’t just erupt at their summit, even though that is exactly what Mt St Helens did in 1980; more often they leak lava from the myriad faults and fissures surrounding them, especially in an active subduction zone where the earth’s crust is being compressed, twisted, and warped by tectonic forces.
Life is difficult in such an environment and we are fortunate to have a moment in time frozen for us to contemplate how immense the forces are that constantly reform the surface. Eruptions like the one that destroyed this forest are unlikely to kill many people, but they are crucial in reforming the environment. A new forest grows, possibly inhabited by different species of fauna and flora, and life goes on.
My next post will examine this same eruption event, but at a scale that dwarfs what we saw today.
Mount St. Helens Revisited: Miocene Volcanic Rocks
I couldn’t stay away from this fascinating active volcano. I reported on the recovery of the north flank, after the 1980 eruption, in a previous post. Today I visited the eastern and southern flanks, which were spared the devastation of an enormous explosion.
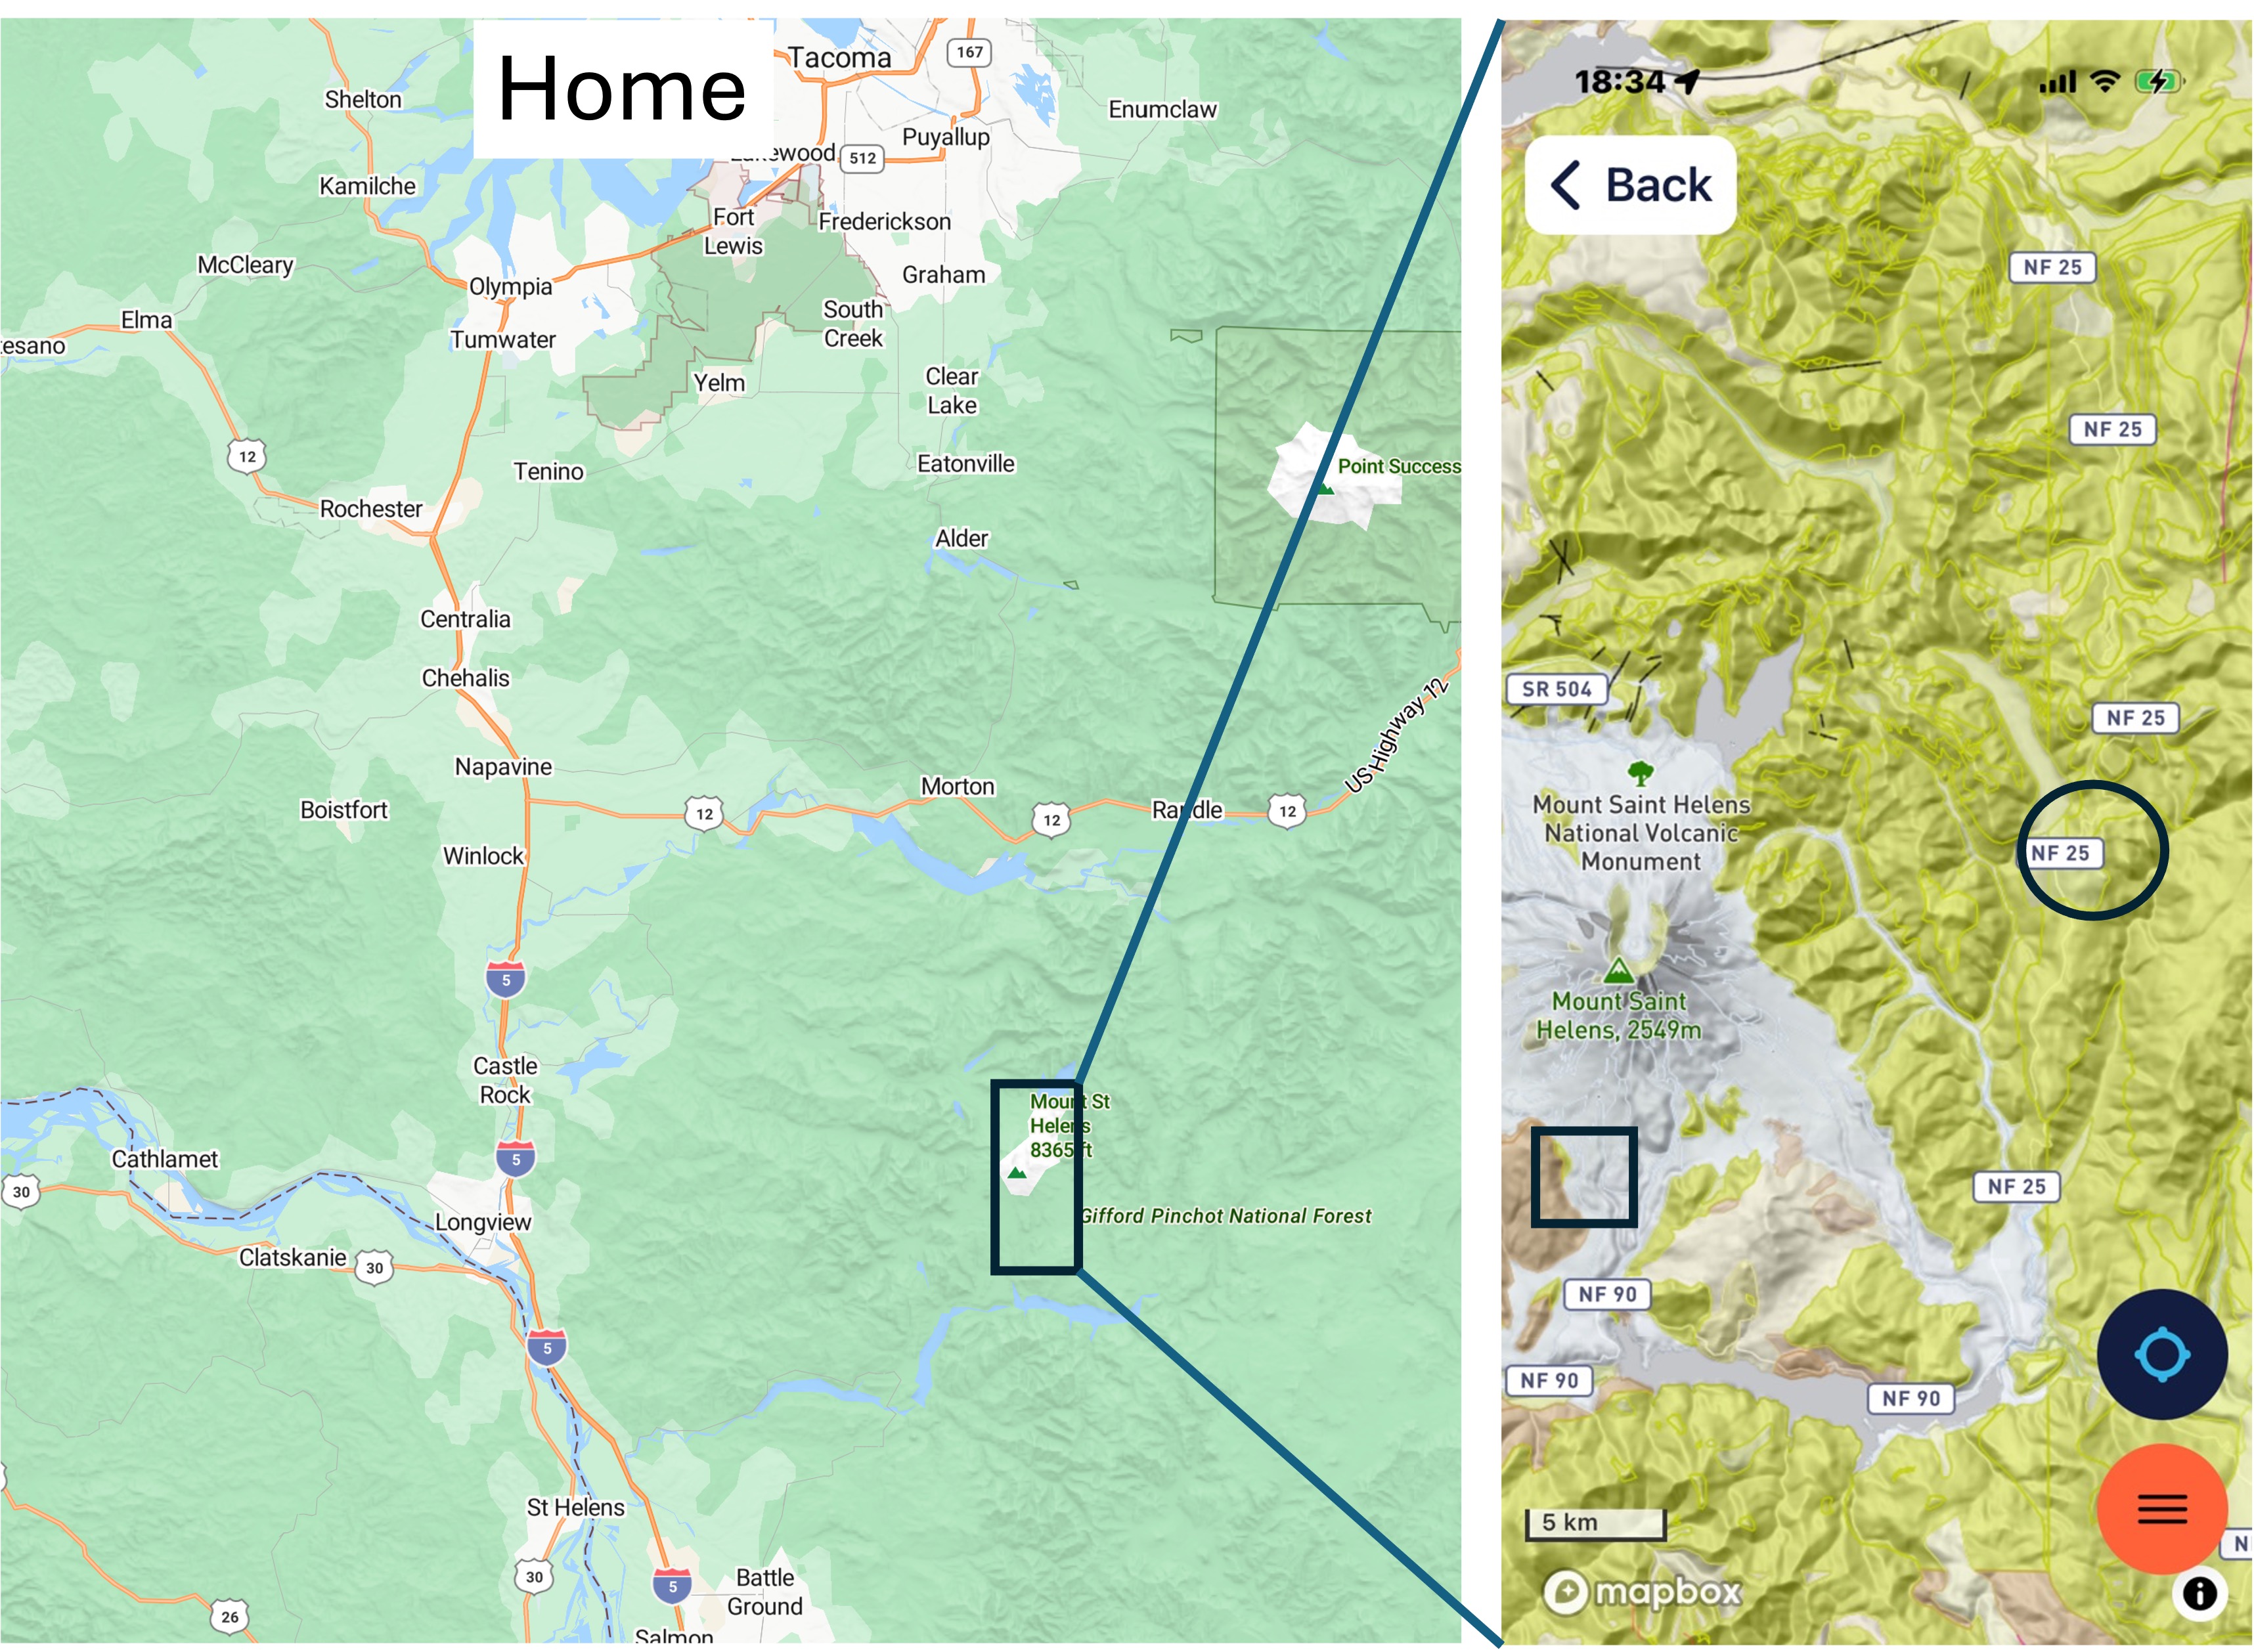
Figure 1. Mount Saint Helens National Volcanic Monument is about three-hours from Tacoma (Home in the left plate). We took back roads and circumnavigated the volcano today, following NF 25 (seen in the right plate), which took us through a volcanic terrain constructed during the last 23 million years. The circled area is the focus of this post. The rock types vary widely, but they are predominantly andesitic flows, ash layers, and breccias. The usual mixed bag of volcaniclastic rocks we expect in a subduction zone plate margin.
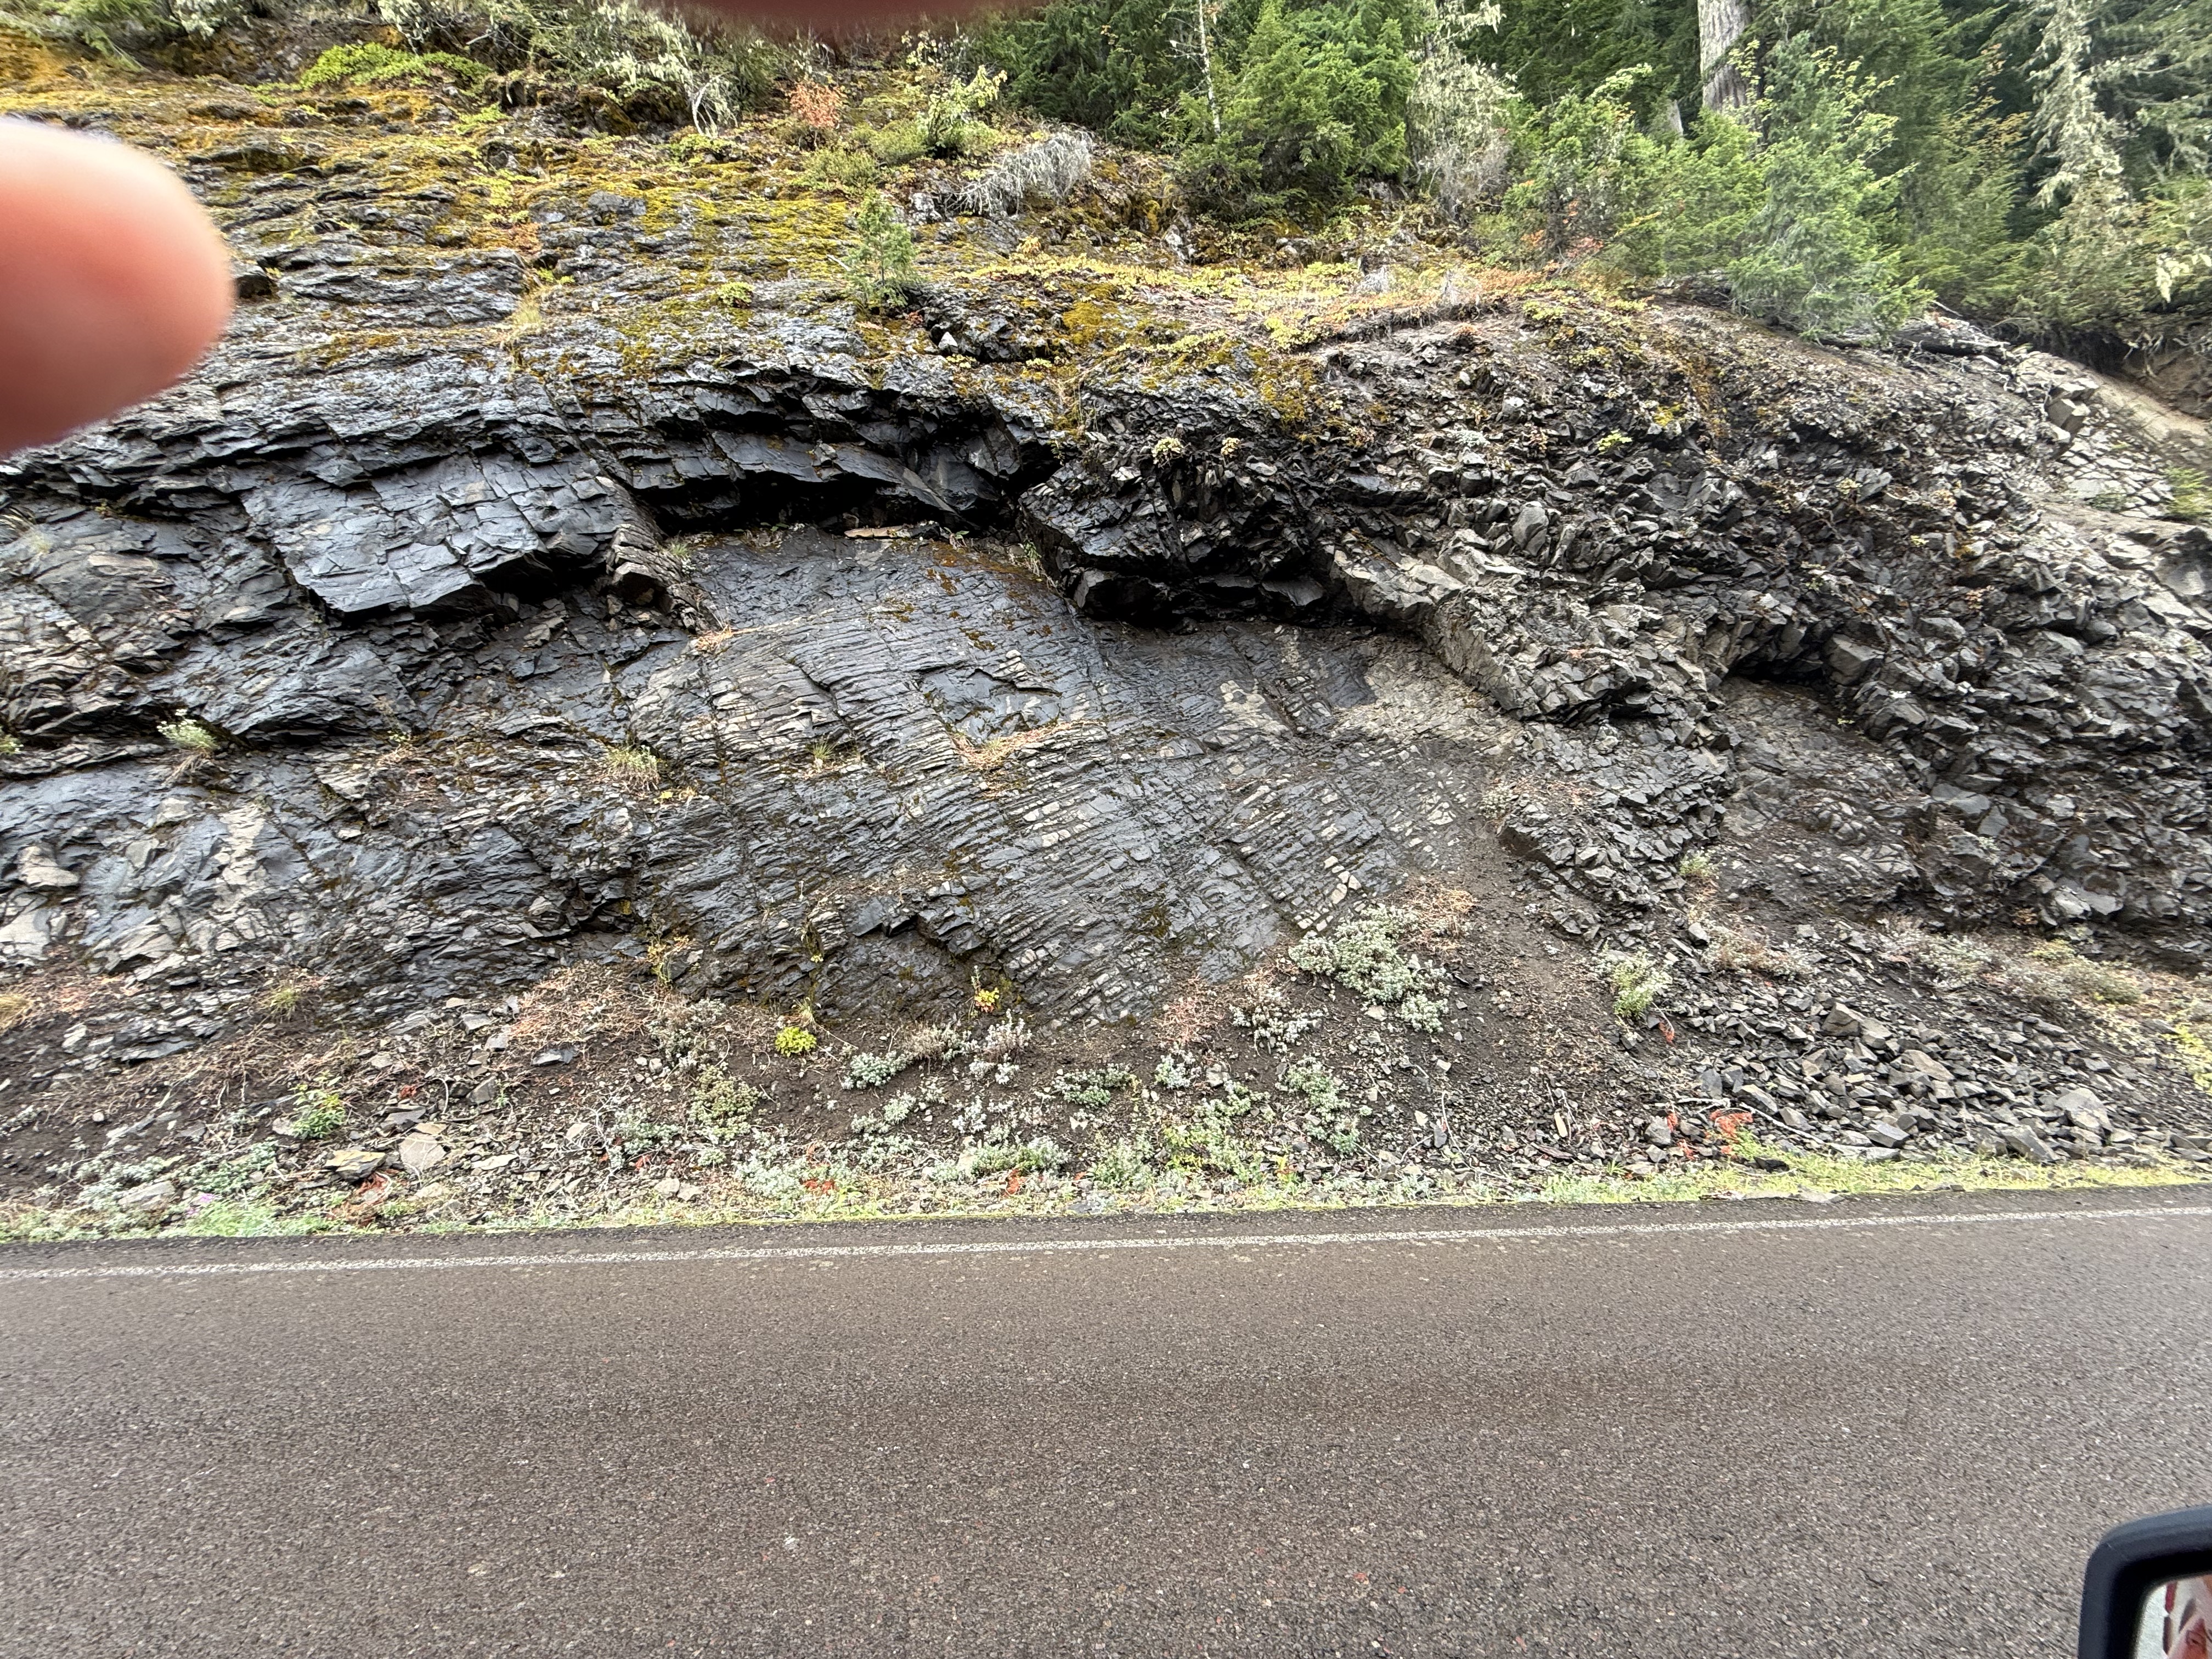
Figure 2. This photo reveals a series of thin beds that suddenly dip towards the road. They are highly fractured to the right of the image. Obviously, these were not recently erupted; they have been deformed in the last twenty-million years.
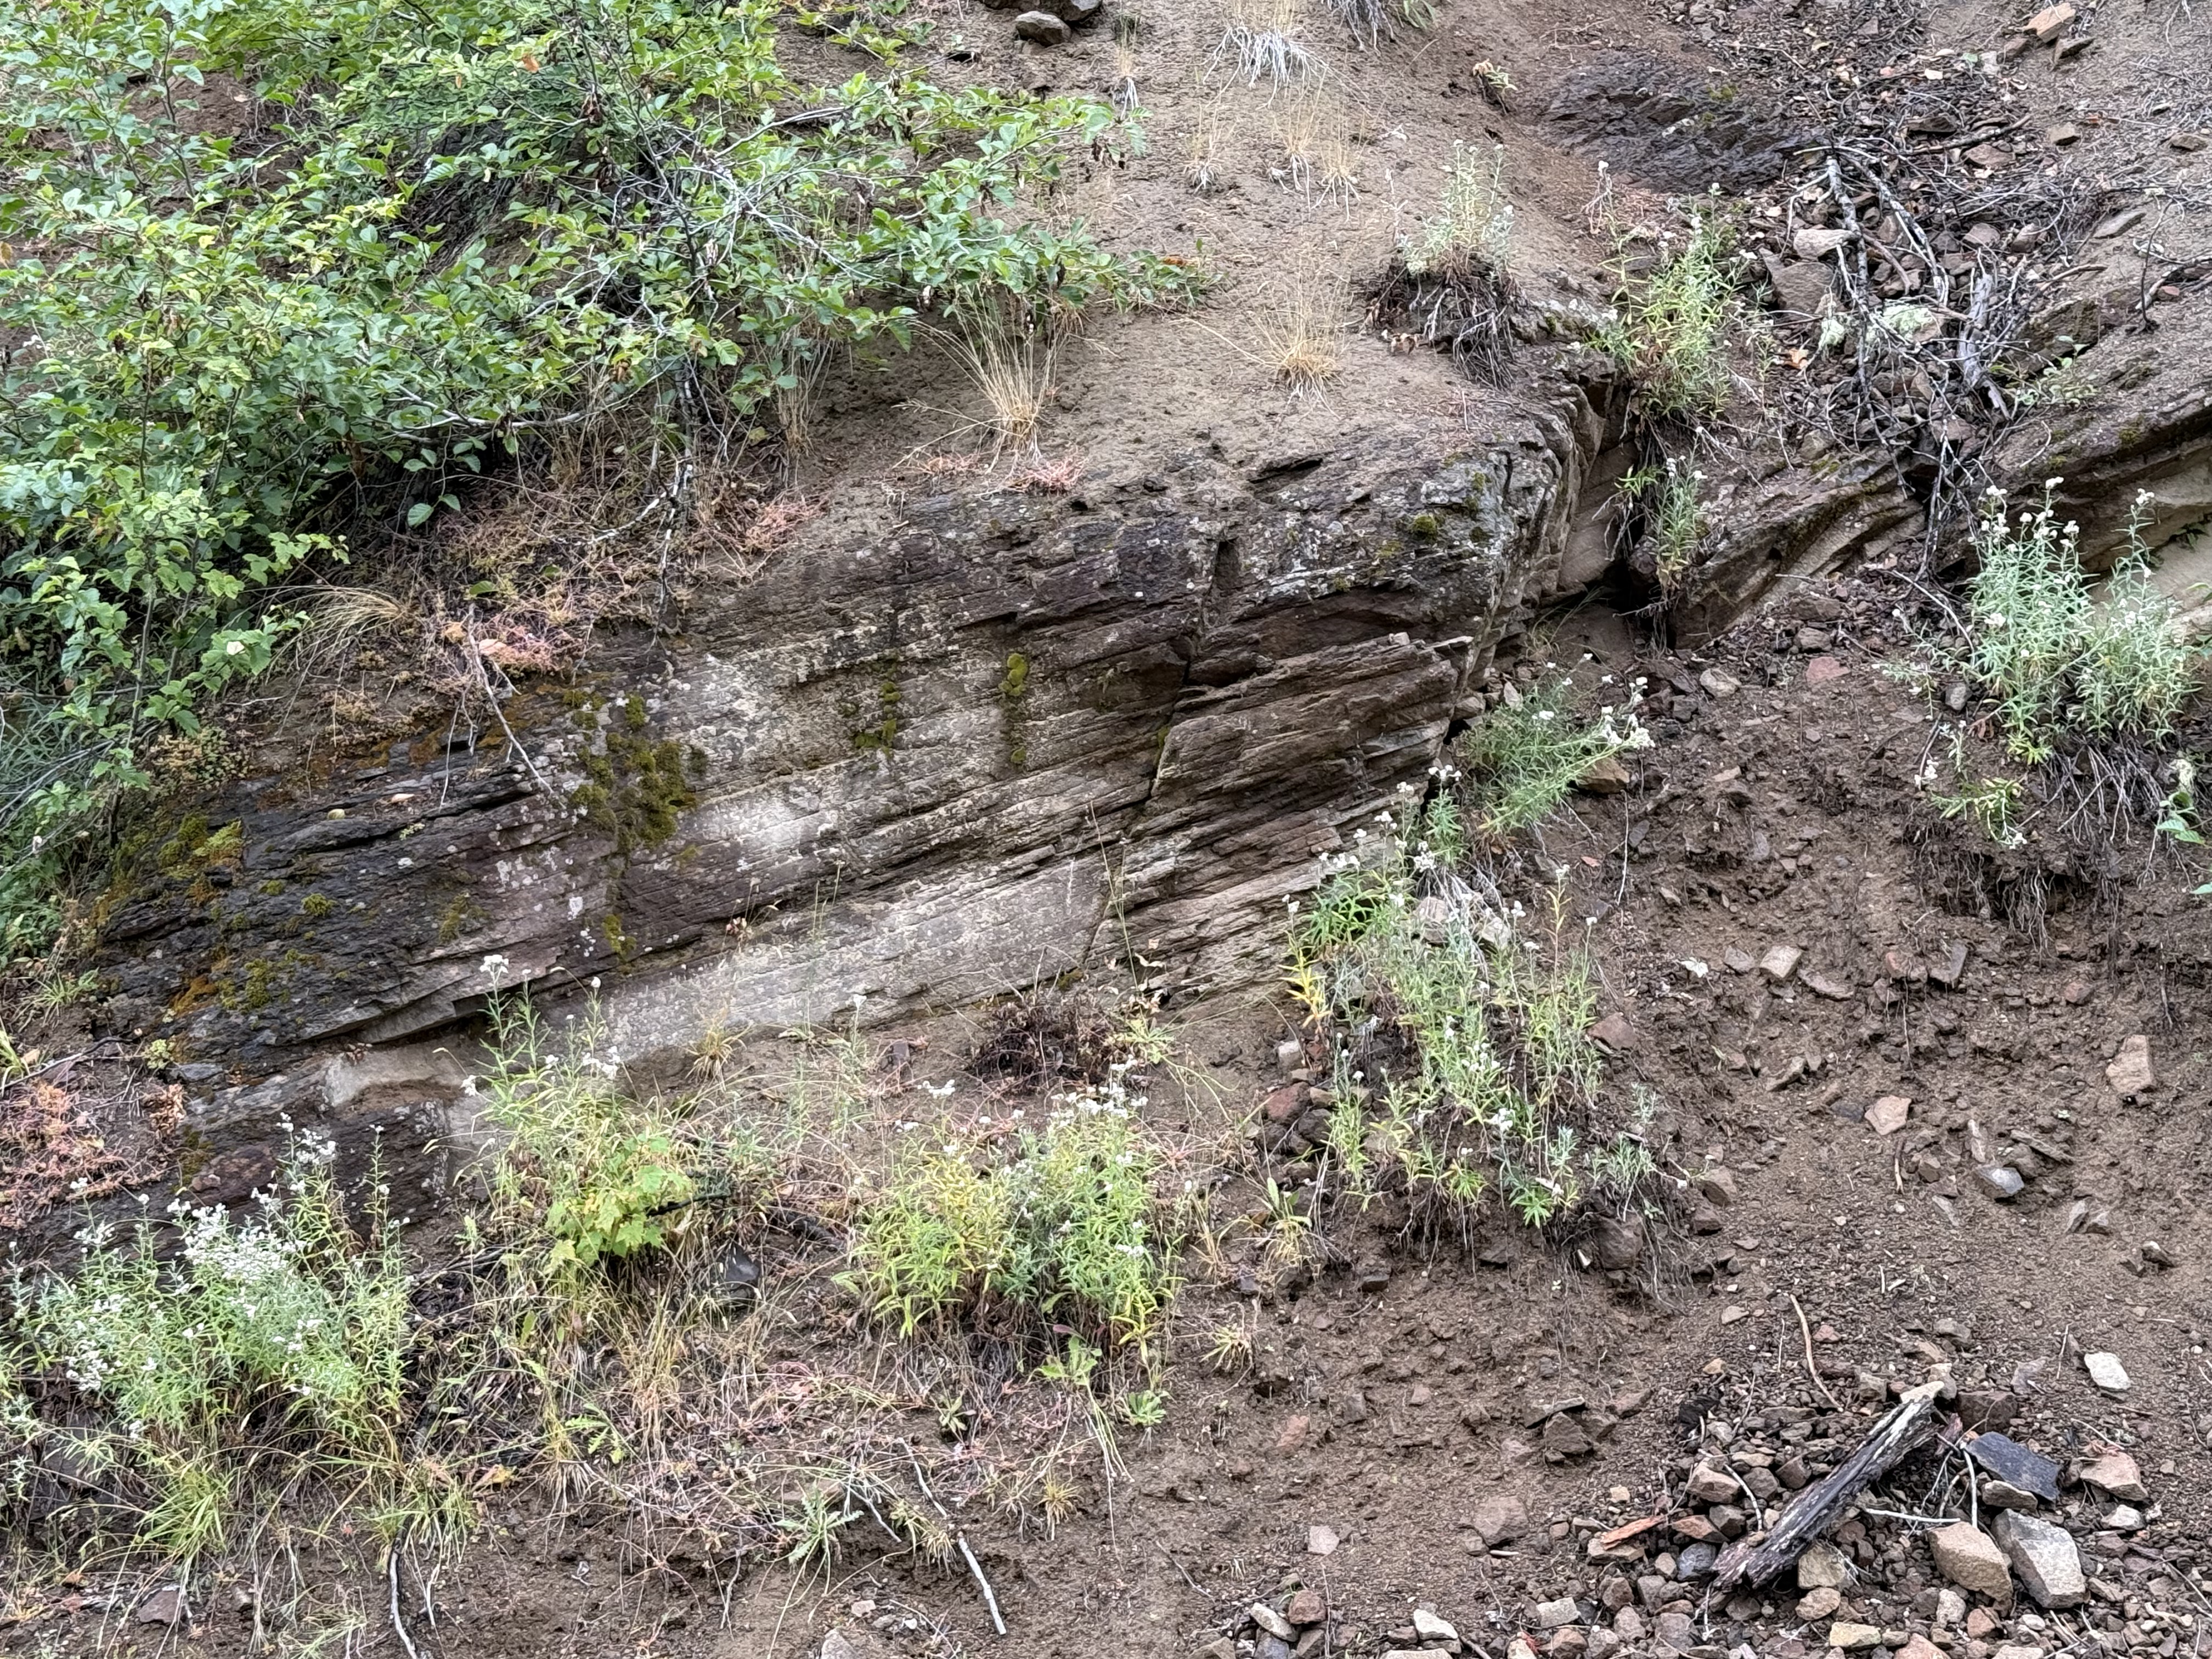
Figure 3. This image shows layers of volcanic ash that are weathering to reveal how thin the laminae are.
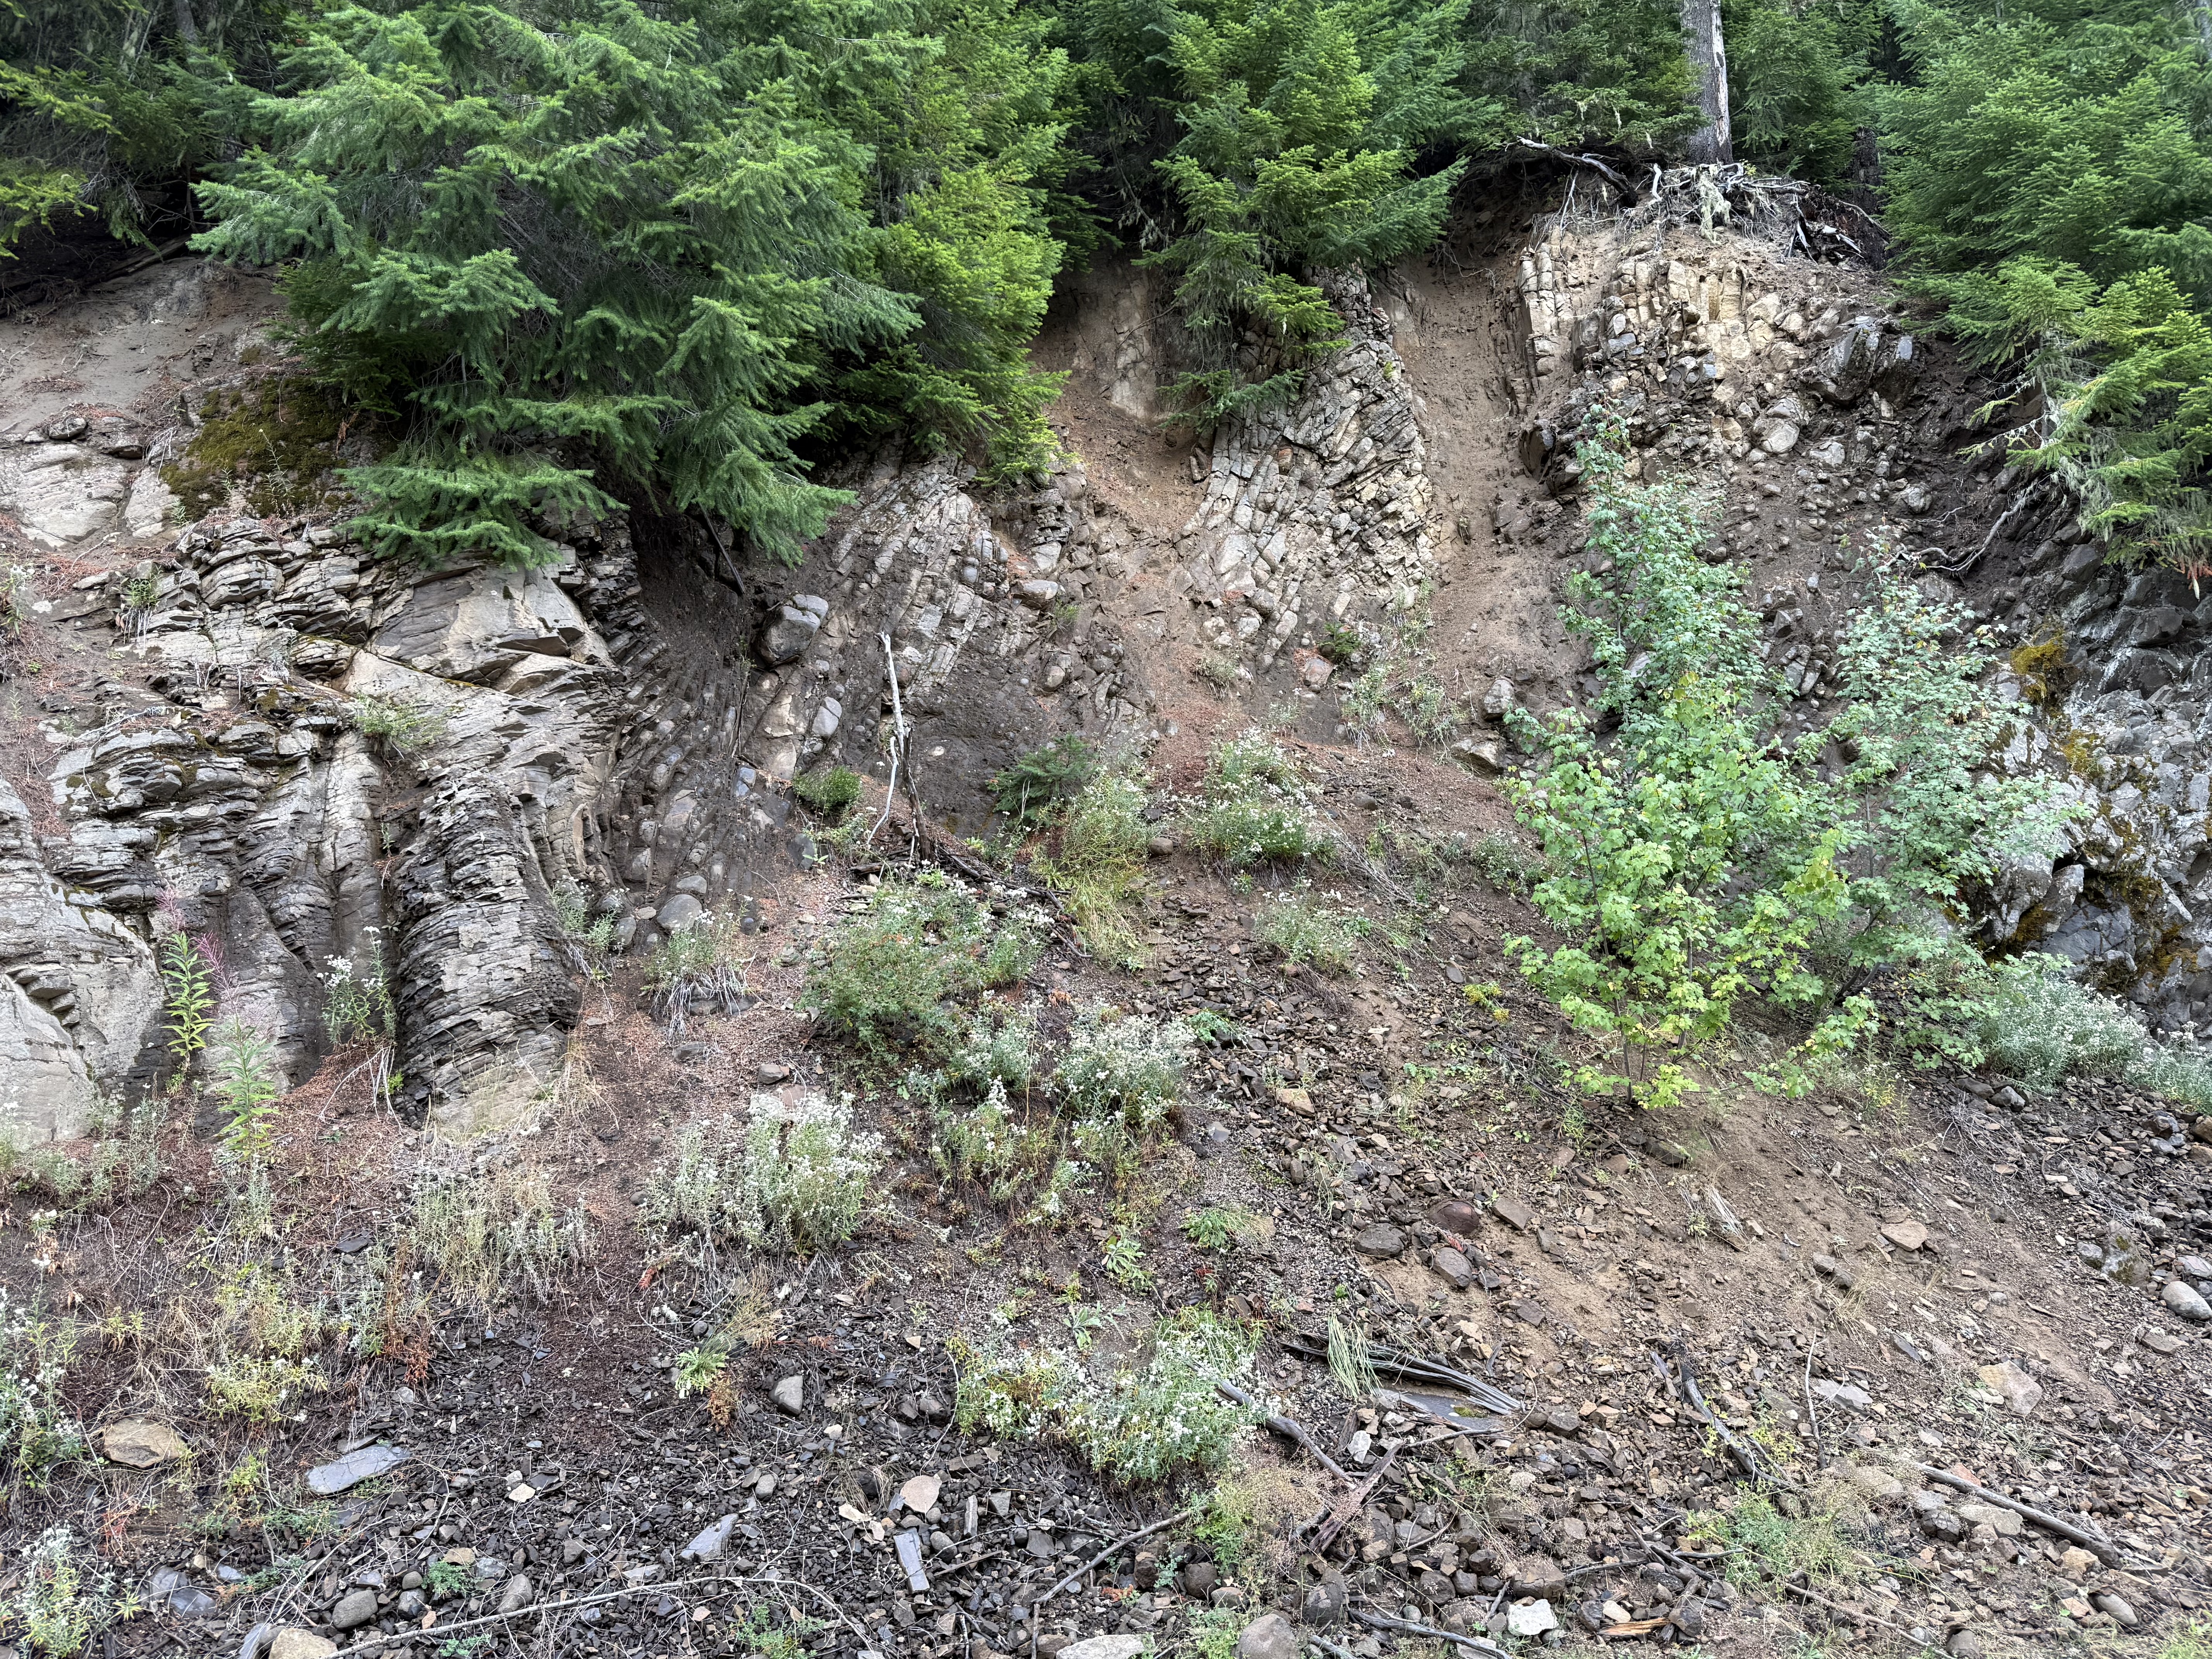
Figure 4. This photo dramatically reveals how much can happen in 10-20 my (million years). It was taken a few hundred yards from the previous photo. To the left are layers of ash that dip away from the camera–juxtaposed with steeply dipping layers that curve to the right and become almost horizontal (in the plane of the image) in the upper-right image quadrant.
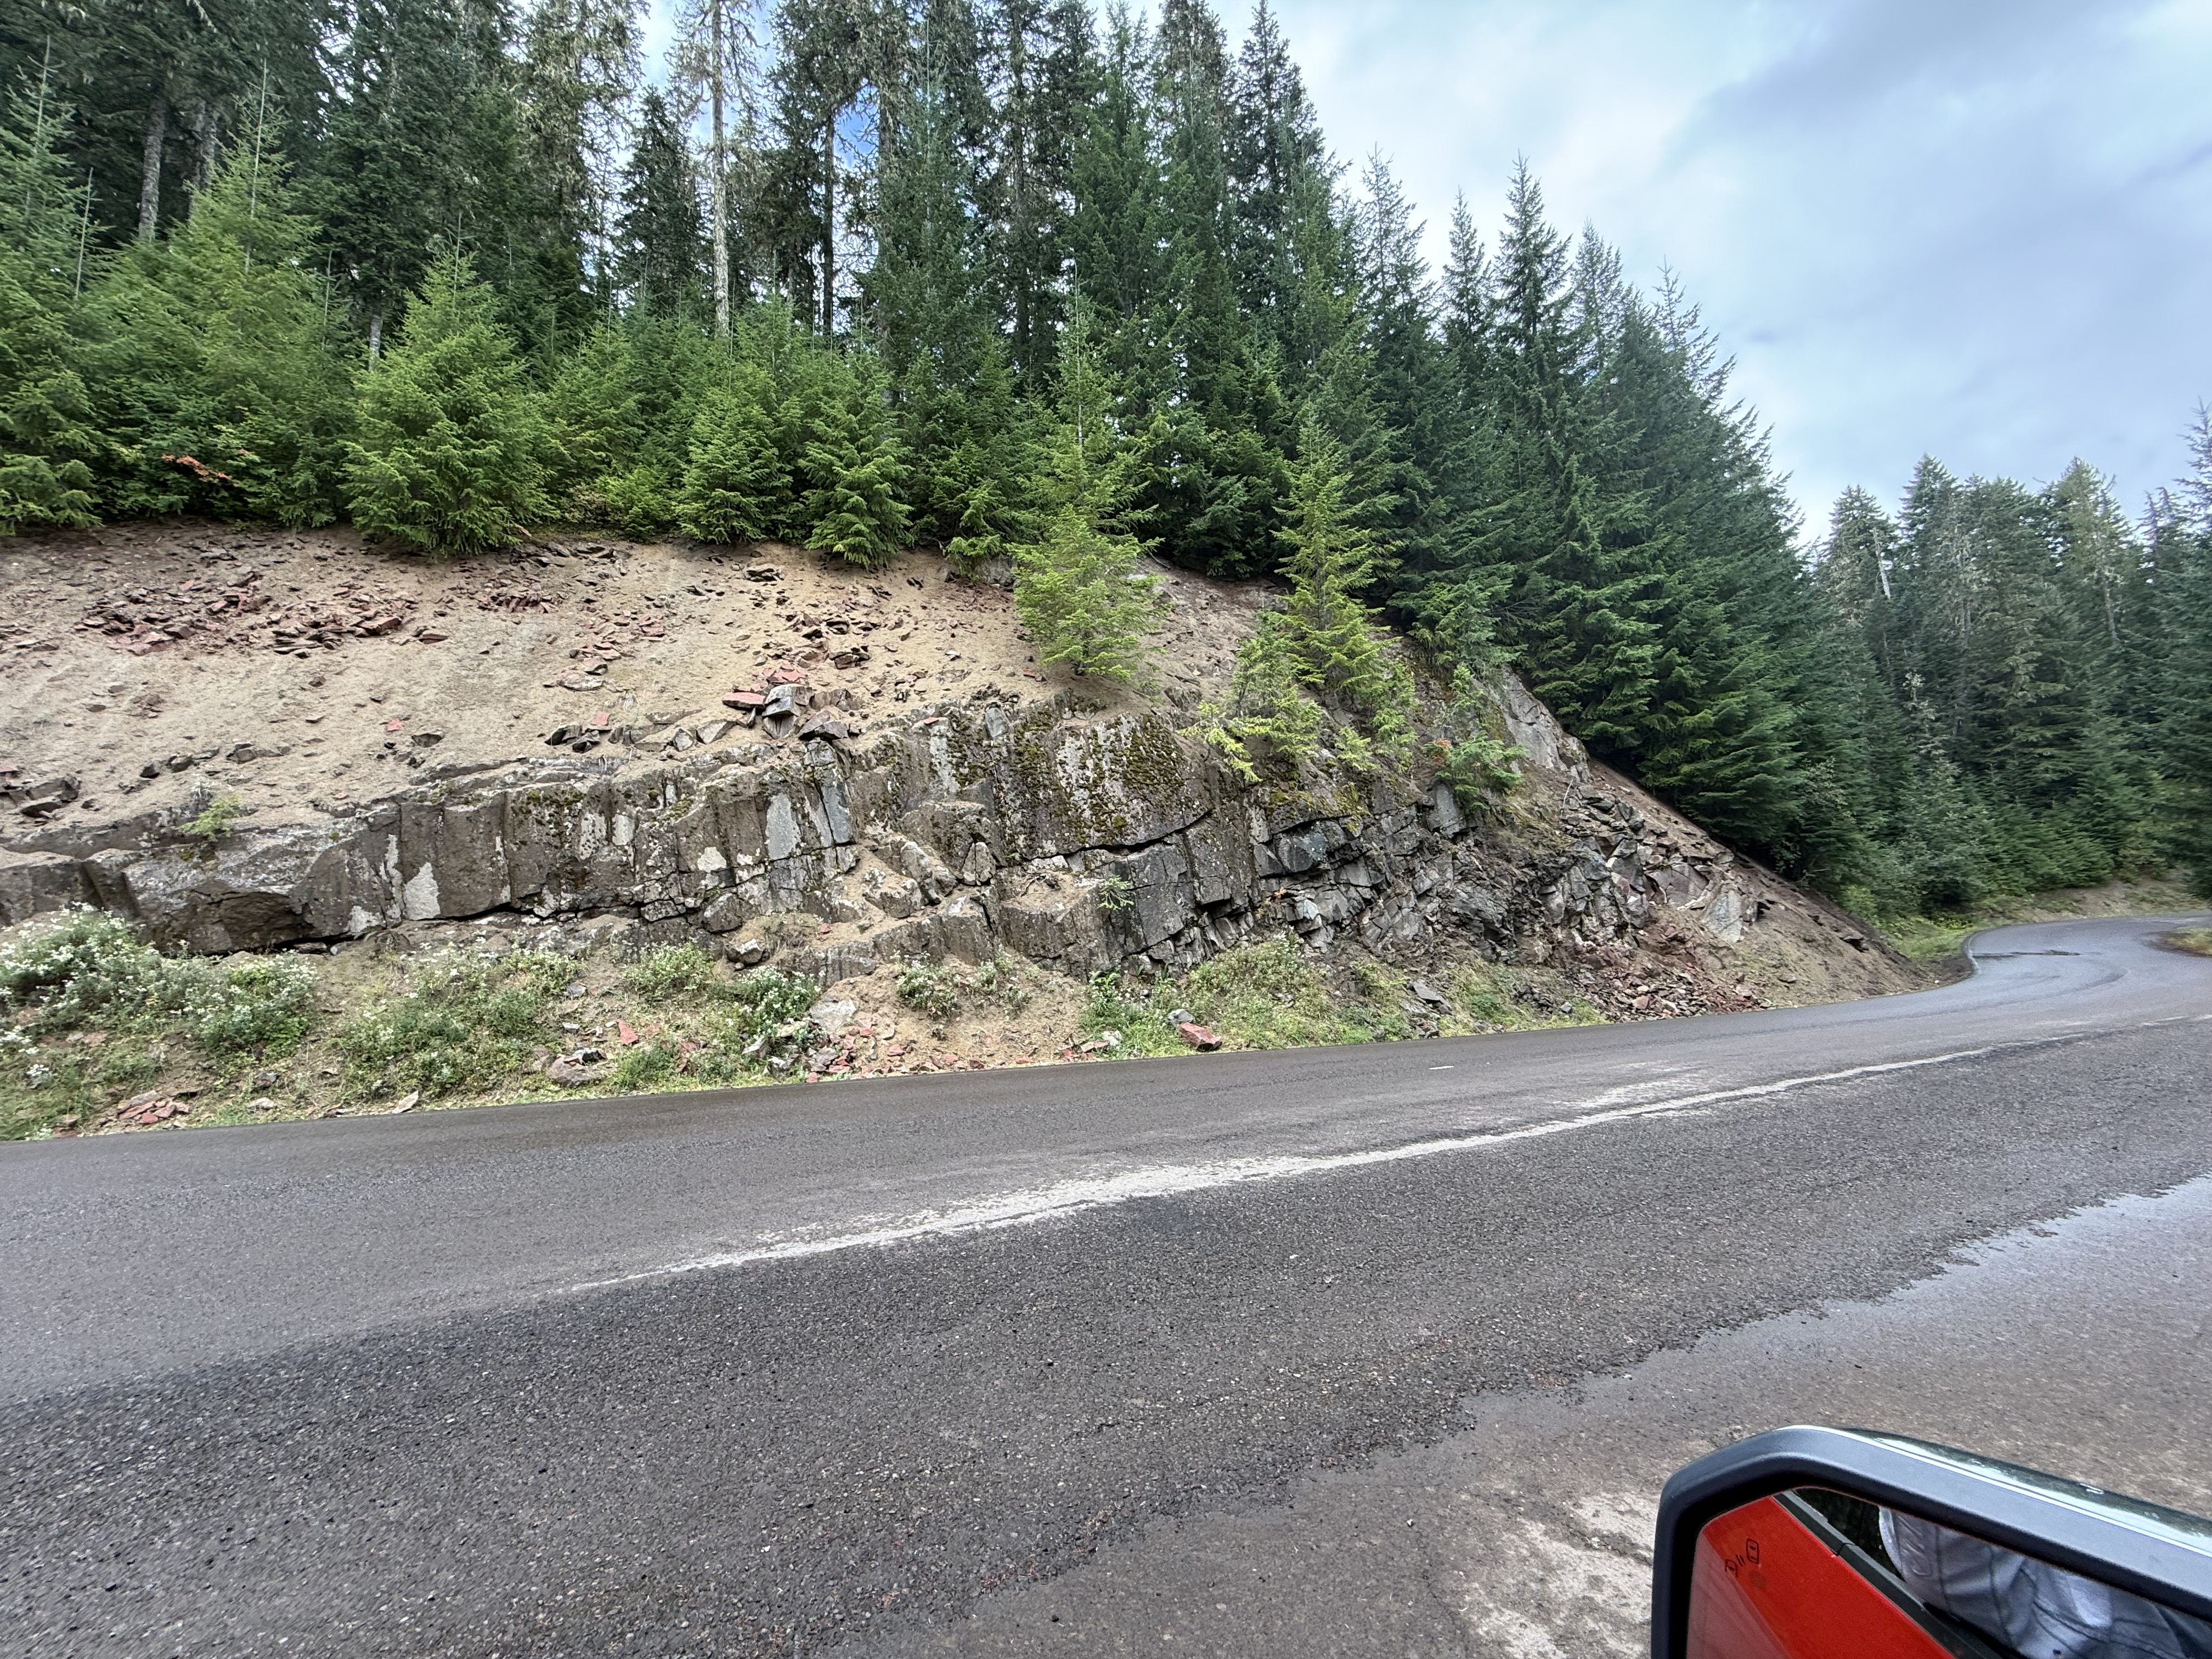
Figure 5. This image, taken less than a mile from Fig. 4, reveals thick layers of ash and flows. I didn’t examine them closely, but the middle-right of the photo shows a substantial change in bedding.
Final Thoughts
Mount Saint Helens is part of the Cascades range, an elongate series of volcanoes that have been active for the last 60 my because oceanic crust is being subducted beneath the North American tectonic plate. The rocks we saw today are from an earlier phase of volcanism; they were buried to depths of several miles, deep enough to become cemented, but not deep enough to become ductile. Thus, they failed in brittle fracture as they were compressed by the huge pile of volcaniclastic rocks created along the ocean margin.
What comes up must go down. This simple phrase means that the earth’s upper mantle (including the subducting ocean plate) melted and produced a lot of magma, which rose because of its lower density and high pressure, filling every fracture, expanding them into magma chambers. The mantle collapsed because of these voids and the weight of the recently extruded magma. A balloon being repeatedly inflated and deflated.
Meantime, the compression was inexorable. The recently buried volcanic rocks broke along faults, creating the juxtaposition of volcaniclastic material we see in Fig. 4.
These aren’t geologically old rocks. This is a continuous process that we are able to witness in real time throughout the world.
We’ll see this continuous process in closer detail with my next post.
Geologic Survey of Eastern Vancouver Island, British Columbia

Figure 1. View looking west along the coast from Beacon Hill, in Victoria. The cliffs on Vancouver Island are similar in height to those across Juan de Fuca Strait, in Washington. However, the bluffs are composed of glacial deposits further south in Seattle, rather than bedrock. The large tidal range (7-10 feet) exposes rocky platforms at low tide. I’ll examine several of these features in this post.
Introduction
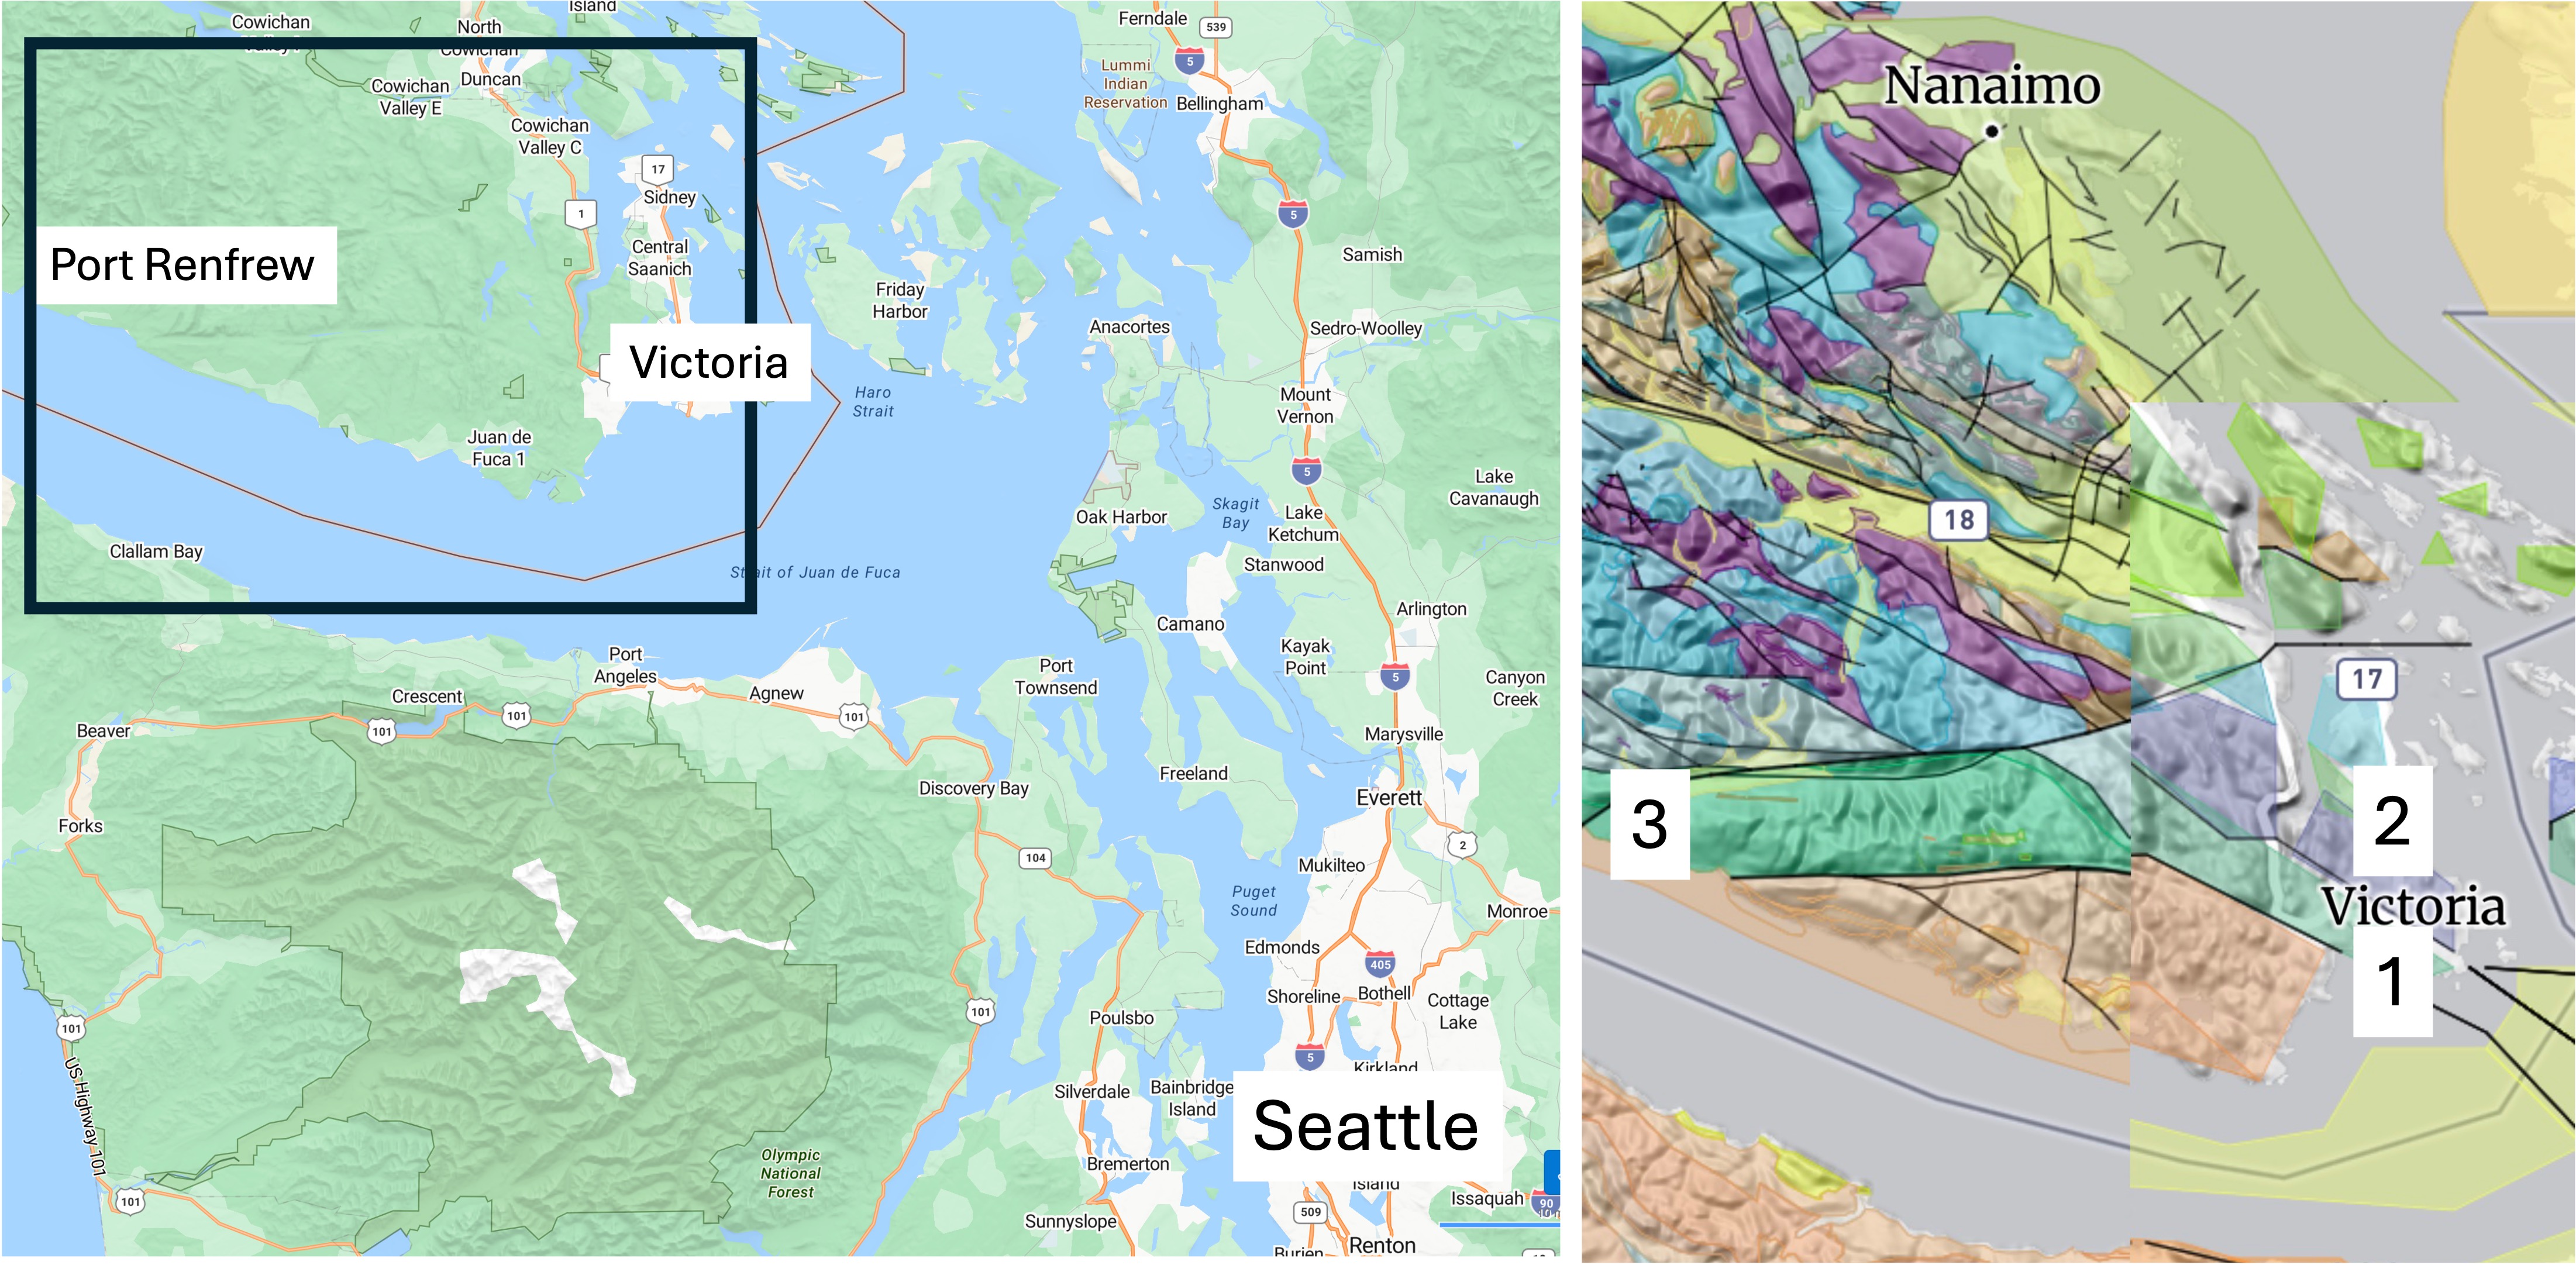
Figure 2. We drove to Port Angeles on the Olympic Peninsula and took a ferry to Victoria. We also drove about 70 miles west to Port Renfrew. The inset geologic map reveals a maze of faults and rock types. The rocks around Victoria comprise the Westcoast Crystalline Complex, which includes granitic and metamorphic rocks dated between 540 and 143 Ma (colored green). The purple area indicates a suite of granitic intrusions from the Jurassic period (200-160 Ma). The numbers indicate locations discussed below: (1) Beacon Hill; (2) Mount Douglas; and (3) Port Renfrew.
Beacon Hill
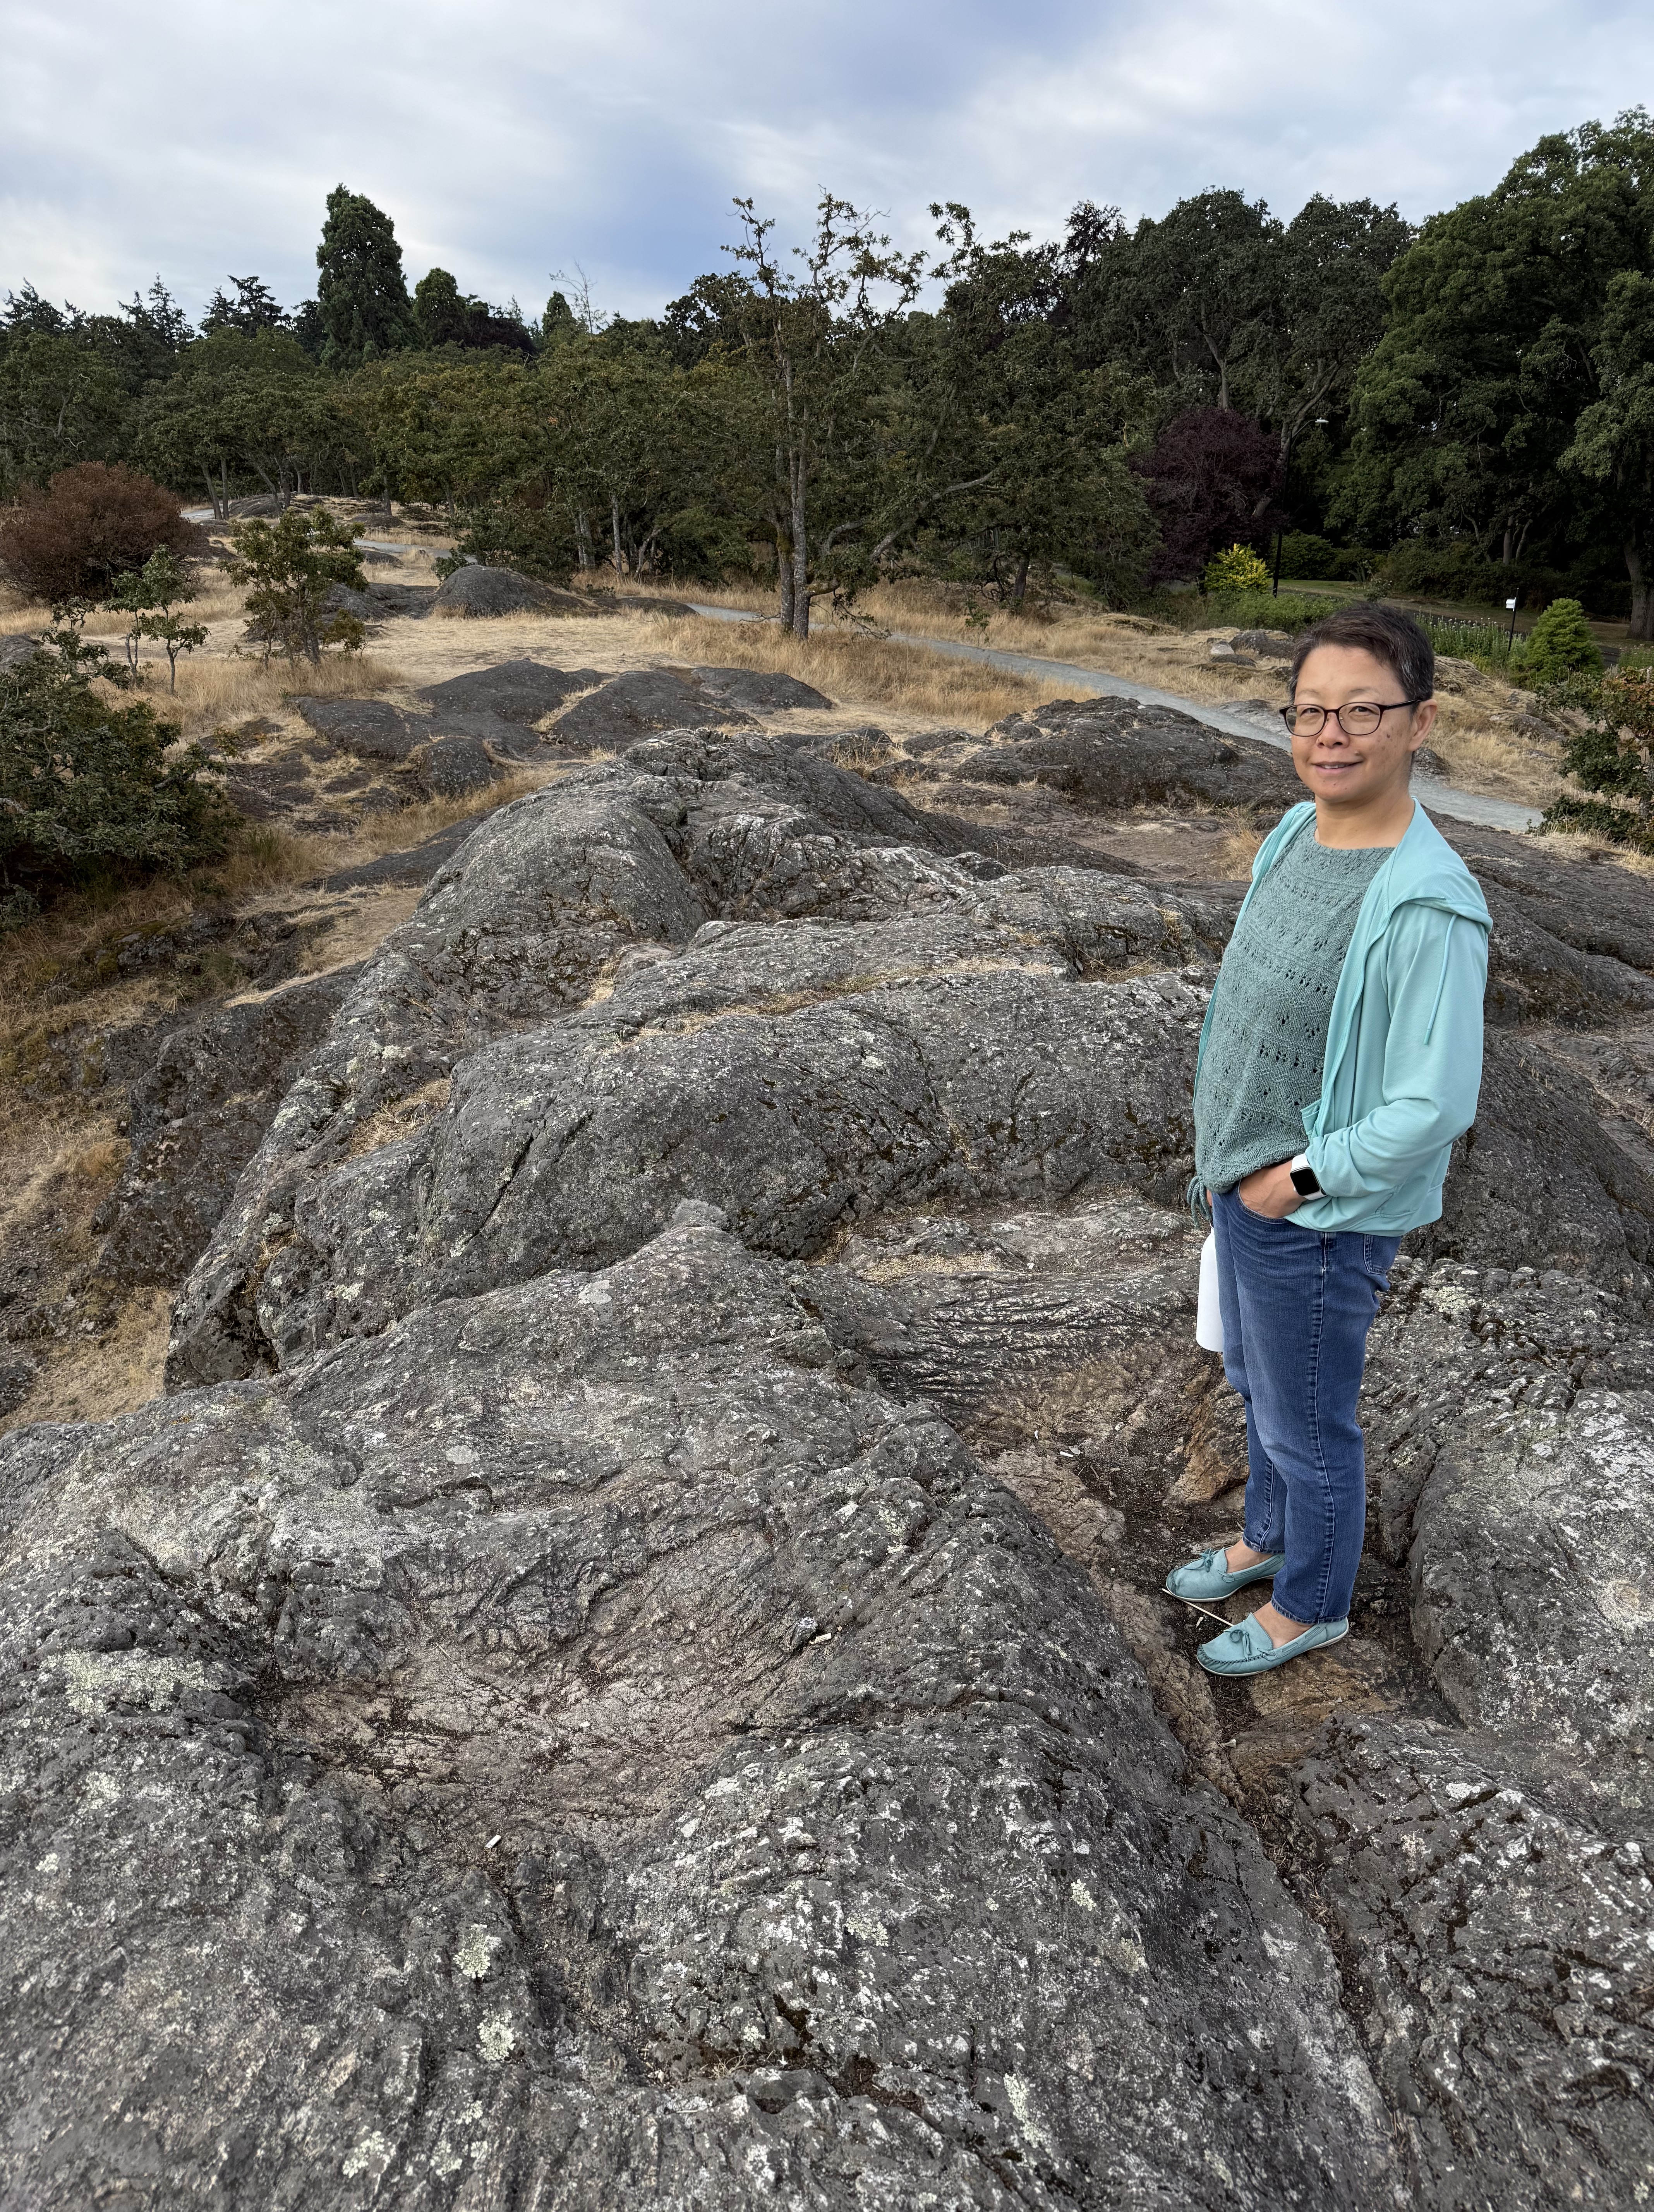
Figure 3. This exposure of the Westcoast Crystalline Complex at Beacon Hill Park doesn’t tell us much. These rocks are weathered and stained, making identification difficult without breaking off a fresh piece. We don’t do that here at Rocks and (no) Roads. Nevertheless, I am relatively confident that they are not sedimentary rocks.
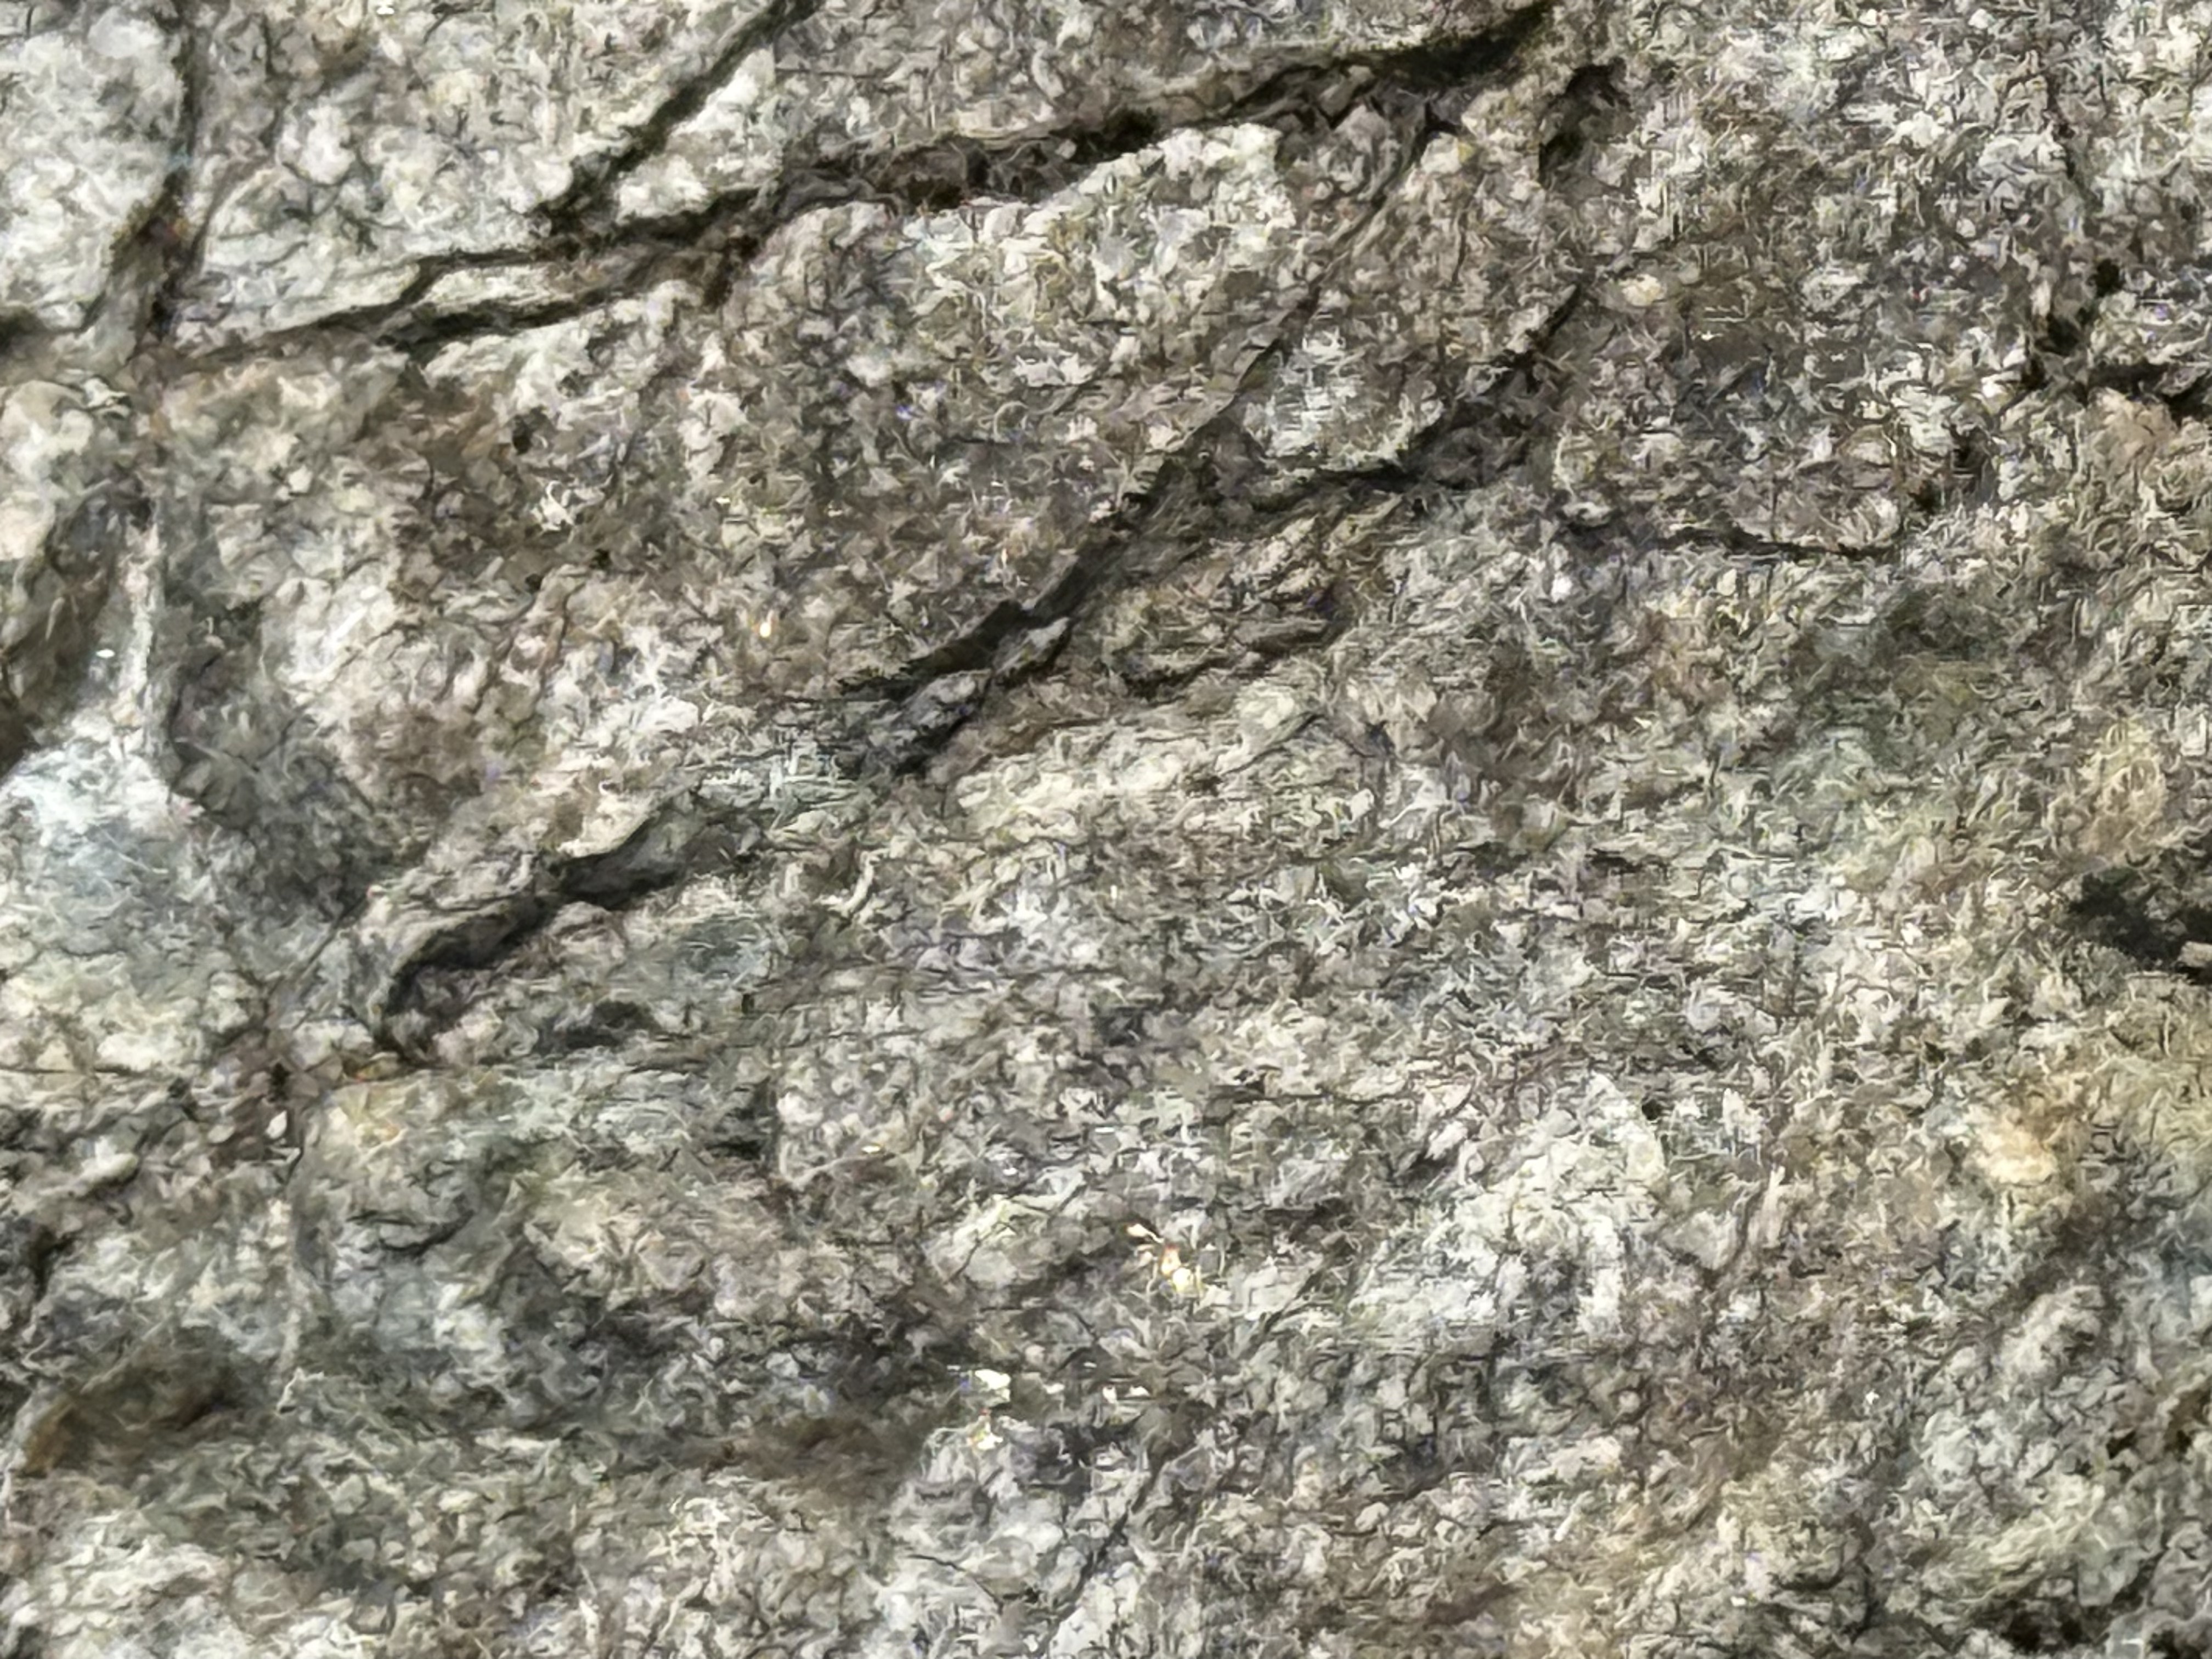
Figure 4. This photo uses a magnification of 10x, and the field of view is less than an inch. Individual crystals of feldspar can be seen throughout the image, recognizable by flat surfaces that form irregular boxes. These light-colored feldspars are indicative of continental intrusive rocks like you would find in a subduction tectonic environment. The gray blobs are quartz. Based on this brief examination, I think these are granodiorite, an intrusive rock rather than metamorphic.
Mount Douglas
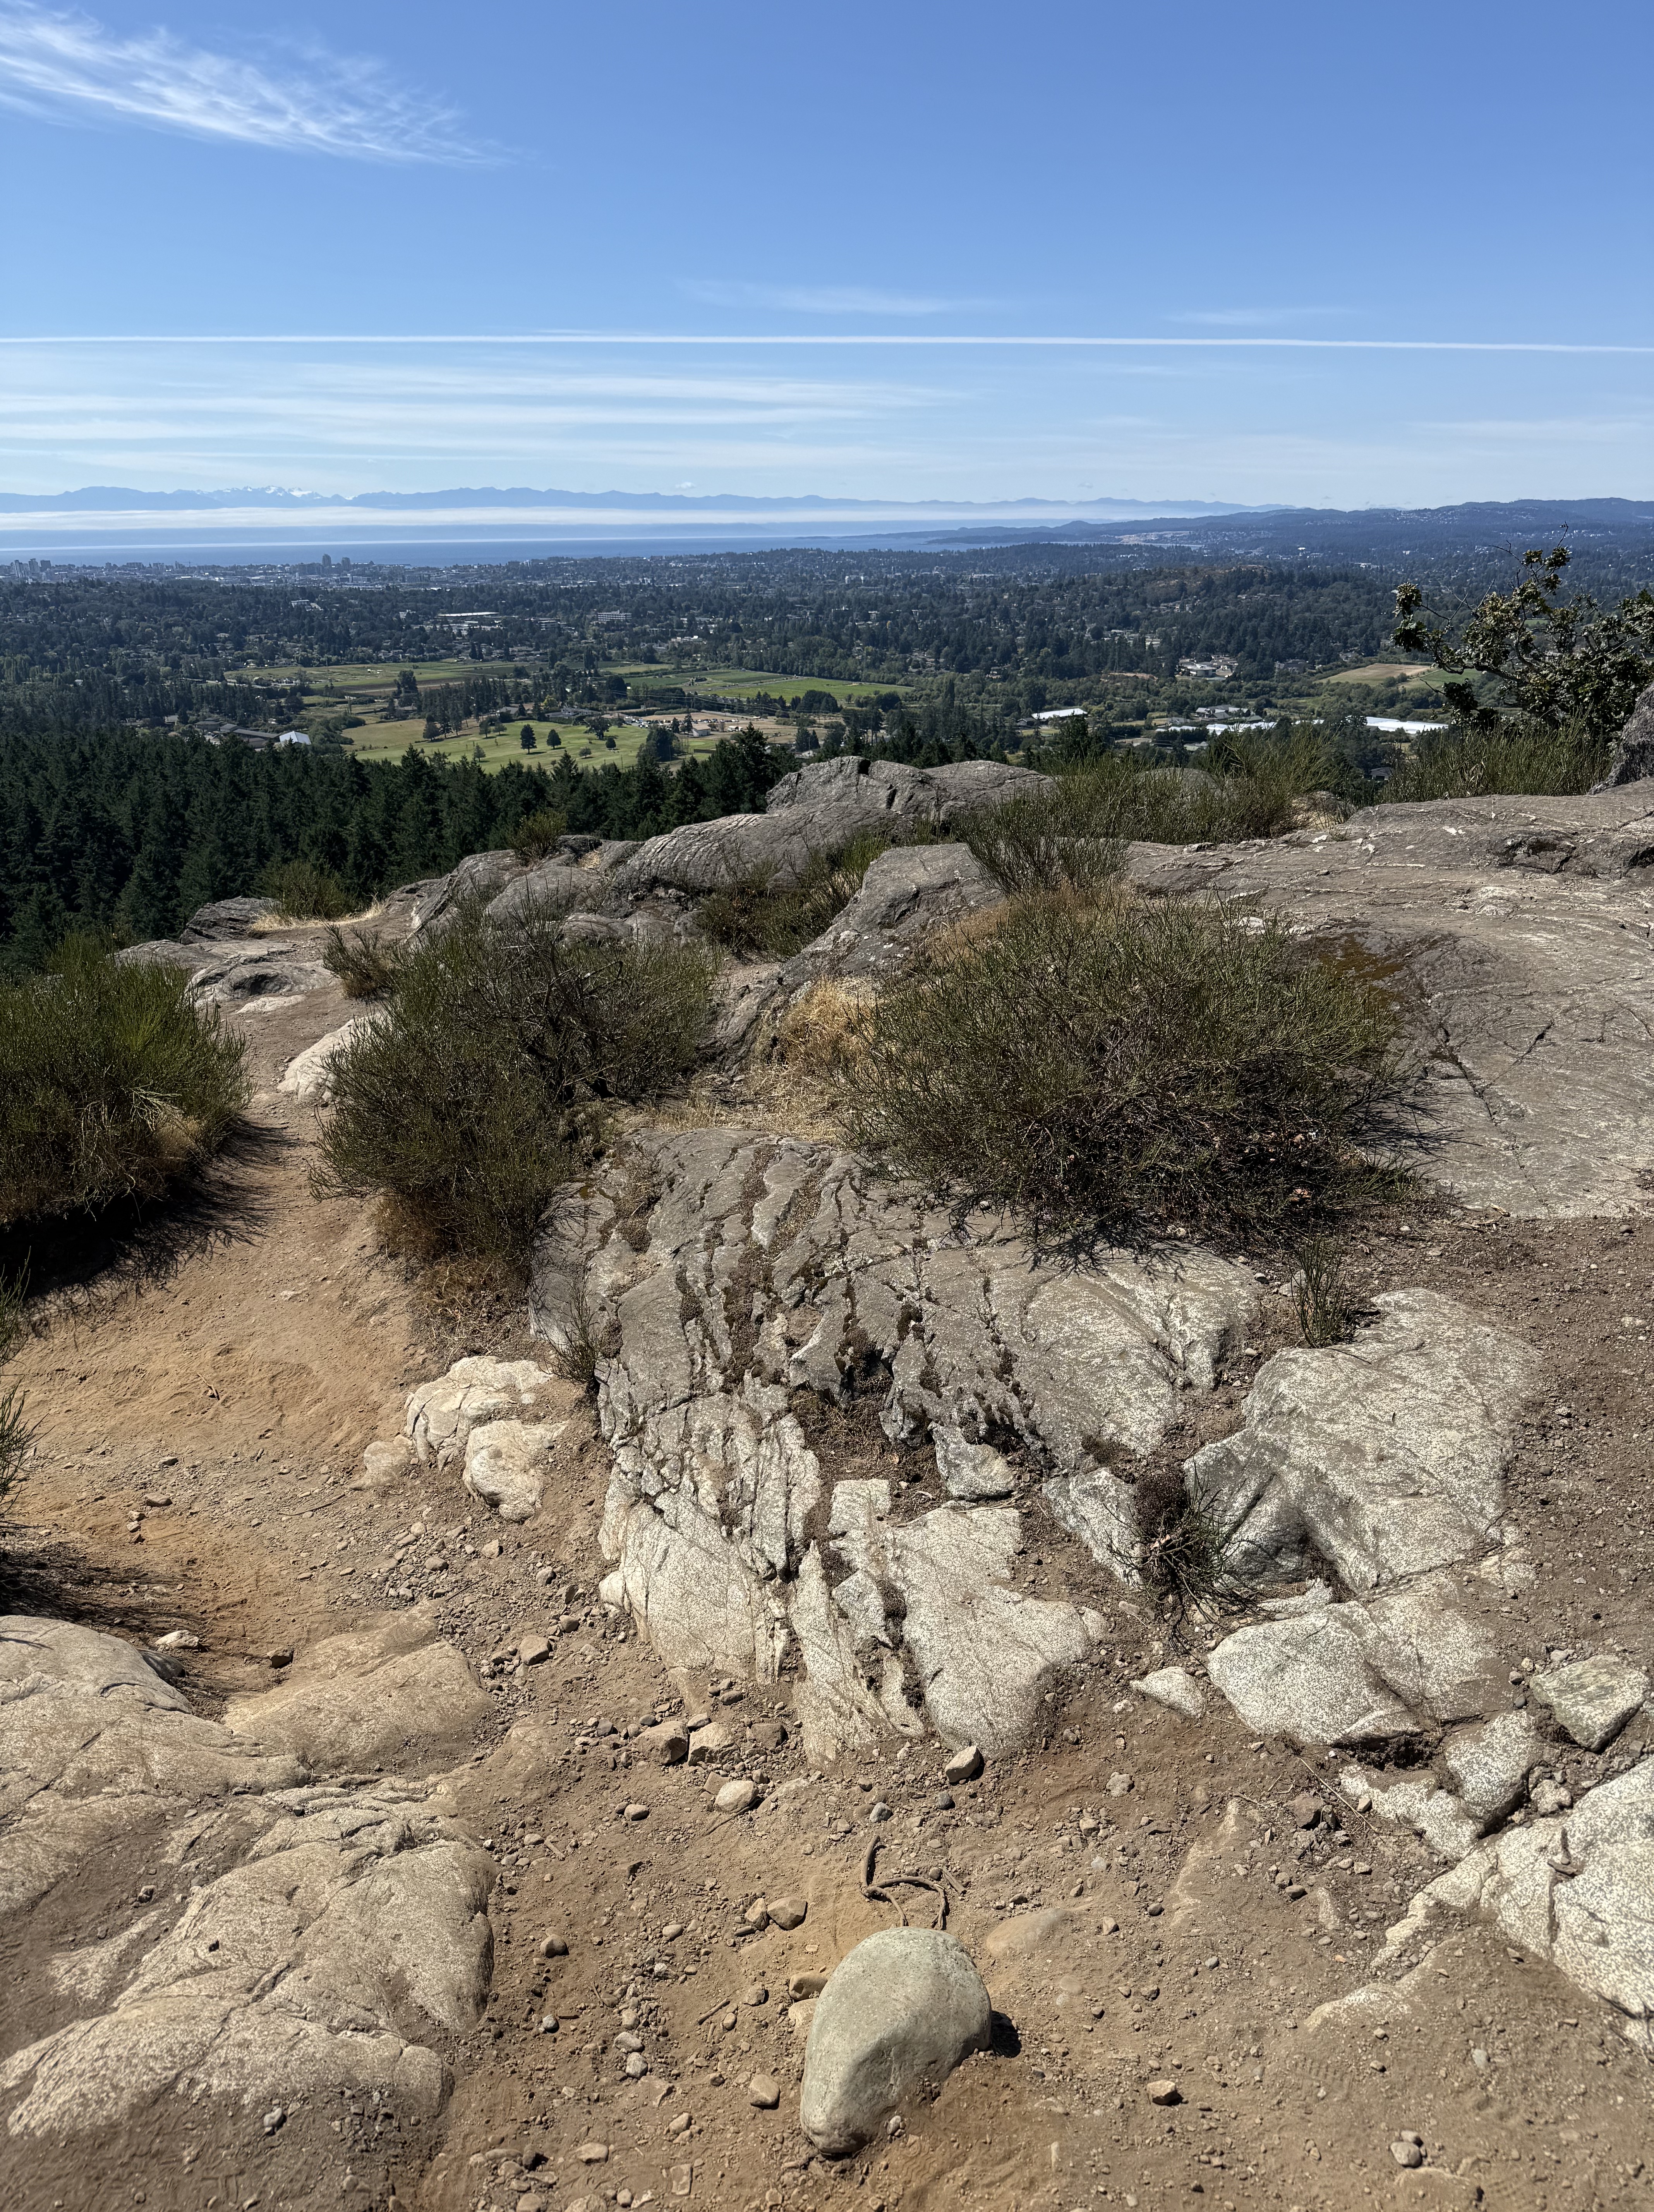
Figure 5. The view, looking south from the top of Mount Douglas (see Fig. 2 for location), reveals Mount Olympus (snow-covered peaks in the distance); and intrusive rocks with the characteristic salt-and-pepper color of granodiorite. This exposure also contains a set of joints (large X pattern enhanced by weathering) that would have appeared as the rock rose through the crust as overlying rocks were eroded. Victoria is visible in the distance.
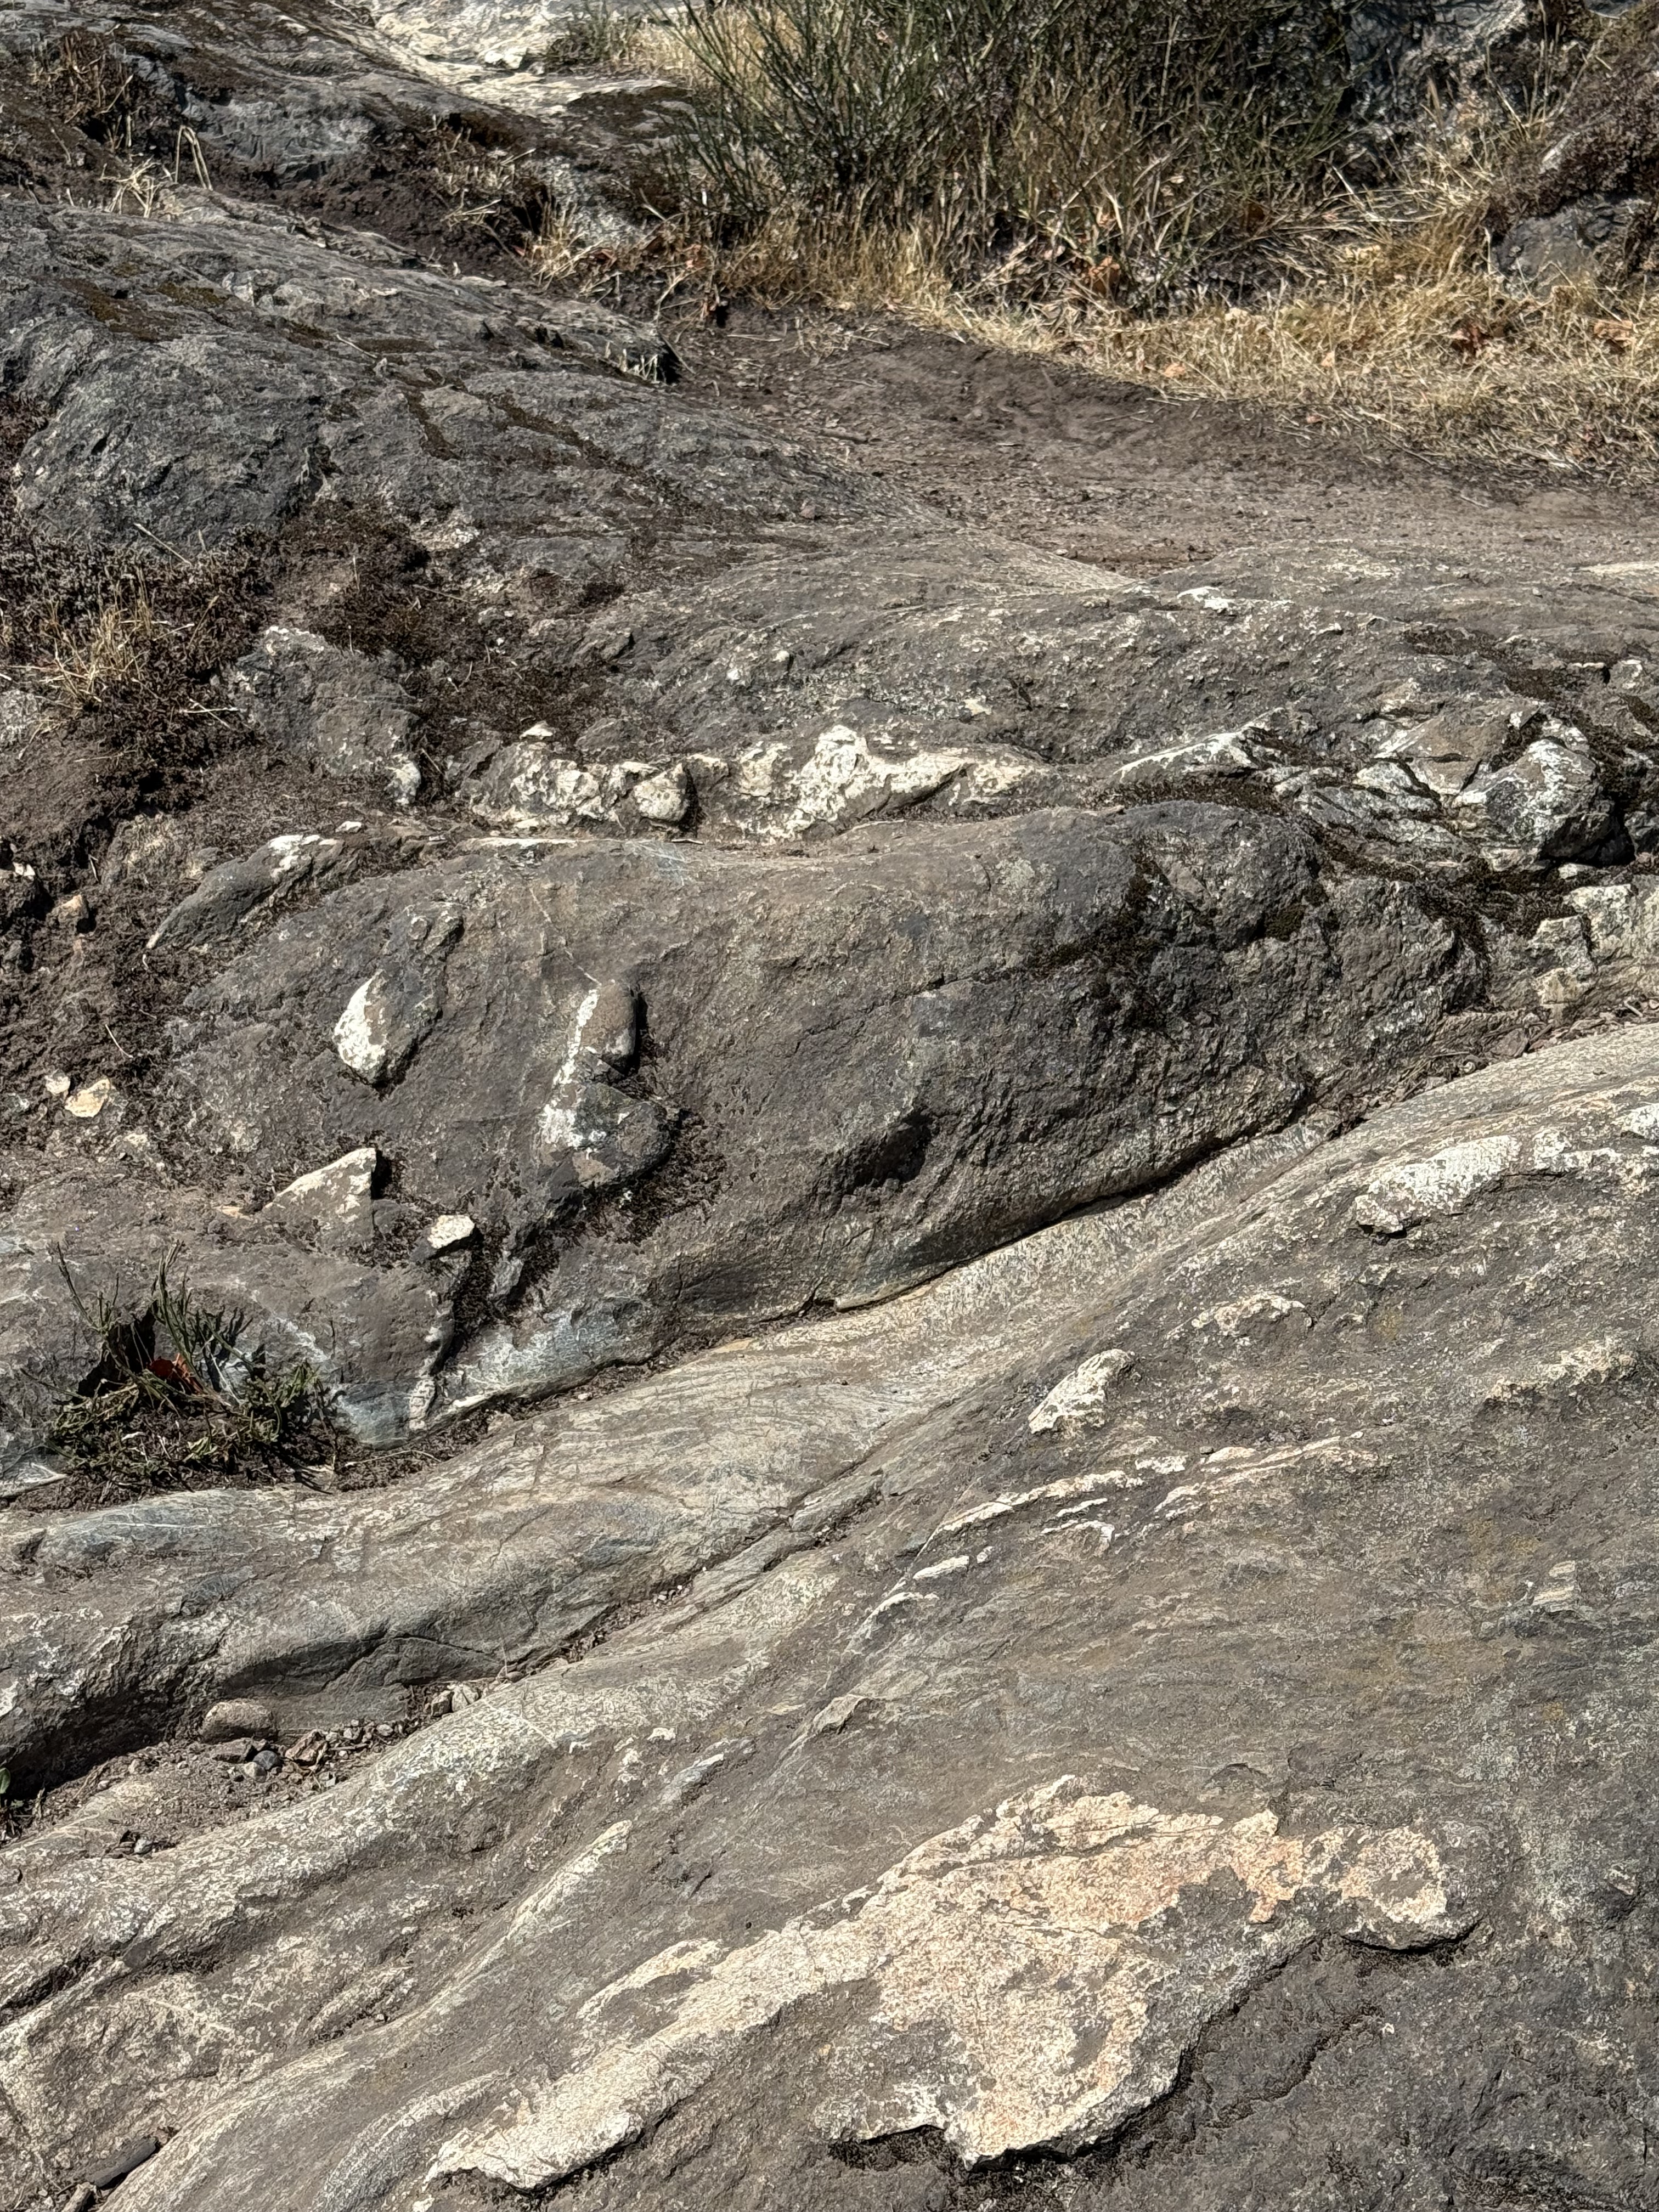
Figure 6. This image shows veins of quartz or feldspar (white material) that would have filled cracks and voids after the main magma had solidified (tens of miles deep), but residual liquids were still present.
Port Renfrew
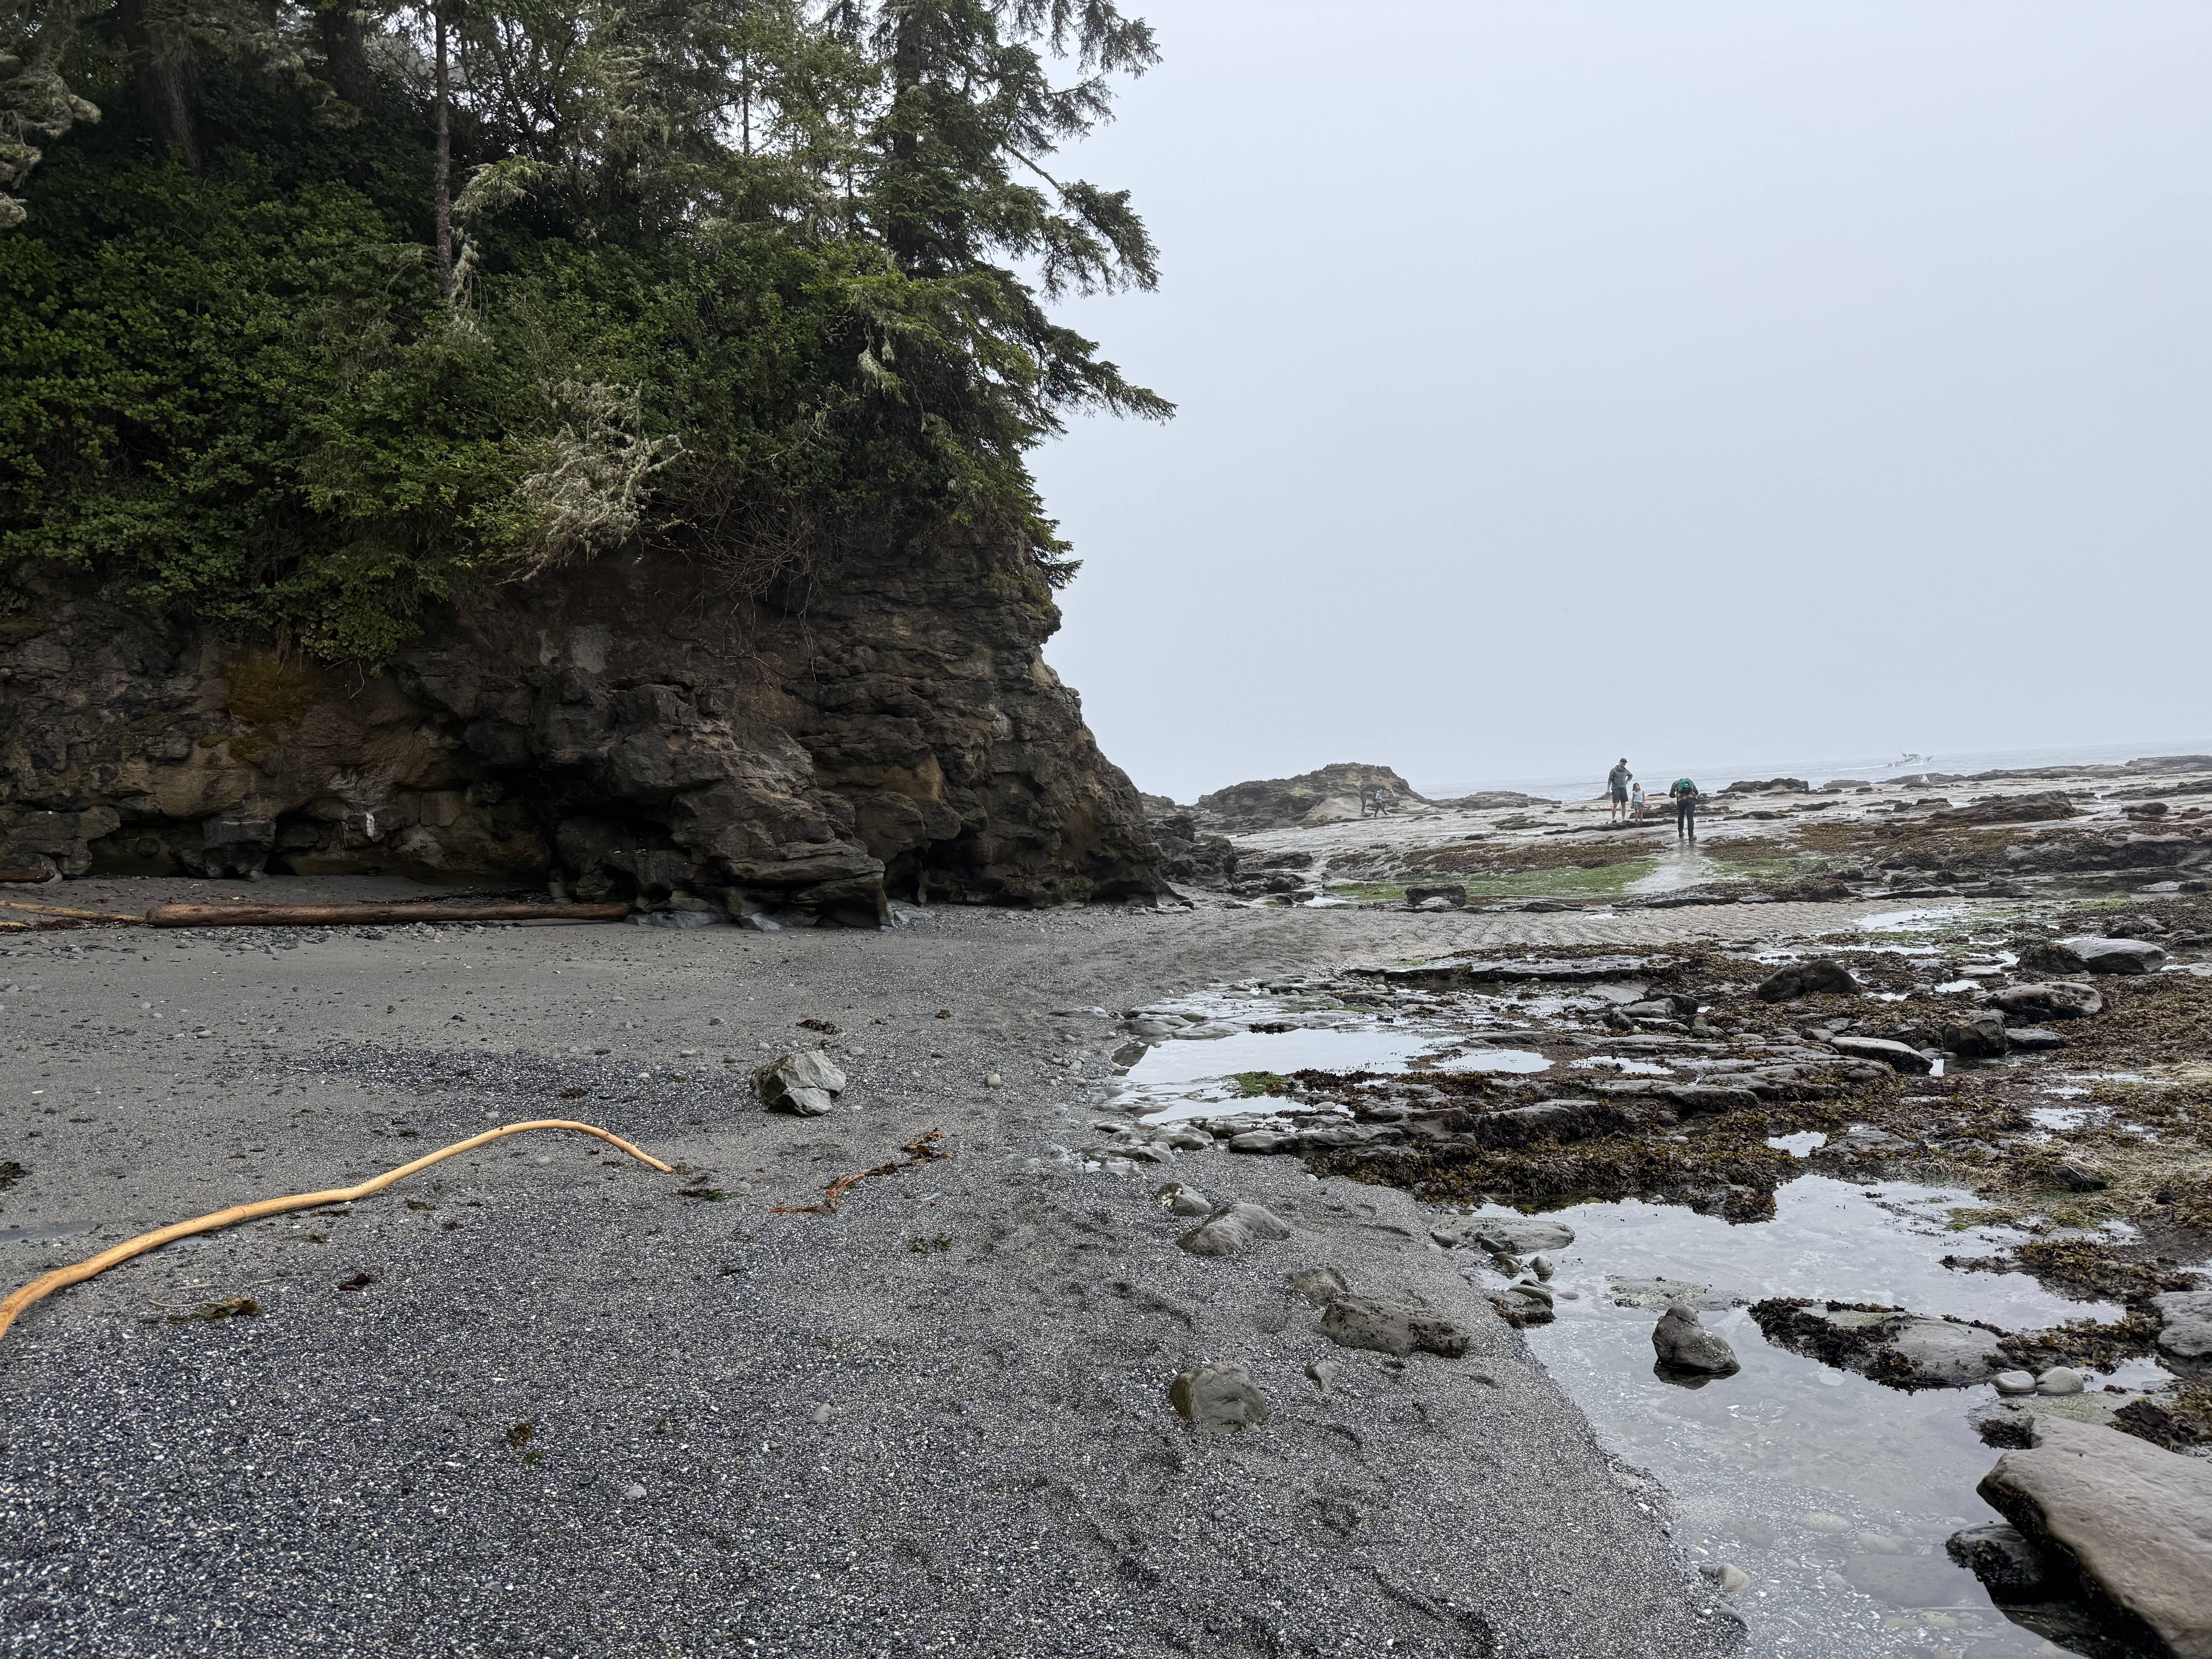
Figure 7. The cliffs at Port Renfrew are lower than in Victoria (compare to Fig. 1). They also don’t appear to be the same intrusive rocks we saw at Beacon Hill Park or Mount Douglas. The beach is covered with boulders and dark, coarse sand that couldn’t have originated from the erosion of granitic rocks. Let’s take a closer look.
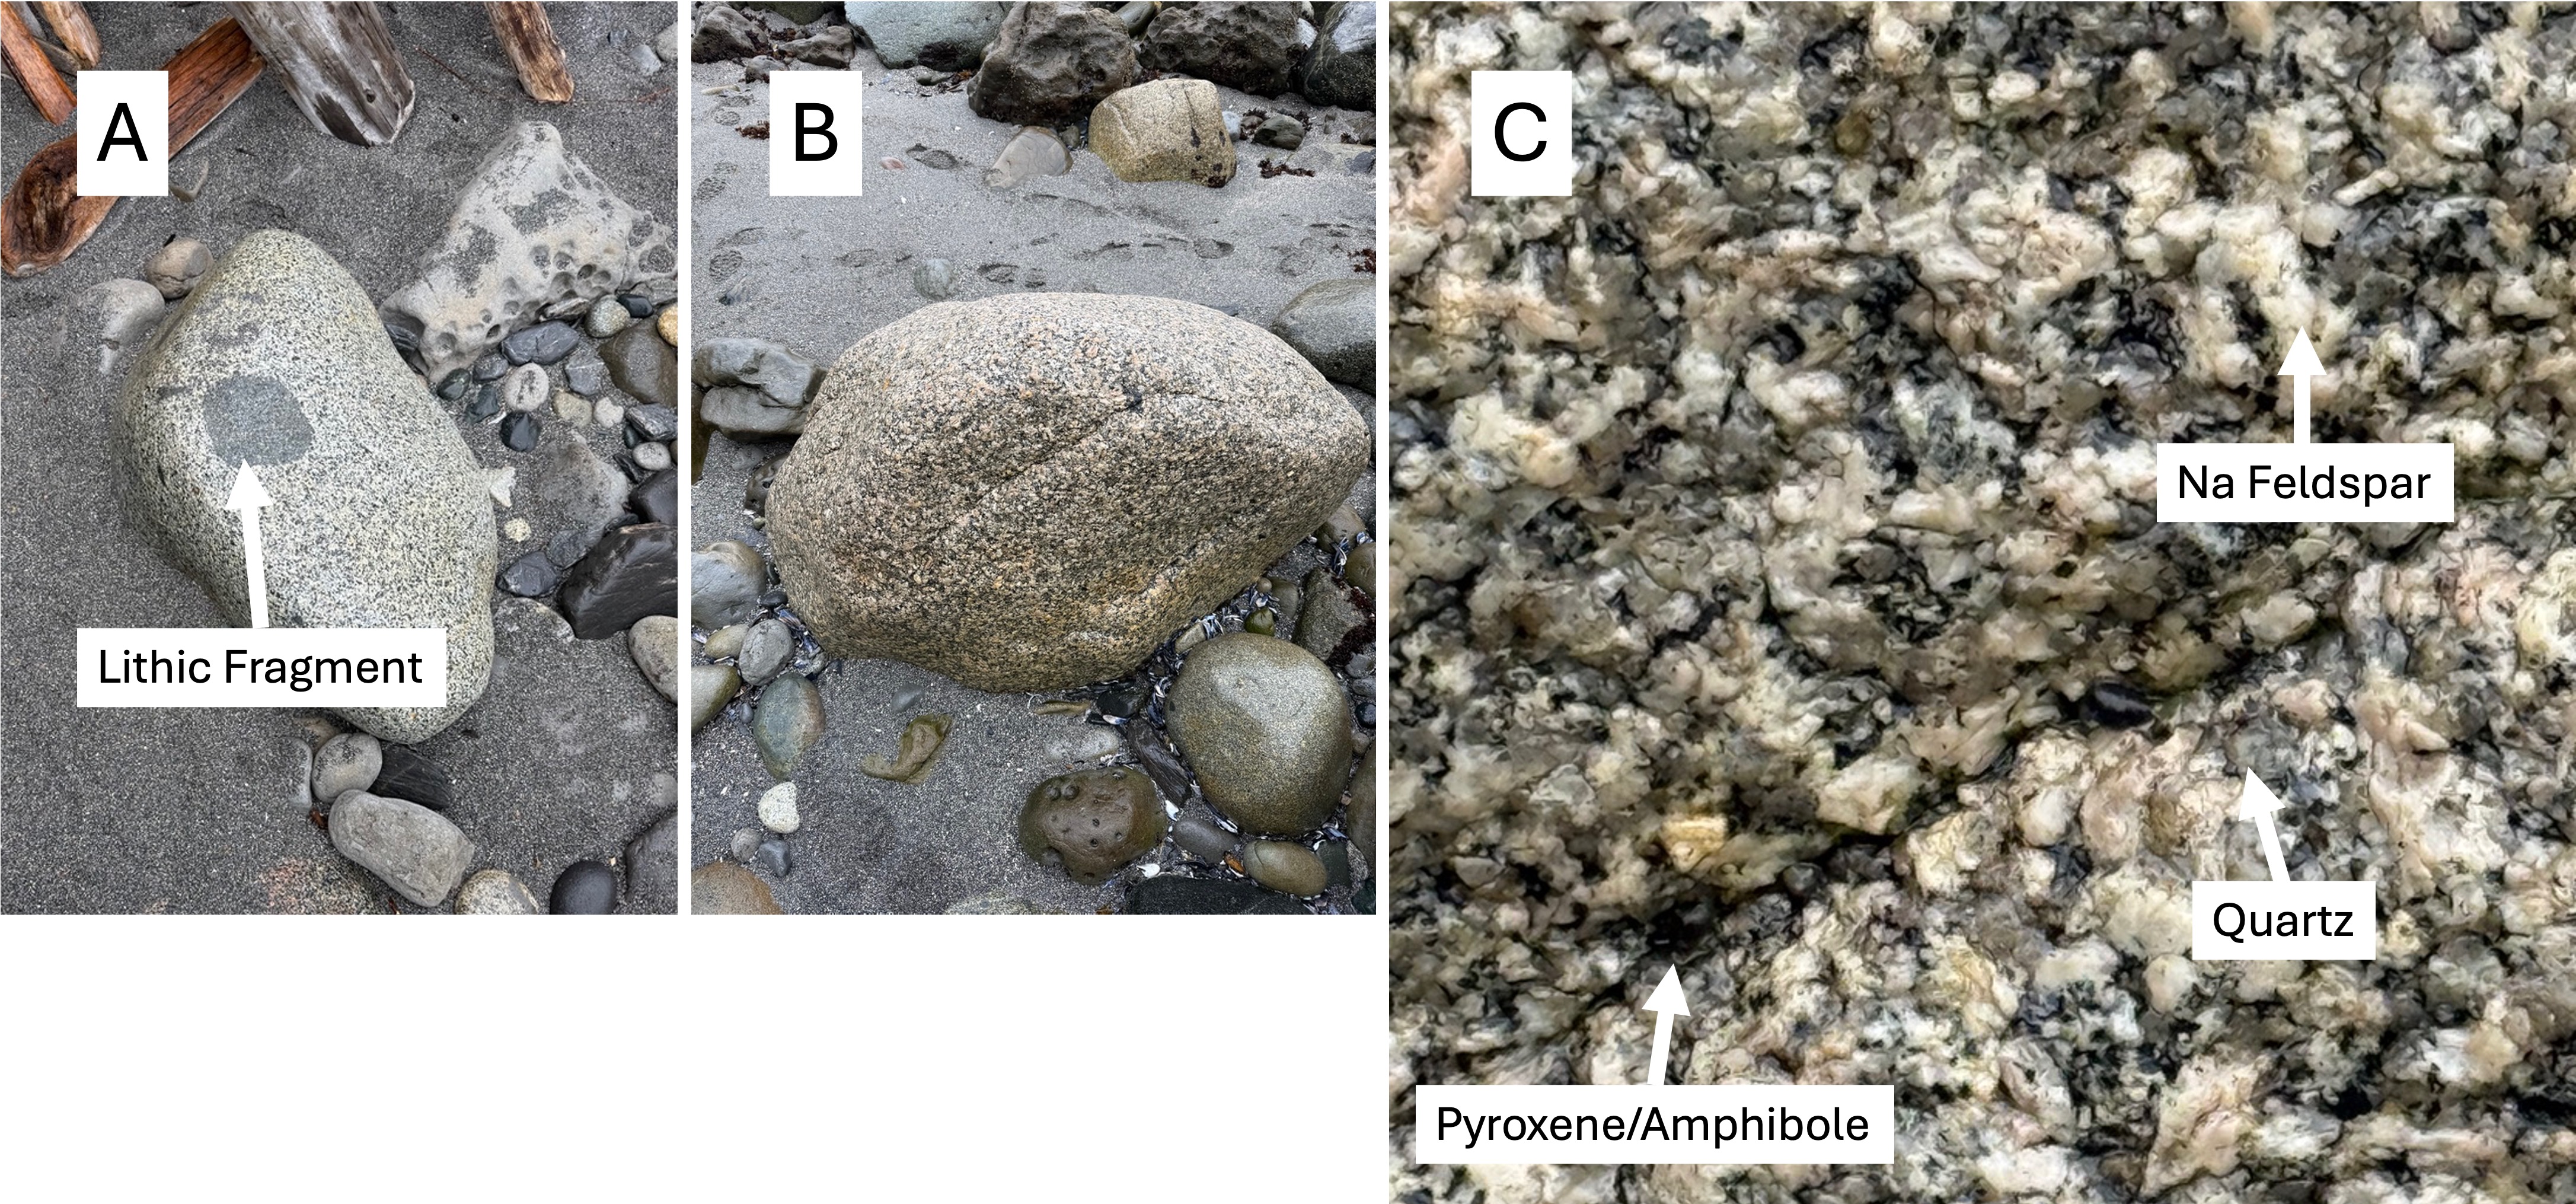
Figure 8. (A) This boulder includes a piece of the rock the magma was intruded into. The rounded edges suggest that the magma was still hot enough to partially melt the fragment; furthermore, the lack of a halo surrounding the inclusion implies that the melted material was incorporated into the magma by mixing. (B) This looks a lot like the granitic rocks in Fig. 5. (C) This boulder is fresh and individual minerals can be identified. Being wet enhances the contrast. The low quartz composition (I estimate it at ~20% from the gray blobs) suggests that this is either granodiorite or tonalite, depending on the amount of Ca-bearing feldspar. That requires either a chemical or mineralogical analysis. These boulders were transported along rivers from the center of the island, which is composed of granitic rocks (Fig. 2).

Figure 9. These ripples are almost a foot long, measured from crest to crest; and the troughs are filled with larger fragments of rock and shell. You don’t see these sedimentary structures preserved in the rock record very often, even if they do survive the vigorous tides on Vancouver Island.
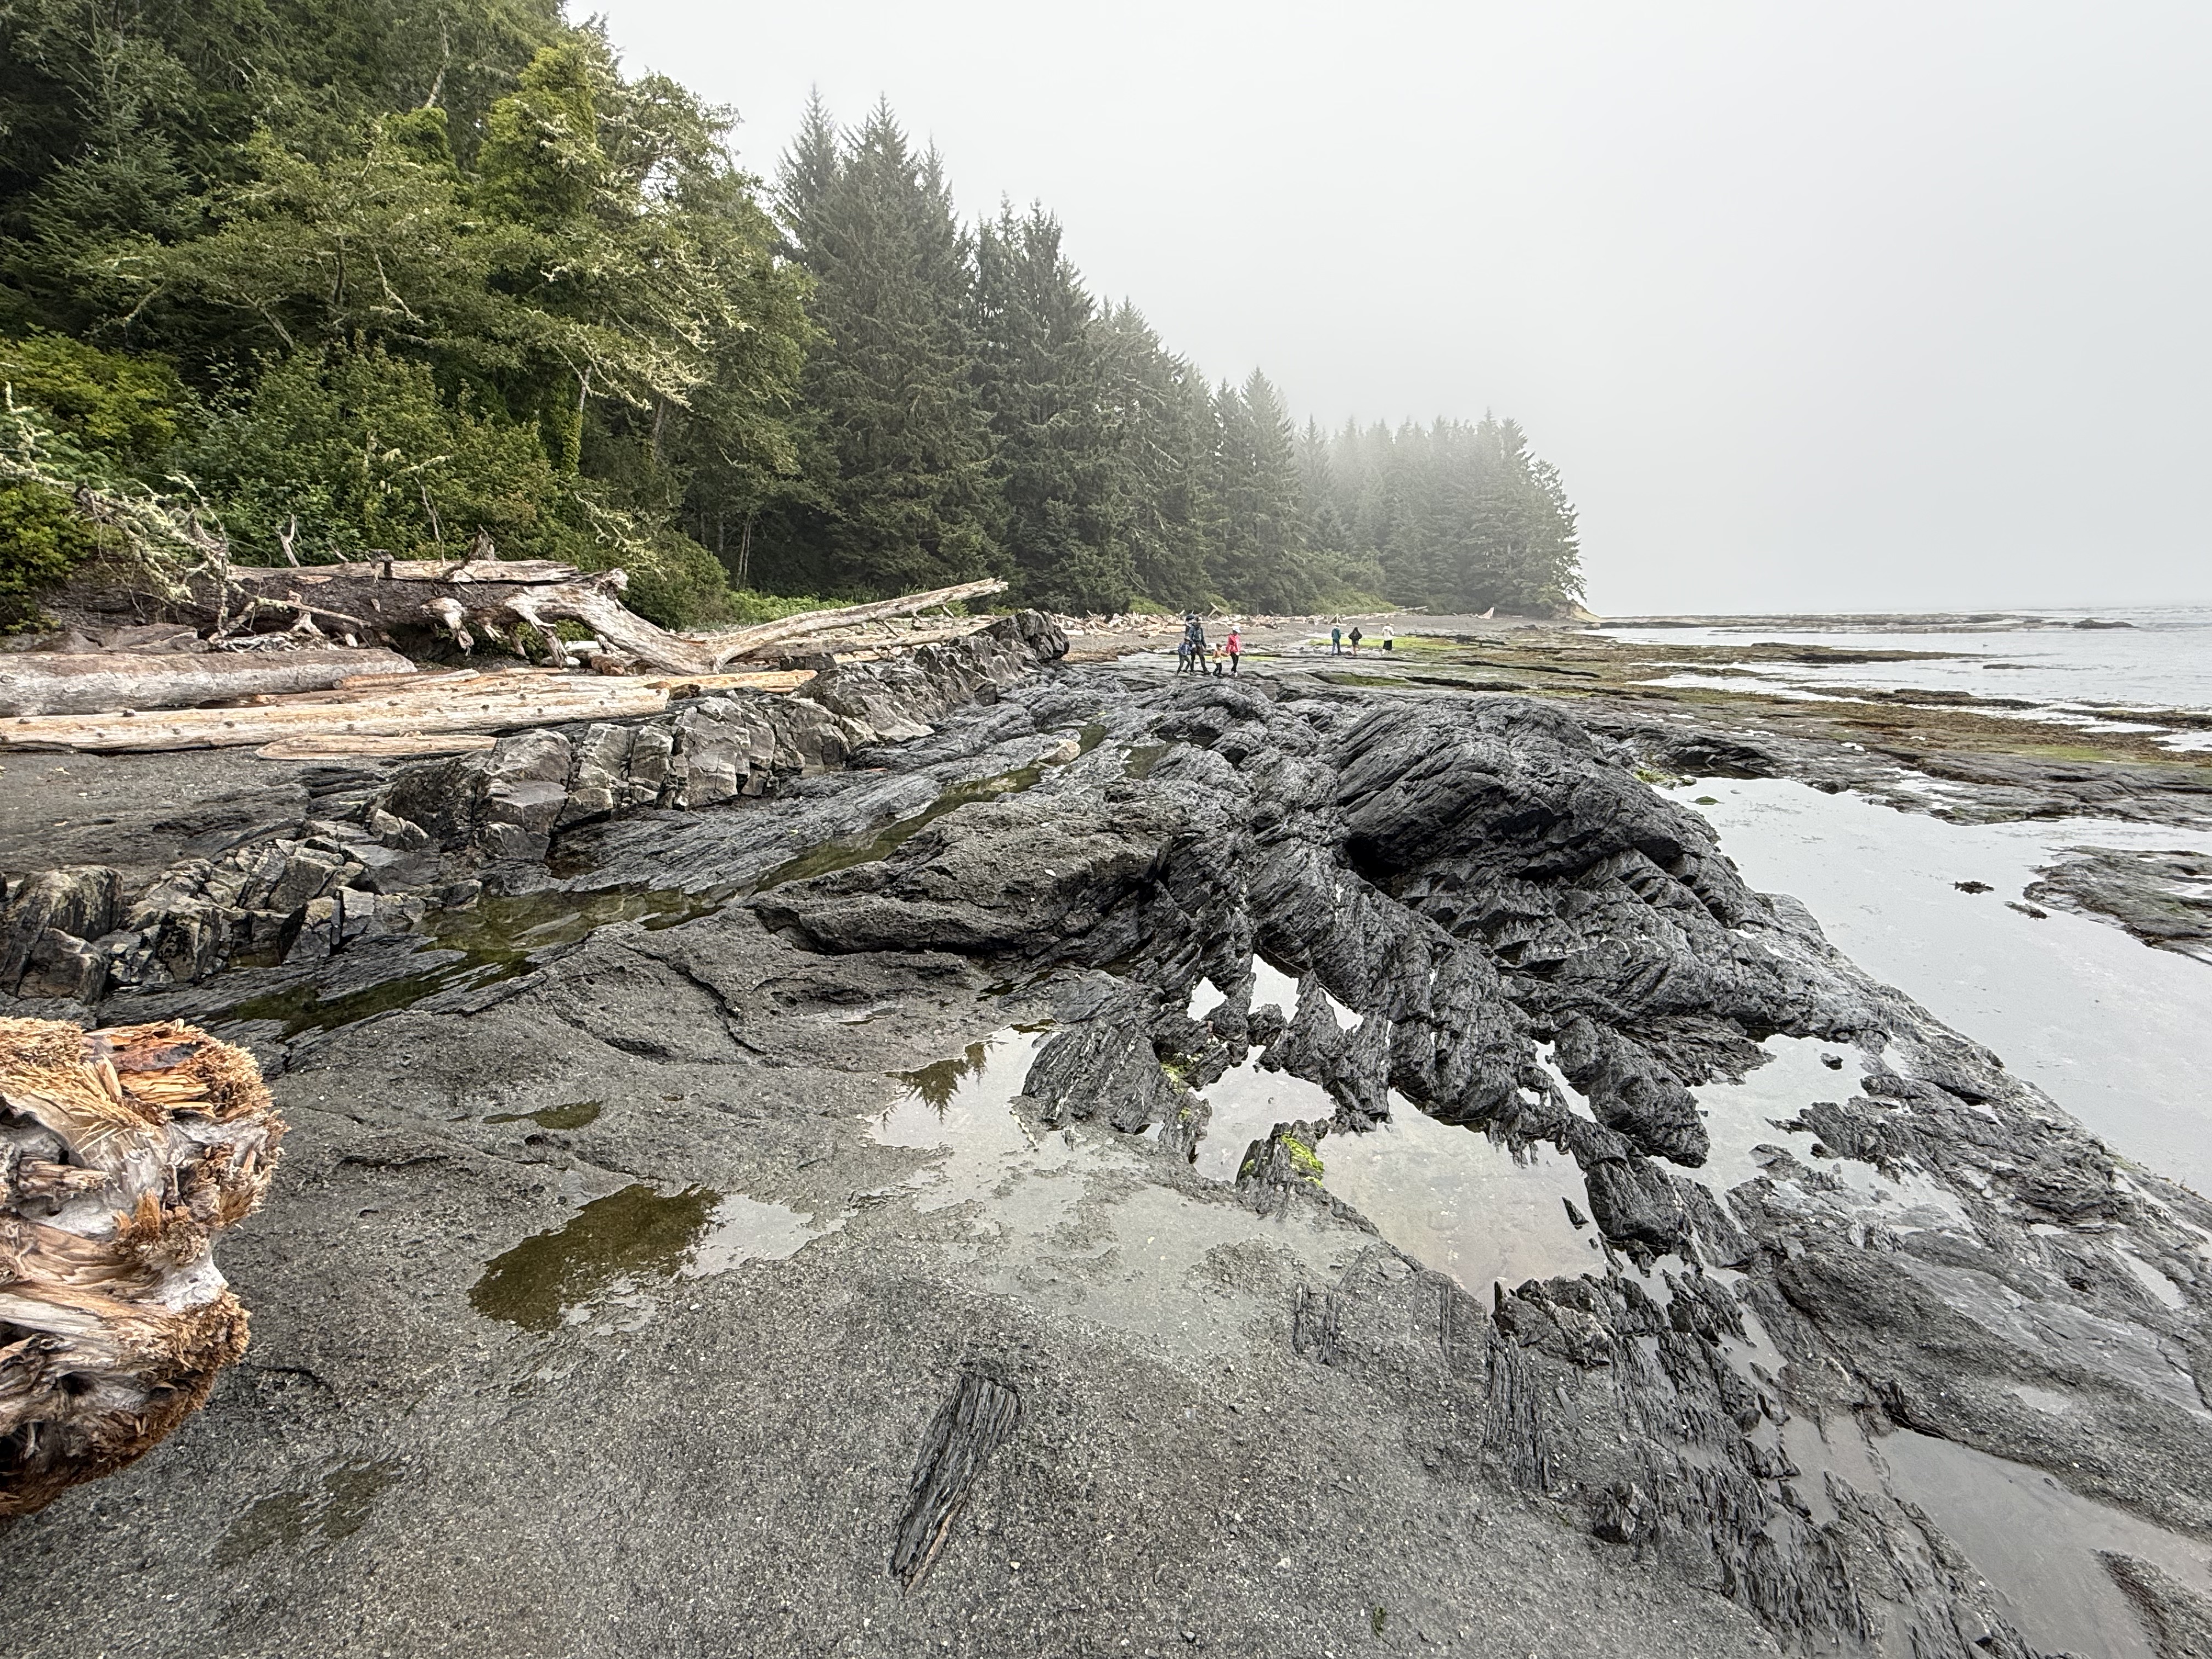
Figure 10. Exposures like this make geology fun. The darker rocks are tilted about 30 degrees to the left, but there are two distinct rocks types here: the lighter colored rock to the left is the same sandstone that makes up the cliff (Fig. 7); and the darker rock is schist, highly altered mudstone. In other words, a mildly altered rock is in direct contact with a metamorphic rock.
I checked with RockD, which integrates a global geologic map with location, and discovered I was standing on the contact between Leech River Complex metamorphic rocks (200-66 Ma) and Carmanah Group unaltered sedimentary rocks (37-23 Ma). This is a textbook unconformity that represents at least 29 million years.
The younger rocks are nearly horizontal, so I think this is an angular unconformity. During the missing millions of years, the older sediments were buried and heated enough to create schist; then uplifted and exposed to the sea, whereupon the younger rocks were deposited on a beach not that different from what we see today.
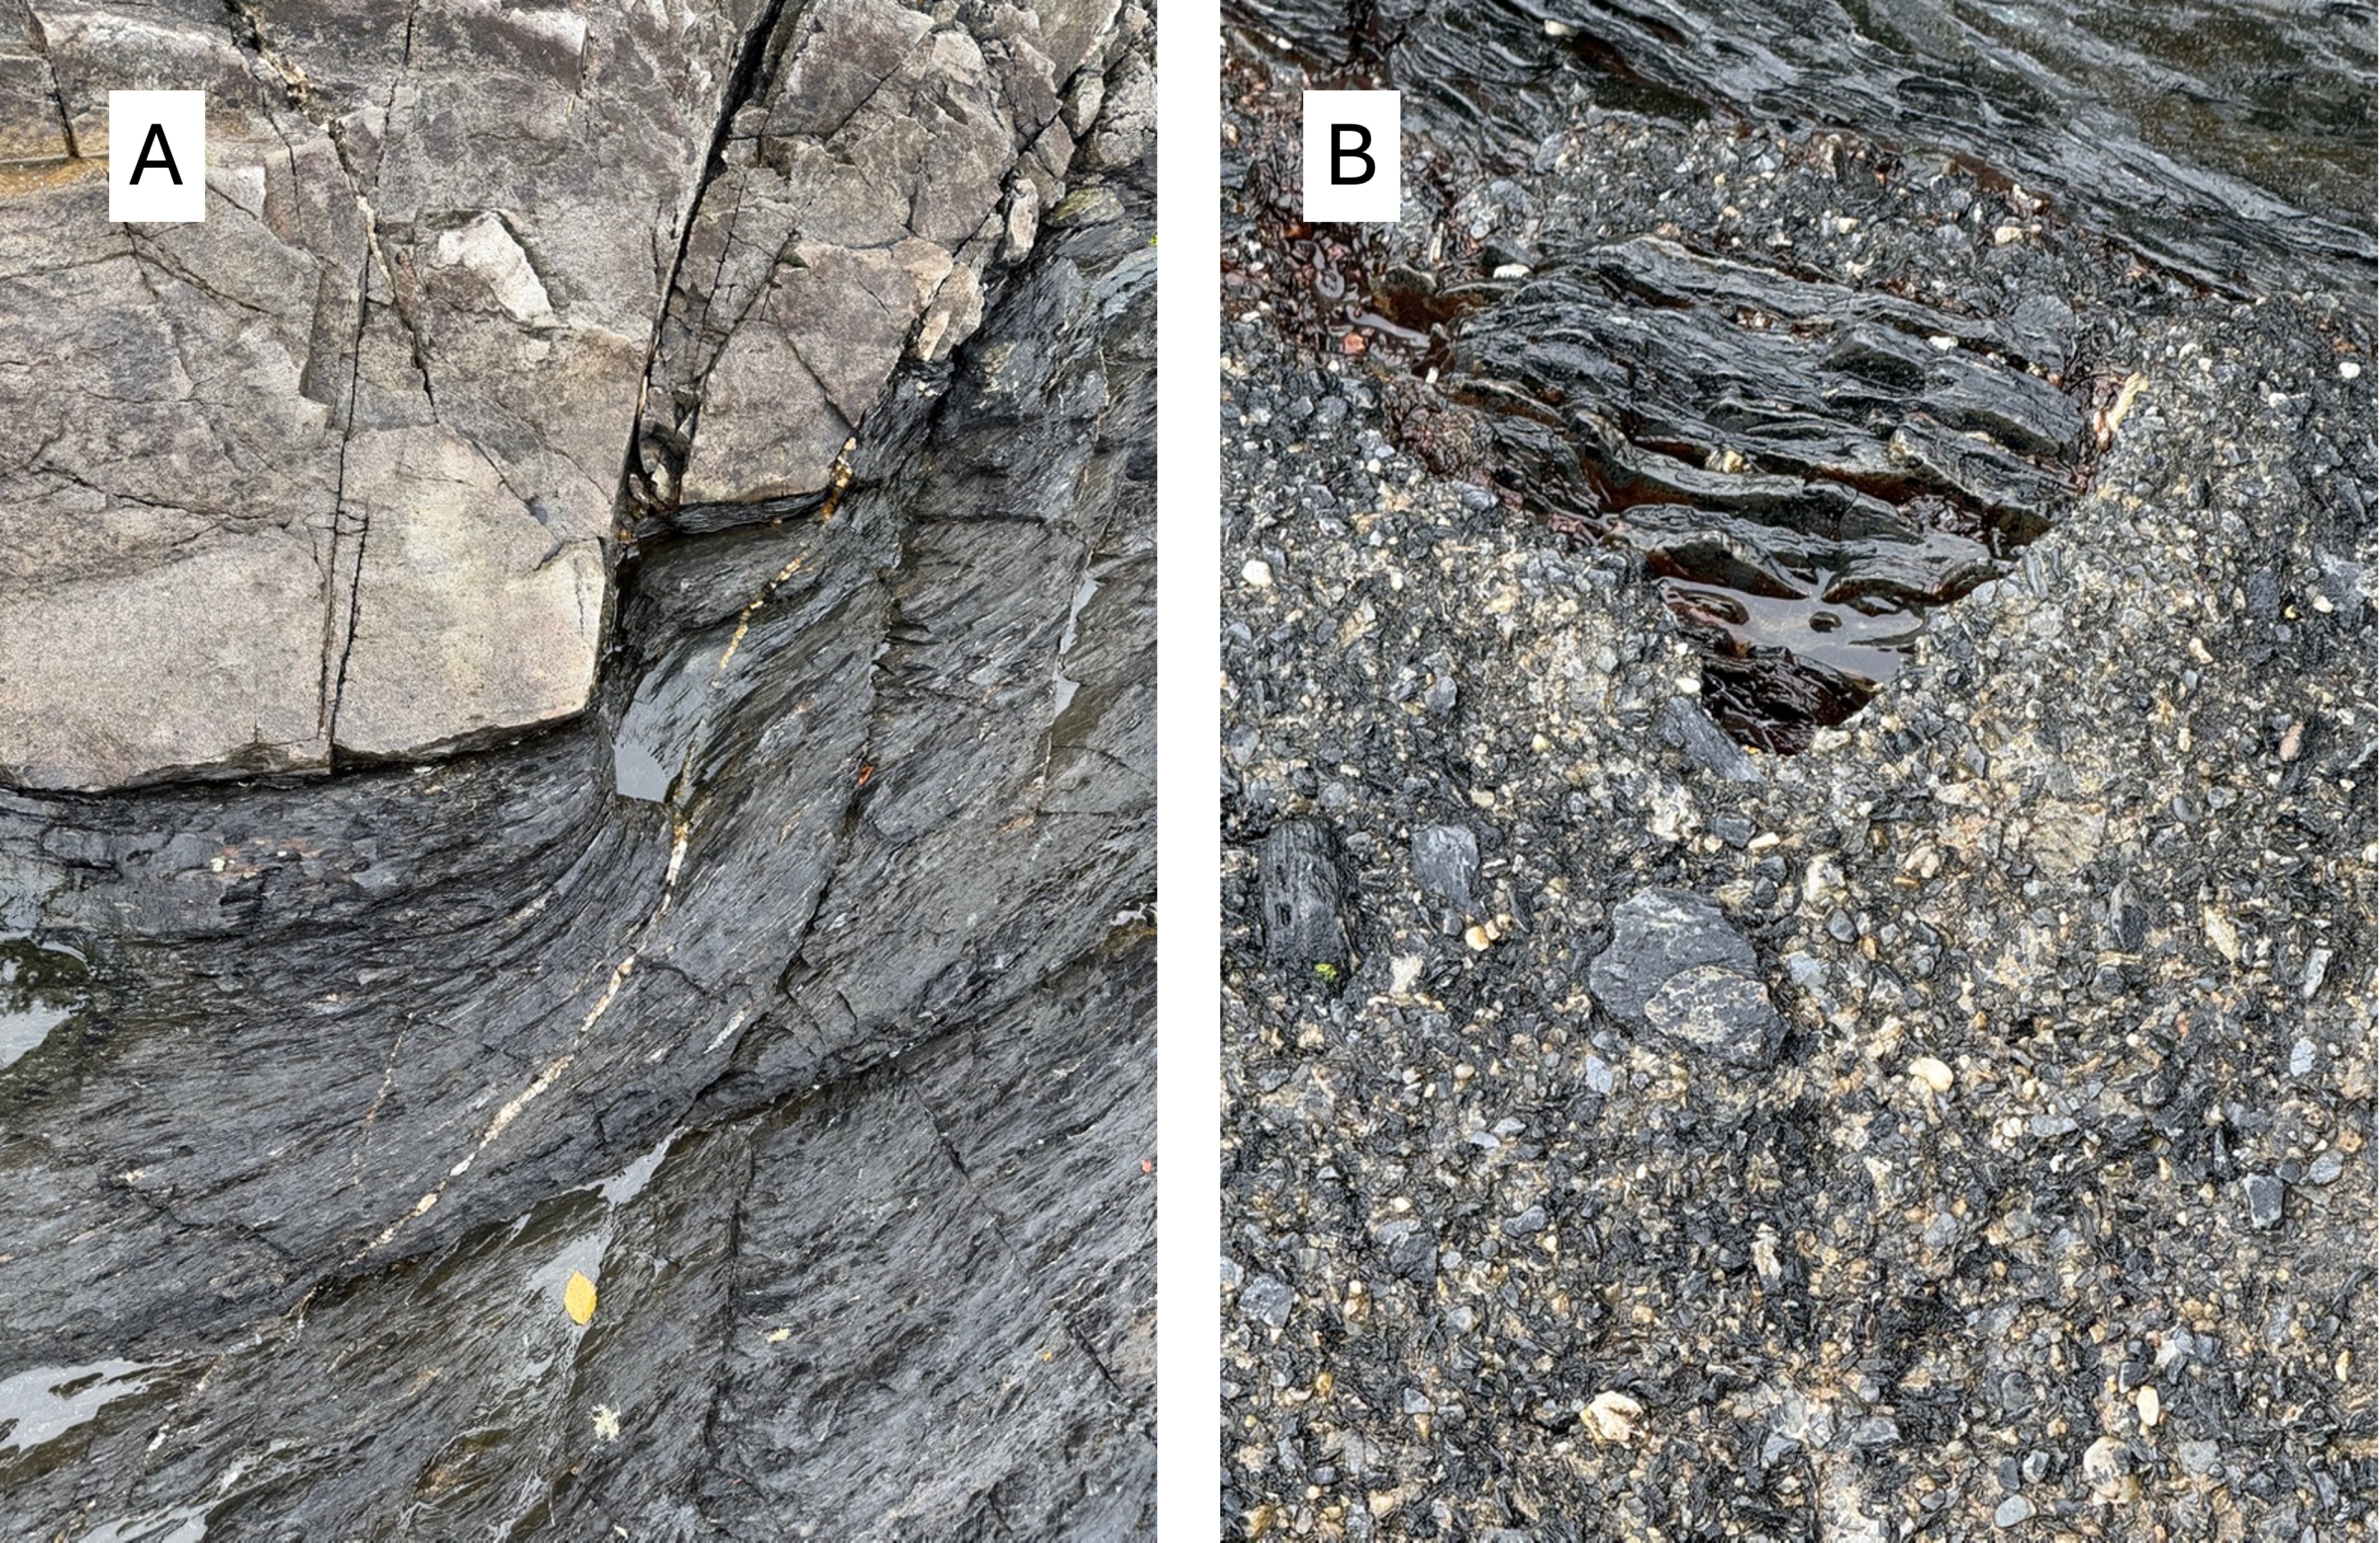
Figure 11. The devil is in the details, as shown in these images. (A) The older rock was folded during burial and, when exposed to the waves, eroded along relict bedding surfaces. Coastal sediments were then deposited in nooks and crannies like we see today. (B) Those dark fragments that look like they’re lying on the beach are actually cemented in place; the background pebbles aren’t modern sand, but instead sand frozen in time at least 29 million years ago.
Amazing.
Summary
Sometimes you can tell a story about the rocks you find, and this is one of those times. And it’s a story that unfolds across the globe. However, this story can’t be easily told because it unfolds on a sphere–the Earth. I’ll do my best.
For hundreds of millions of years, way back in the Paleozoic era, what we now call North America was drifting eastward and the West Coast (e.g. the Pacific Northwest) was a passive margin, like the East Coast is today. Suddenly, geologically speaking, the supercontinent, Pangea, which had been created from all the continents, split apart. North America reversed direction and the passive margin became a collisional plate boundary.
Ocean crust, and any islands or microcontinents that were in the way, were swallowed by the mantle or crushed by North America, creating the igneous rocks we saw at Beacon Hill Park and Mount Douglas. Muddy ocean sediments were swallowed and transformed into the schist we found at Port Renfrew. Volcanoes erupted all along the West Coast.
Then the story gets complicated and controversial.
Because the earth is not flat, crustal plates don’t slide beneath one another like sheets of paper. They crumple at the edges, forming transform faults (e.g. San Andreas fault of California) along which tectonic plates (or pieces of them) can slide past each other horizontally. This probably occurred between 200 and 66 million-years ago; if so, the rocks of Vancouver Island were originally deposited/intruded in Eastern Washington before sliding hundreds of miles to the NW.
When the crumpled edges of the colliding plates had taken up the slack, subduction resumed to the SE and the Cascades Range of volcanoes was born. This process continues to this day.
That’s the best story I’ve heard so far.
Ecology Notes on Flaming Geyser State Park
This is my last post from Flaming Geyser State Park. I discussed the geology and the sights in previous posts. Today I’m going to look at some of the highlights in a riparian ecosystem that seems to be recovering from excessive logging; however, the area has been in private hands for more than a century, which allowed the maturing forest we find today to develop.

This paper birch (or red alder) caught my eye because of the bunches of small branches growing from the bark at different heights. ChatGPT says these are epicormic sprouts, areas where dormant stems wait for more sun or, possibly, stress to the tree.
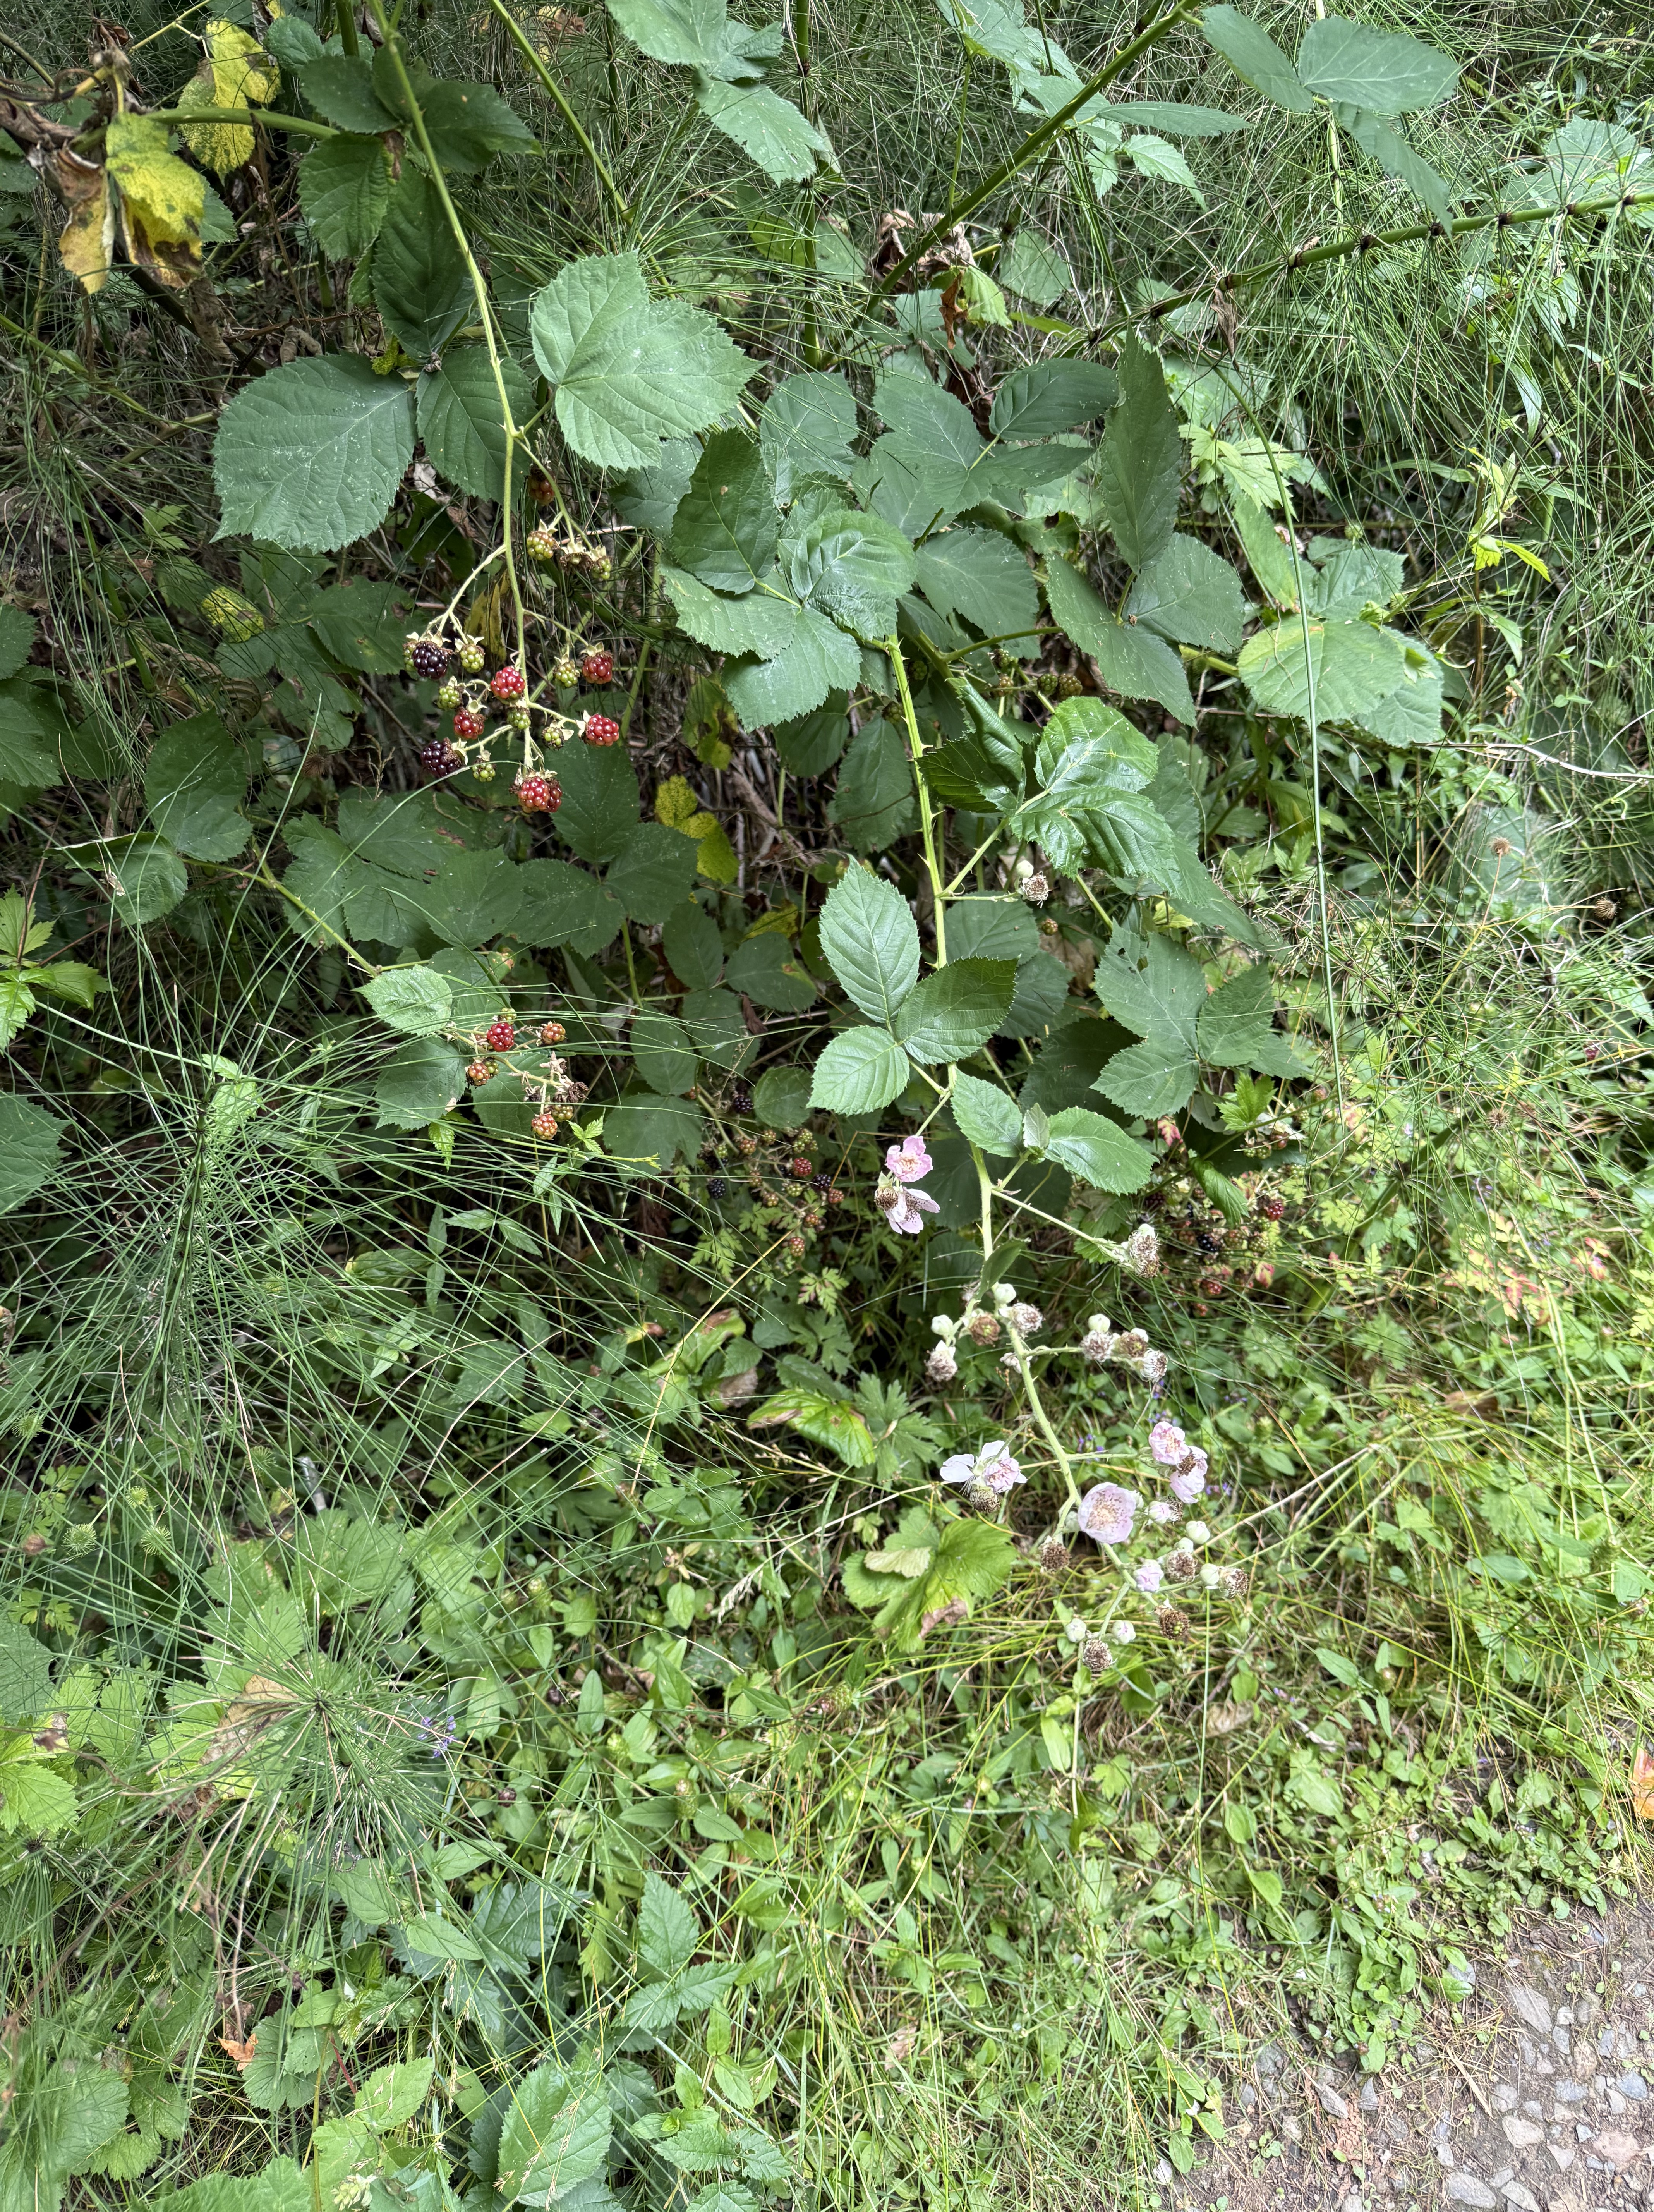
Himalayan Blackberry and Trailing Blackberry (with flowers) along the trail.
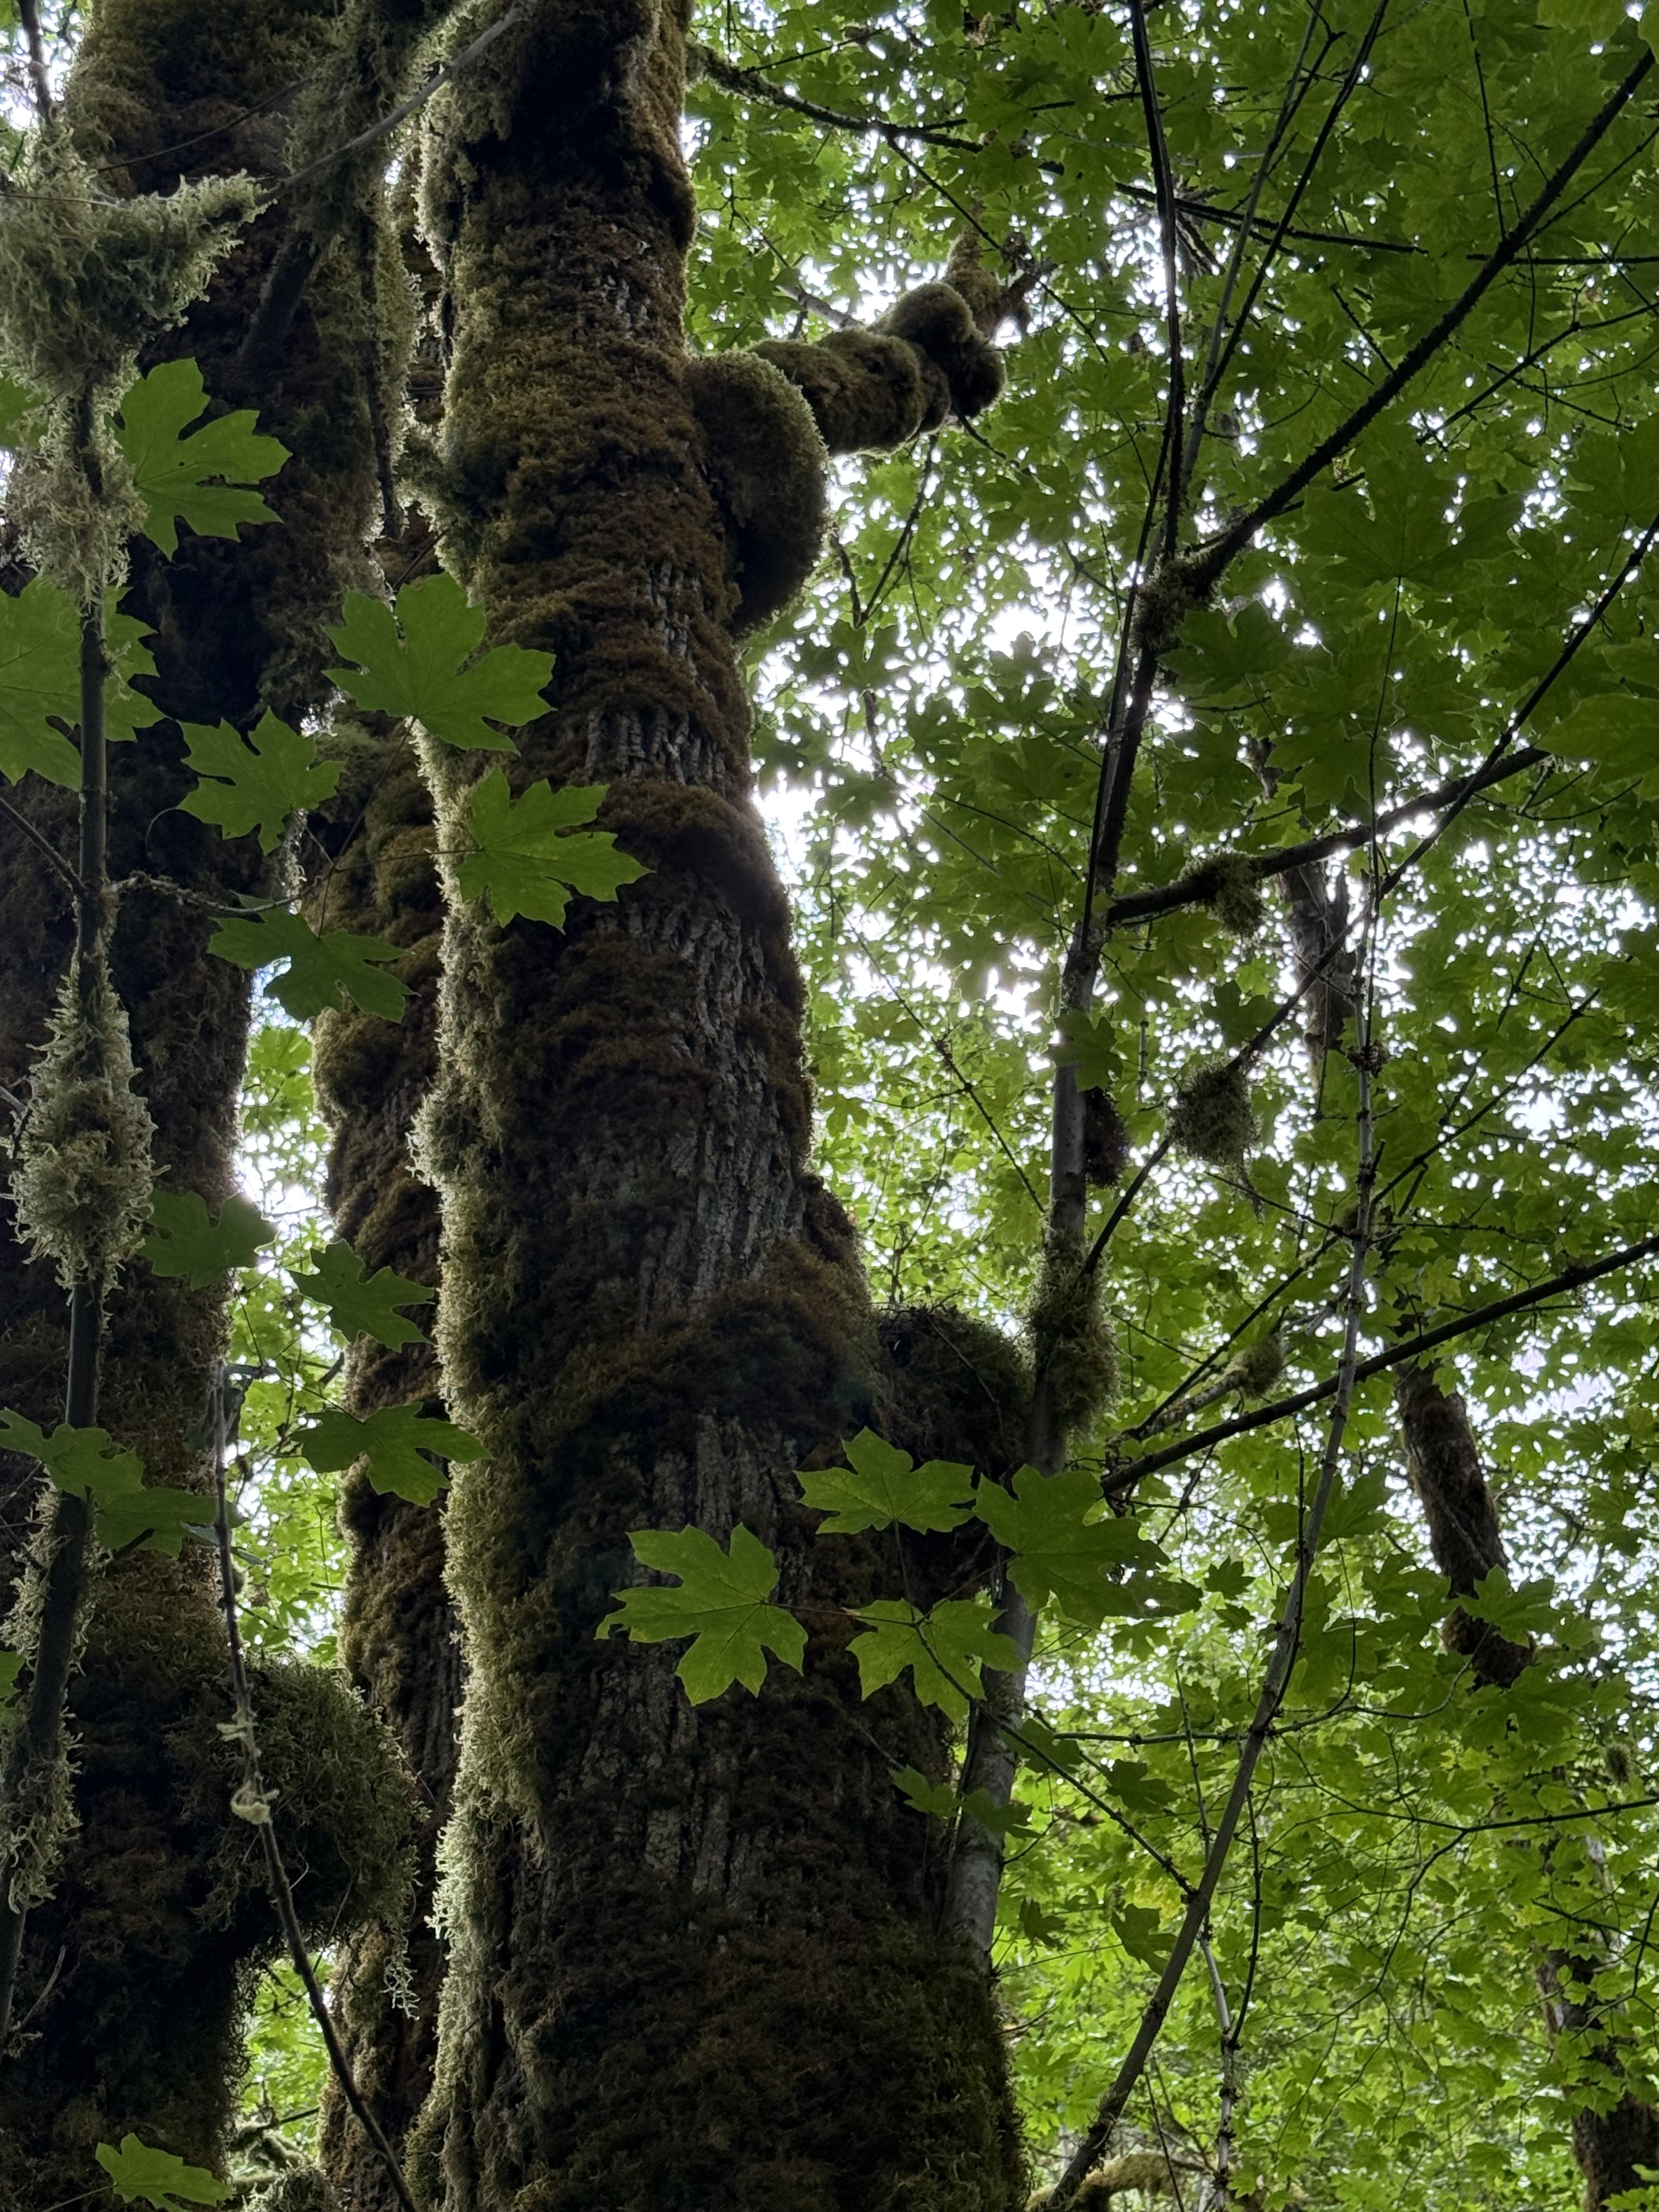
Big leaf maple covered with moss mounds on (probably) epicormic mounds, which have collected over the years but weren’t active; or else the new growth has died back.
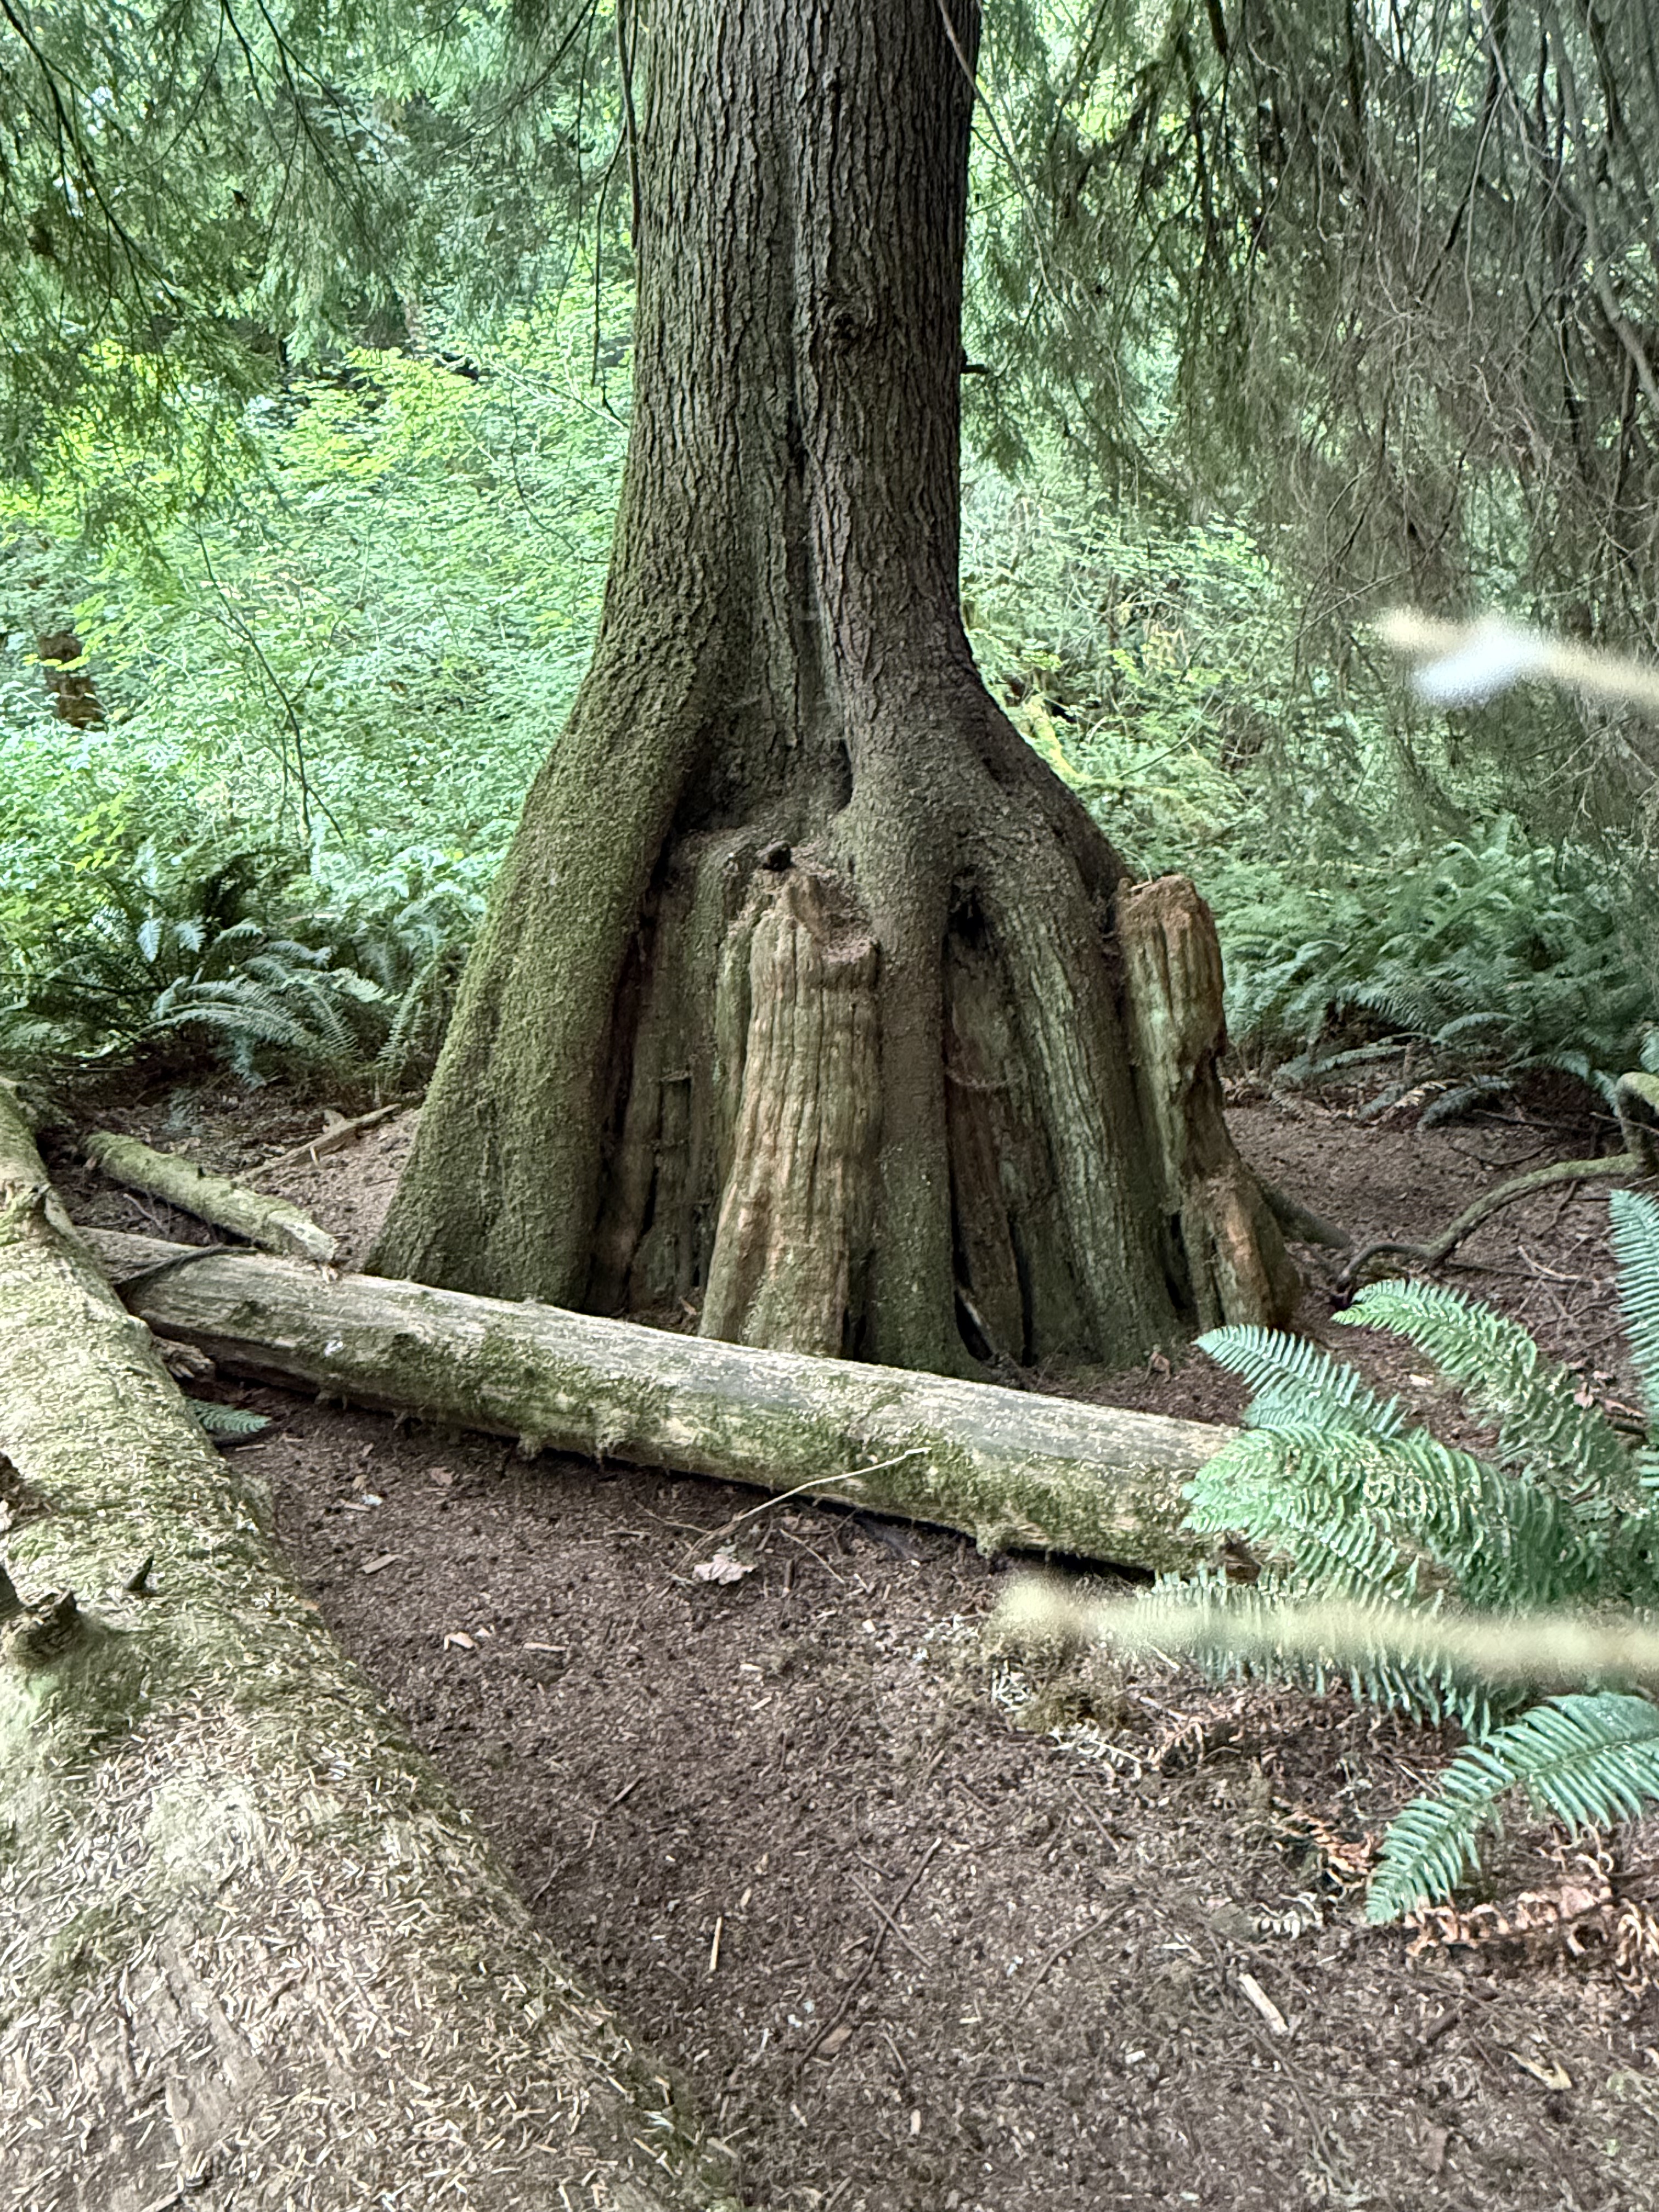
Douglas fir resting on the nurse stump where it grew from a seed. I’ve often seen examples of this phenomenon with roots projecting every which way, but this fir seems to have timed its growth perfectly with decay of the host.
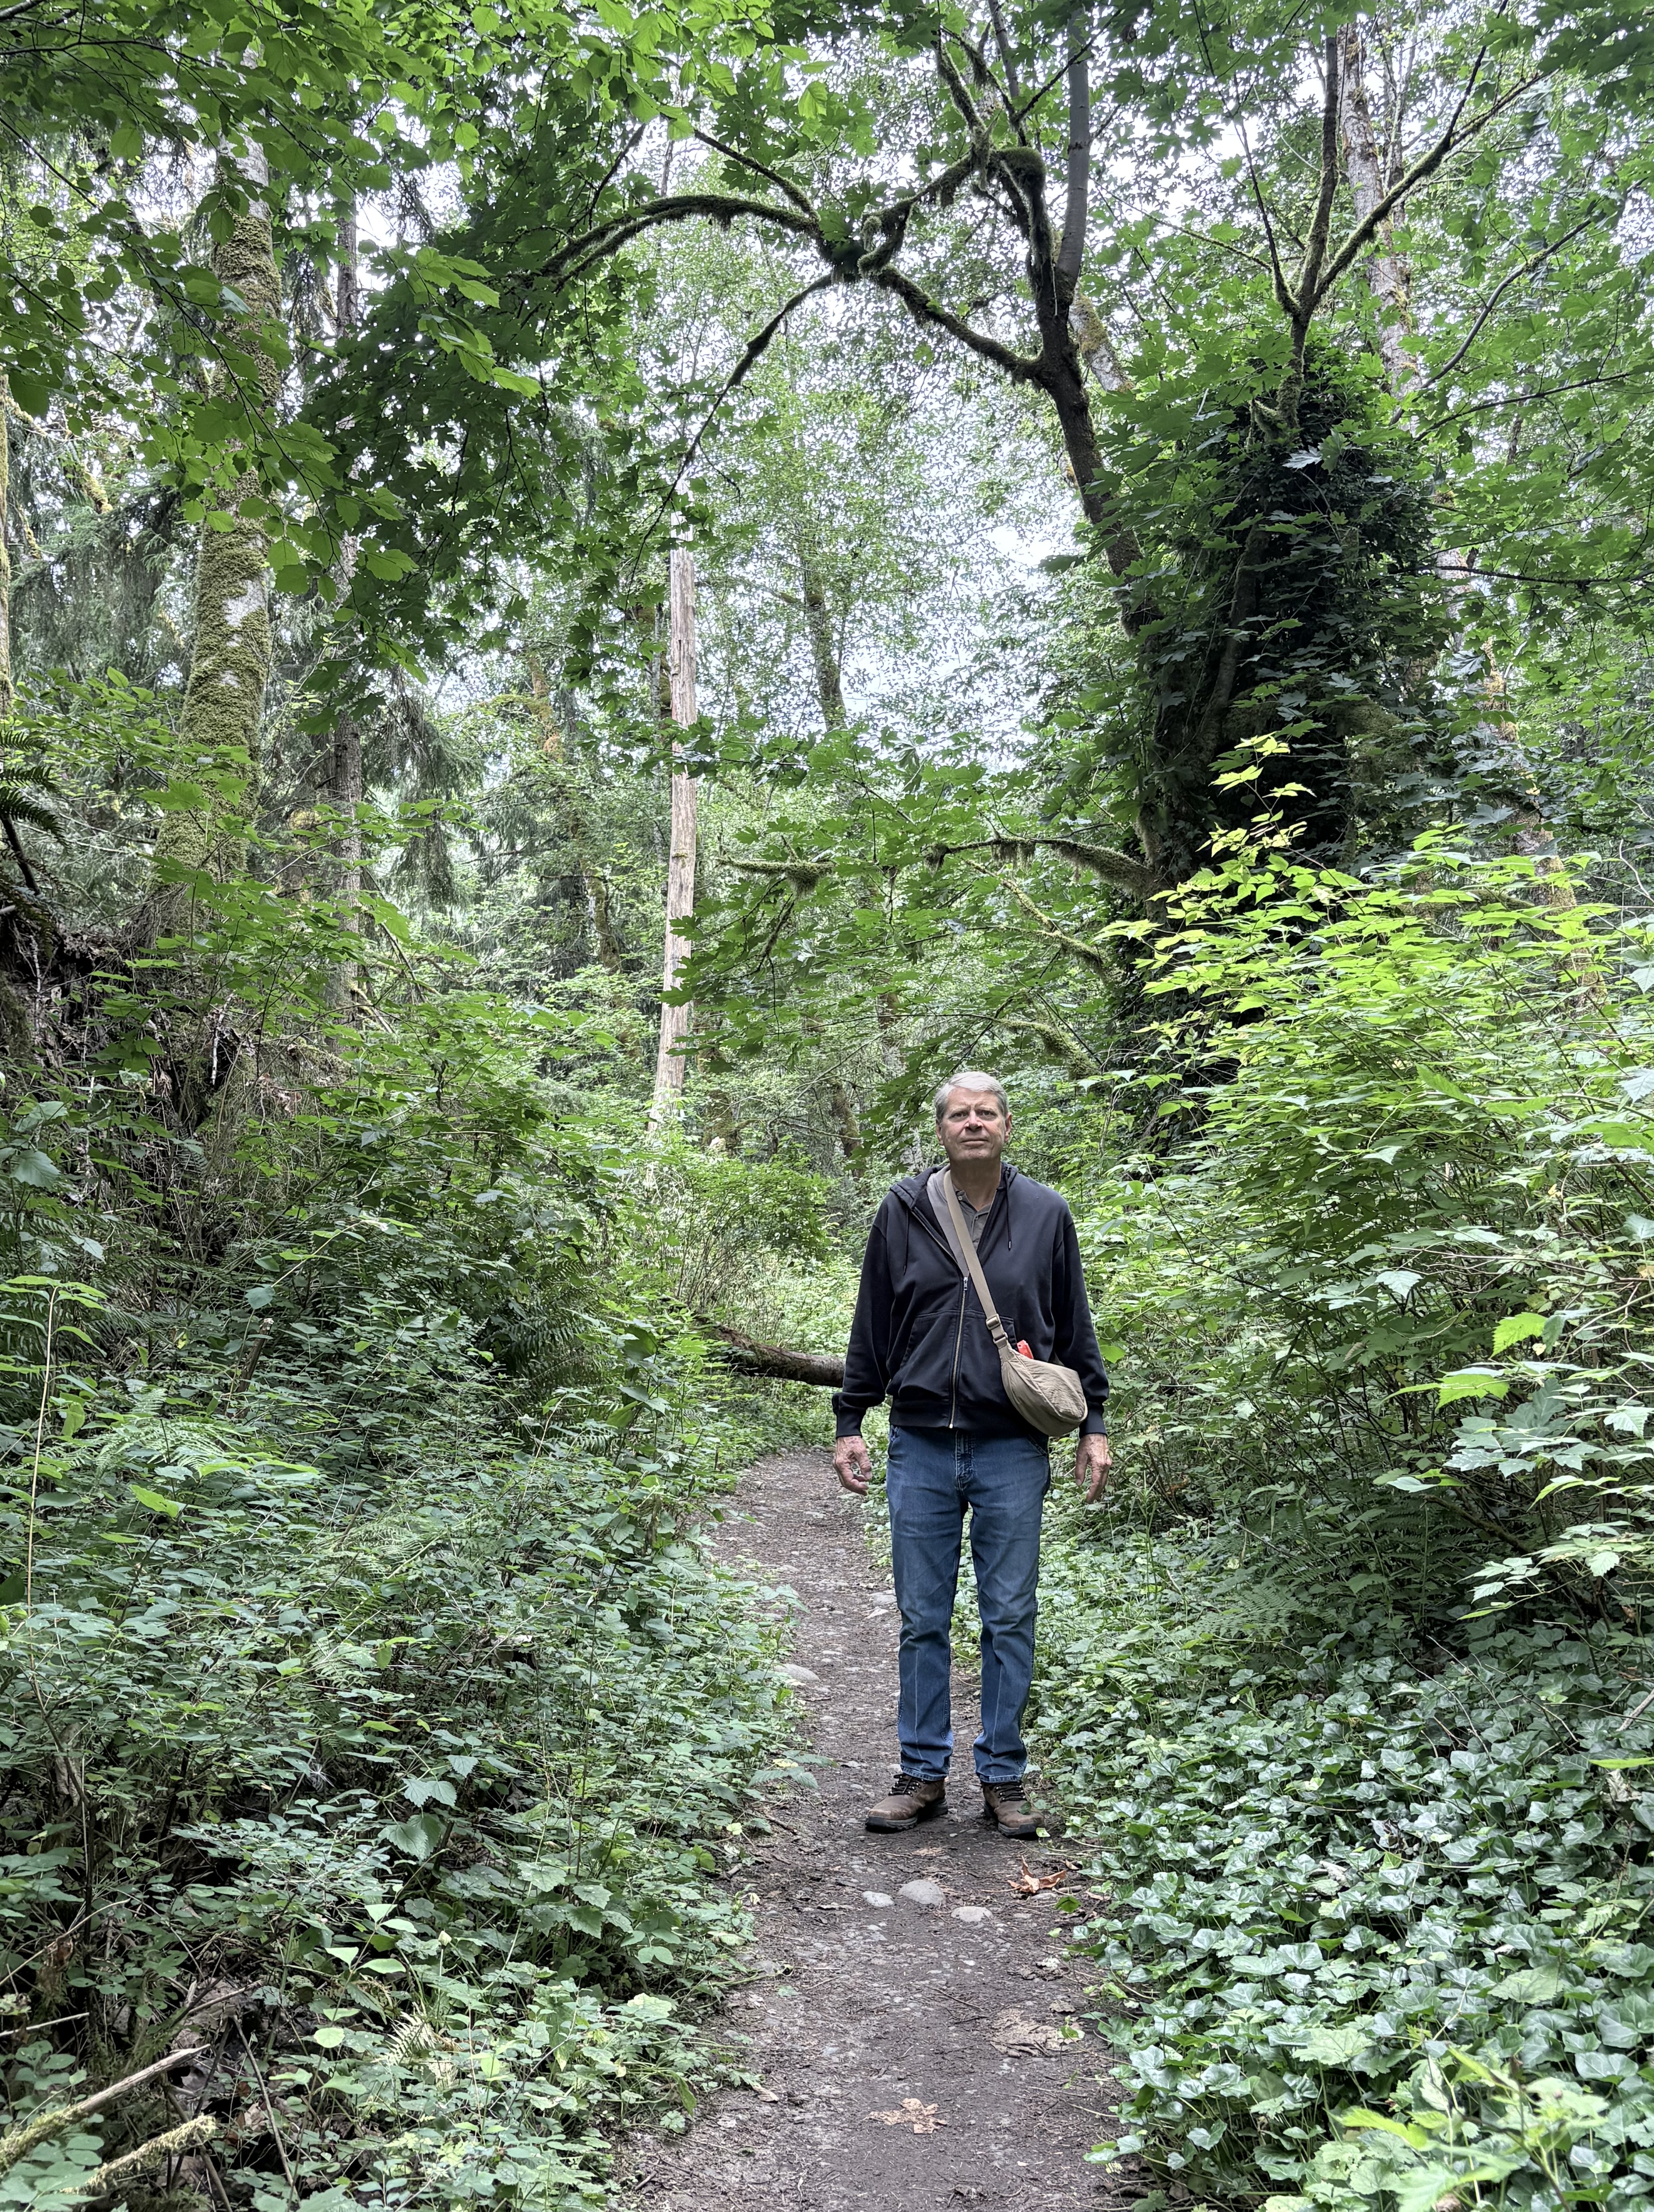
This photo shows me standing among a bunch of bushes. That’s how much I know about botany. So I asked ChatGPT what plants it could identify. It came up with a long list: Douglas fir and Bigleaf maple; Salmonberry, elderberry, and maple seedlings; English ivy, Sword fern, stinging nettle, and a variety of mosses. It pointed out that this stretch of the trail doesn’t reveal any Himalayan blackberry, which means that this is a natural ecosystem for the PNW.
Final Thoughts
Flaming Geyser State Park represents a classic riparian ecosystem in the PNW. It has been invaded by Himalayan blackberry, but the native plants seem to be holding their own…for now.
Eocene Continental Sediments in Flaming Geyser State Park
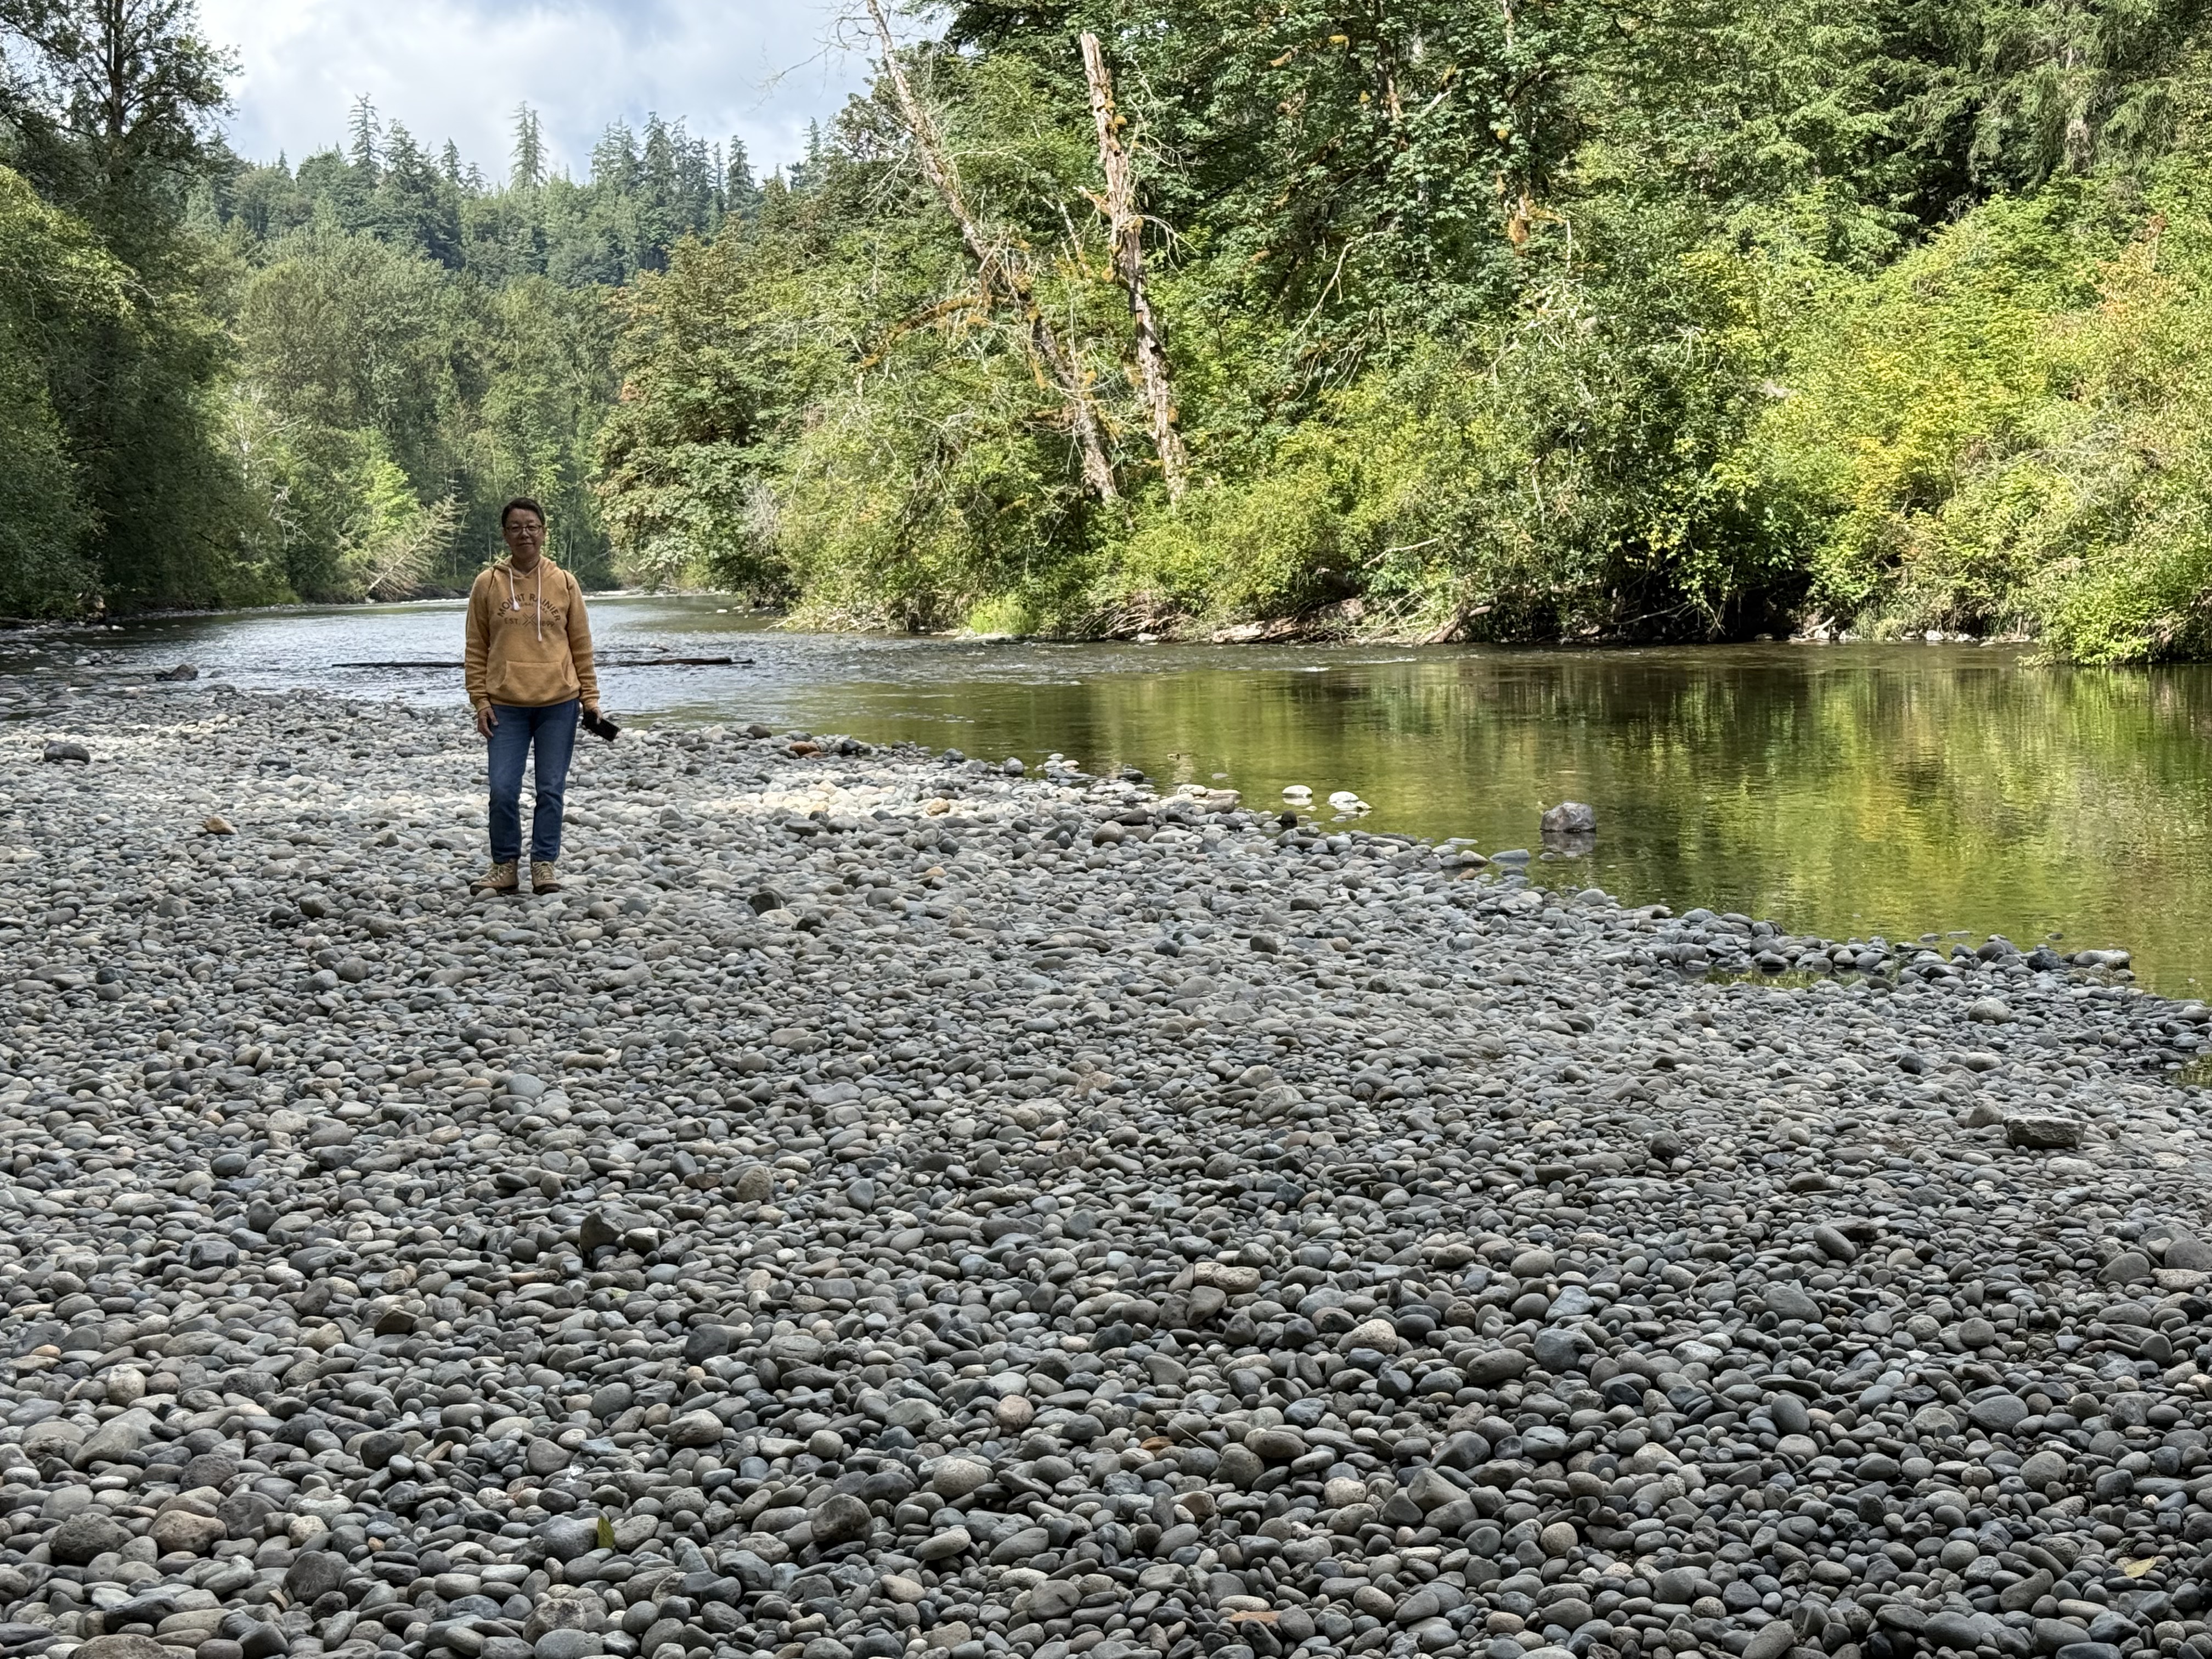
Figure 1. Flaming Geyser State Park is located along the Green River (see Fig. 2 for location), where its valley narrows and deepens. This photo shows a typical gravel stream, but there is plenty of sand and even clay available to construct a flood plain. The alluvial deposits downstream are rich farmland, where we saw a variety of vegetables growing.
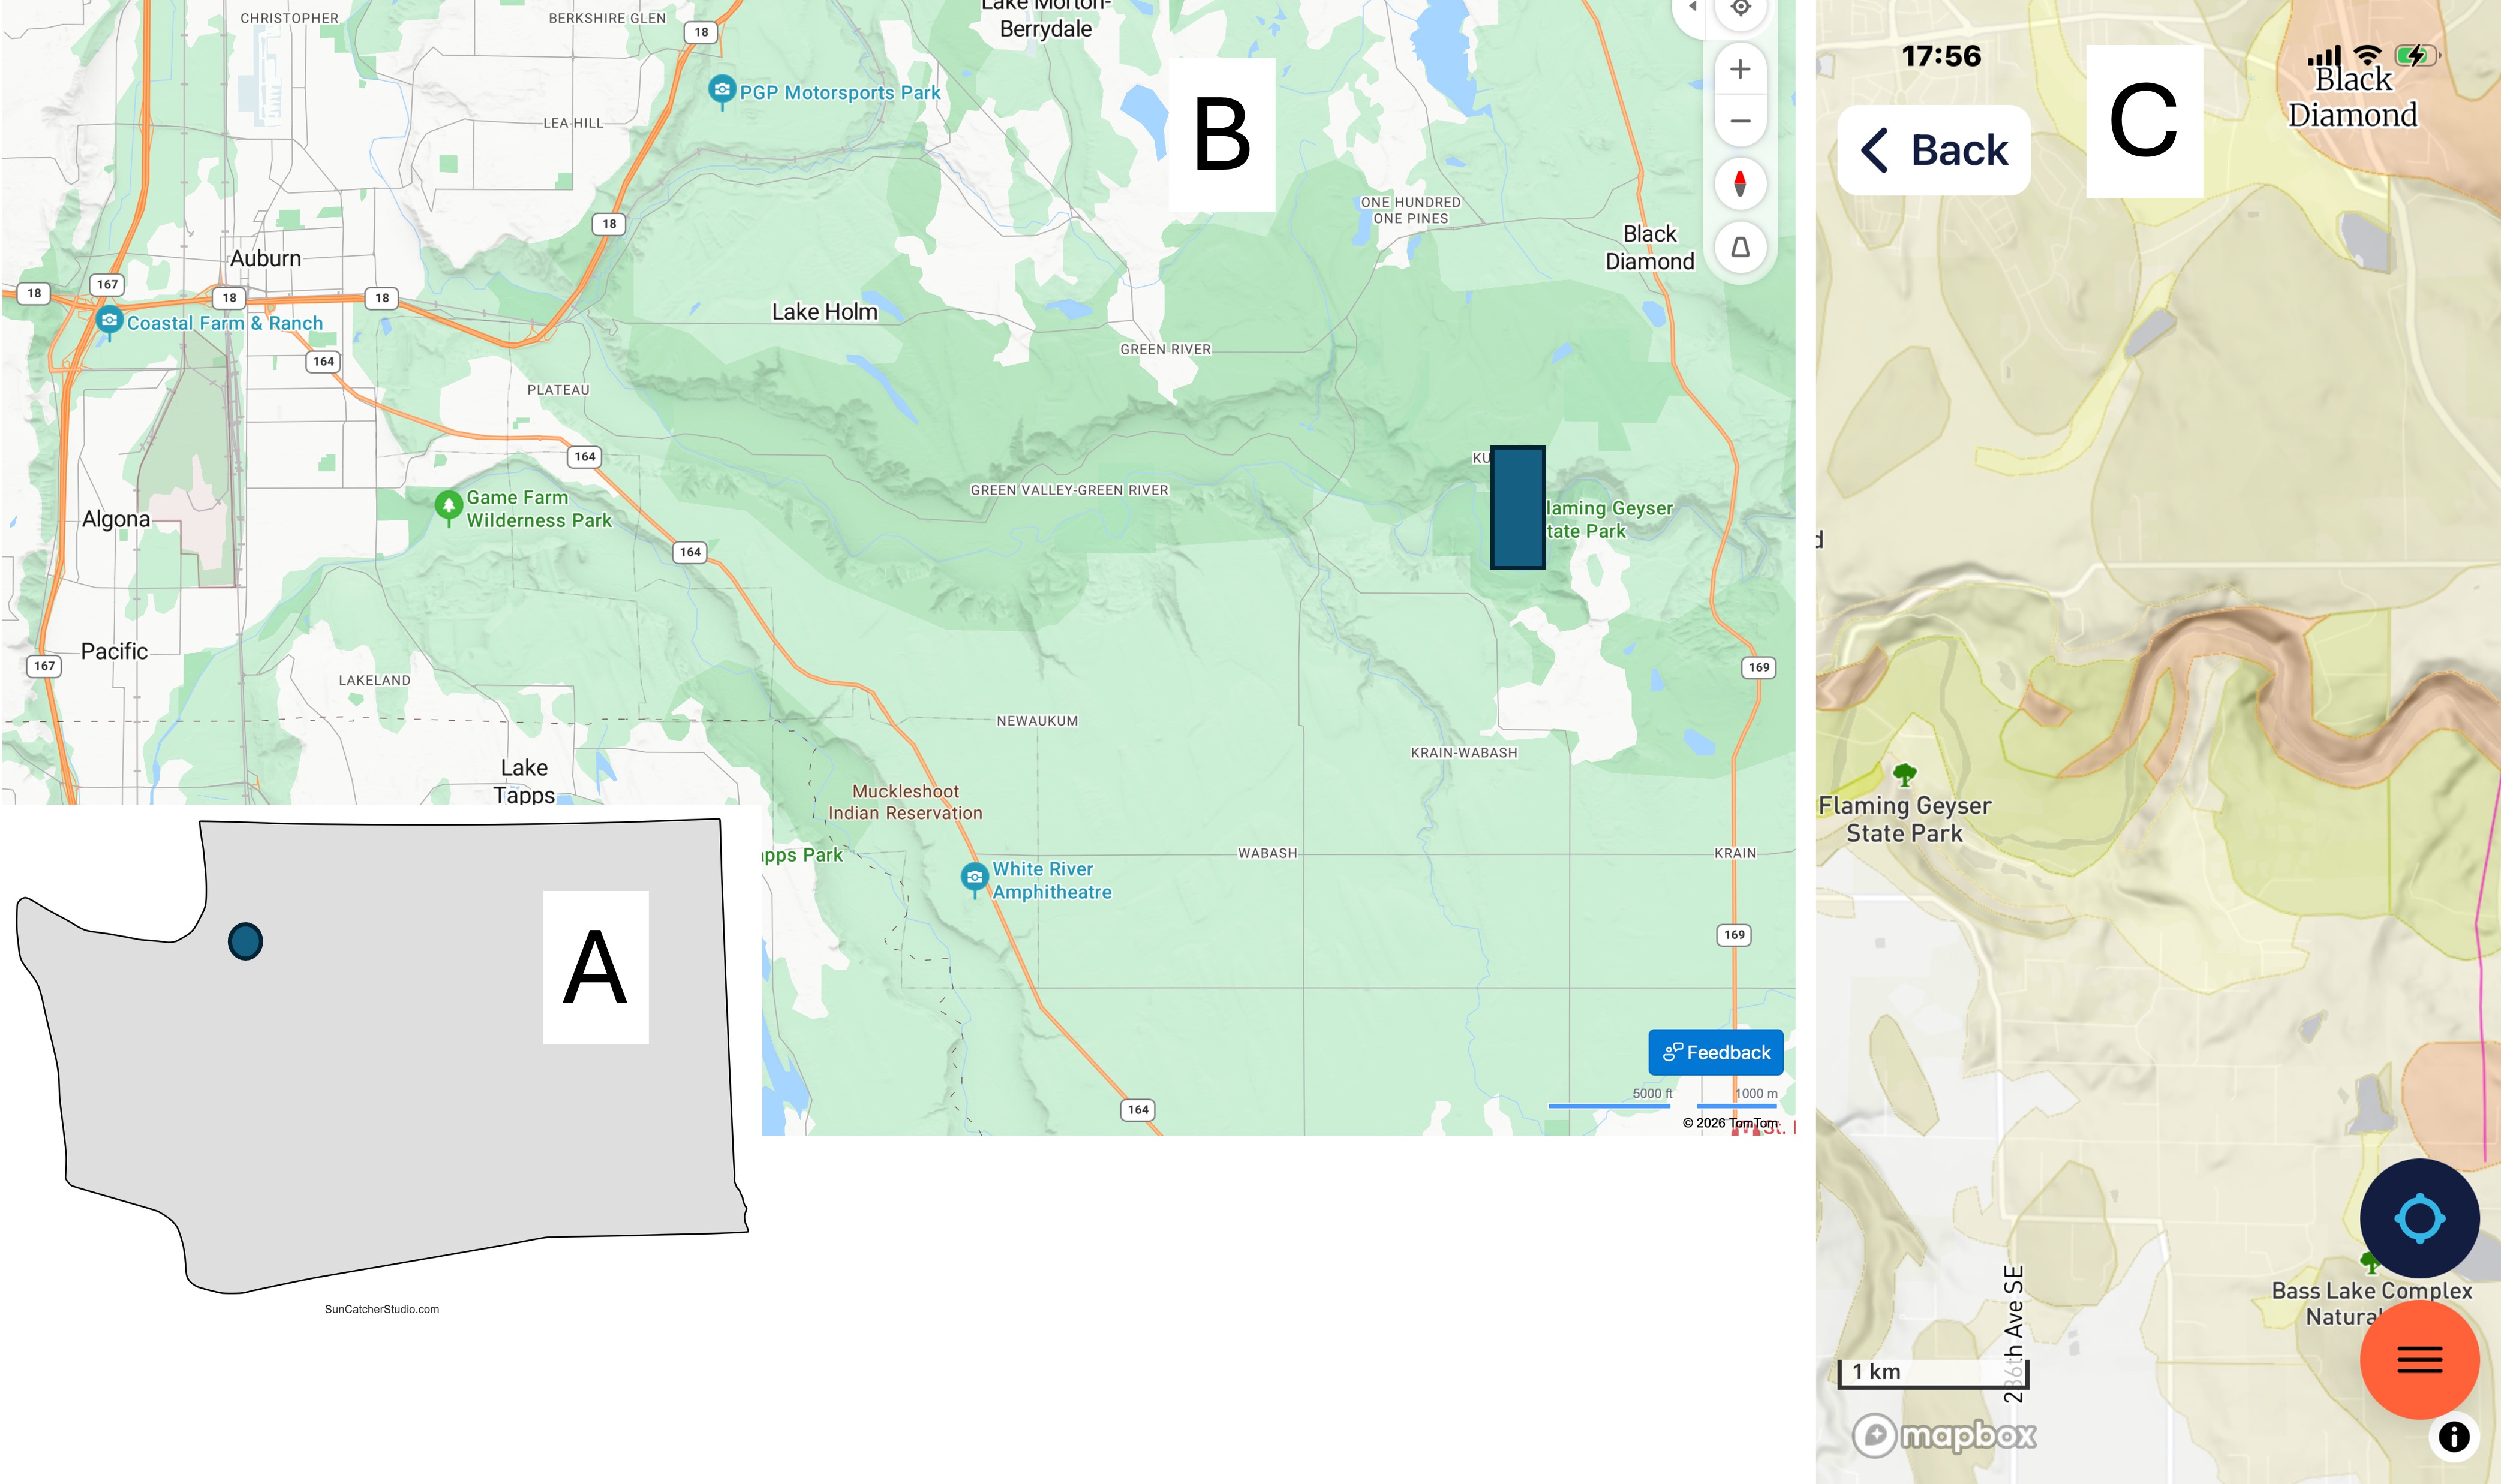
Figure 2. (A) Location of the study area SE of Tacoma in the foothills of the Cascade Range. (B) Green River has eroded a valley in the glacial till and bedrock along its path. The northern margin is steeper throughout its length. Flaming Geyser State Park is located upstream of the arable land, where the river becomes rocky and the valley narrows to a gorge. (C) The geologic map from Rock D reveals Eocene (56-33.9 Ma) continental sedimentary rocks along the stream bed whereas further north, Vashon till of Pleistocene age (2.58Ma – 11.7 Ka) covers the region in a thinning-eastward blanket. Just south of the river itself, Quaternary (2.58 Ma – Recent) fluvial and alluvial sediments have accumulated.
To the extreme east side of (C), a fault line can be seen running N-S. Faults are common, but often difficult to identify, within the region because the Cascades are the result of oceanic-crust subduction beneath the North American tectonic plate.
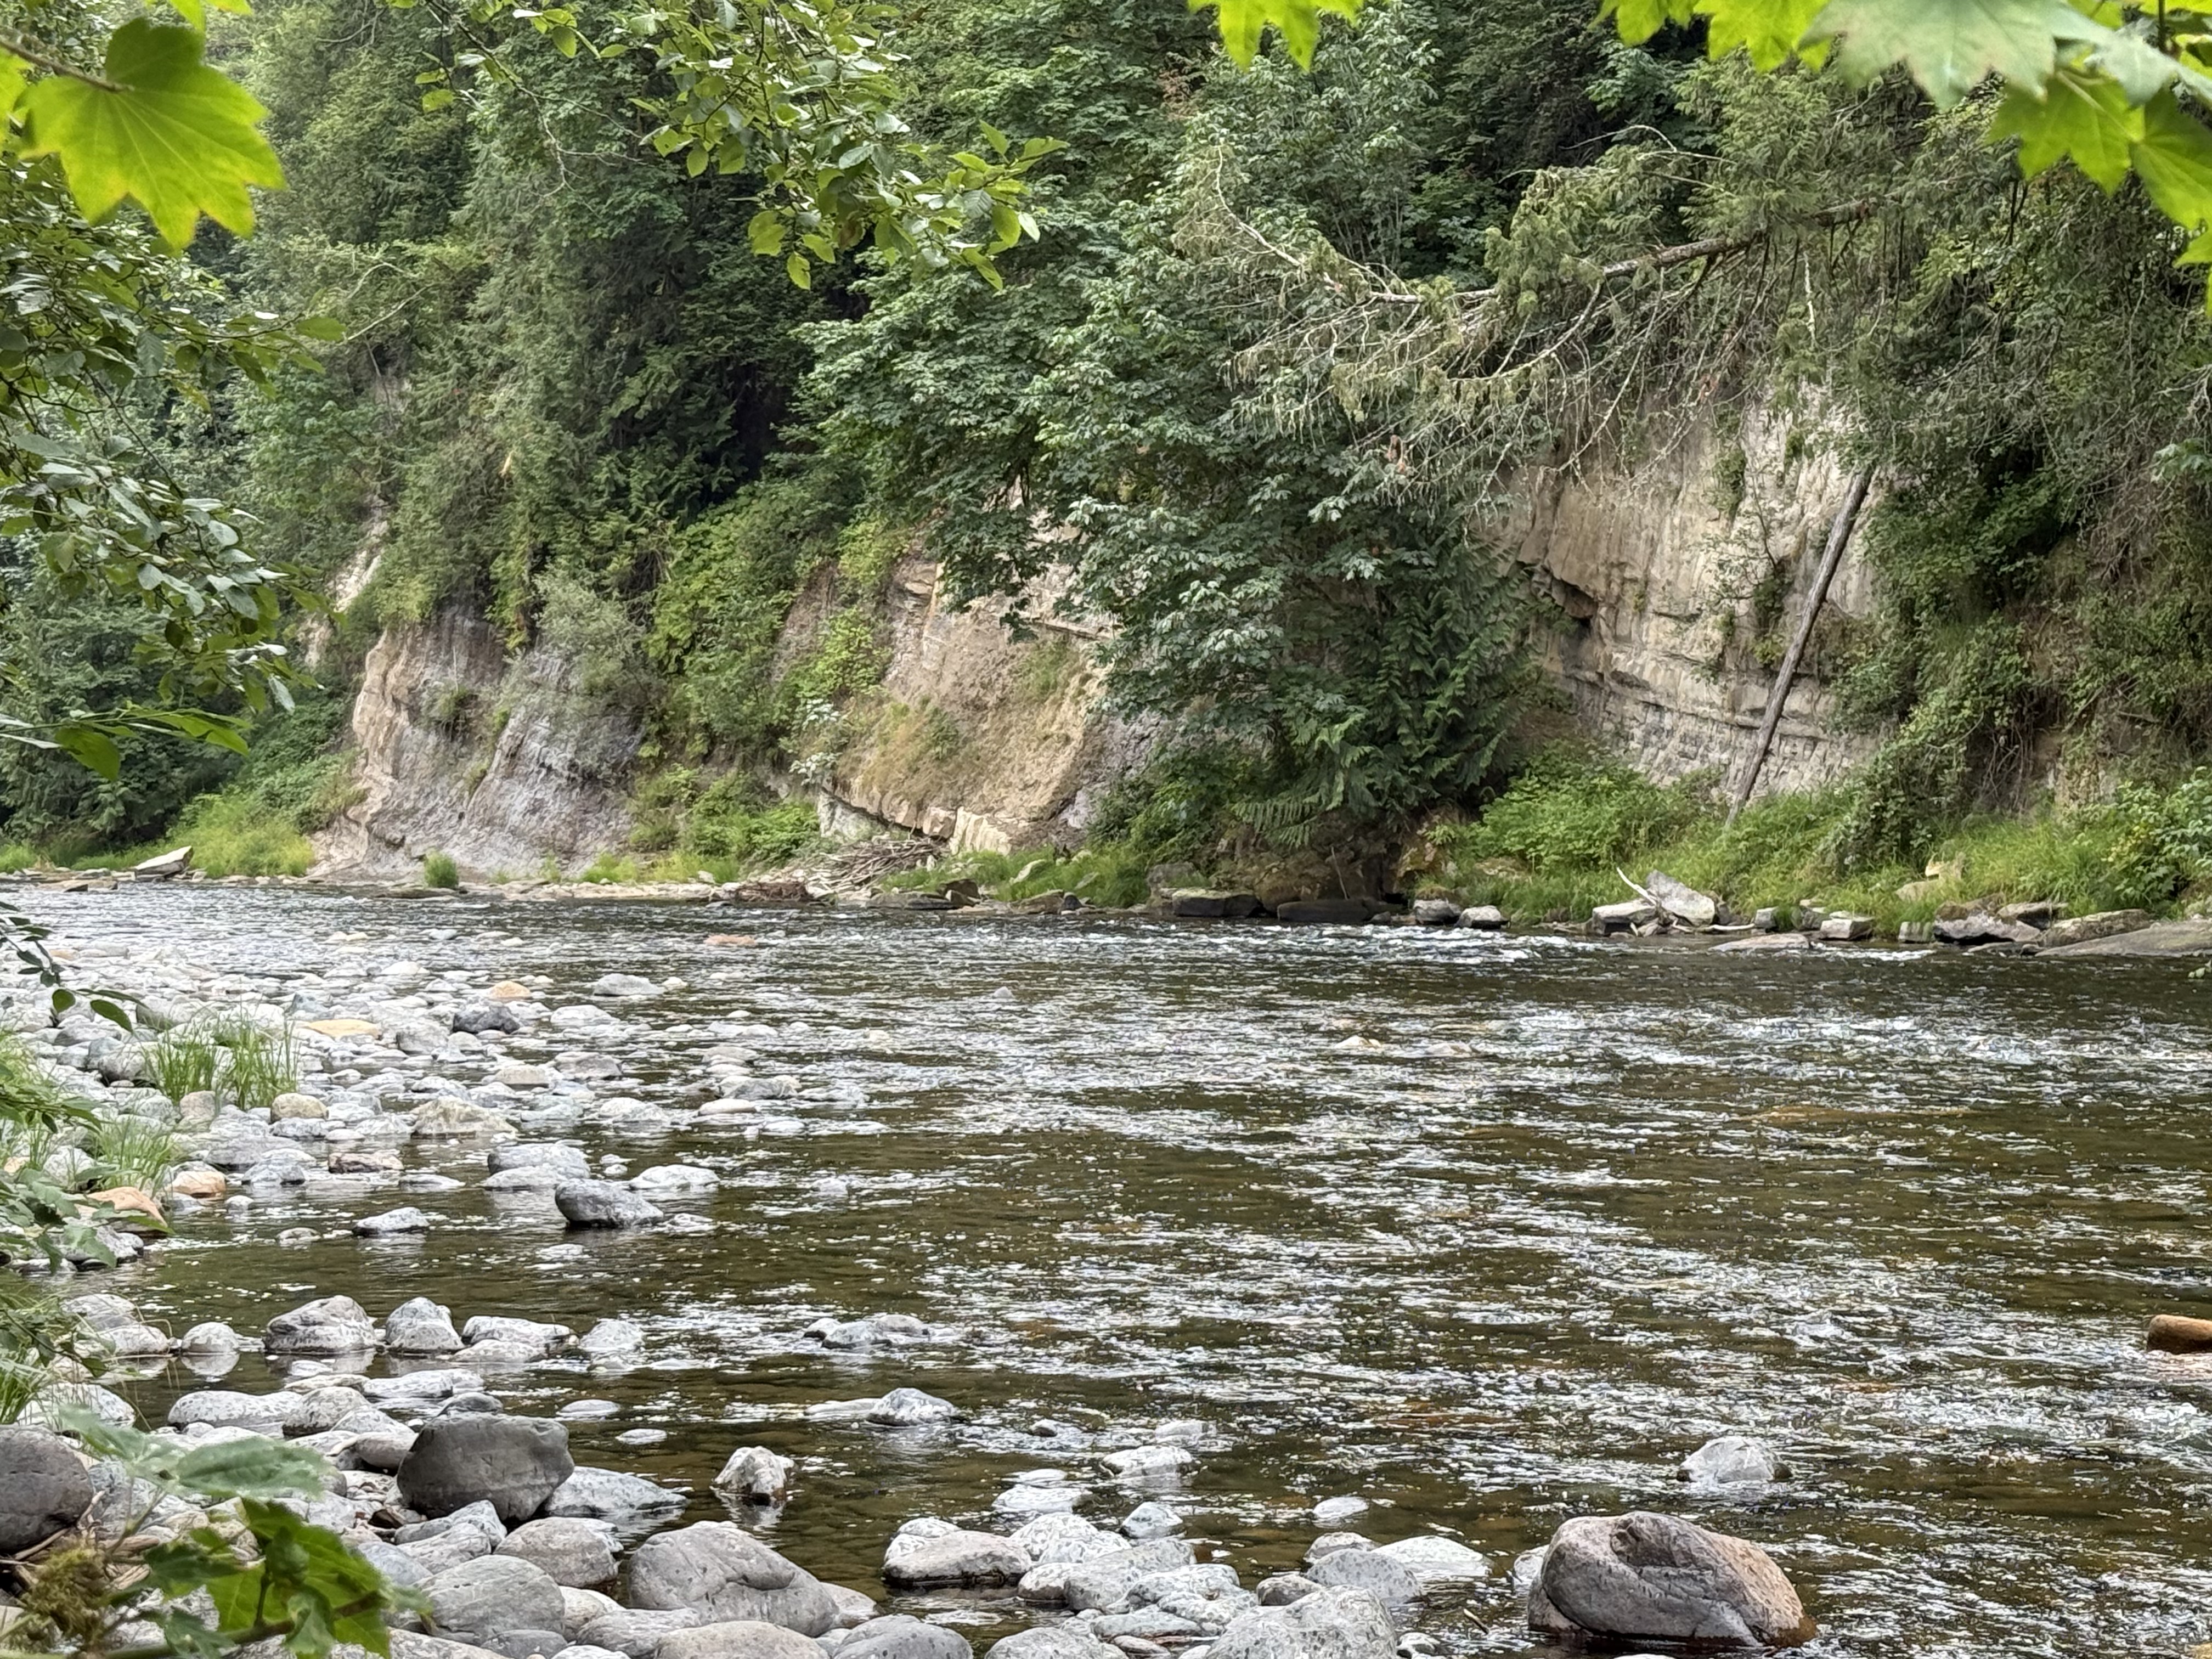
Figure 3. These layers of Eocene terrestrial sedimentary rocks have been tilted eastward (to the right), towards the fault seen in Fig. 2C, suggesting that it is a normal fault; however, their beds aren’t quite continuous, suggesting some slippage between them. The patches of foliage separating them may indicate minor faults, where the rock is ground into fine material suitable for plants to thrive. For example, the leftmost exposure is similar in stratification to the middle strata of the center exposure; the rightmost exposure doesn’t seem to be continuous with either, except for the thin, resistant bed immediately below the cliff on the right, and a similar “marker” bed a few feet lower in the middle exposure.
Following a horizontal line between them, the rocks are younger to the left, but not by much–possibly a few thousand years. This brittle deformation would have occurred a few miles within the surface when the faults were active; unfortunately, faults cannot be dated with precision.
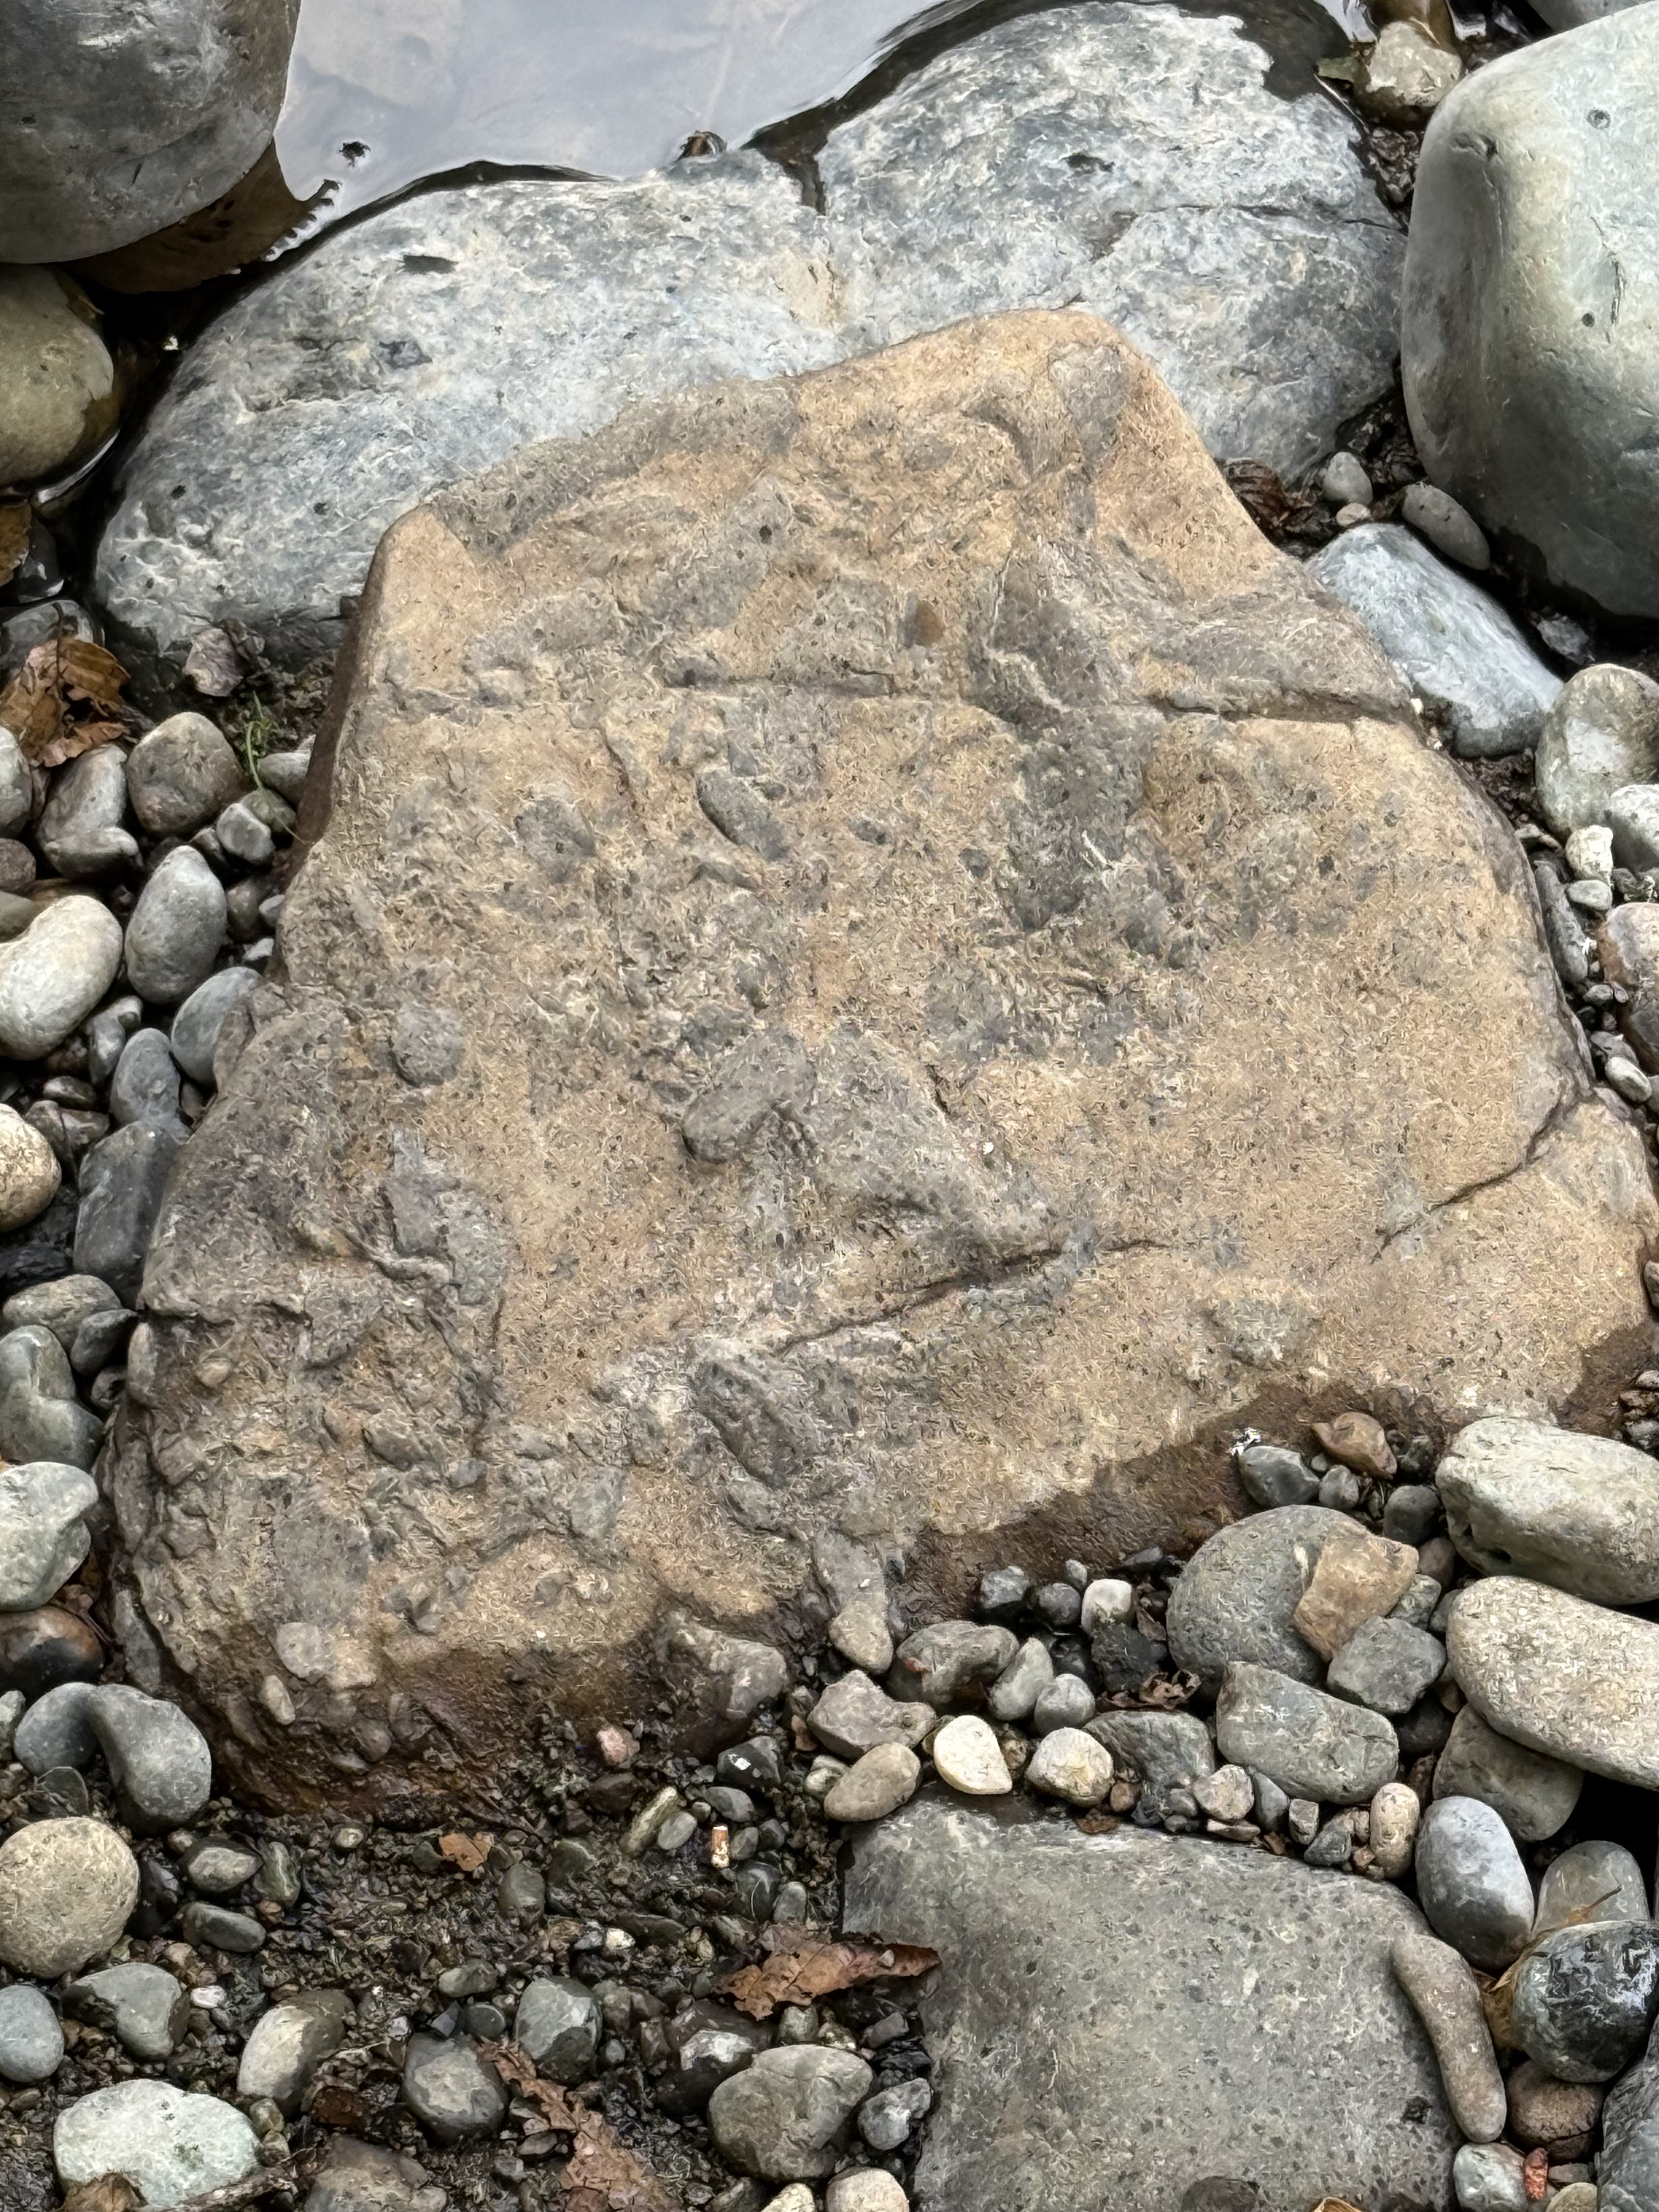
Figure 4. This is an interesting sample, which required some thinking, and a conversation with ChatGPT, to arrive at the most plausible explanation for the irregular blobs of darker material protruding from a reddish matrix. I’m pretty sure this texture arose from mingling of magmas with different compositions: the reddish one is andesite, and the darker material is something closer to basalt (there is a spectrum of chemical compositions); they were incompatible, but the magma wasn’t hot enough to totally incorporate the more basaltic material into the andesite.
We are seeing magmatic mixing processes frozen in time here.
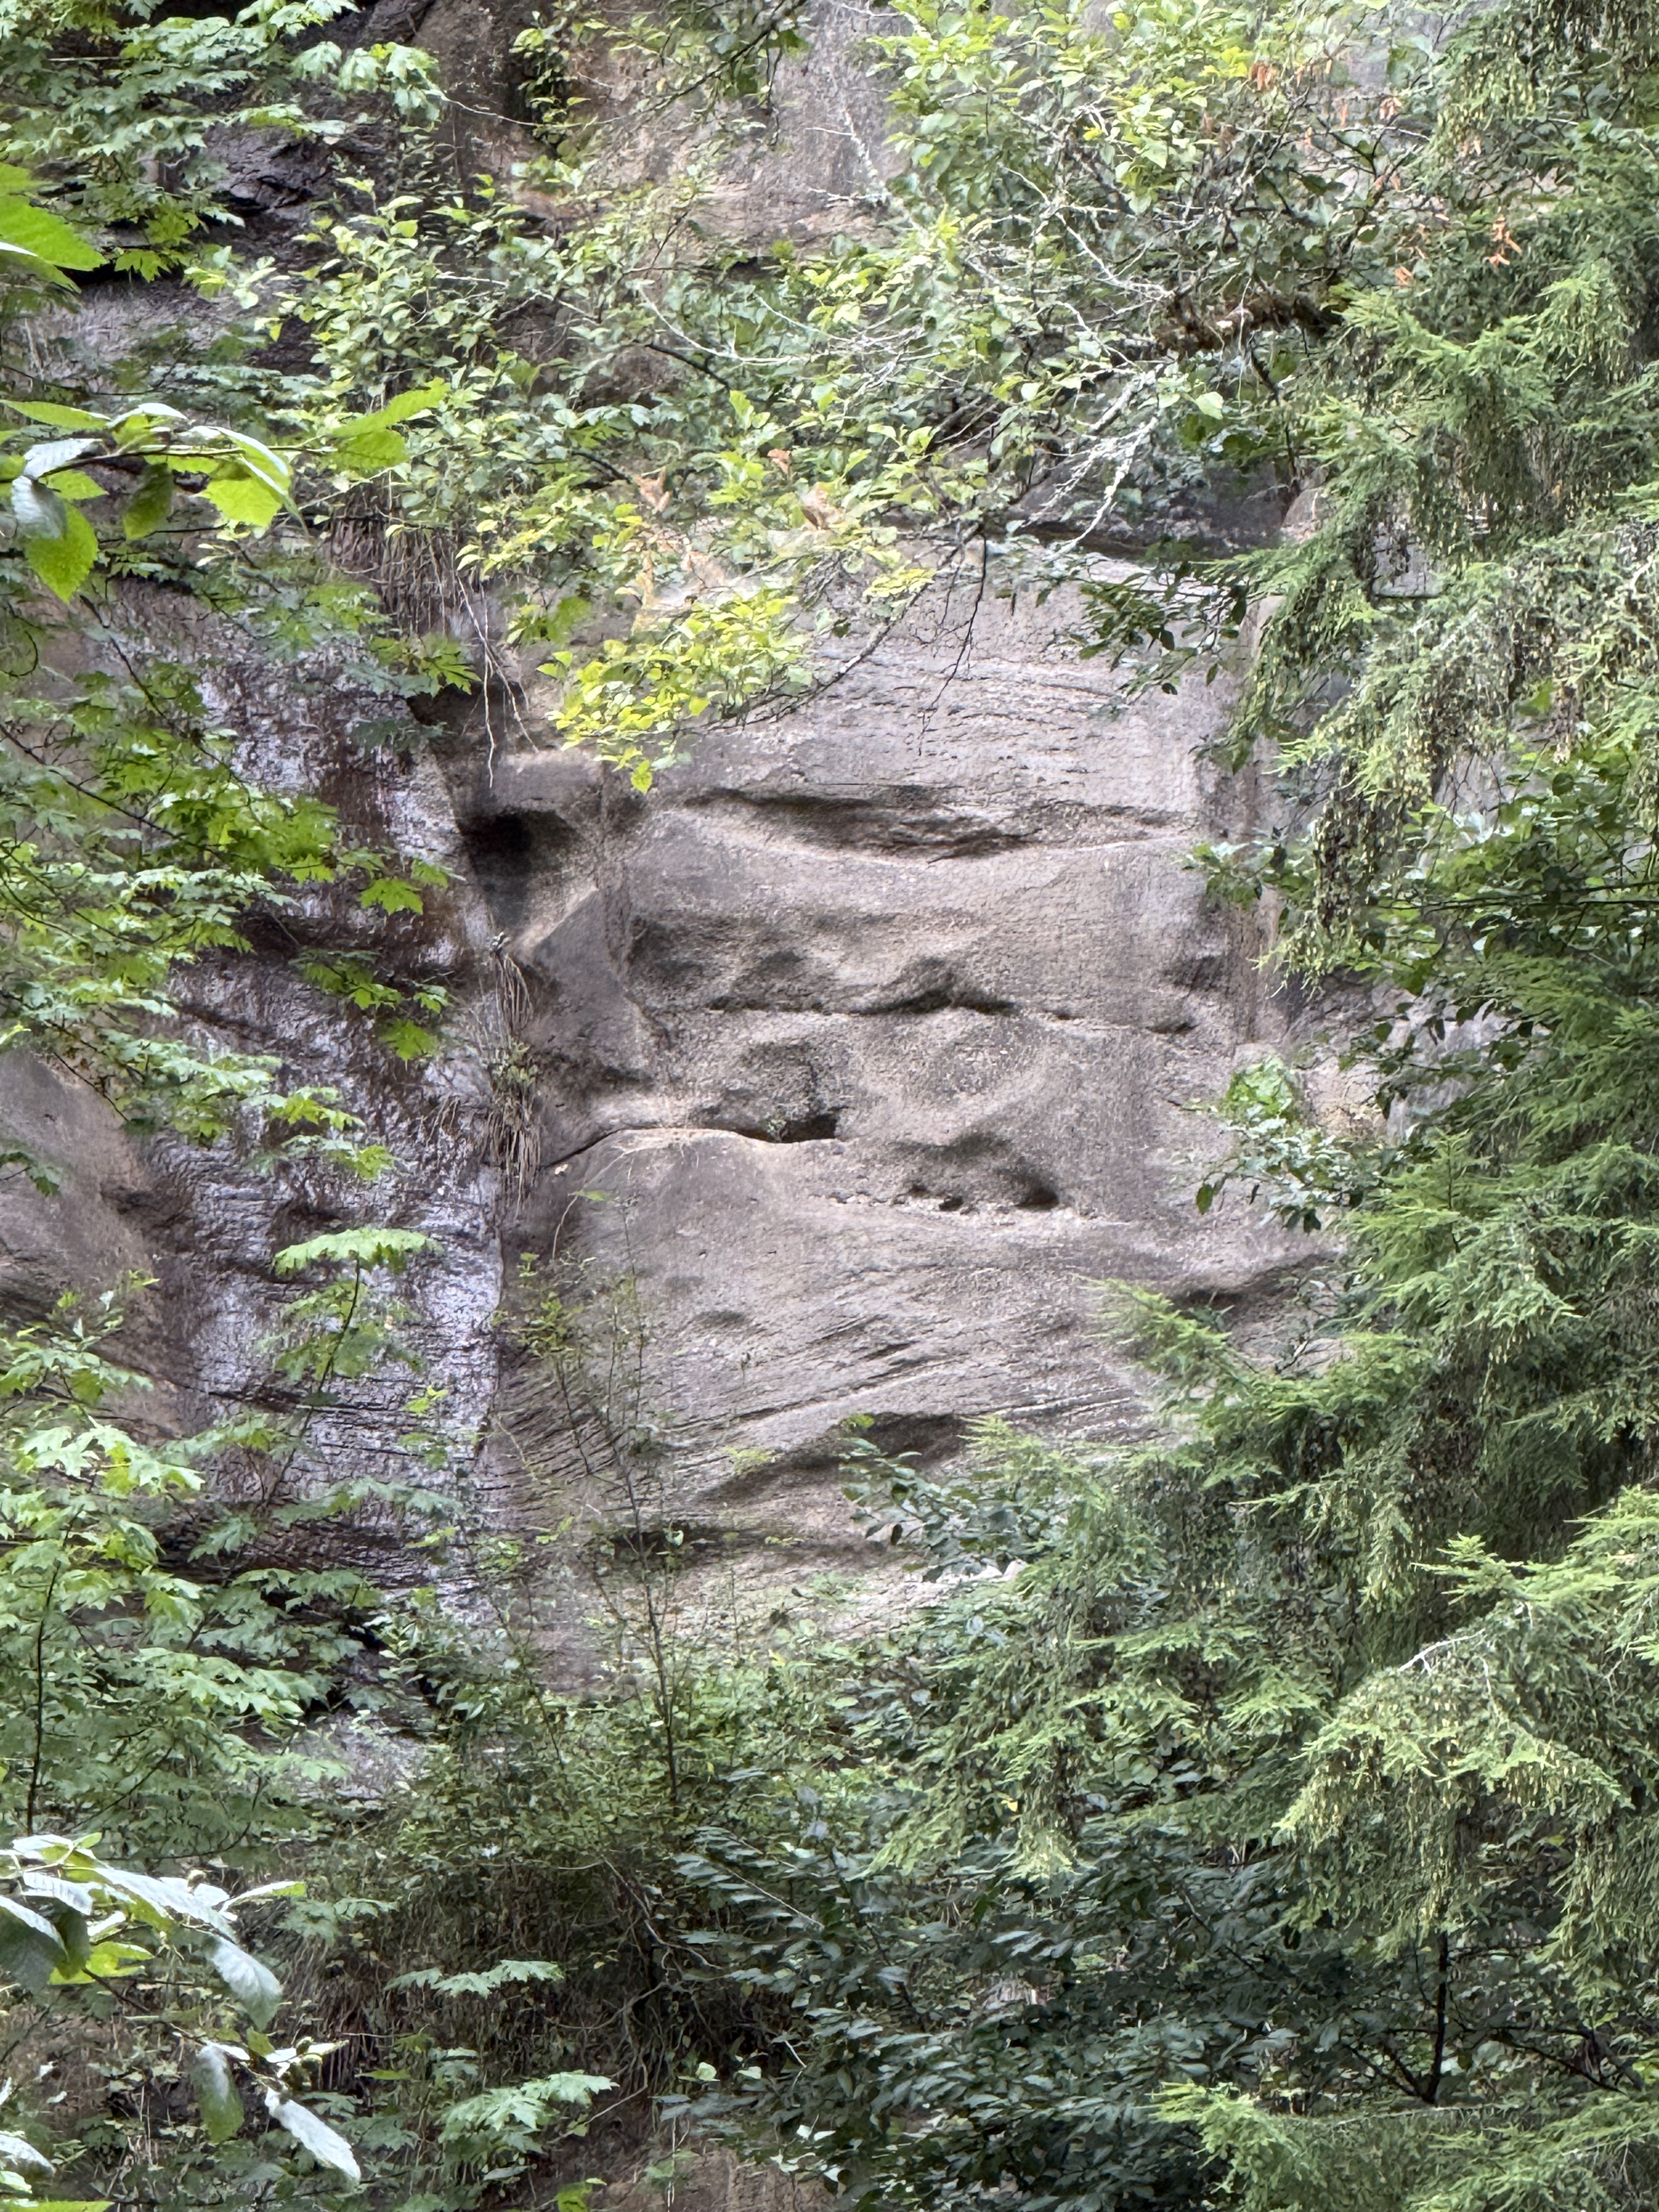
Figure 5. This photo reveals a cliff of Eocene sedimentary rocks across the river, probably 100 yards distant. I zoomed in to reveal the bedding. I estimate the height of the gray rock visible through the foliage to be at least thirty feet. The lower section contains two sets of cross-bedding, separated by an erosional surface, brought into relief by differential weathering. These large bed forms were created by water, probably in braided rivers or high-energy channels. The flow was to the left, westward in general.
This environment persisted for a long time although these rocks can’t be dated (no fossils or organic material); if we assume either a deposition rate of 1/8 inch per year (that’s a lot of sand), or a subsidence rate of similar magnitude (to make room for this stack of sand), we can estimate how long it took for 30 feet of sand dunes to accumulate. When we do the math, we see that this section could have been created in about 3000 years. This calculation is for illustration only. We don’t know the actual sedimentation rate here during the Eocene, nor do we know the amount of erosion.
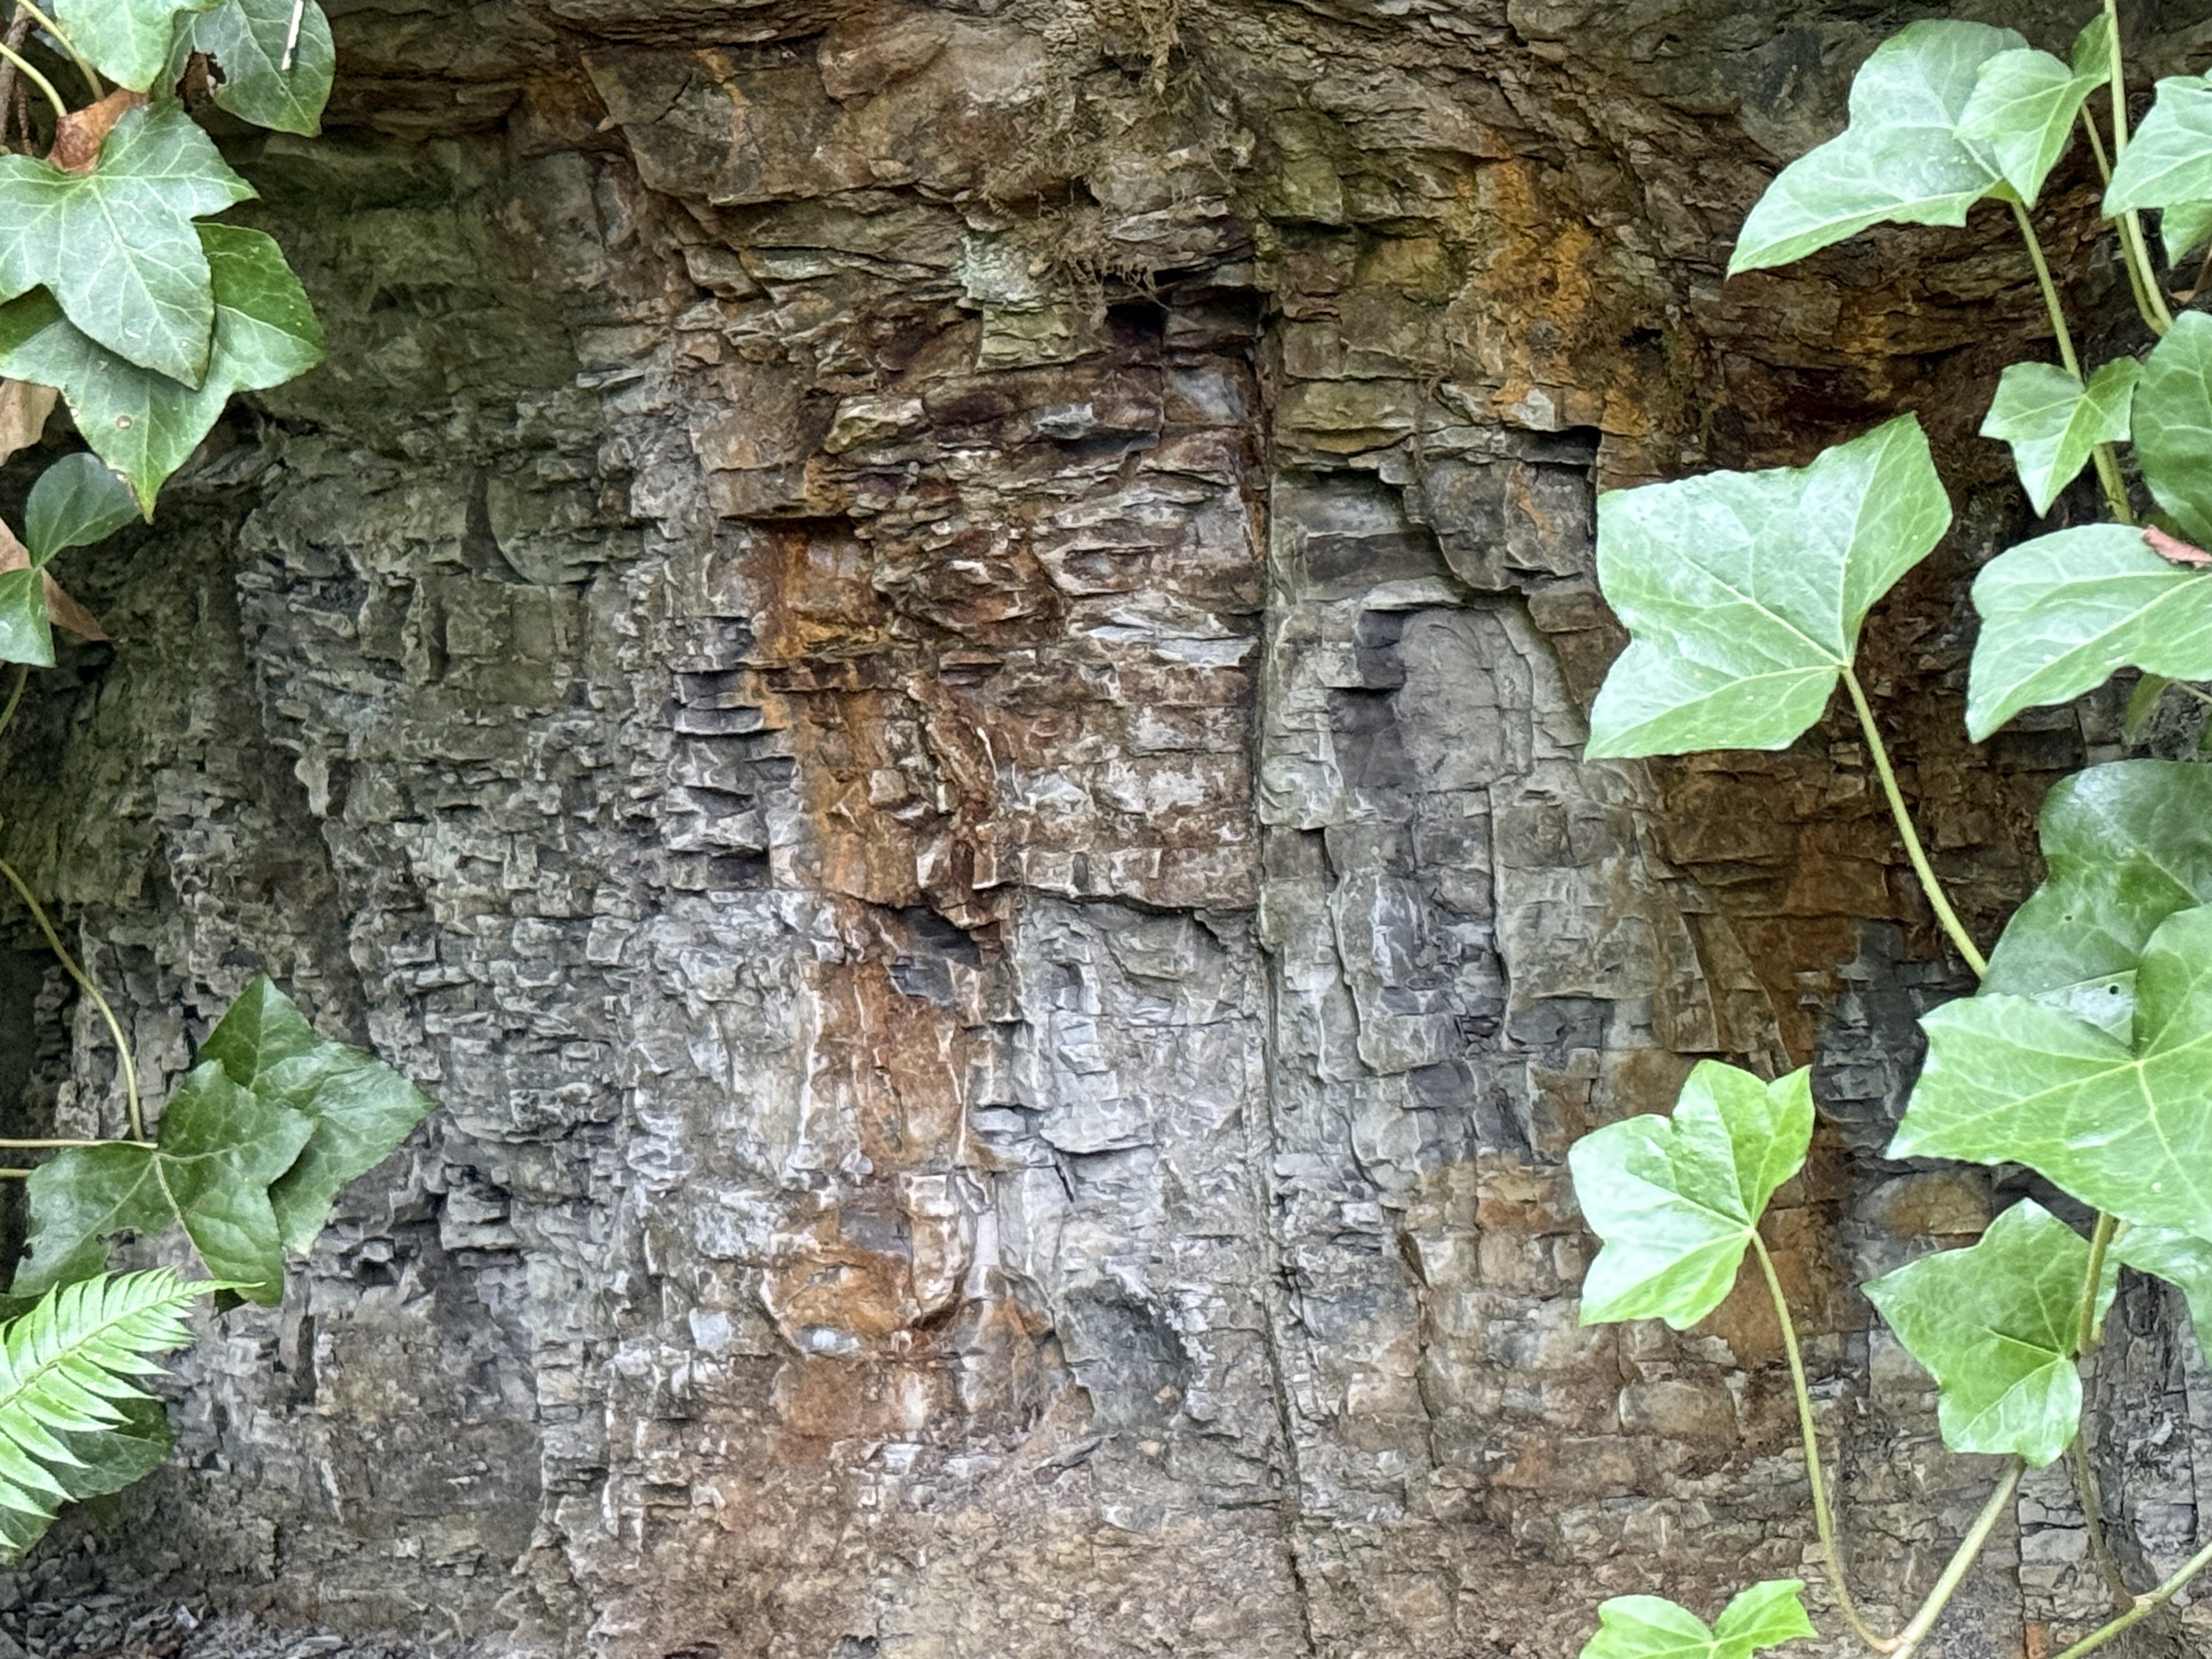
Figure 6. This photo from the south side of Green River shows some highly fractured rock beneath a stronger layer that forms a one-foot overhang. The overlying rock is staining the subjacent layers with a rust-colored material, probably from weathering of iron-containing minerals. Are these beds equivalent to those from Fig. 3?
I don’t know the answer, but the contact revealed in this photo is similar to that between the massive, cliff-forming rock from the rightmost exposure in Fig. 3, and the lower, gray layers. I wouldn’t be surprised if this rock is similar in age and environment as the gray rocks across the river.
Final Thoughts
Sometime, more than thirty-million years ago, large rivers drained the Cascades, depositing vast quantities of sand in braided rivers many miles from the coast, where finer sands and silt slid down submarine canyons and fans to be deposited as turbidites. I talked about those rocks in a previous post. Comparison of these rocks and those along the Olympic Peninsula coast allow us to reconstruct this small part of the world from a bygone age.
These Eocene sediments are similar to those we discovered a few miles to the south, along the Carbon River. This sedimentary environment wasn’t a local event, but rather part of a regional system that continuously removed the volcanoes and older rocks that were exposed by the upward pressure of the Pacific Ocean’s subducting slab. This was not an intermediate environment.
The wide range in dates for these rocks doesn’t allow geologists to be more specific than a few million years, but the earth doesn’t act very quickly, especially when the subduction zone that determines the geology of the PNW has been active for almost 200 million years.
We can afford uncertainties of a few tens of millions of years…
The Flora of Carbon River, Pierce County, Washington
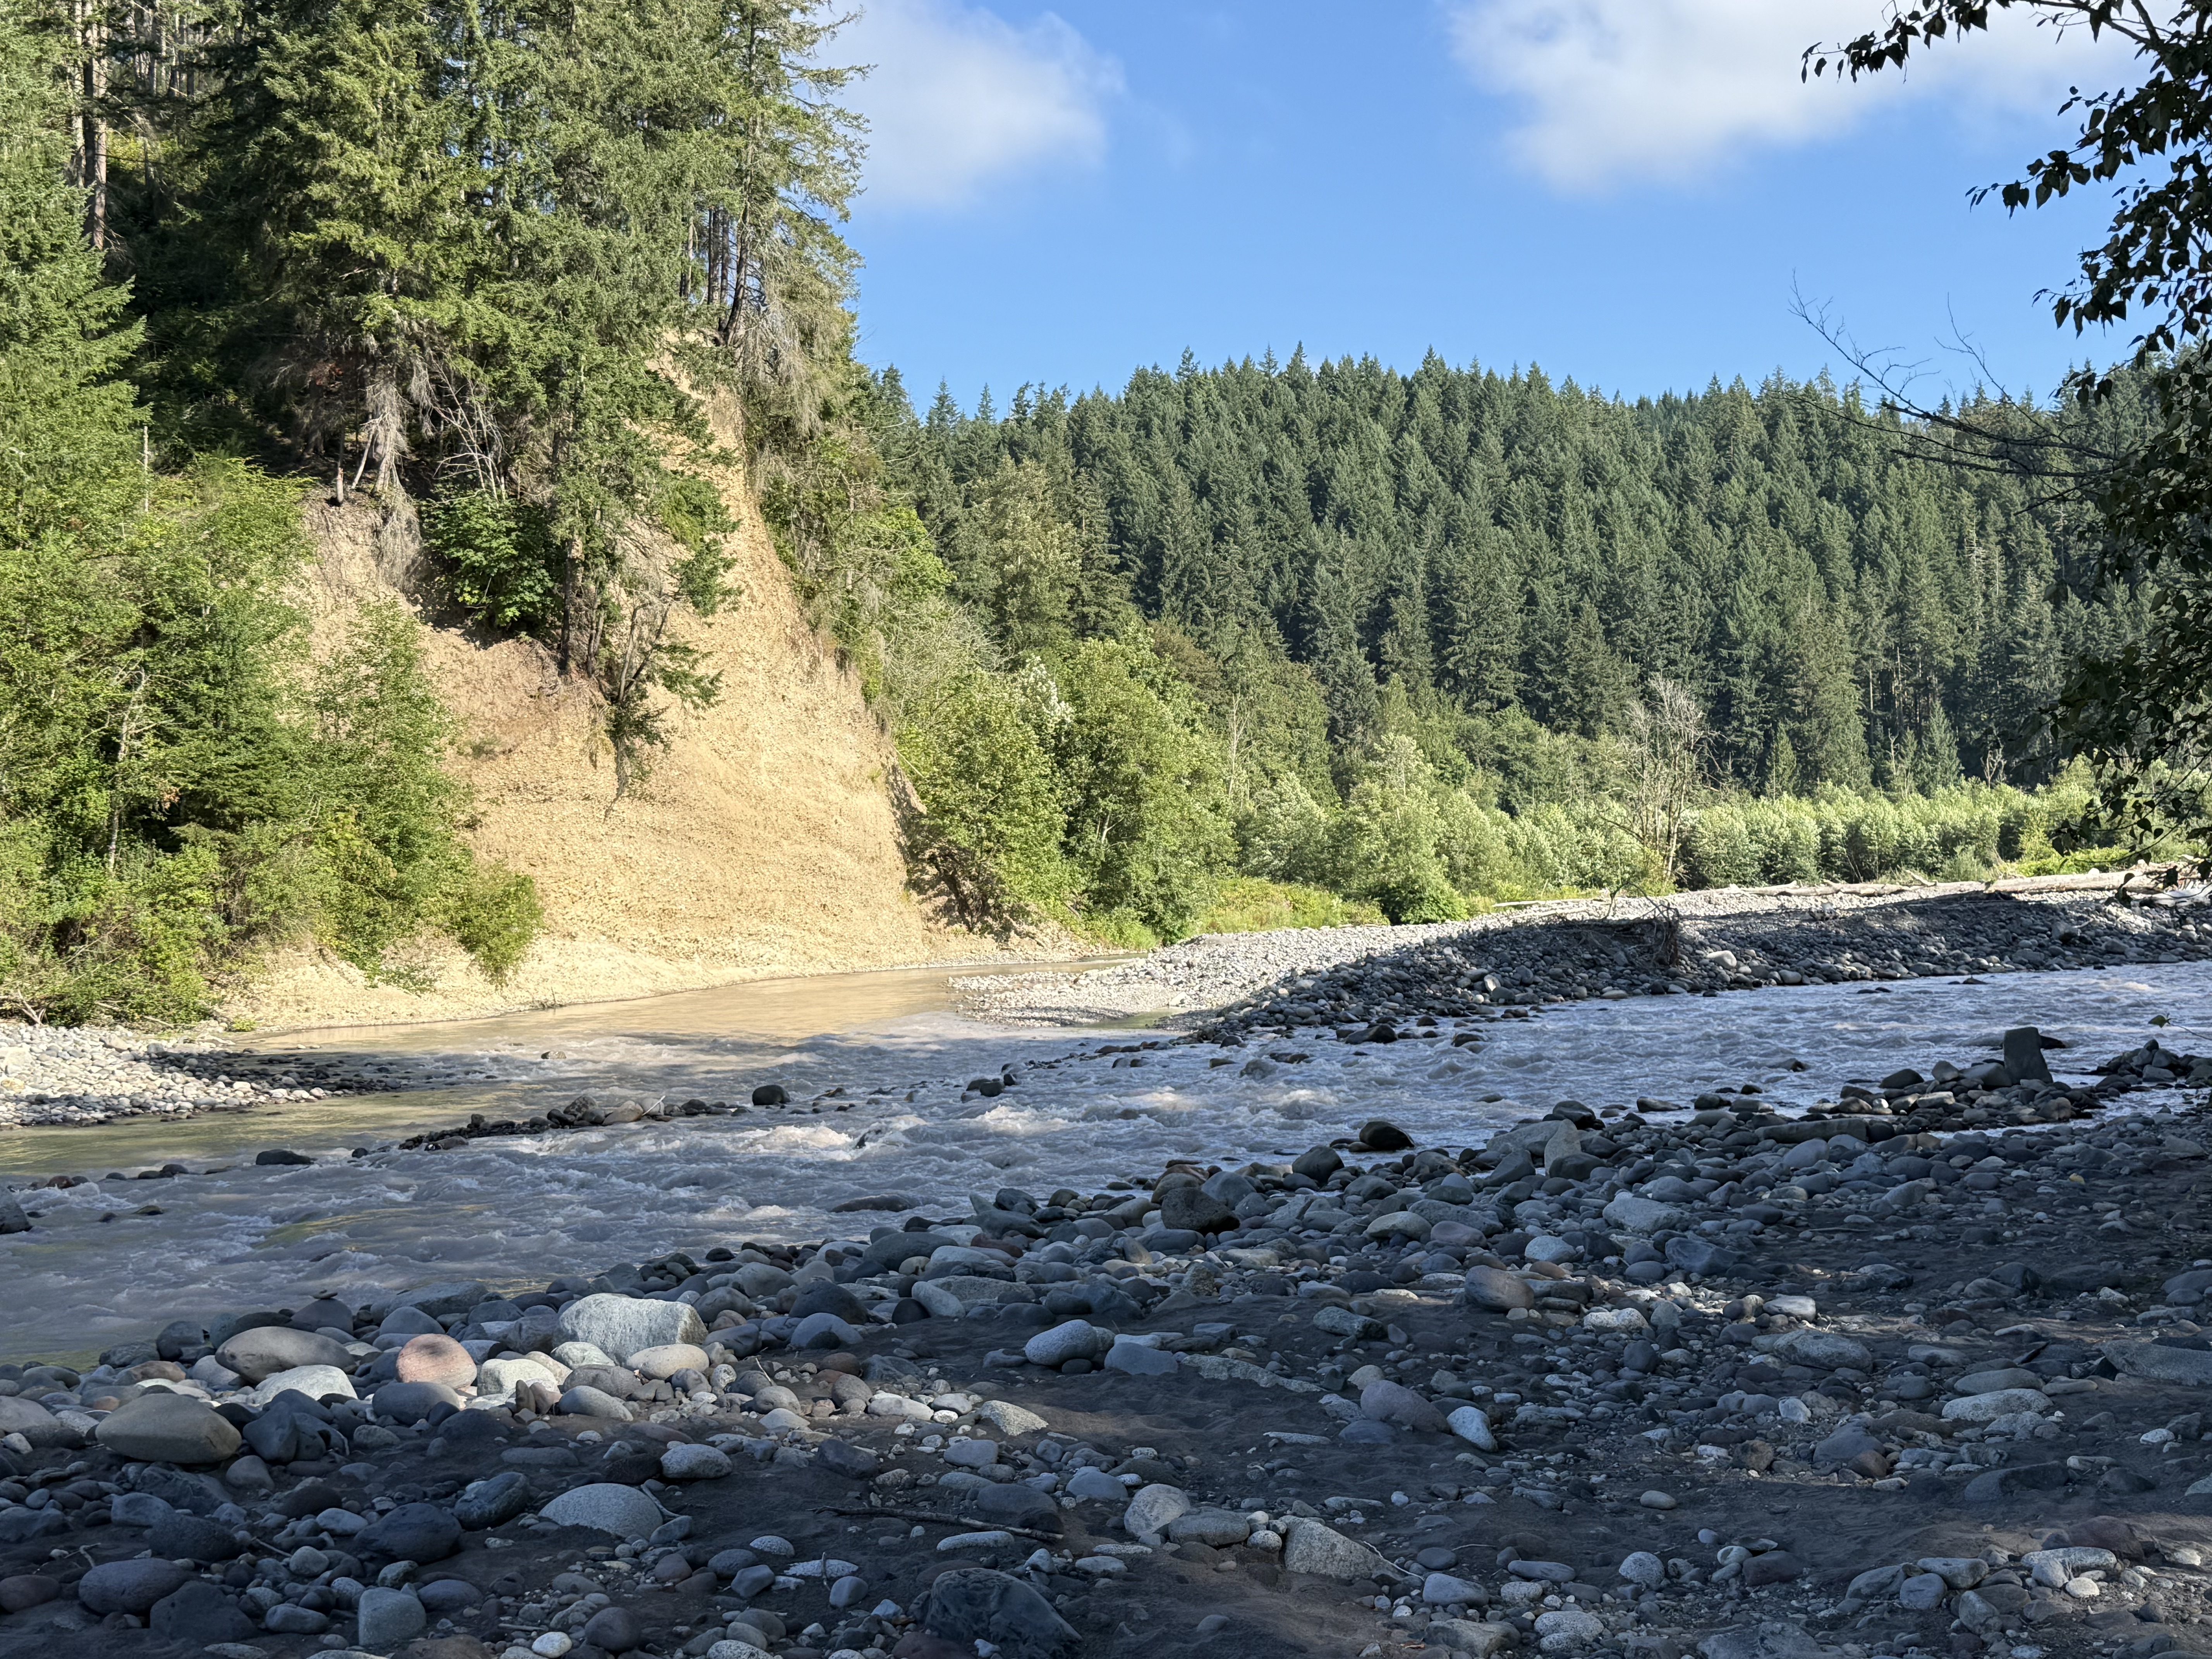
Plate 1. Our first stop was at Carbonado, where the Carbon River exits the canyon that has constrained it from its origin on Mt. Rainier. It immediately forms multiple channels as it cuts through glacial till on its circuitous path to Commencement Bay.
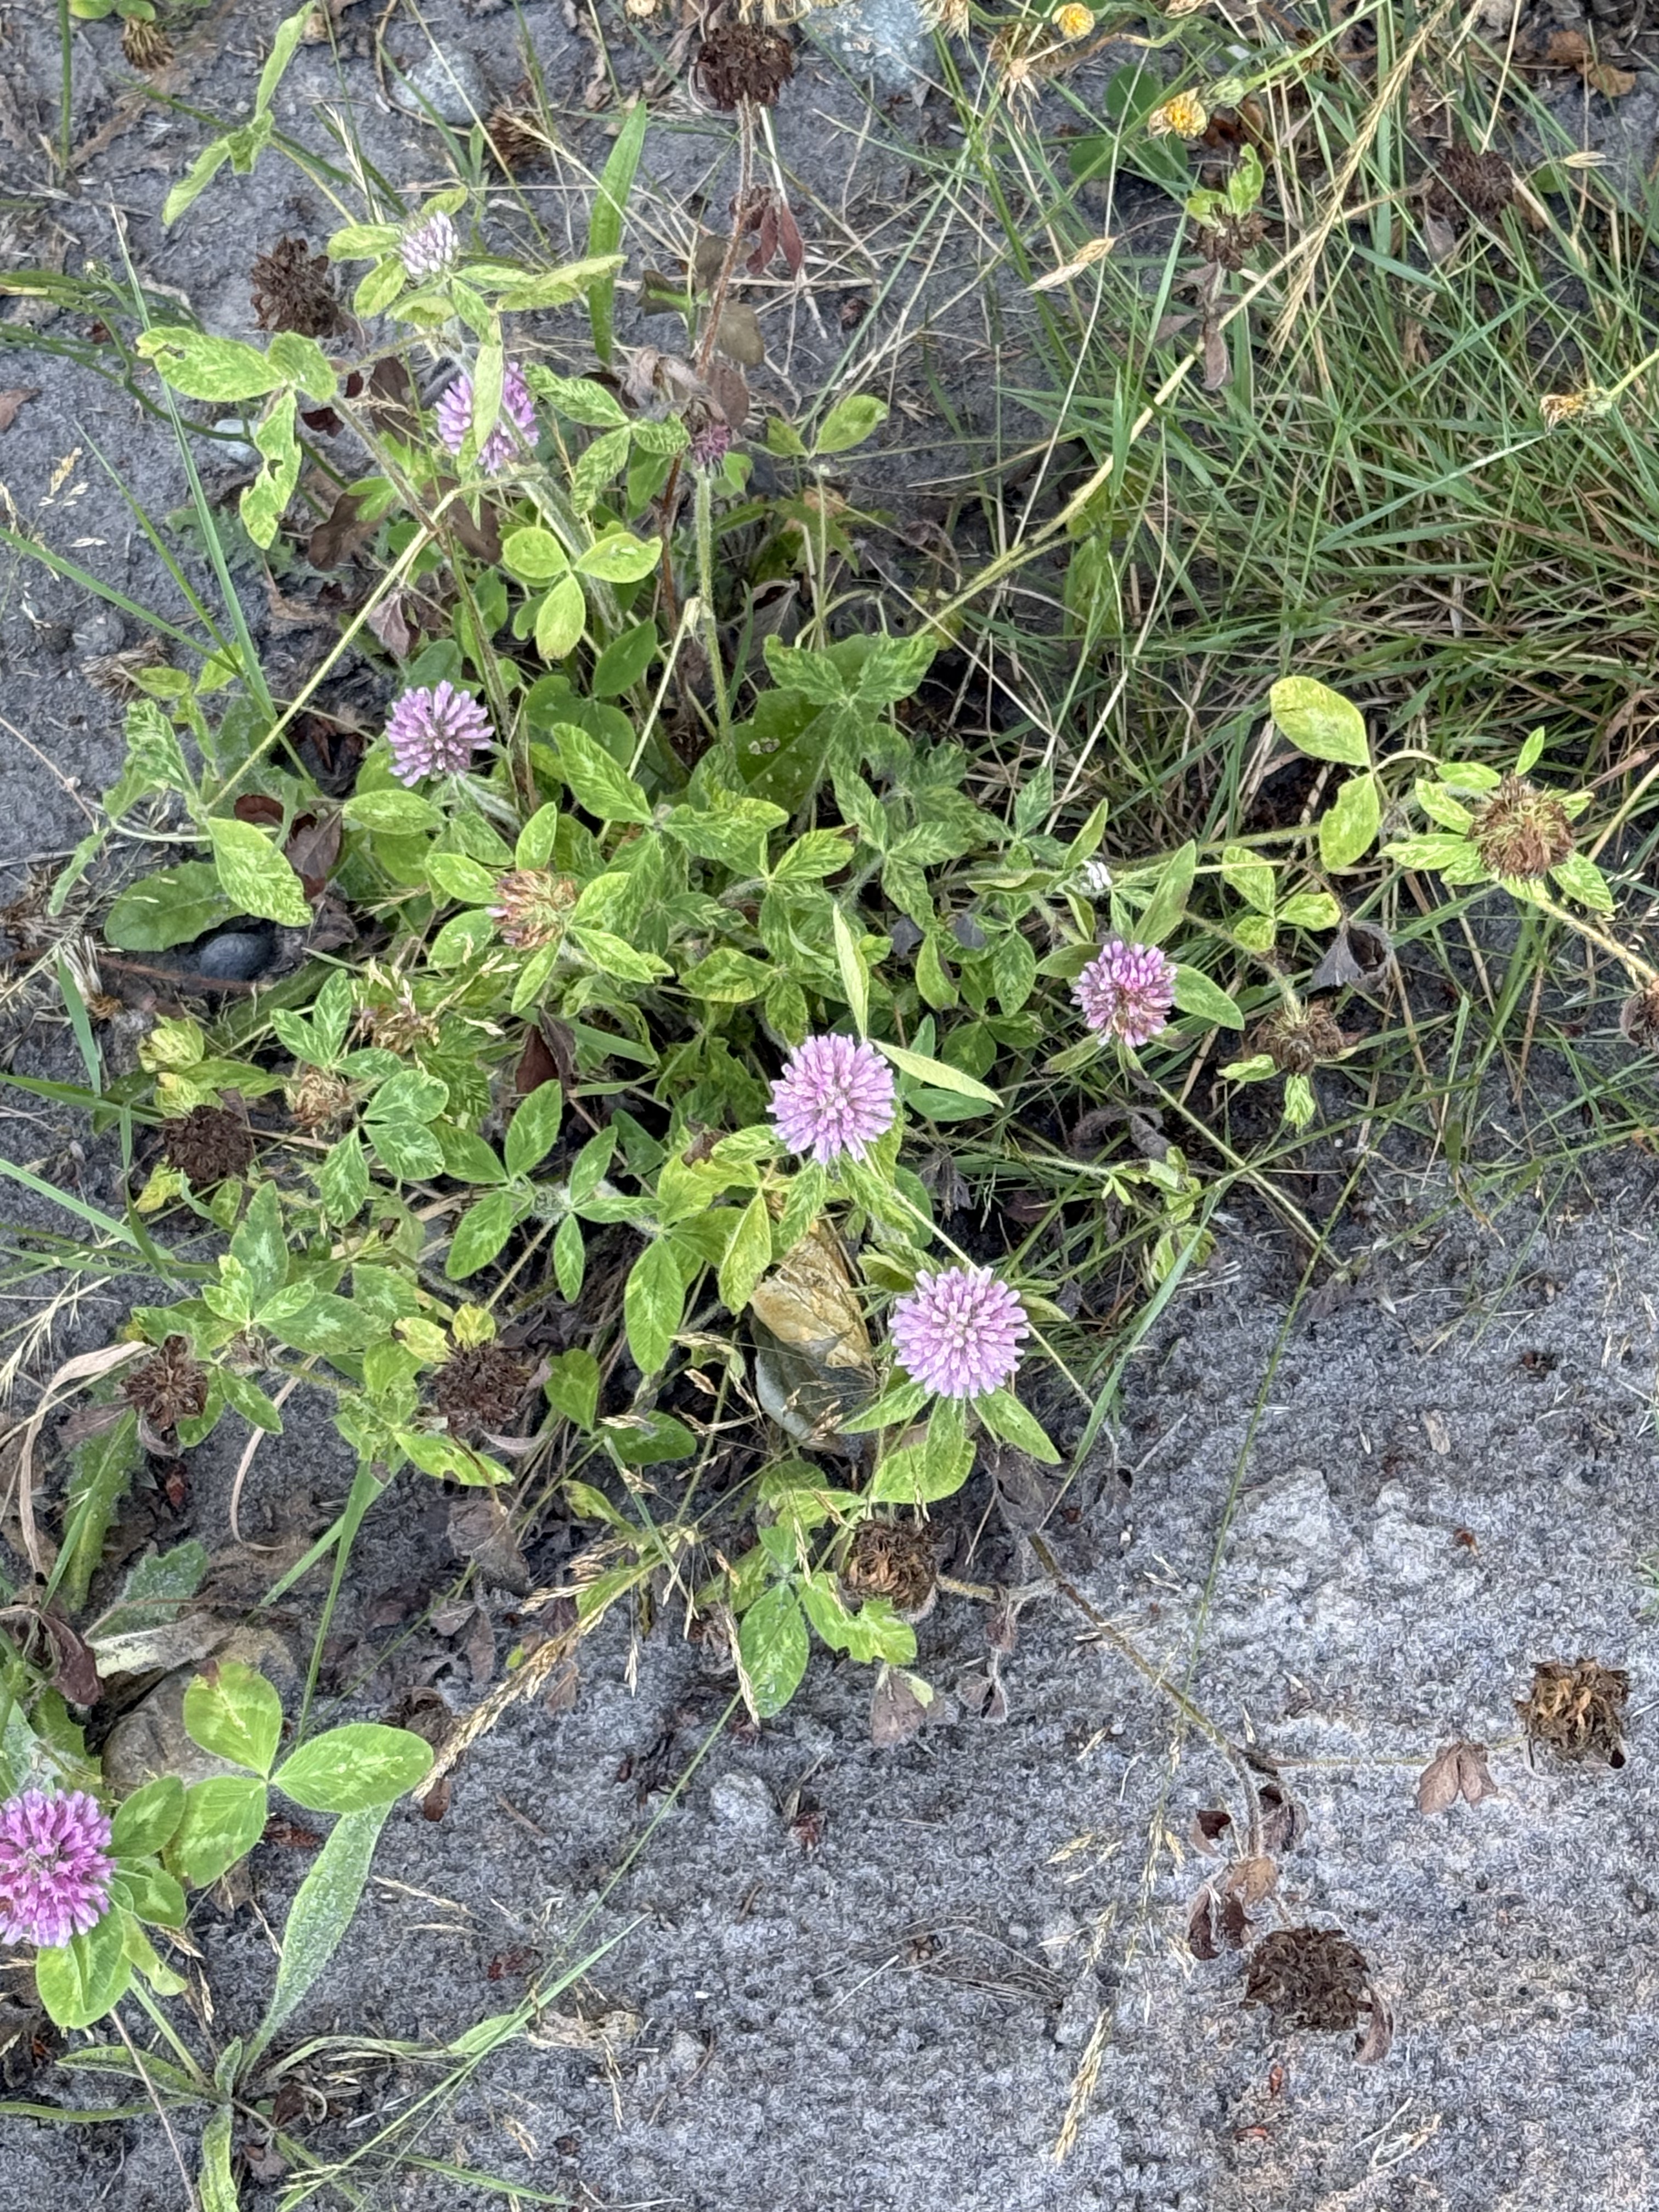
Plate 2. This lovely flower is red clover (Trifolium pratense), a common wildflower along rivers.
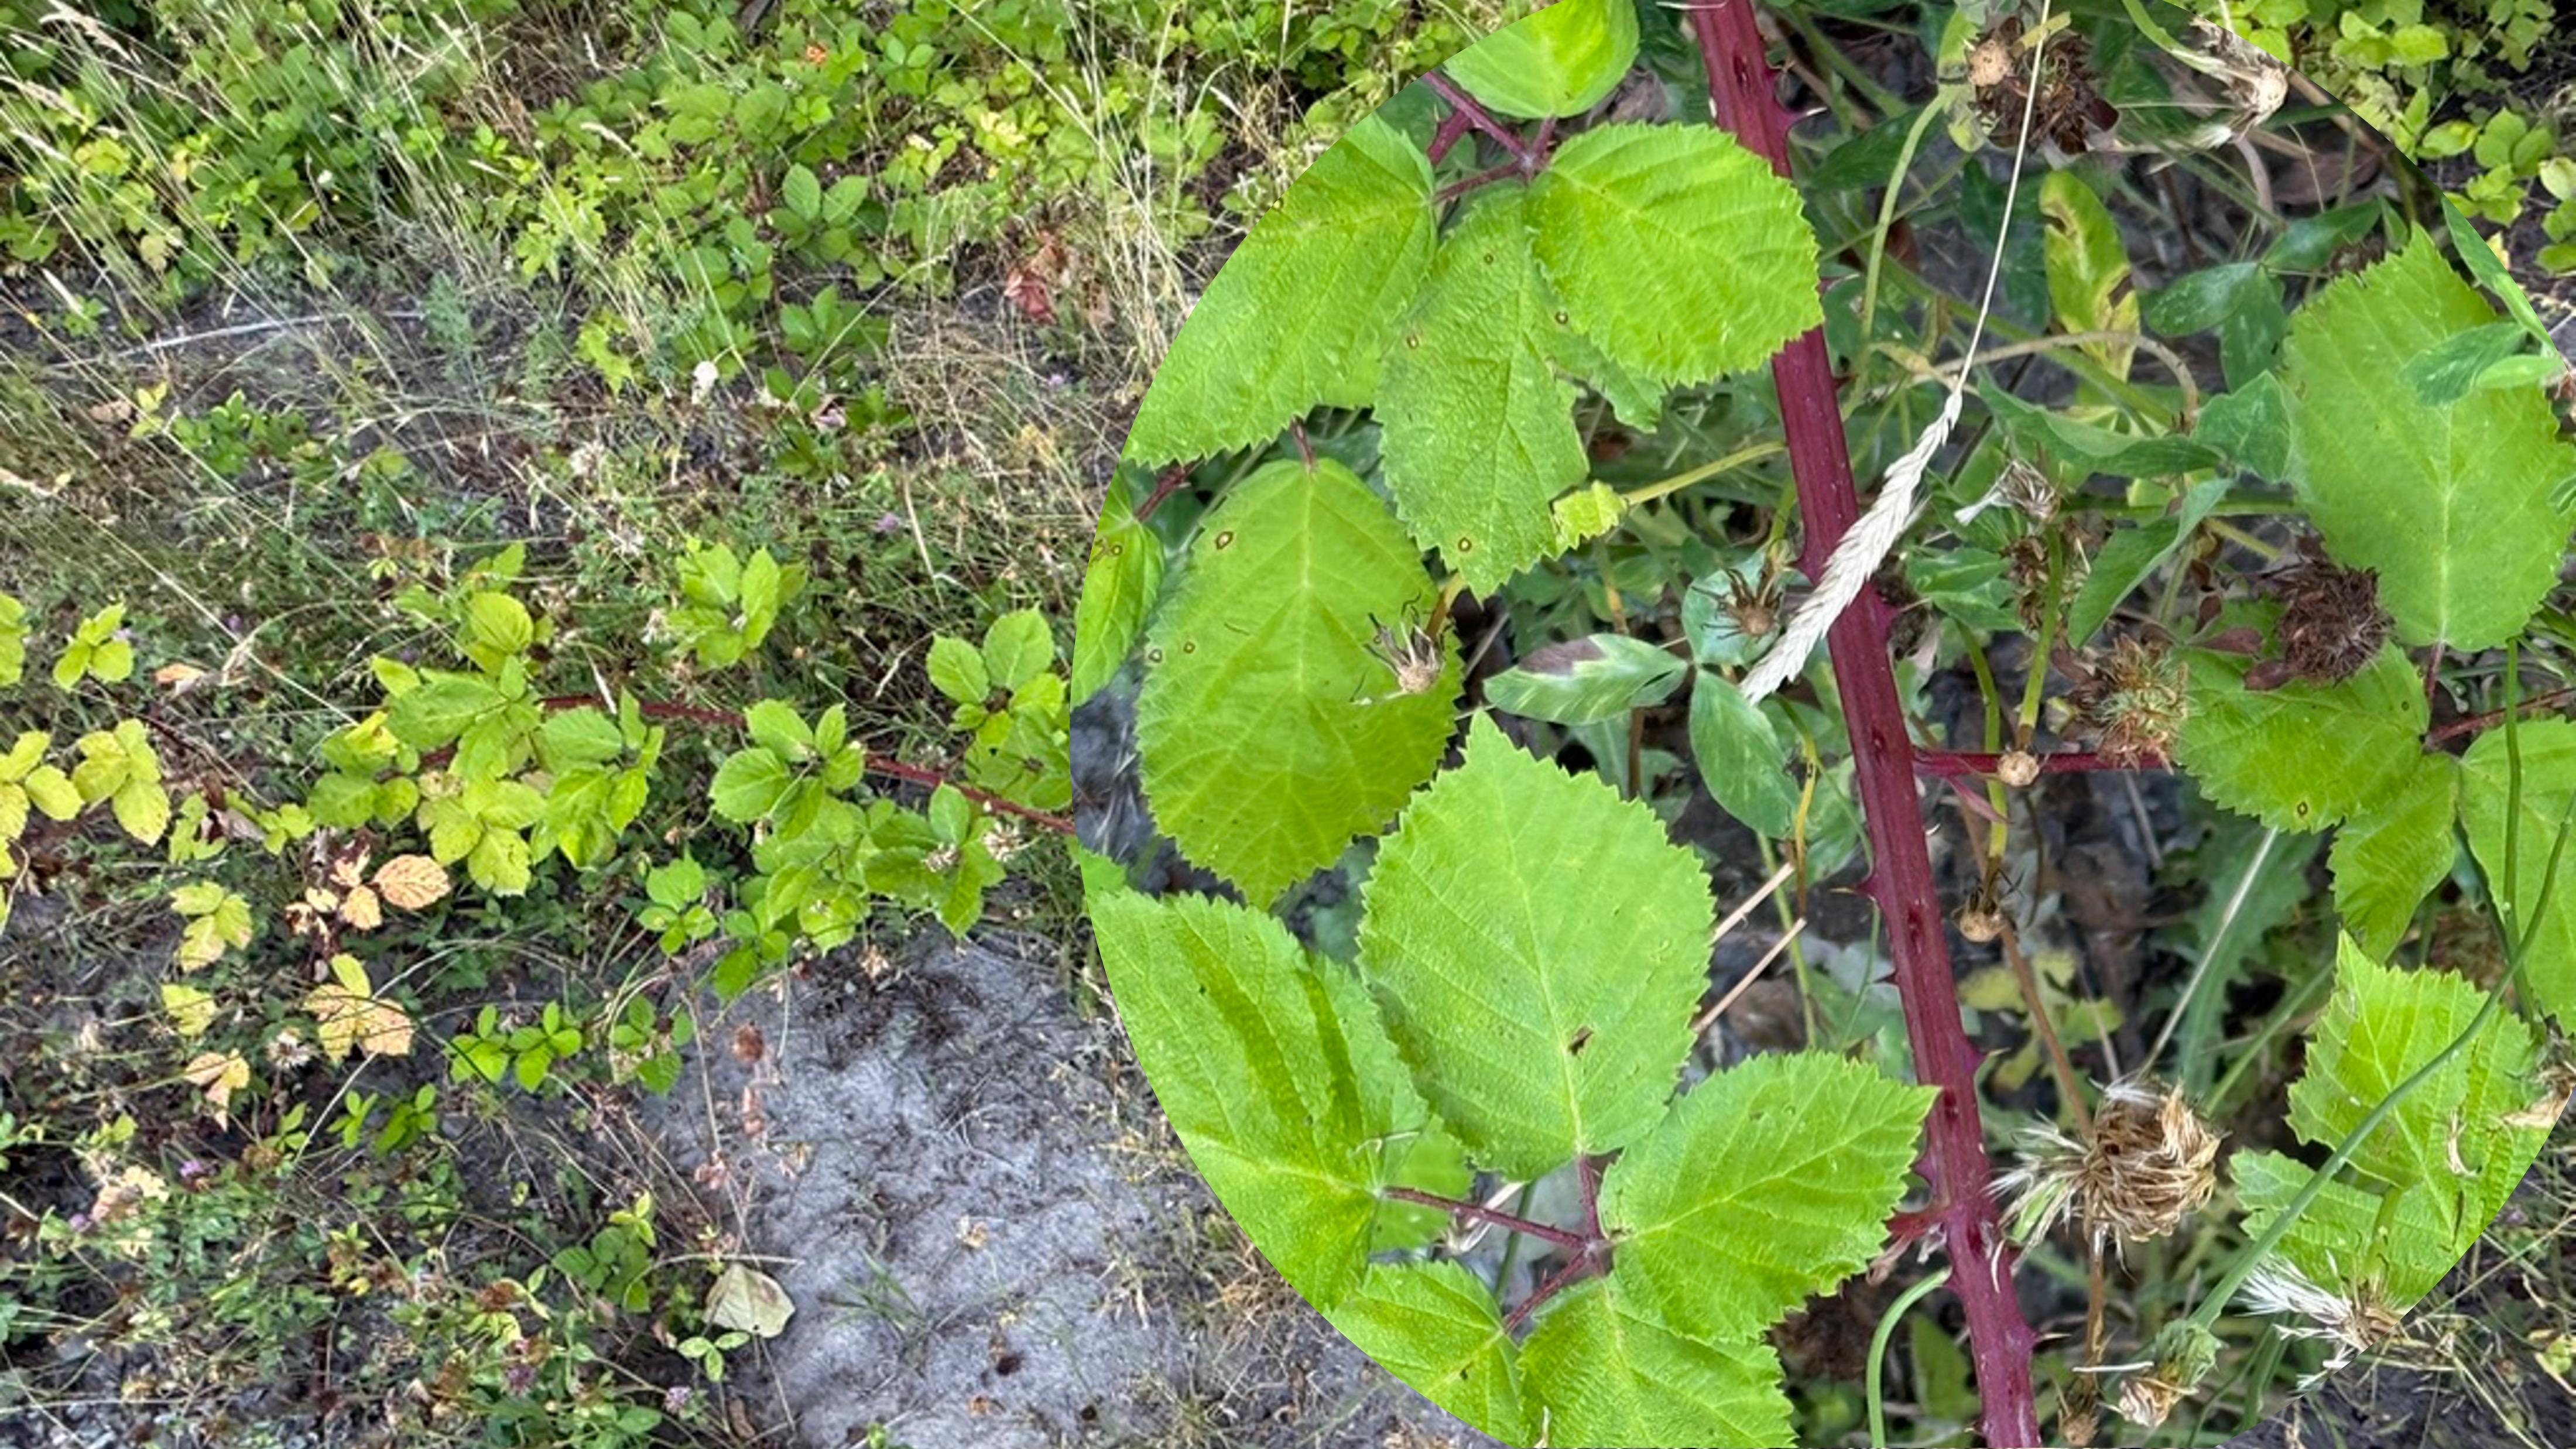
Plate 3. CoPilot and I argued too long about this one, but, after some back and forth, I decided it might be a genus of Spiraea. They are another common shrub in this ecosystem, but they aren’t in flower in July. Note the shriveled flowers in the right image. Too late to be sure. That’s why I’ve always ignored these bushes.
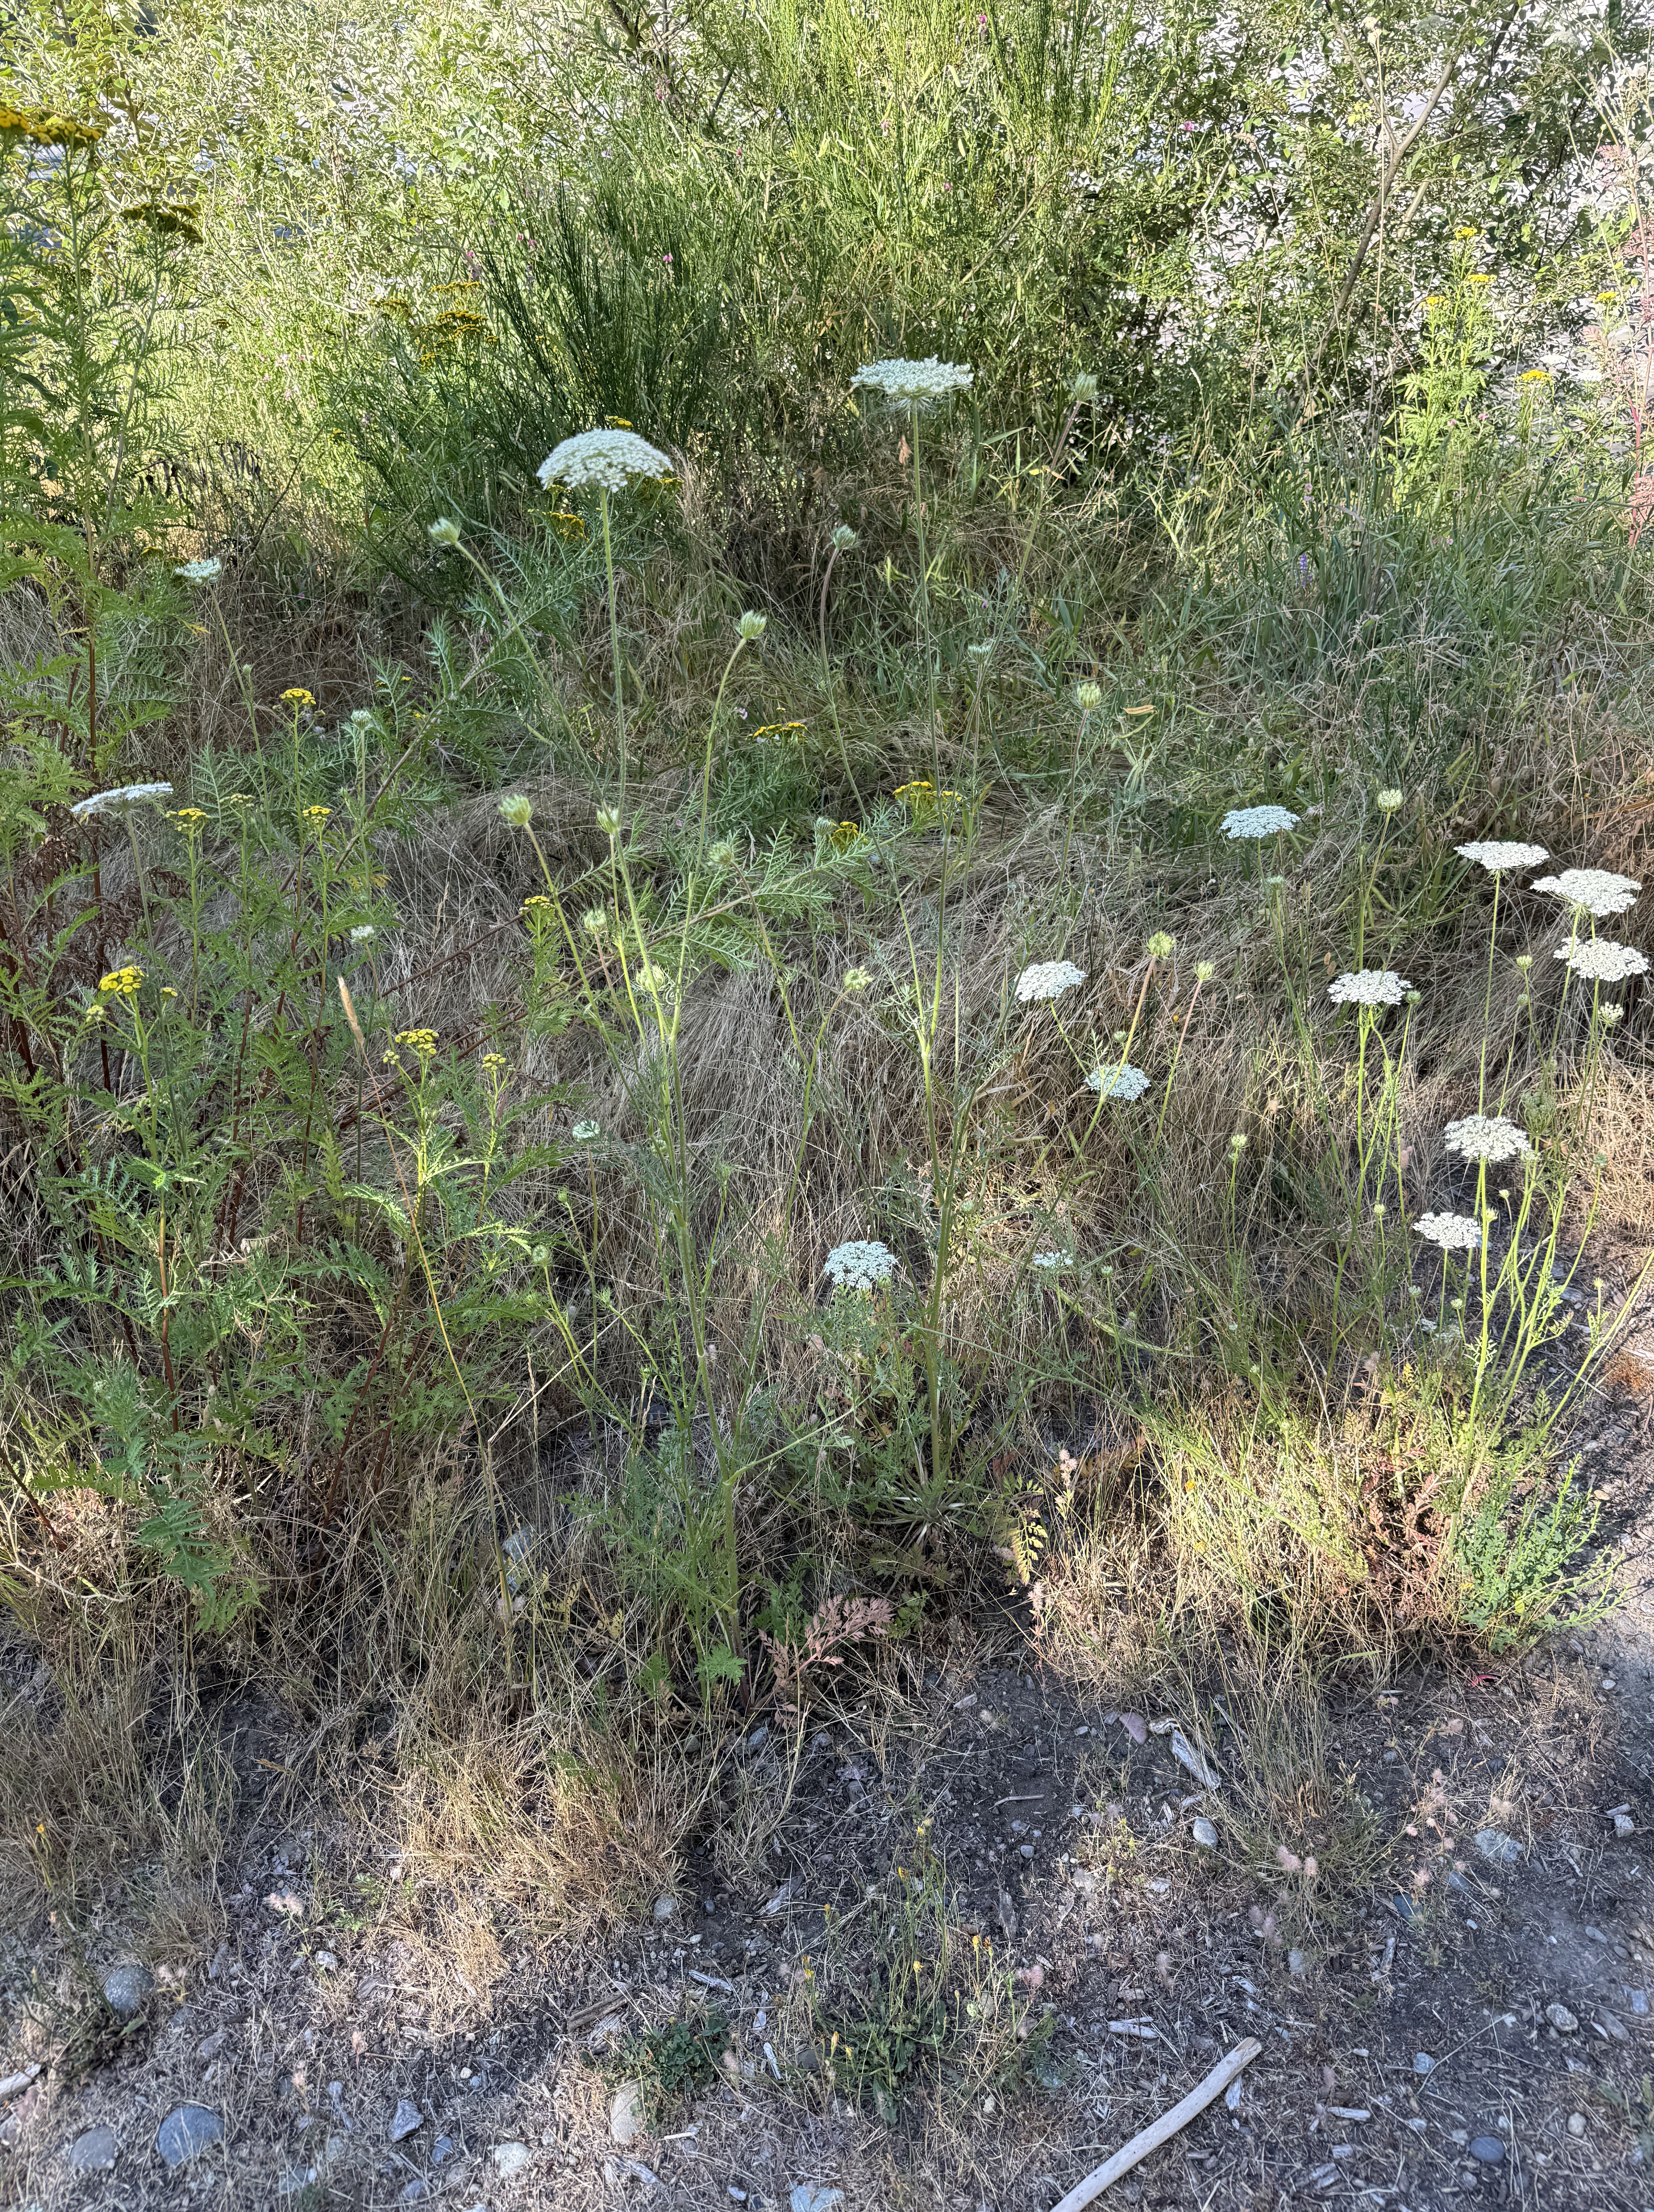
Plate 4. Cow parsnip (Heracleum maximus) is a common wildflower in meadows and roadsides in Washington.
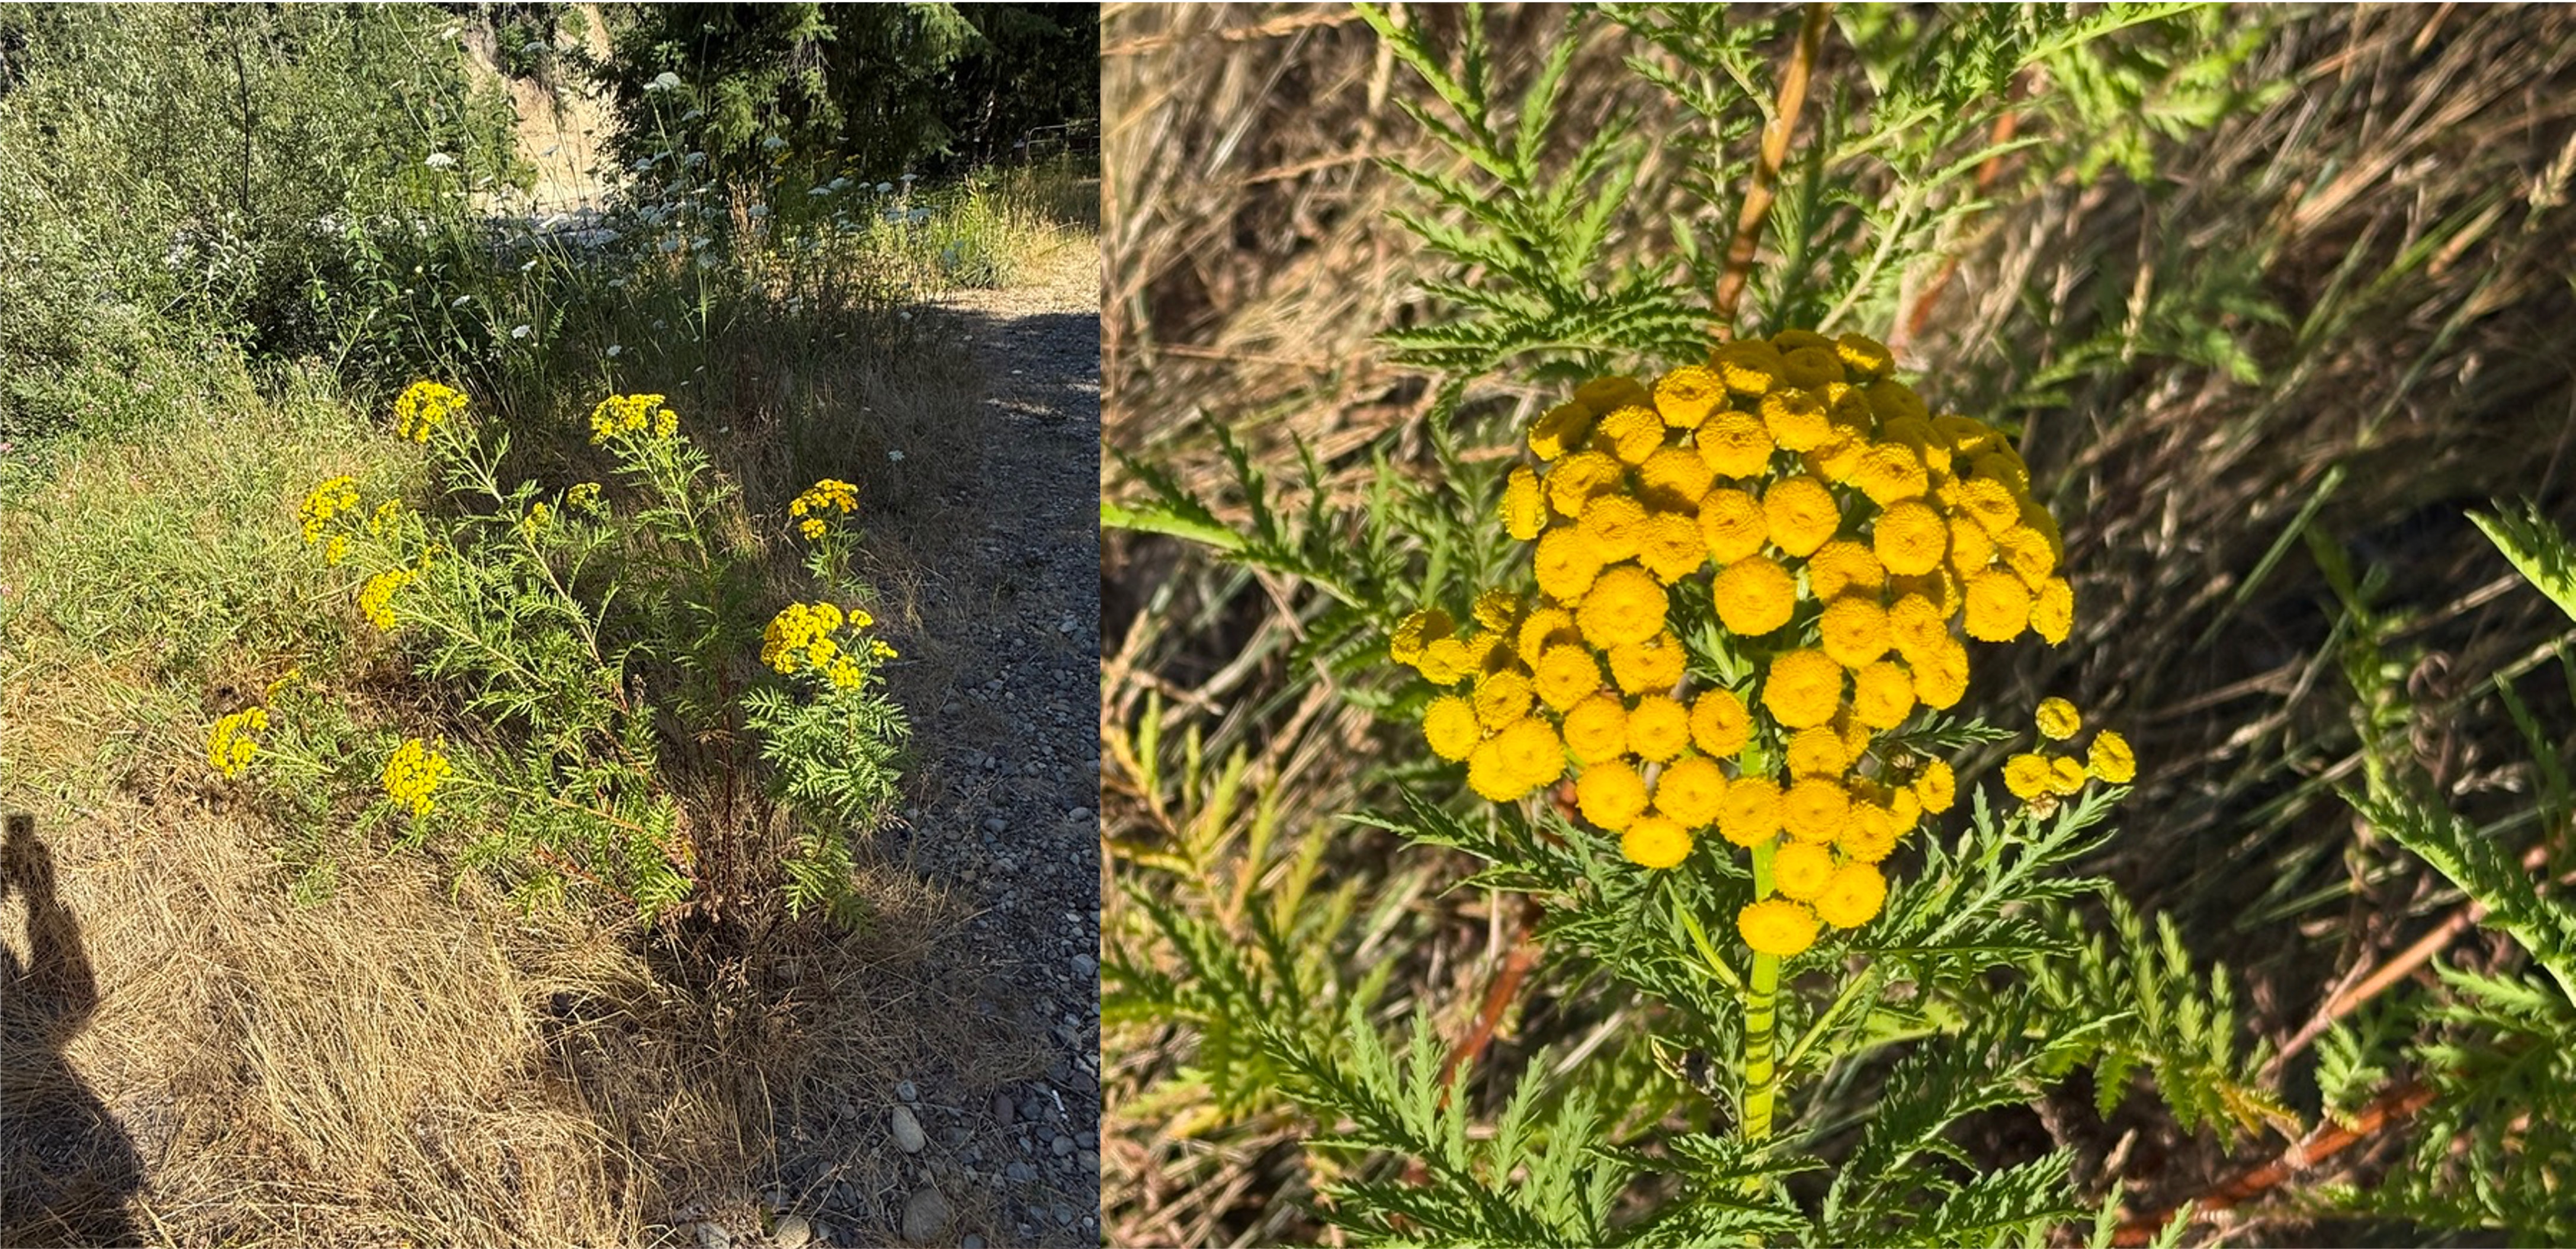
Plate 5. Tansy (Tanacetum vulgare) is a common wildflower along the Carbon River corridor.
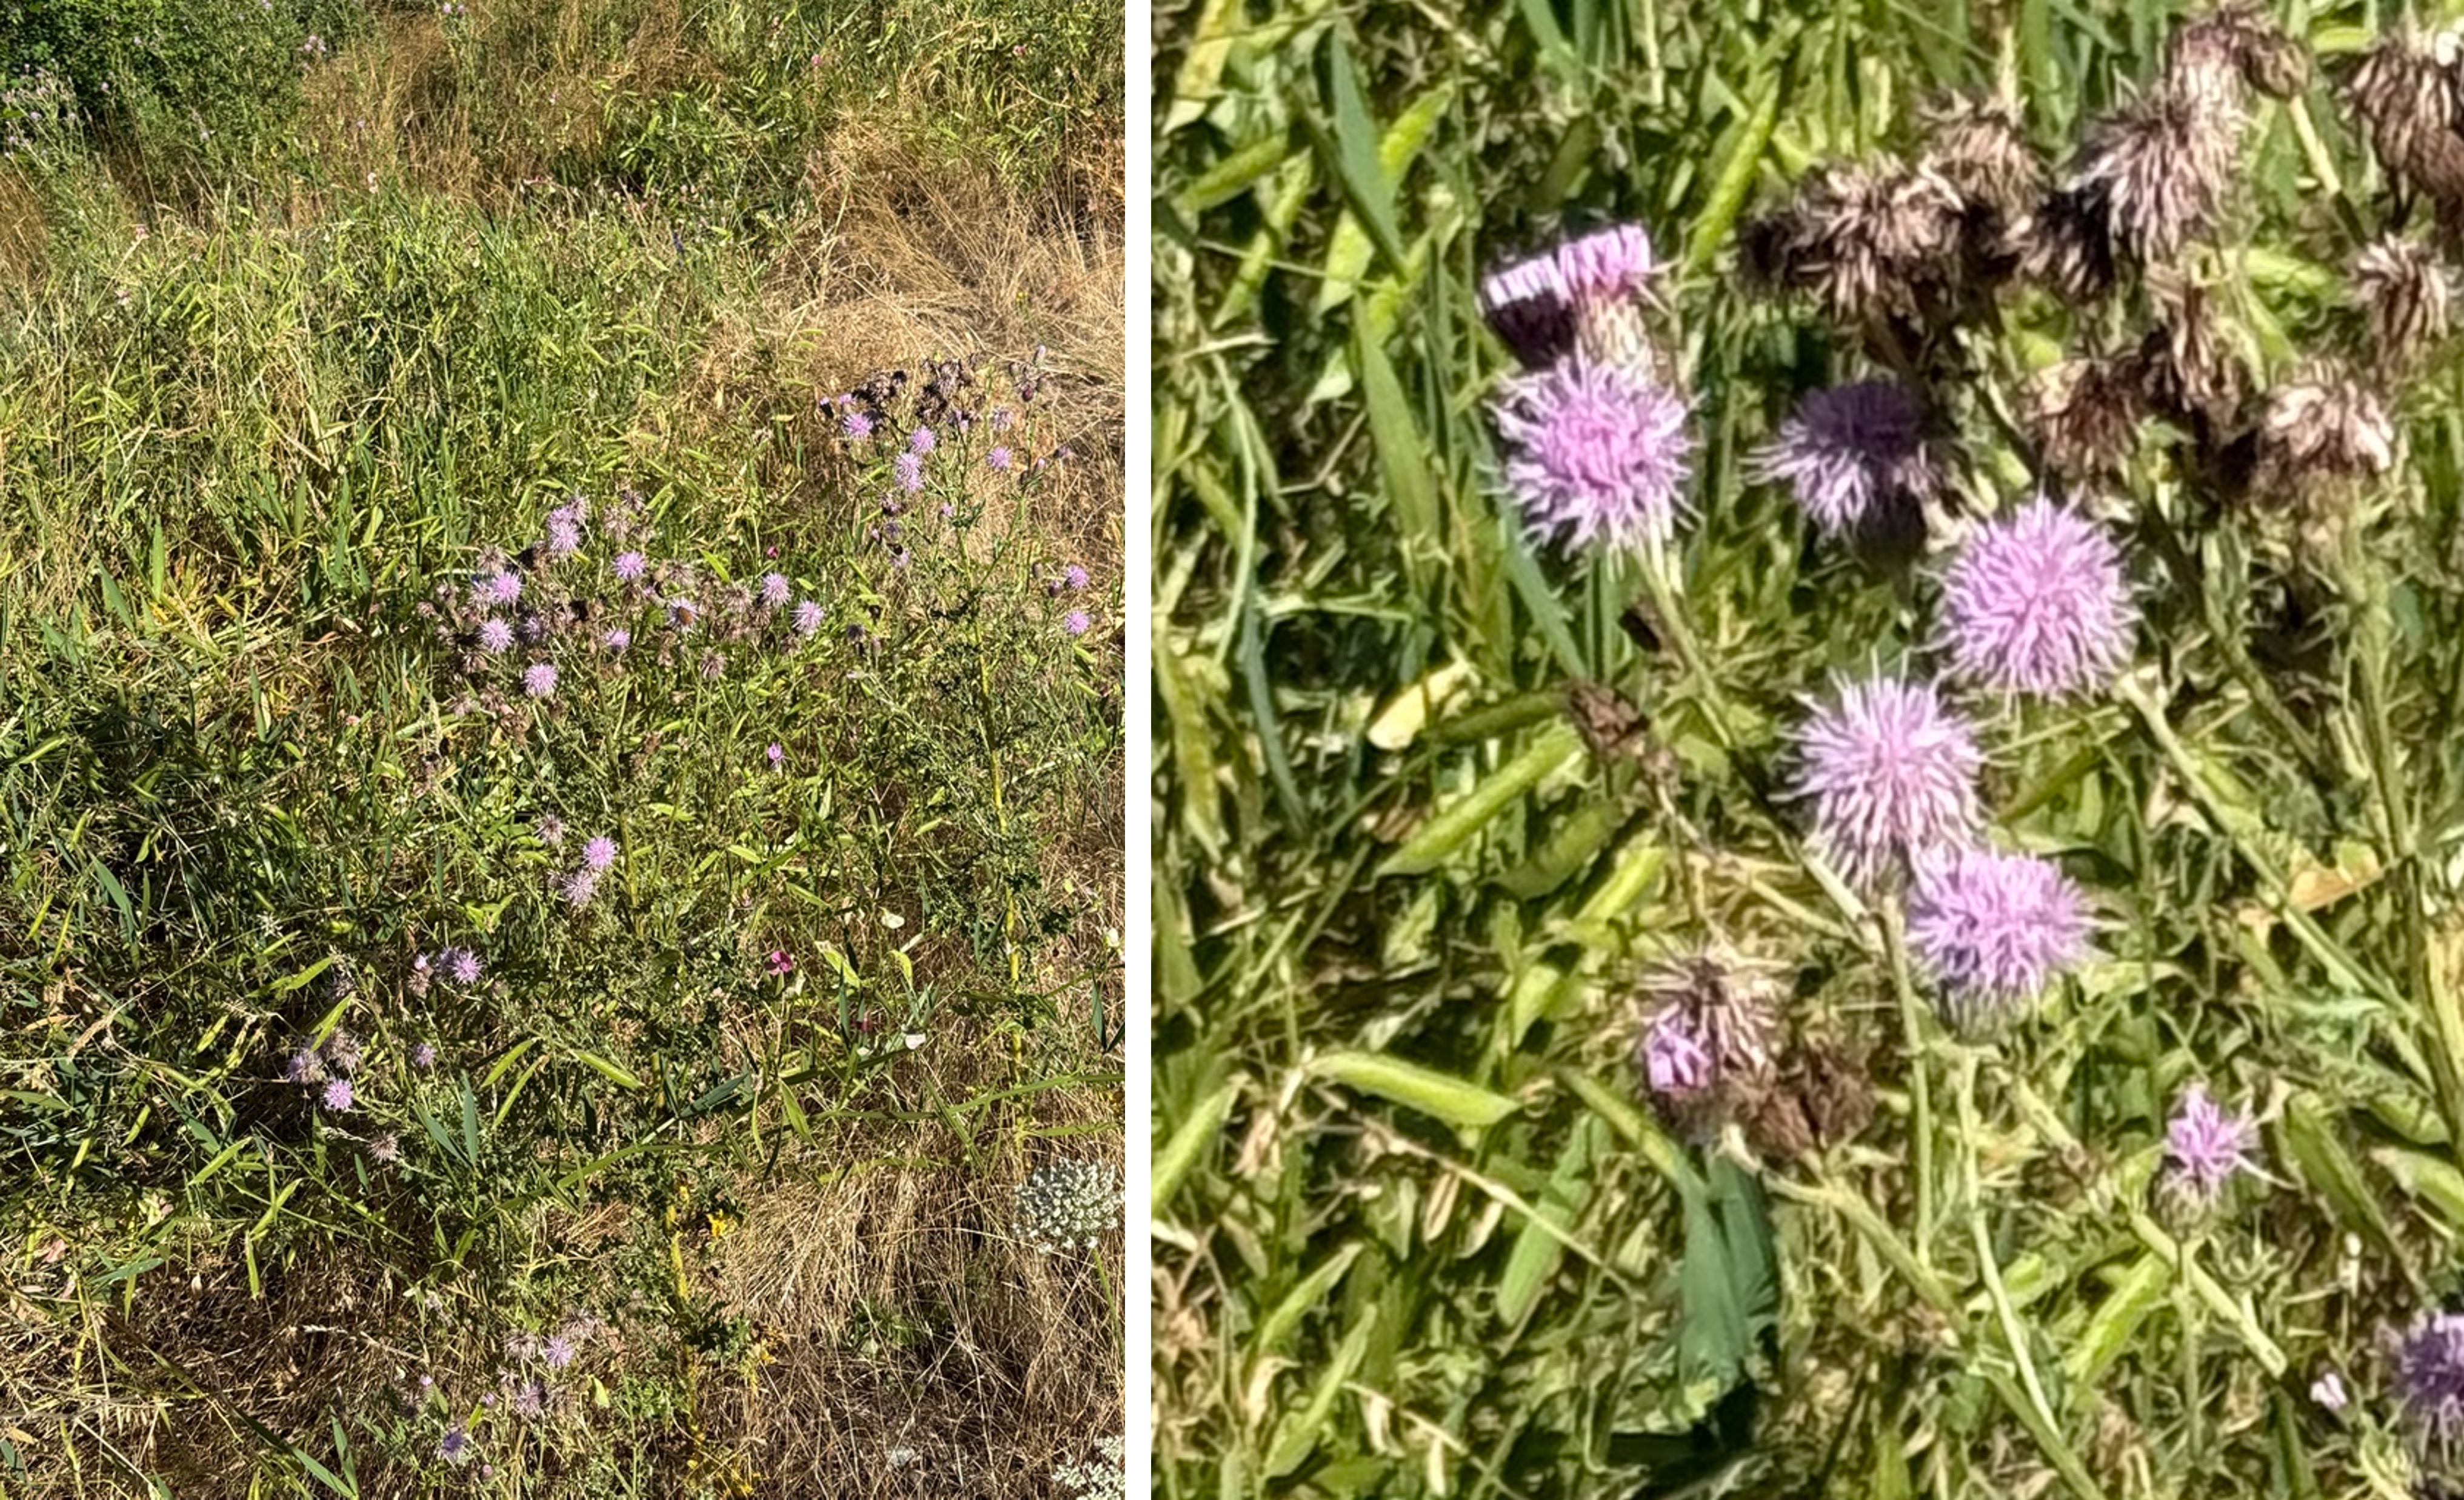
Plate 6. I thought, when putting this post together, that this was red clover (Plate 2), but CoPilot identified it as Canada thistle (Cirsium arvense). It loves disturbed areas like river edges. I did detect some spines when I zoomed in on the second photo. Why am I not surprised? If it’s pretty it will have spikes ready to draw blood from any inquisitive passers by.
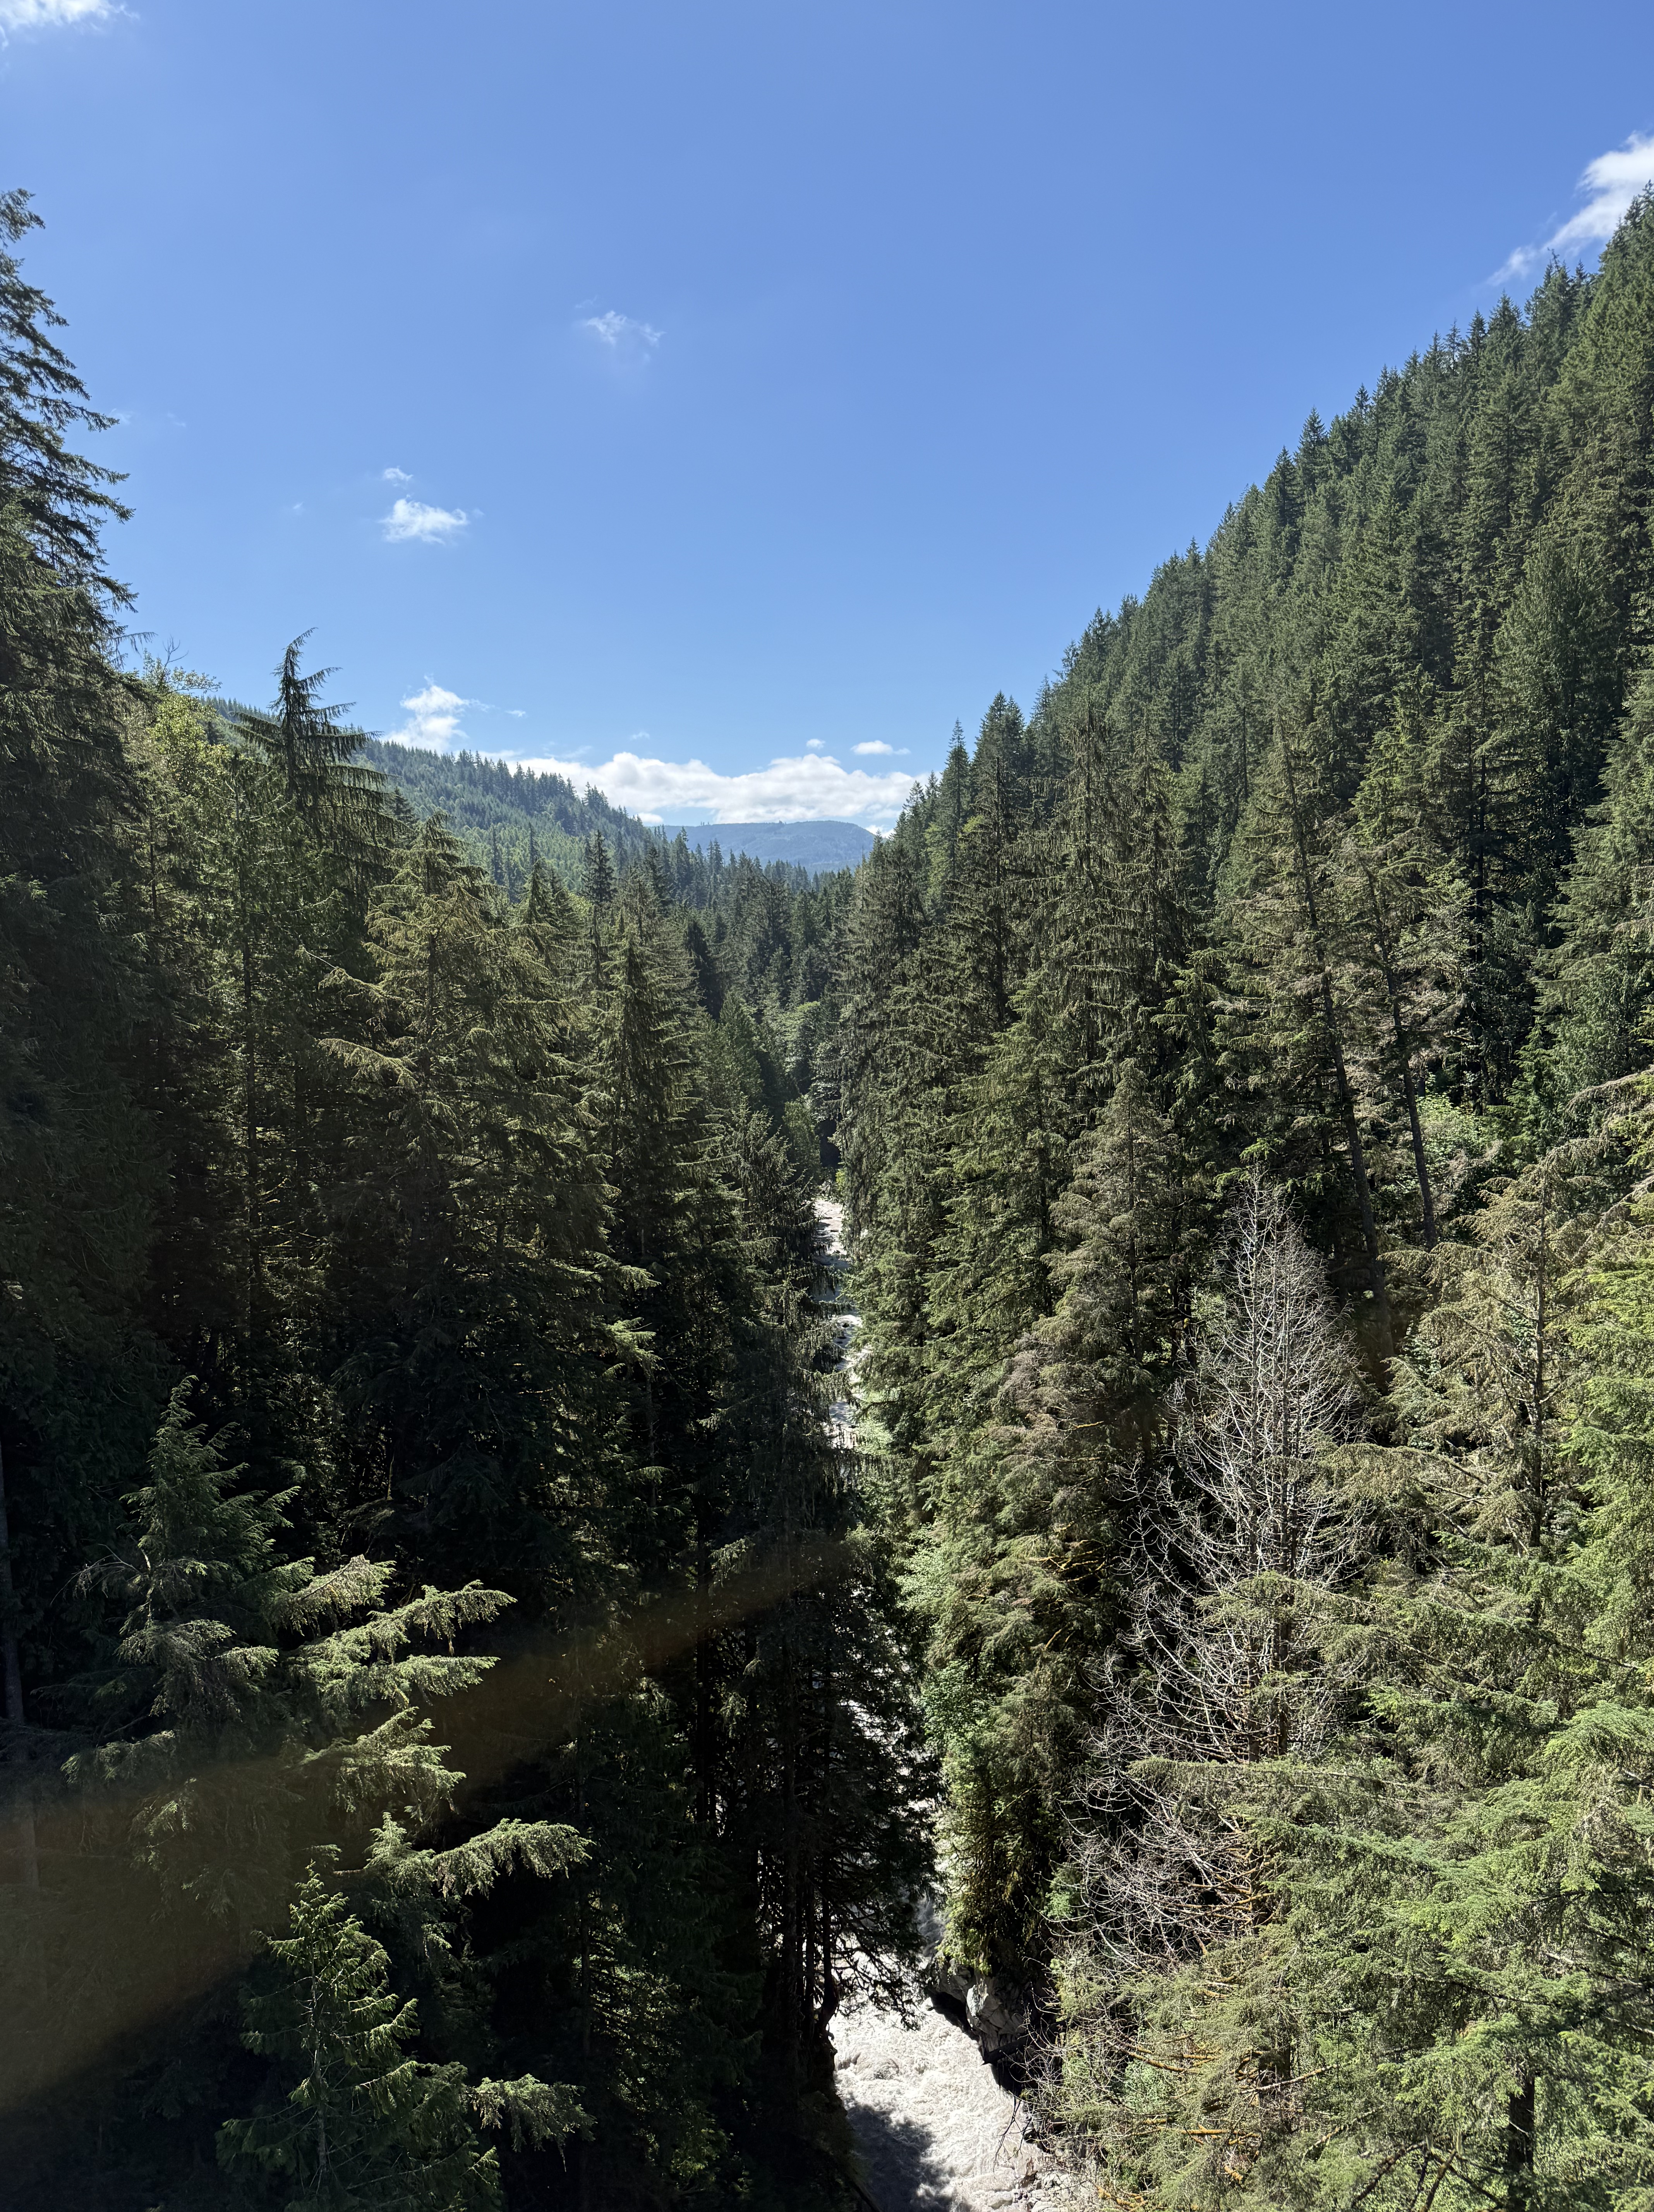
Plate 7. This view is looking downriver from Franklin bridge, which is permanently closed. I’ll now describe some of the flora we encountered as we followed the river along a steep slope.
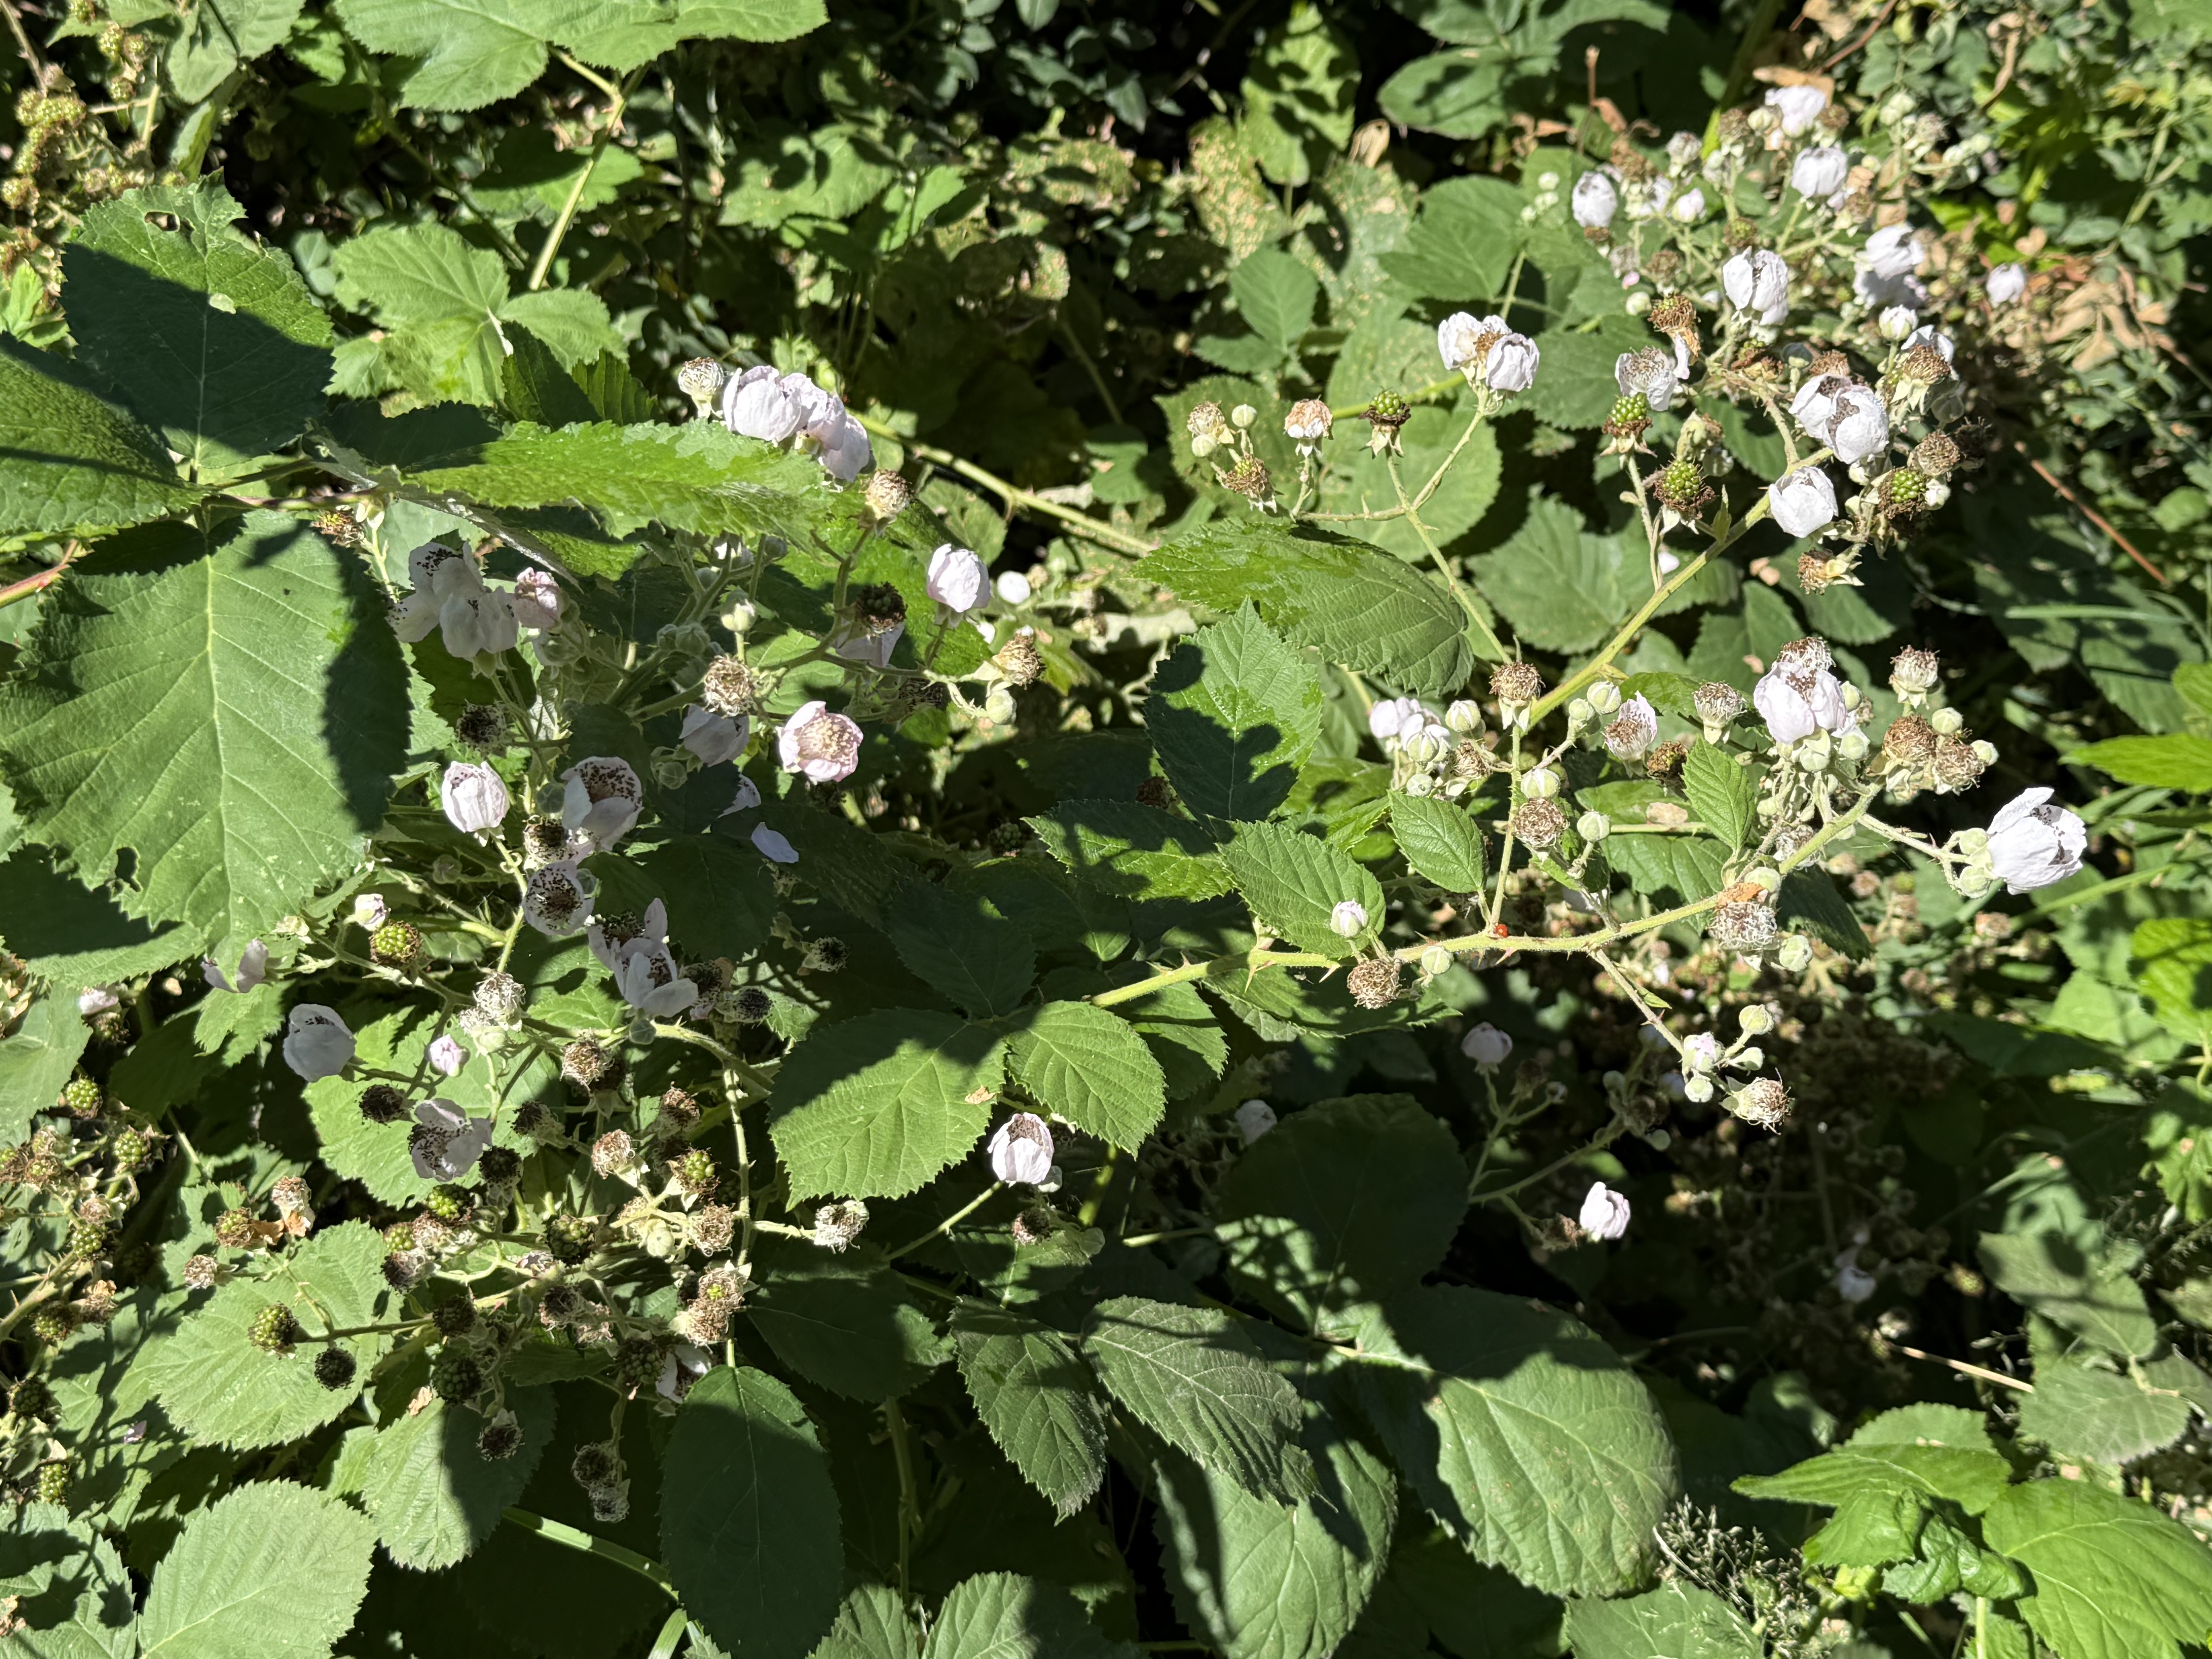
Plate 8. I (kinda) got this one right. This is a wild rose, Nootka rose (Rosa nutkana). This is another plant that waits for an opening in the forest canopy to grow, and then it colonizes like crazy — until the forest canopy catches up with it. Moist but well-drained soil pretty much sums up Carbon River canyon.
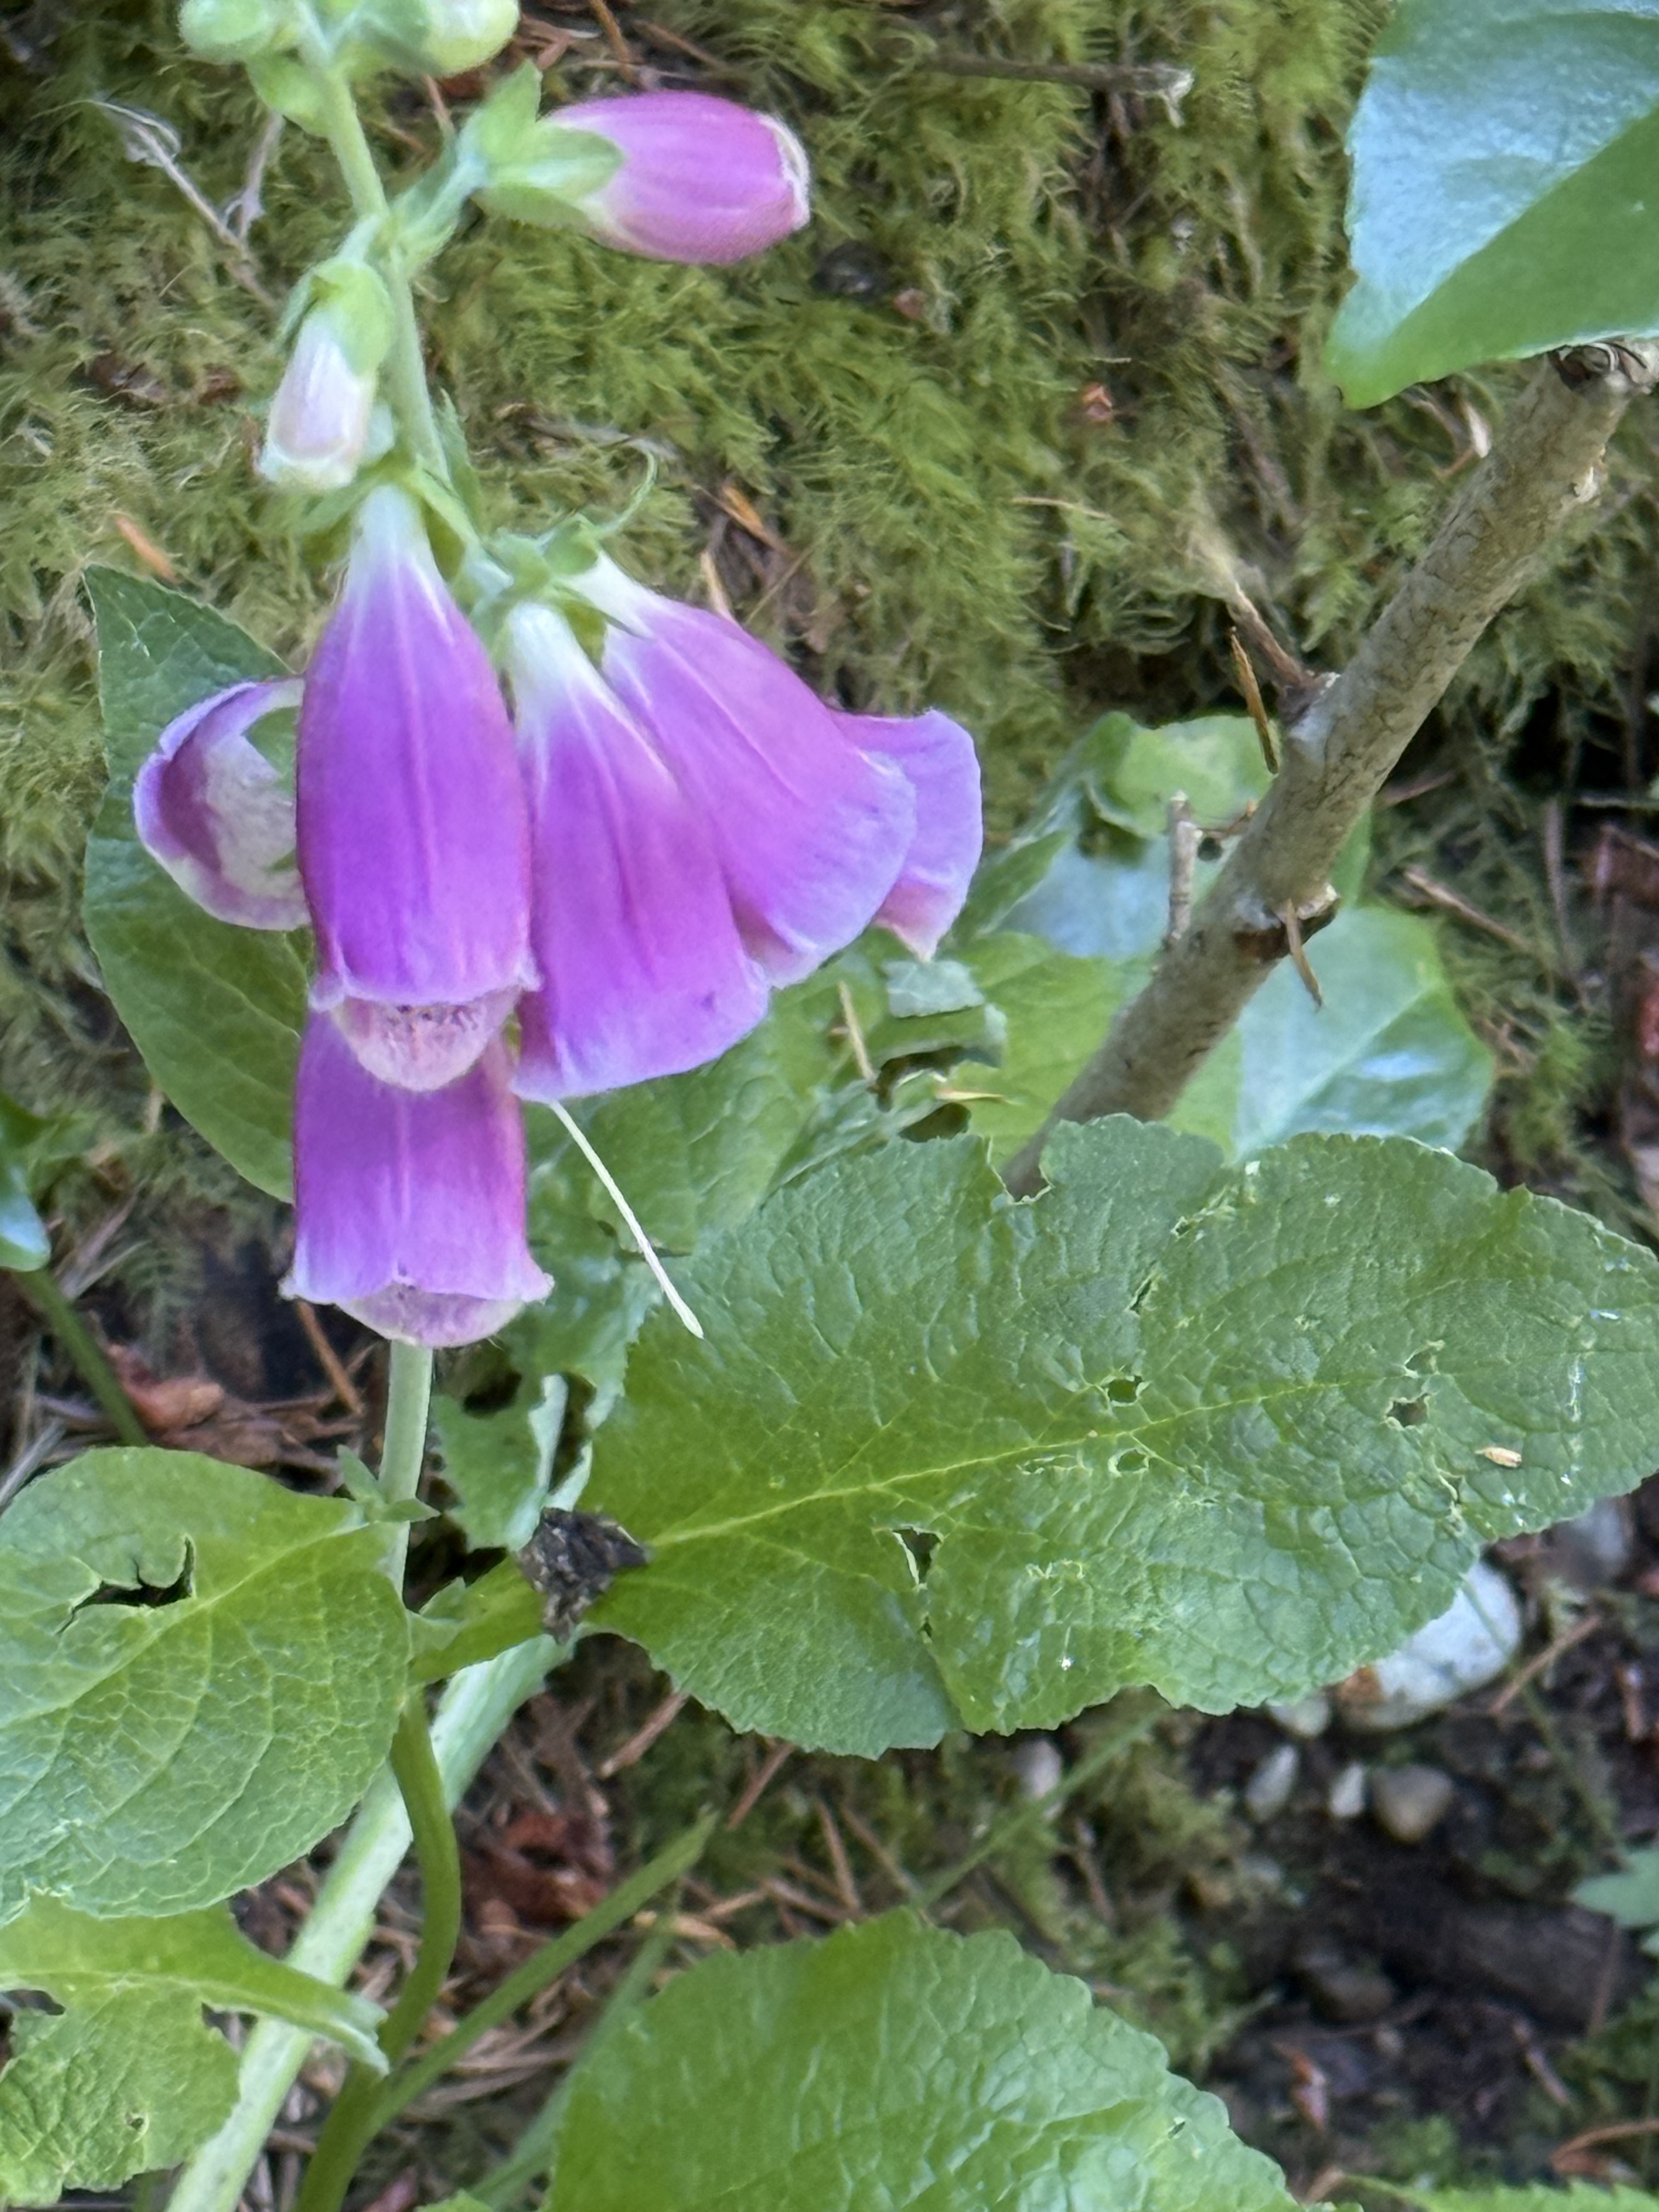
Plate 9. This familiar flower is foxglove (Digitalis purpurea), introduced from Europe; but it is so naturalized that it behaves like a native plant, similar to Cascade penstemon (see Plate 11), thriving in disturbed ground at the edge of conifer forests and in temporarily sunny areas.
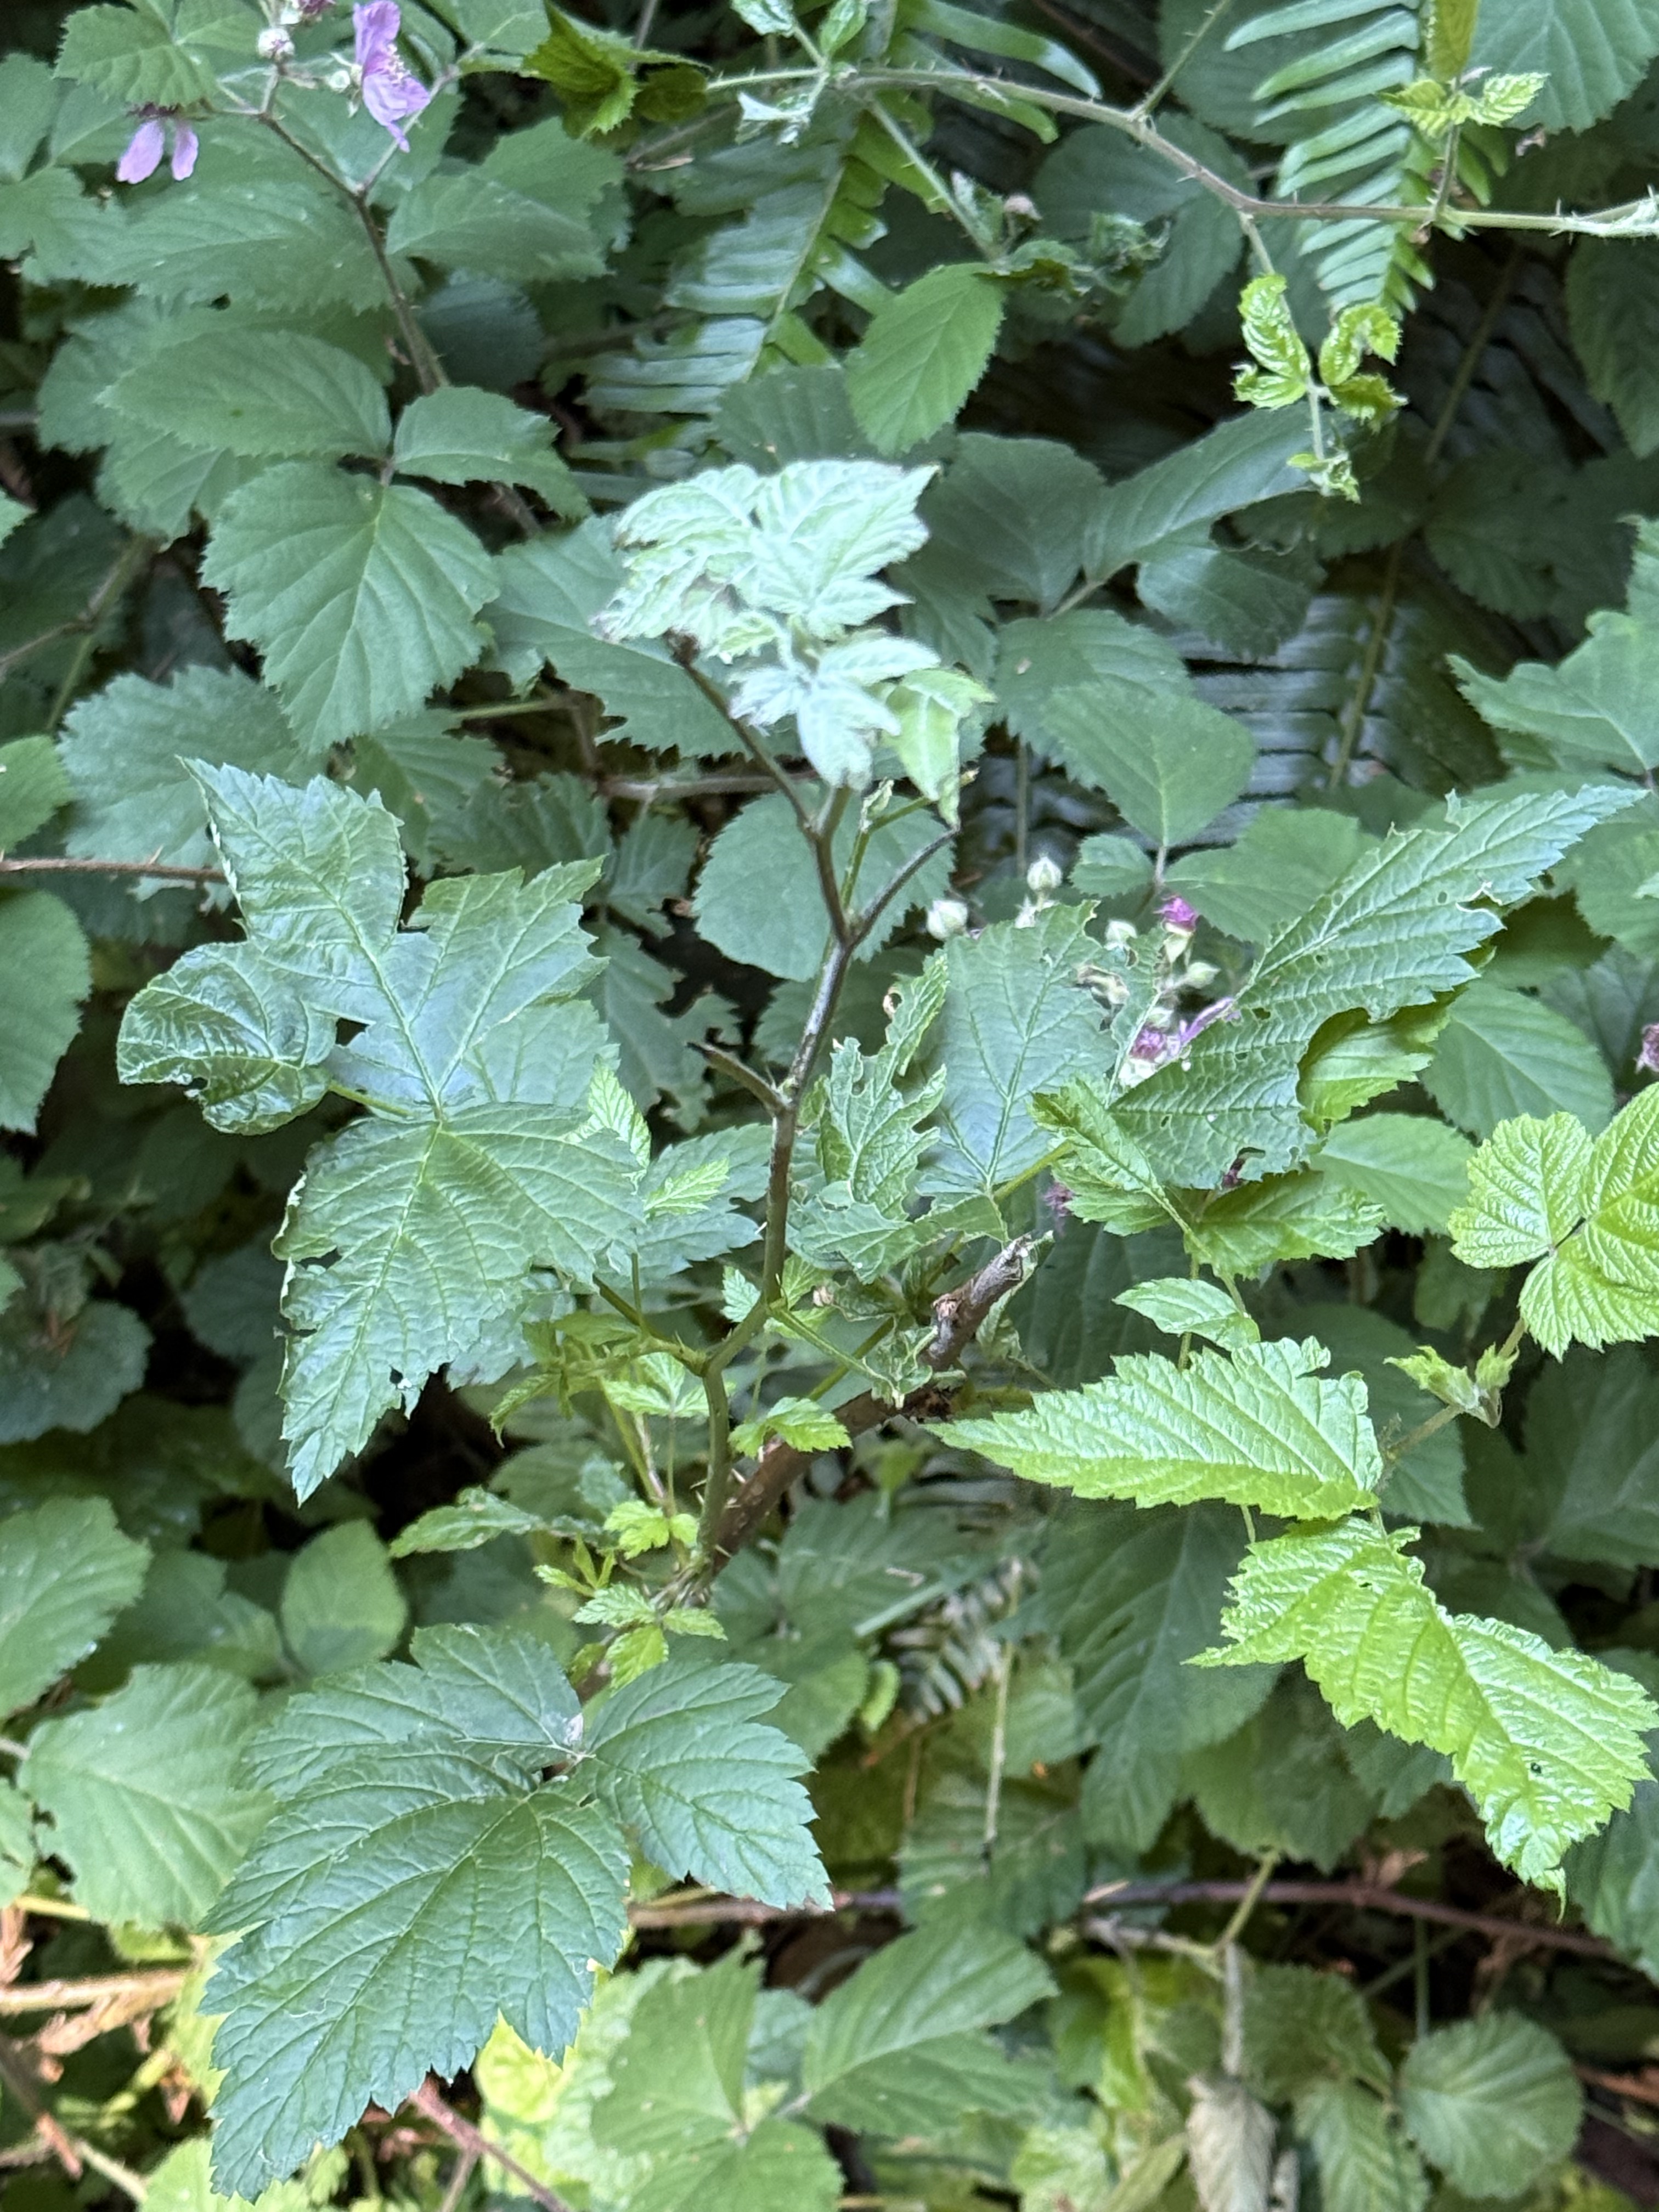
Plate 10. Besides white flowers, I am also fixated on thorns; however, I don’t know anything about thorns except that roses have them, as well as many of the shrubs I’ve encountered on my nature walks. This is probably Himalayan blackberry (Rubus armeniacus), an invasive species to Pierce County. I guess that’s why it isn’t called Washington blackberry, or some such. I checked a previous post from Point Defiance, and there it was! Invasion of the forest snatchers.
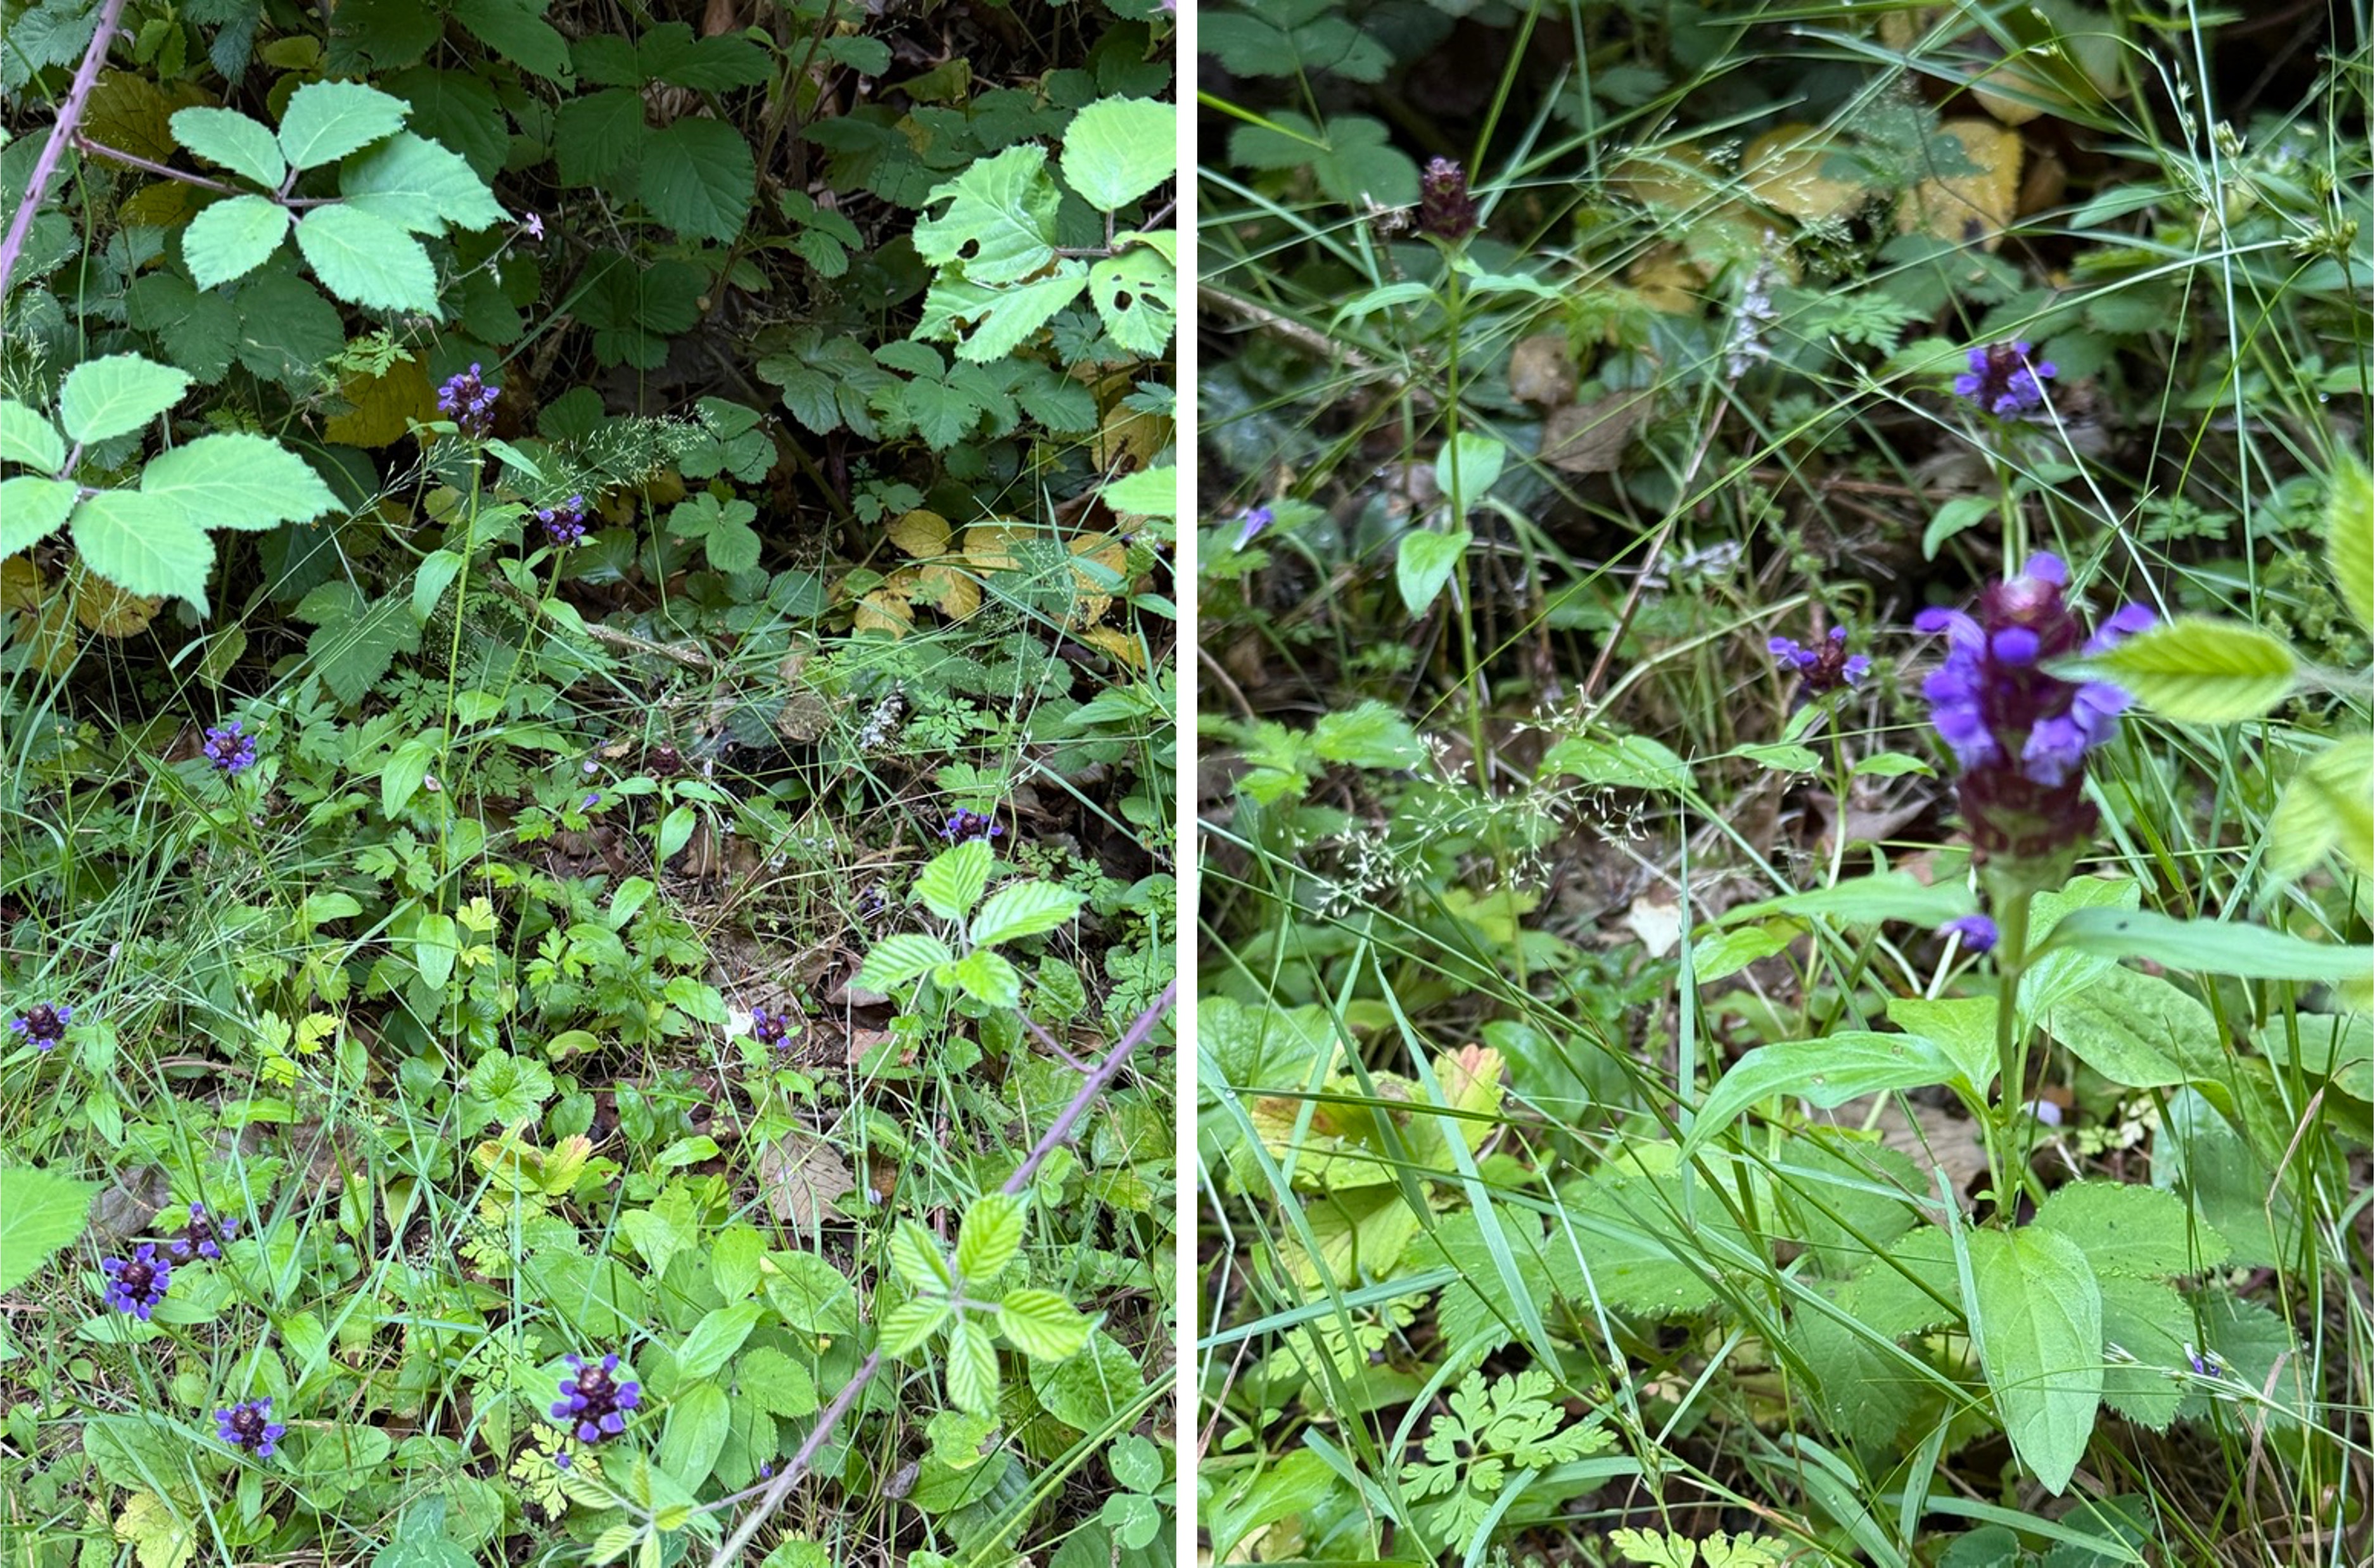
Plate 11. This purple wildflower is probably Cascade penstemon (Penstemon serrulatus), a native to the PNW. It is what CoPilot calls an ecotone plant — one that thrives where a conifer forest is encroaching on a prairie environment. We encountered it where the conifers hadn’t yet blocked out the sun along the trail.
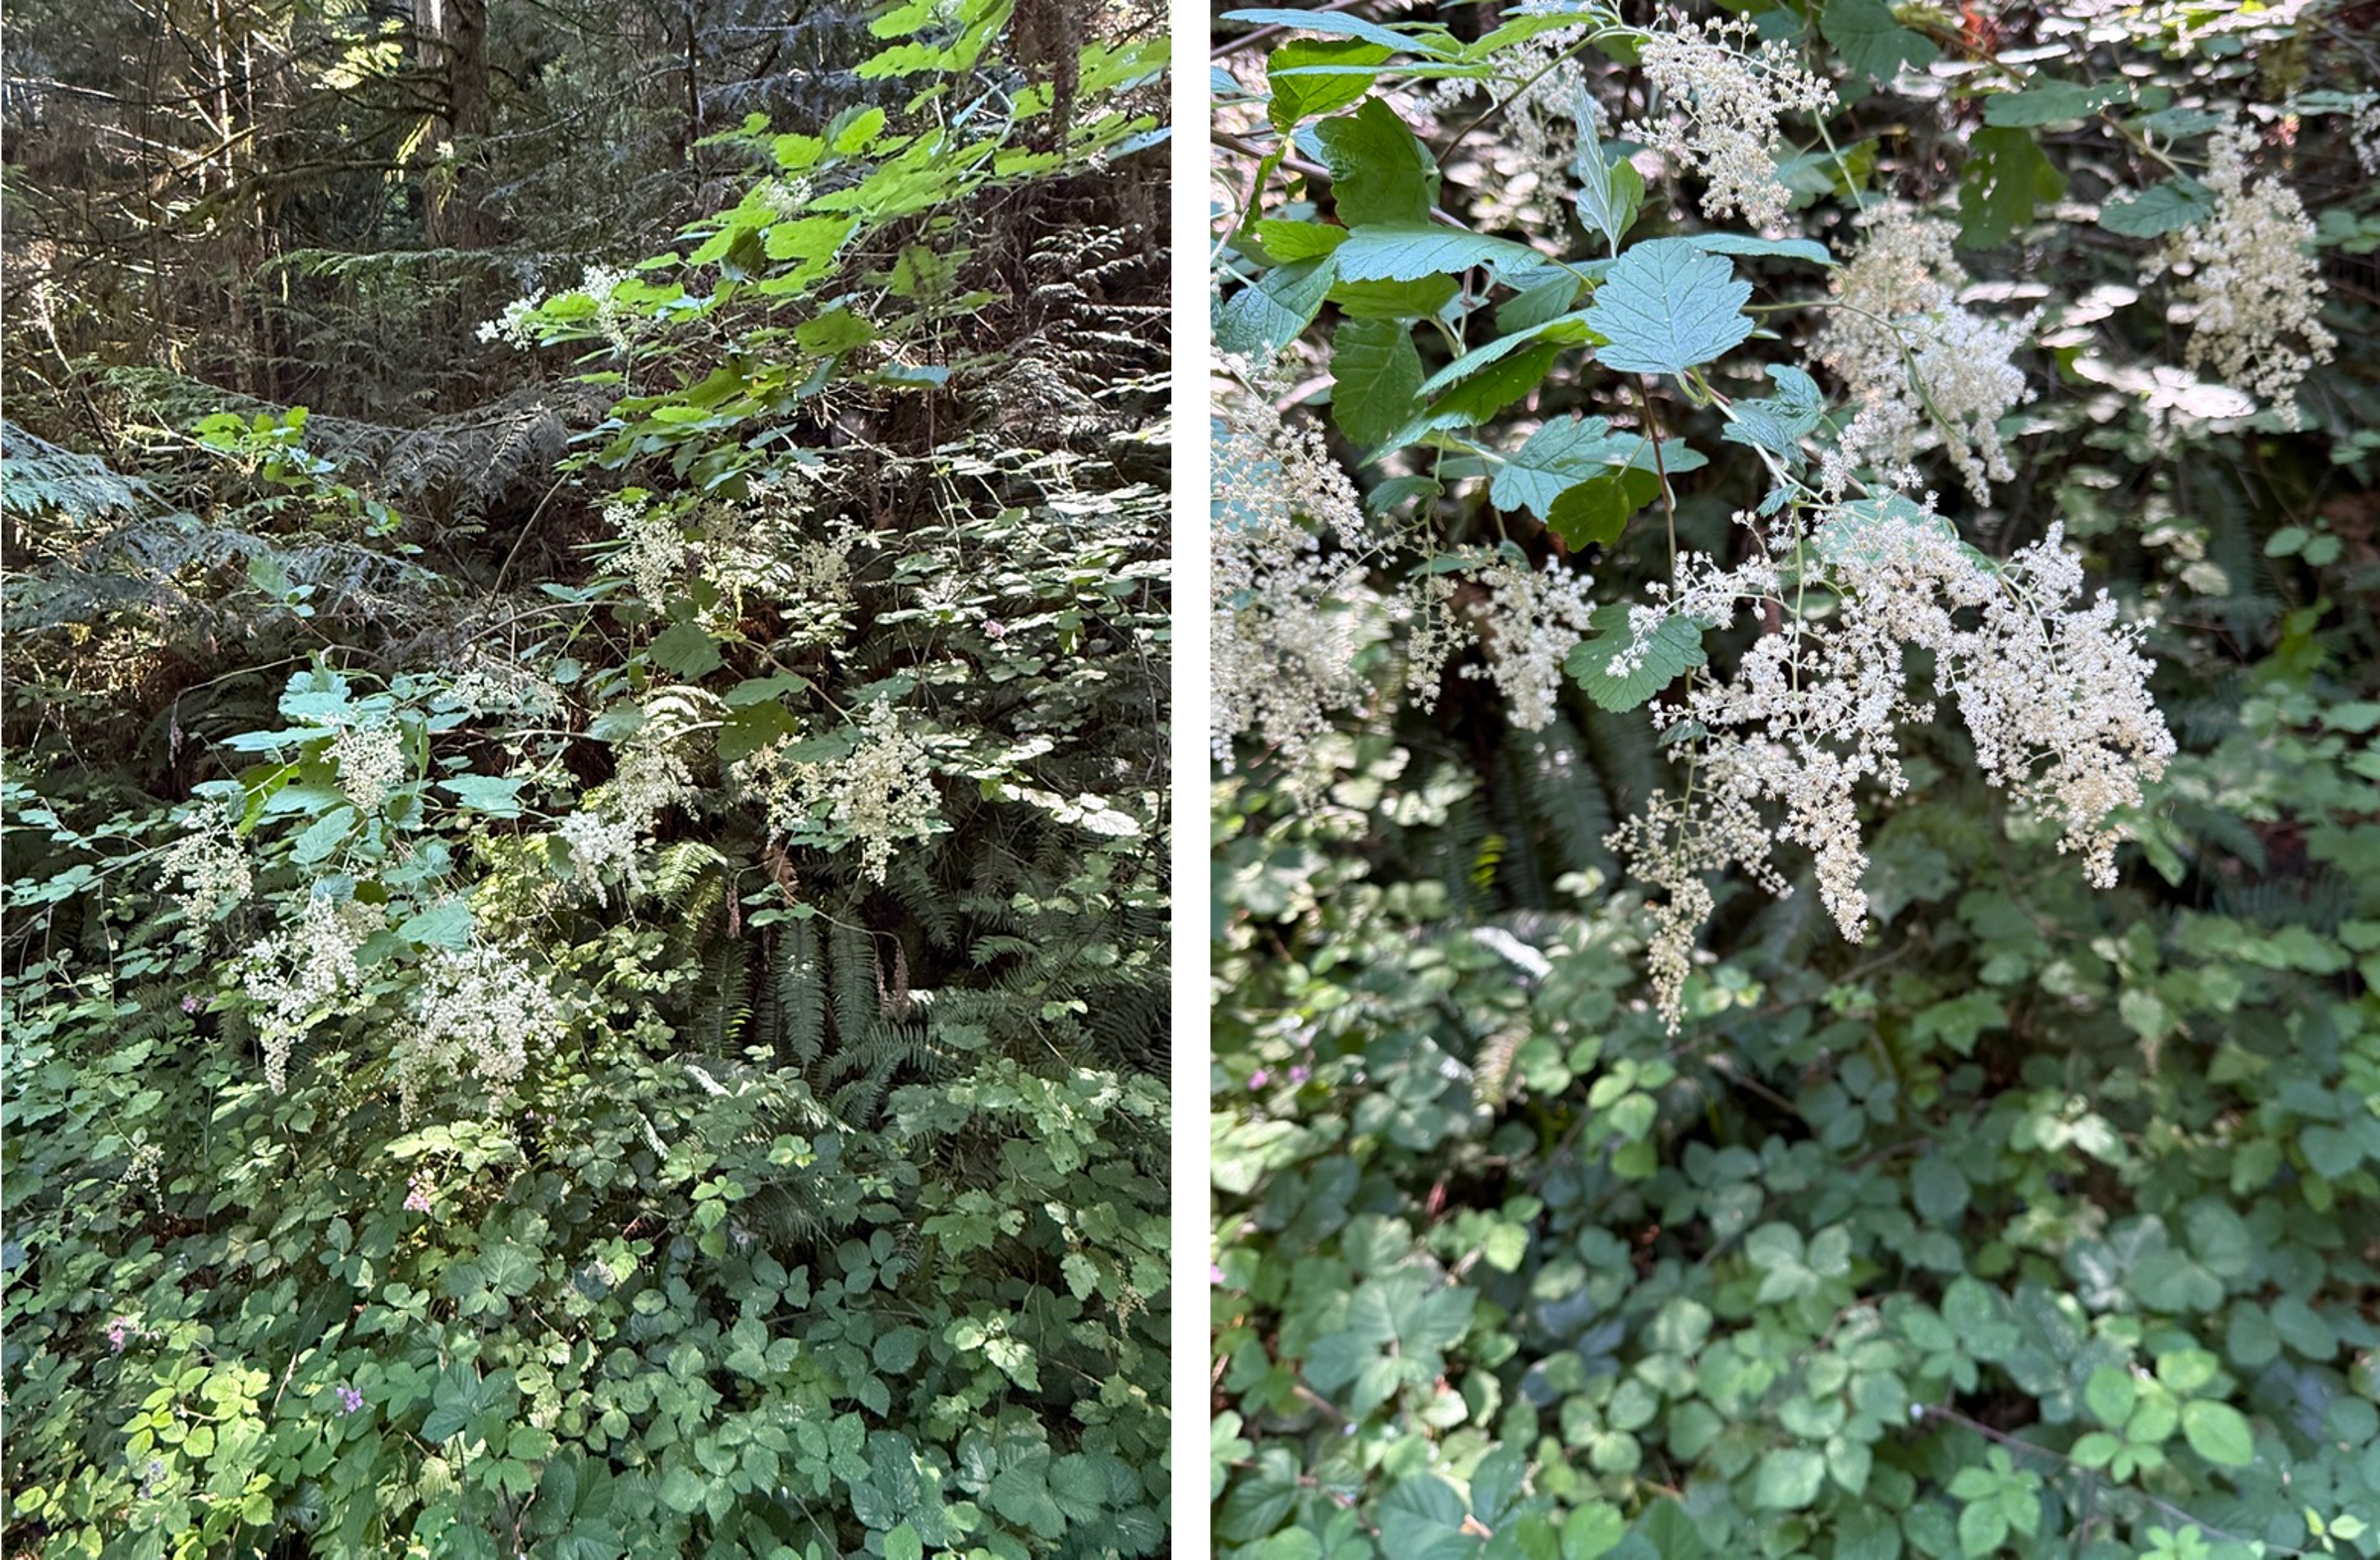
Plate 12. I’m easily fooled by white flowers. This non-woody shrub is False Solomon’s seal (Maianthemum racemosum). It grows in the understory of a conifer forest, which is a good description of Carbon River canyon.
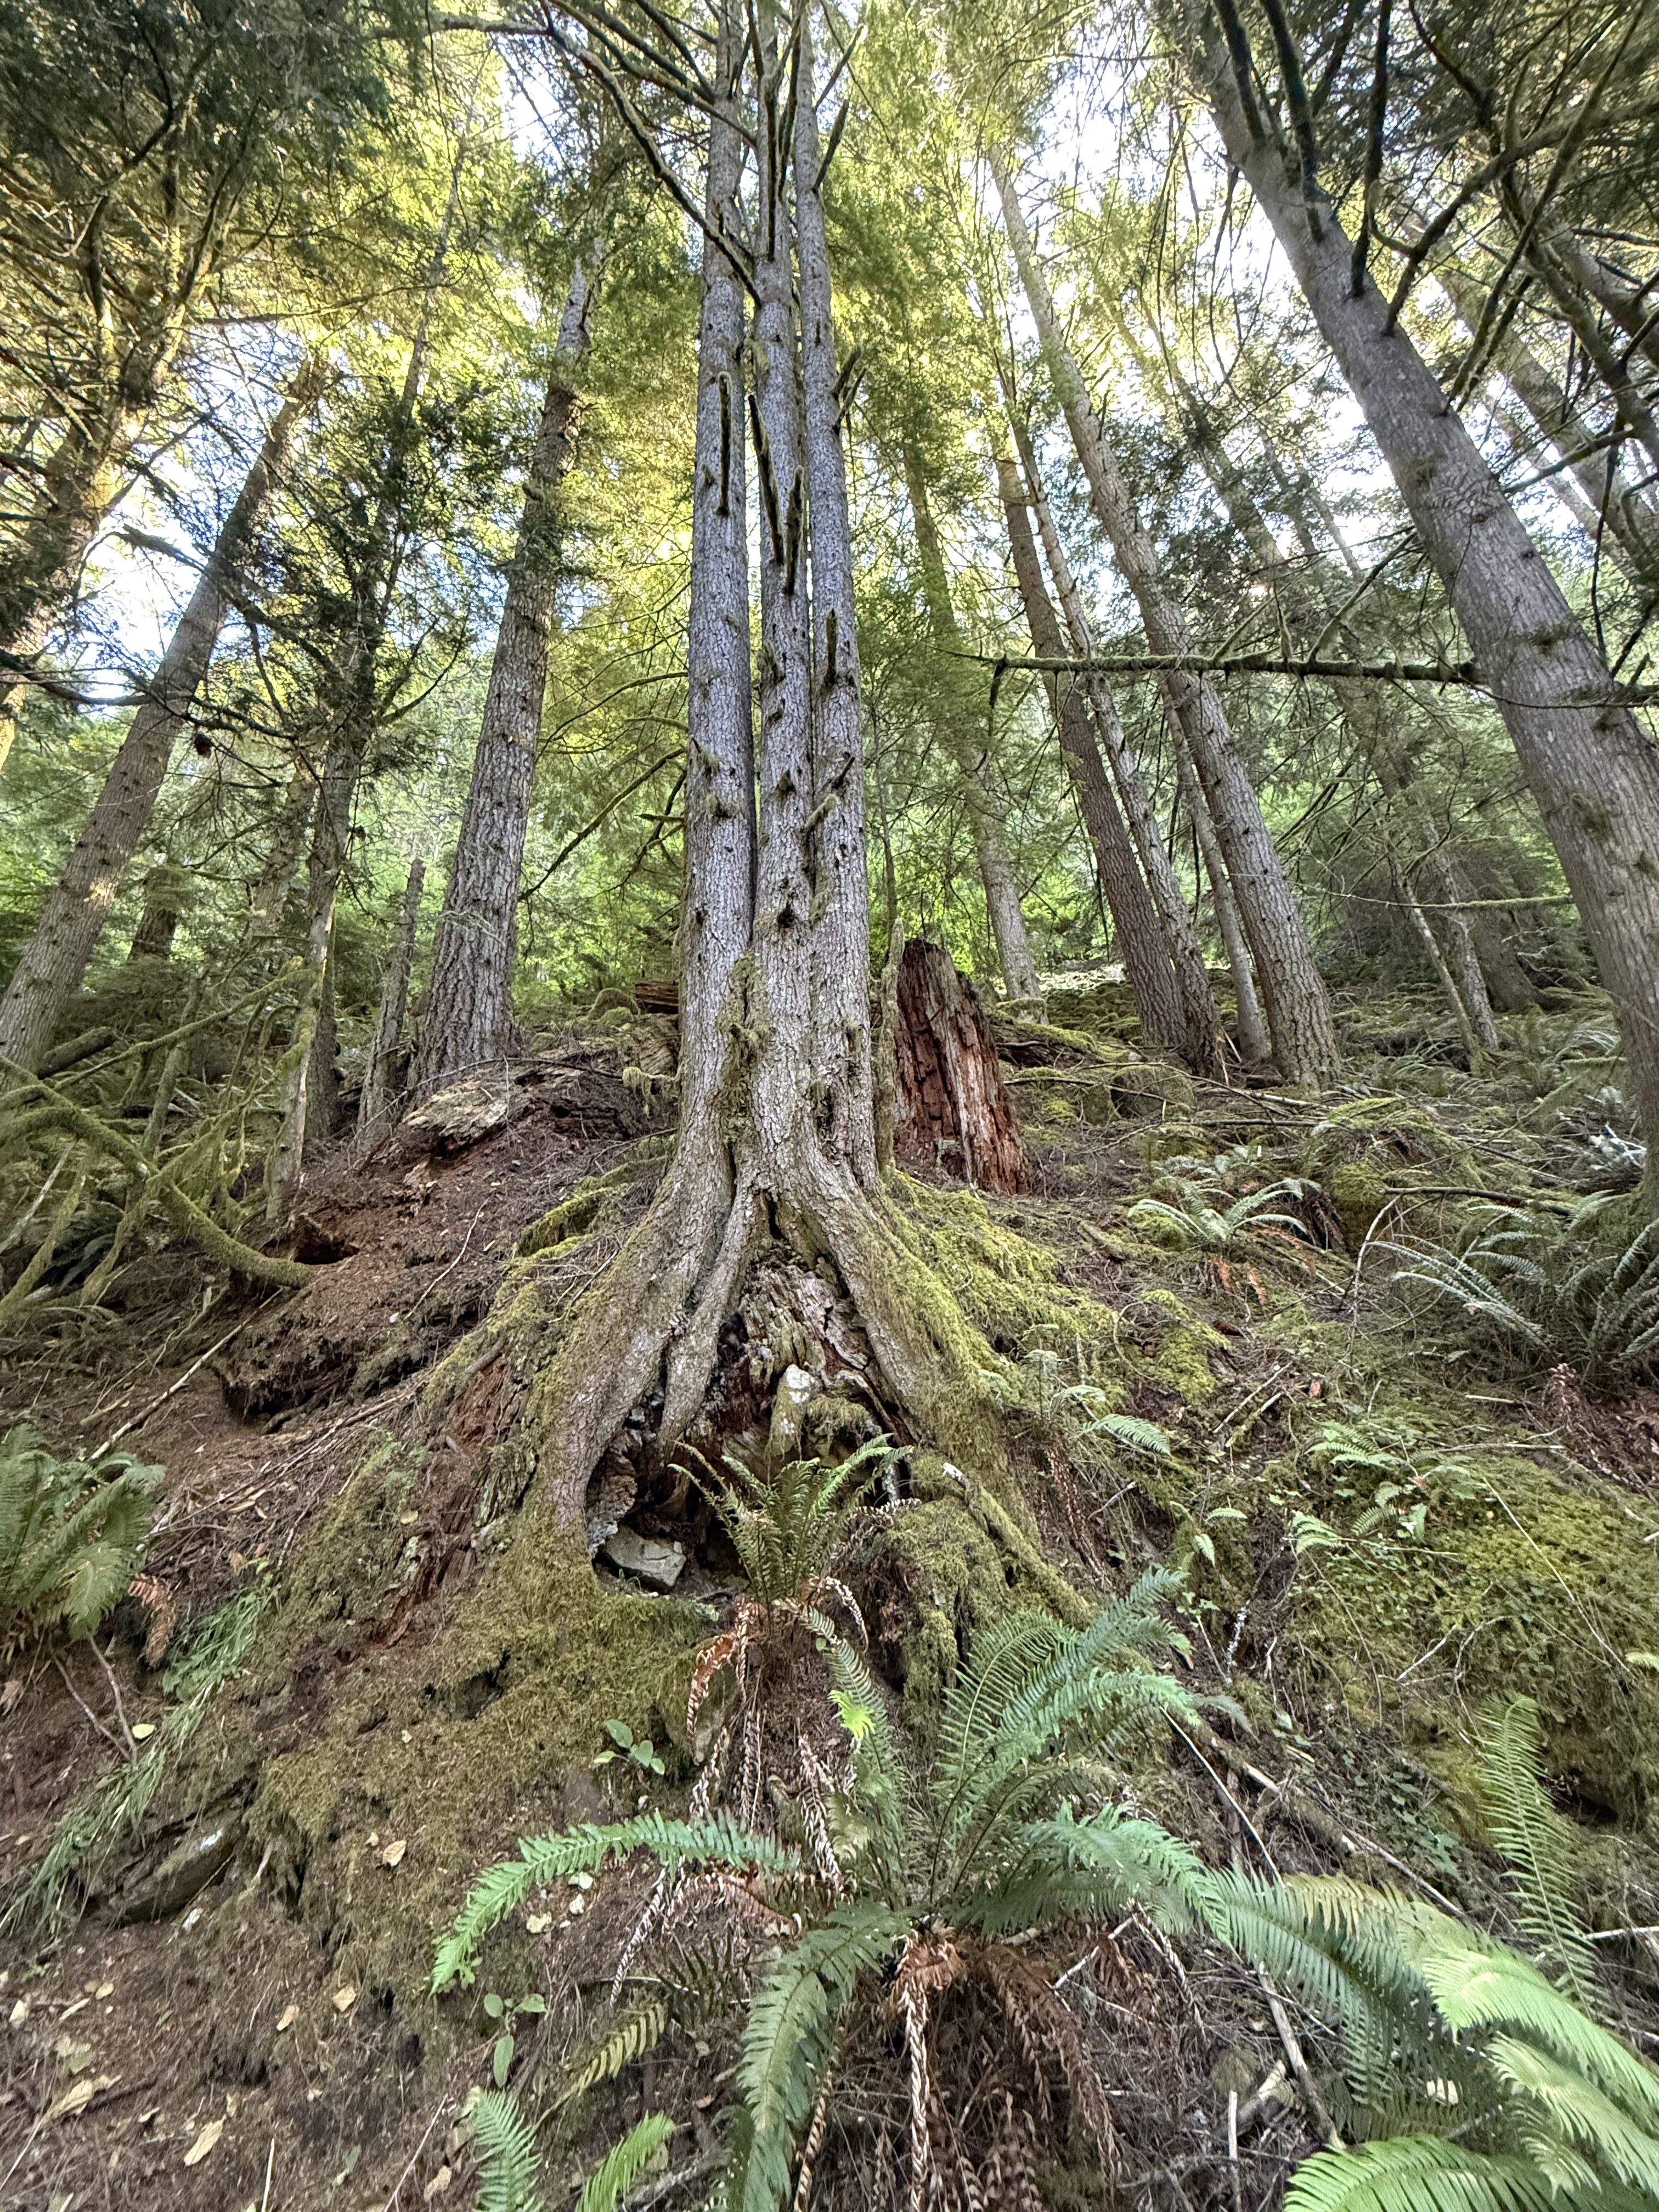
Plate 13. This is the first triplet I’ve seen from a nurse log. These young hemlocks will certainly compete for sun and nutrients. There can be only one survivor.
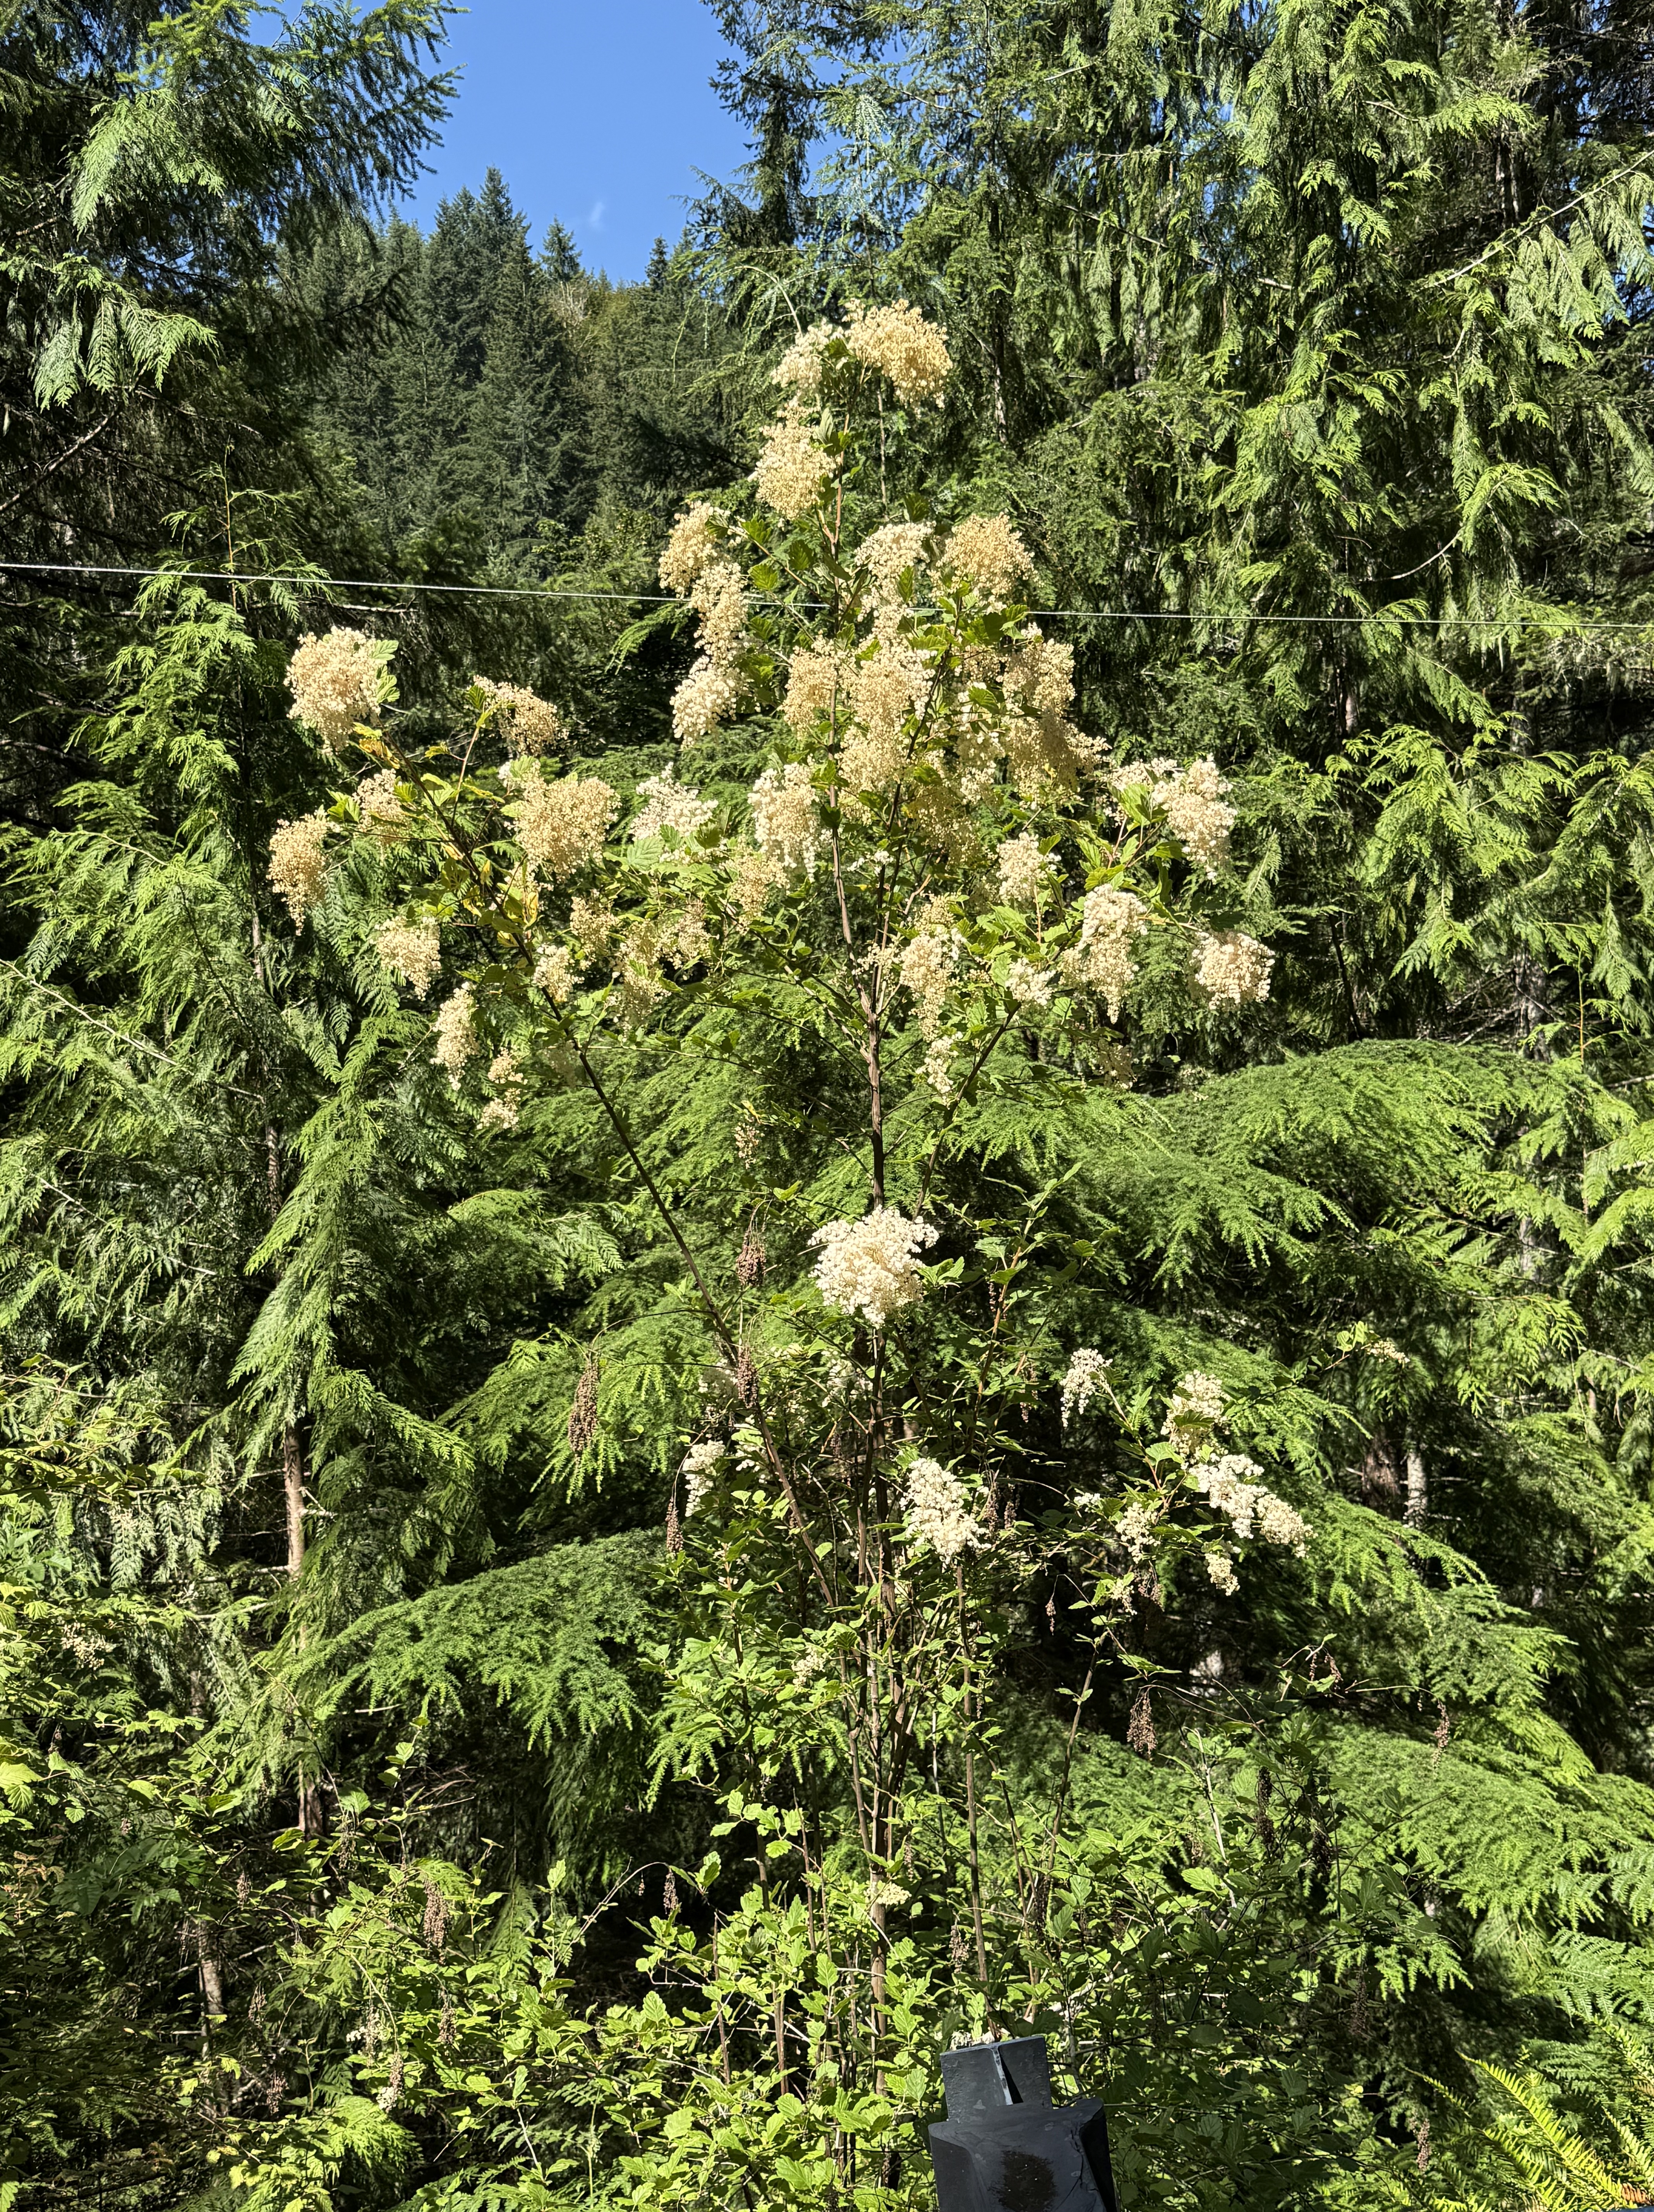
Plate 14. I thought this was cow parsnip, but CoPilot identified it as ocean spray (Holodiscus discolor). The white flowers were all I needed to see, but this tall, woody shrub (6-12 feet) is completely different from the weed in Plate 4.
Final Thoughts
The only thing I can add to the photos is that Carbon River is part of a transitional ecosystem, not unlike Mima Mounds. I Imagine this borderland environment is also alternating between a lowland/prairie and an upland/conifer forest, depending on conditions. However, much to my disappointment, the plants here were different from those we saw before. Furthermore, there were far more species along the Carbon River corridor. We were fortunate to visit when many of the flowers were in bloom.
I enjoy taking pictures of flora and learning about the ecosystem, but this is too complex for me. I’m only a simple geologist.
Geology of Carbon River Canyon, Pierce County, Washington
Today’s post reports on a brief survey of various geological features and processes that are revealed in a river that originates on the NW flank of Mt. Rainier. We’ll look at the types of rock found along its course, morphologic features, and discuss the processes that have created this natural area. We’ll also see some unintended consequences of deforestation.
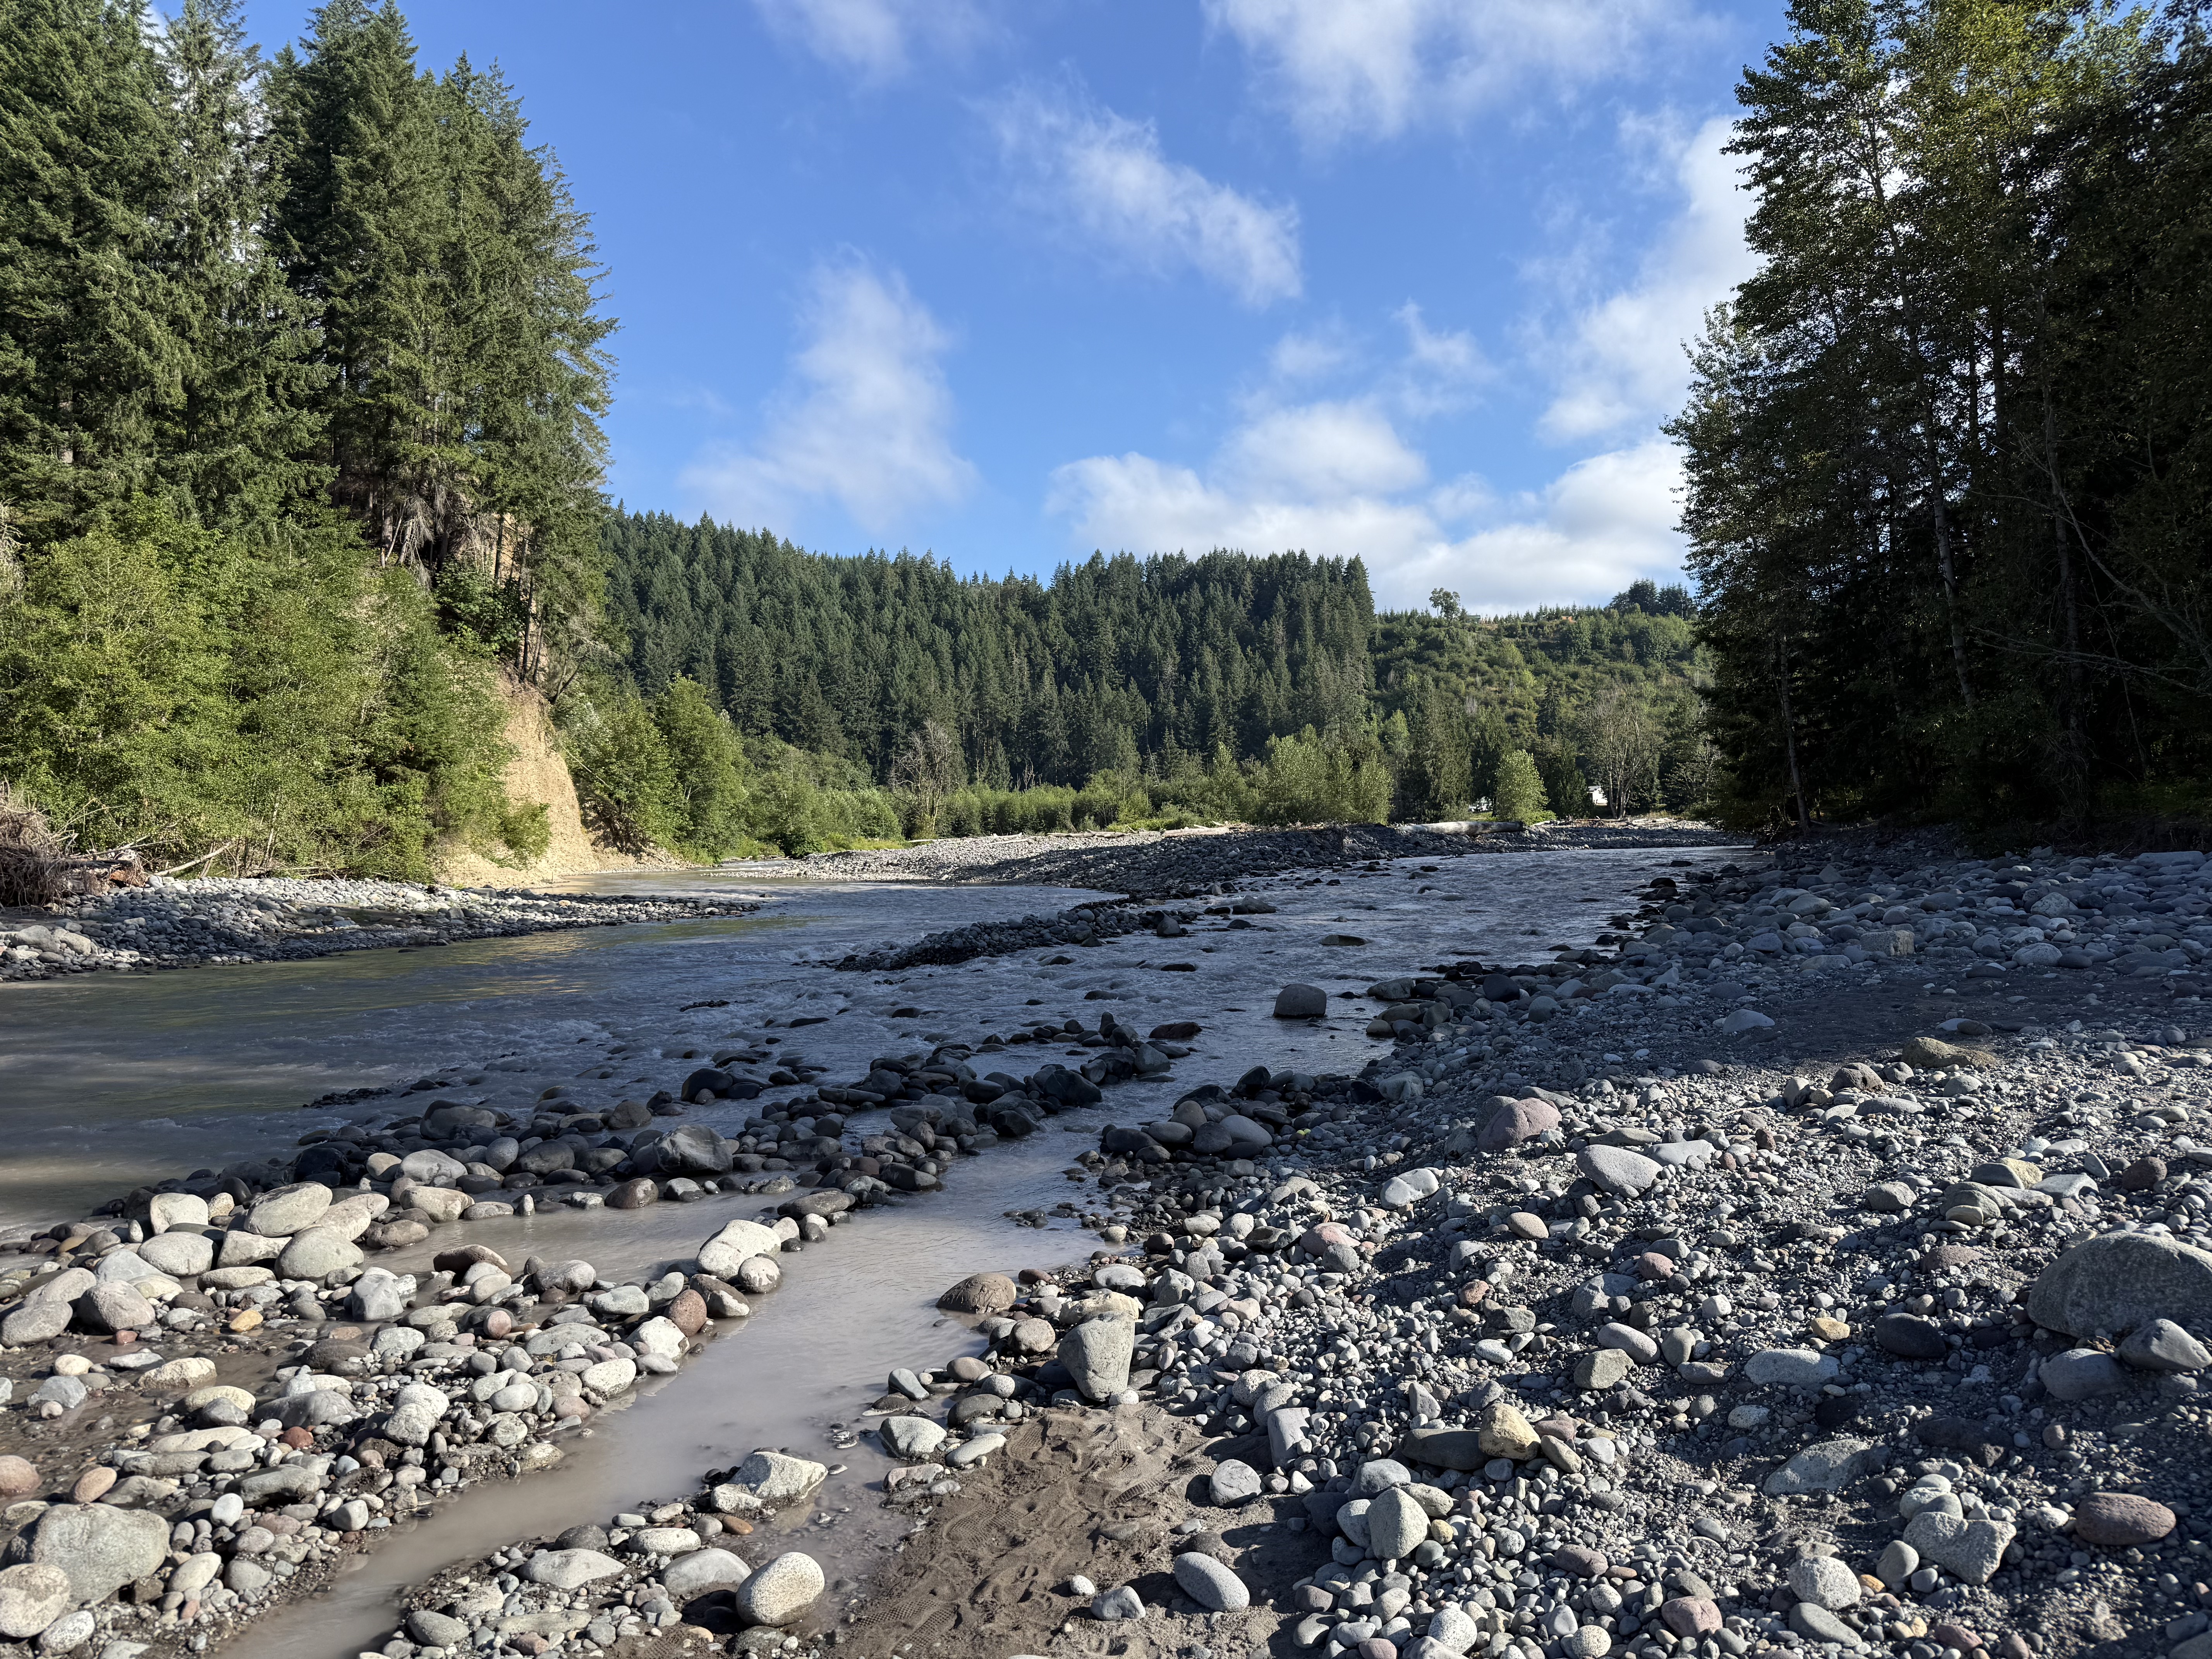
Figure 1. Carbon River flows northerly before joining the Puyallup River and emptying into Commencement Bay, in Tacoma. This stretch is dominated by boulders up to a foot in diameter. However, the water is unusually muddy; we’ll find out why during our walk three-miles up the canyon that contains the stream.
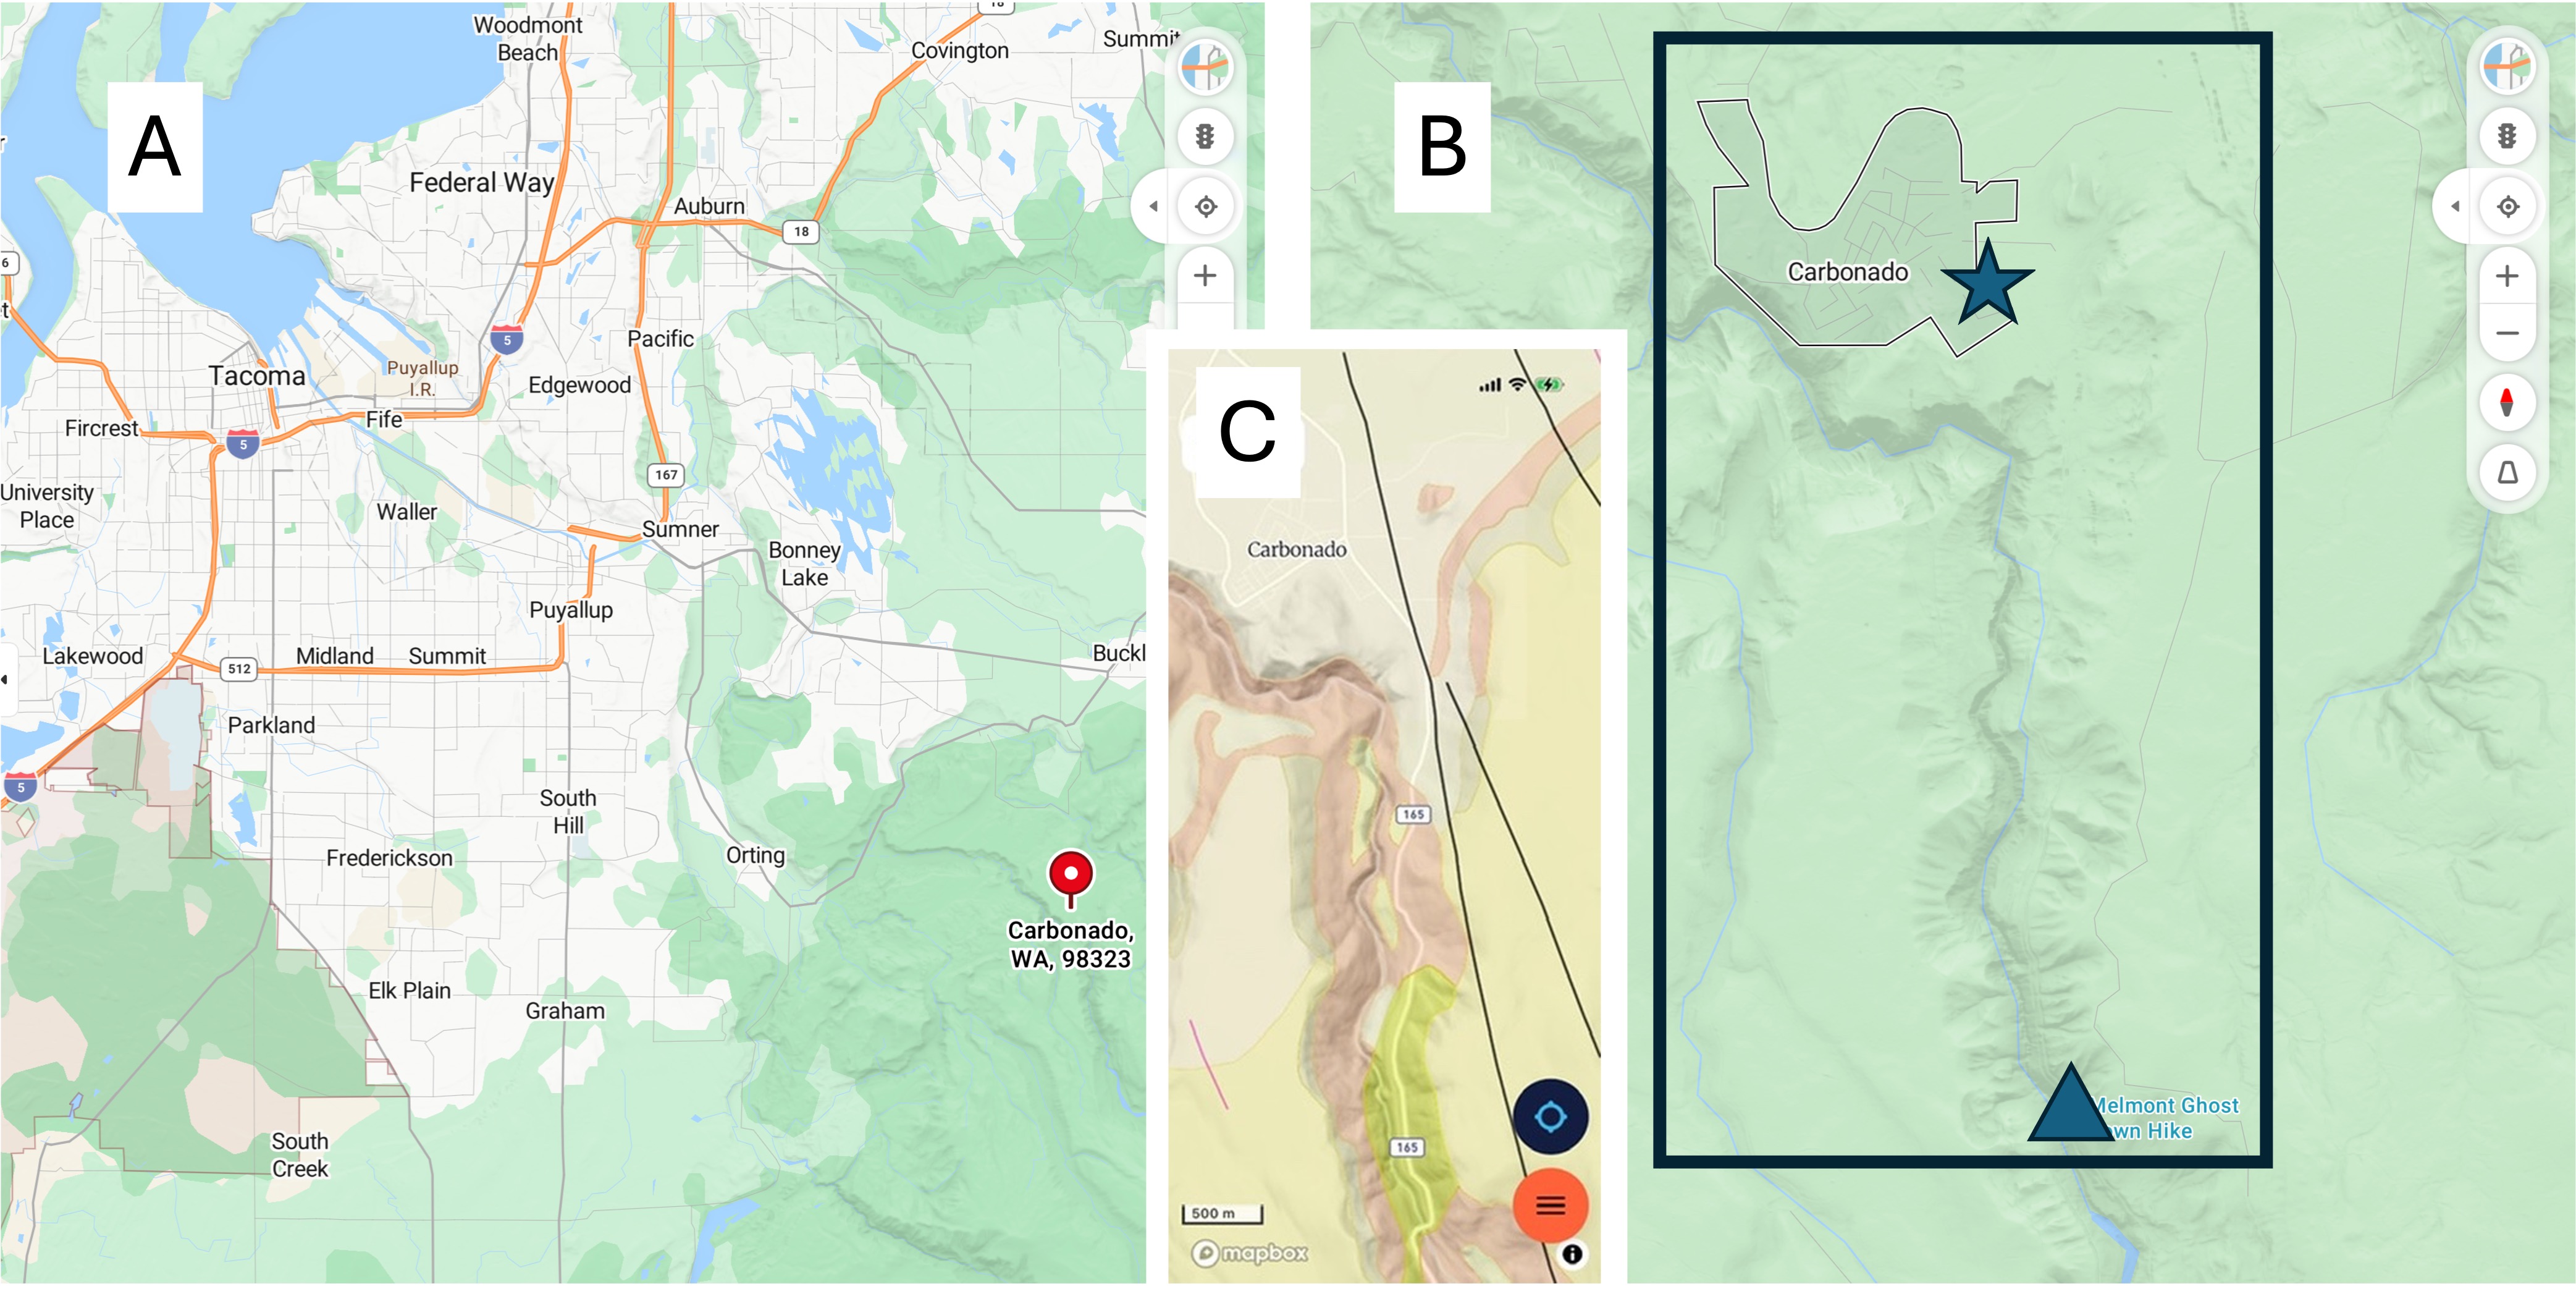
Figure 2. (A) Regional map, showing Carbonado (pinned), a forty-five minute drive from North Tacoma. (B) Local map showing the Carbon River, which we followed for three miles. The river has cut a gorge that begins at Carbonado (star) and deepens to 250-300 feet at Fairfax bridge (triangle). (C) The geologic map from RockD reveals four major rock formations: the tan, which dominates around Carbonado is glacial drift, mostly sand and gravel; The pink outlining the river is Eocene (56-33.9 Ma) sedimentary rocks of terrestrial origin – rivers, lakes, etc; the yellow is Miocene-Oligocene (~23 Ma) fine-grained andesite. Additionally, the yellowish unit on both sides of the river is Pleistocene (2.5 Ma to 12 Ka) glacial drift. We didn’t see any of that today.
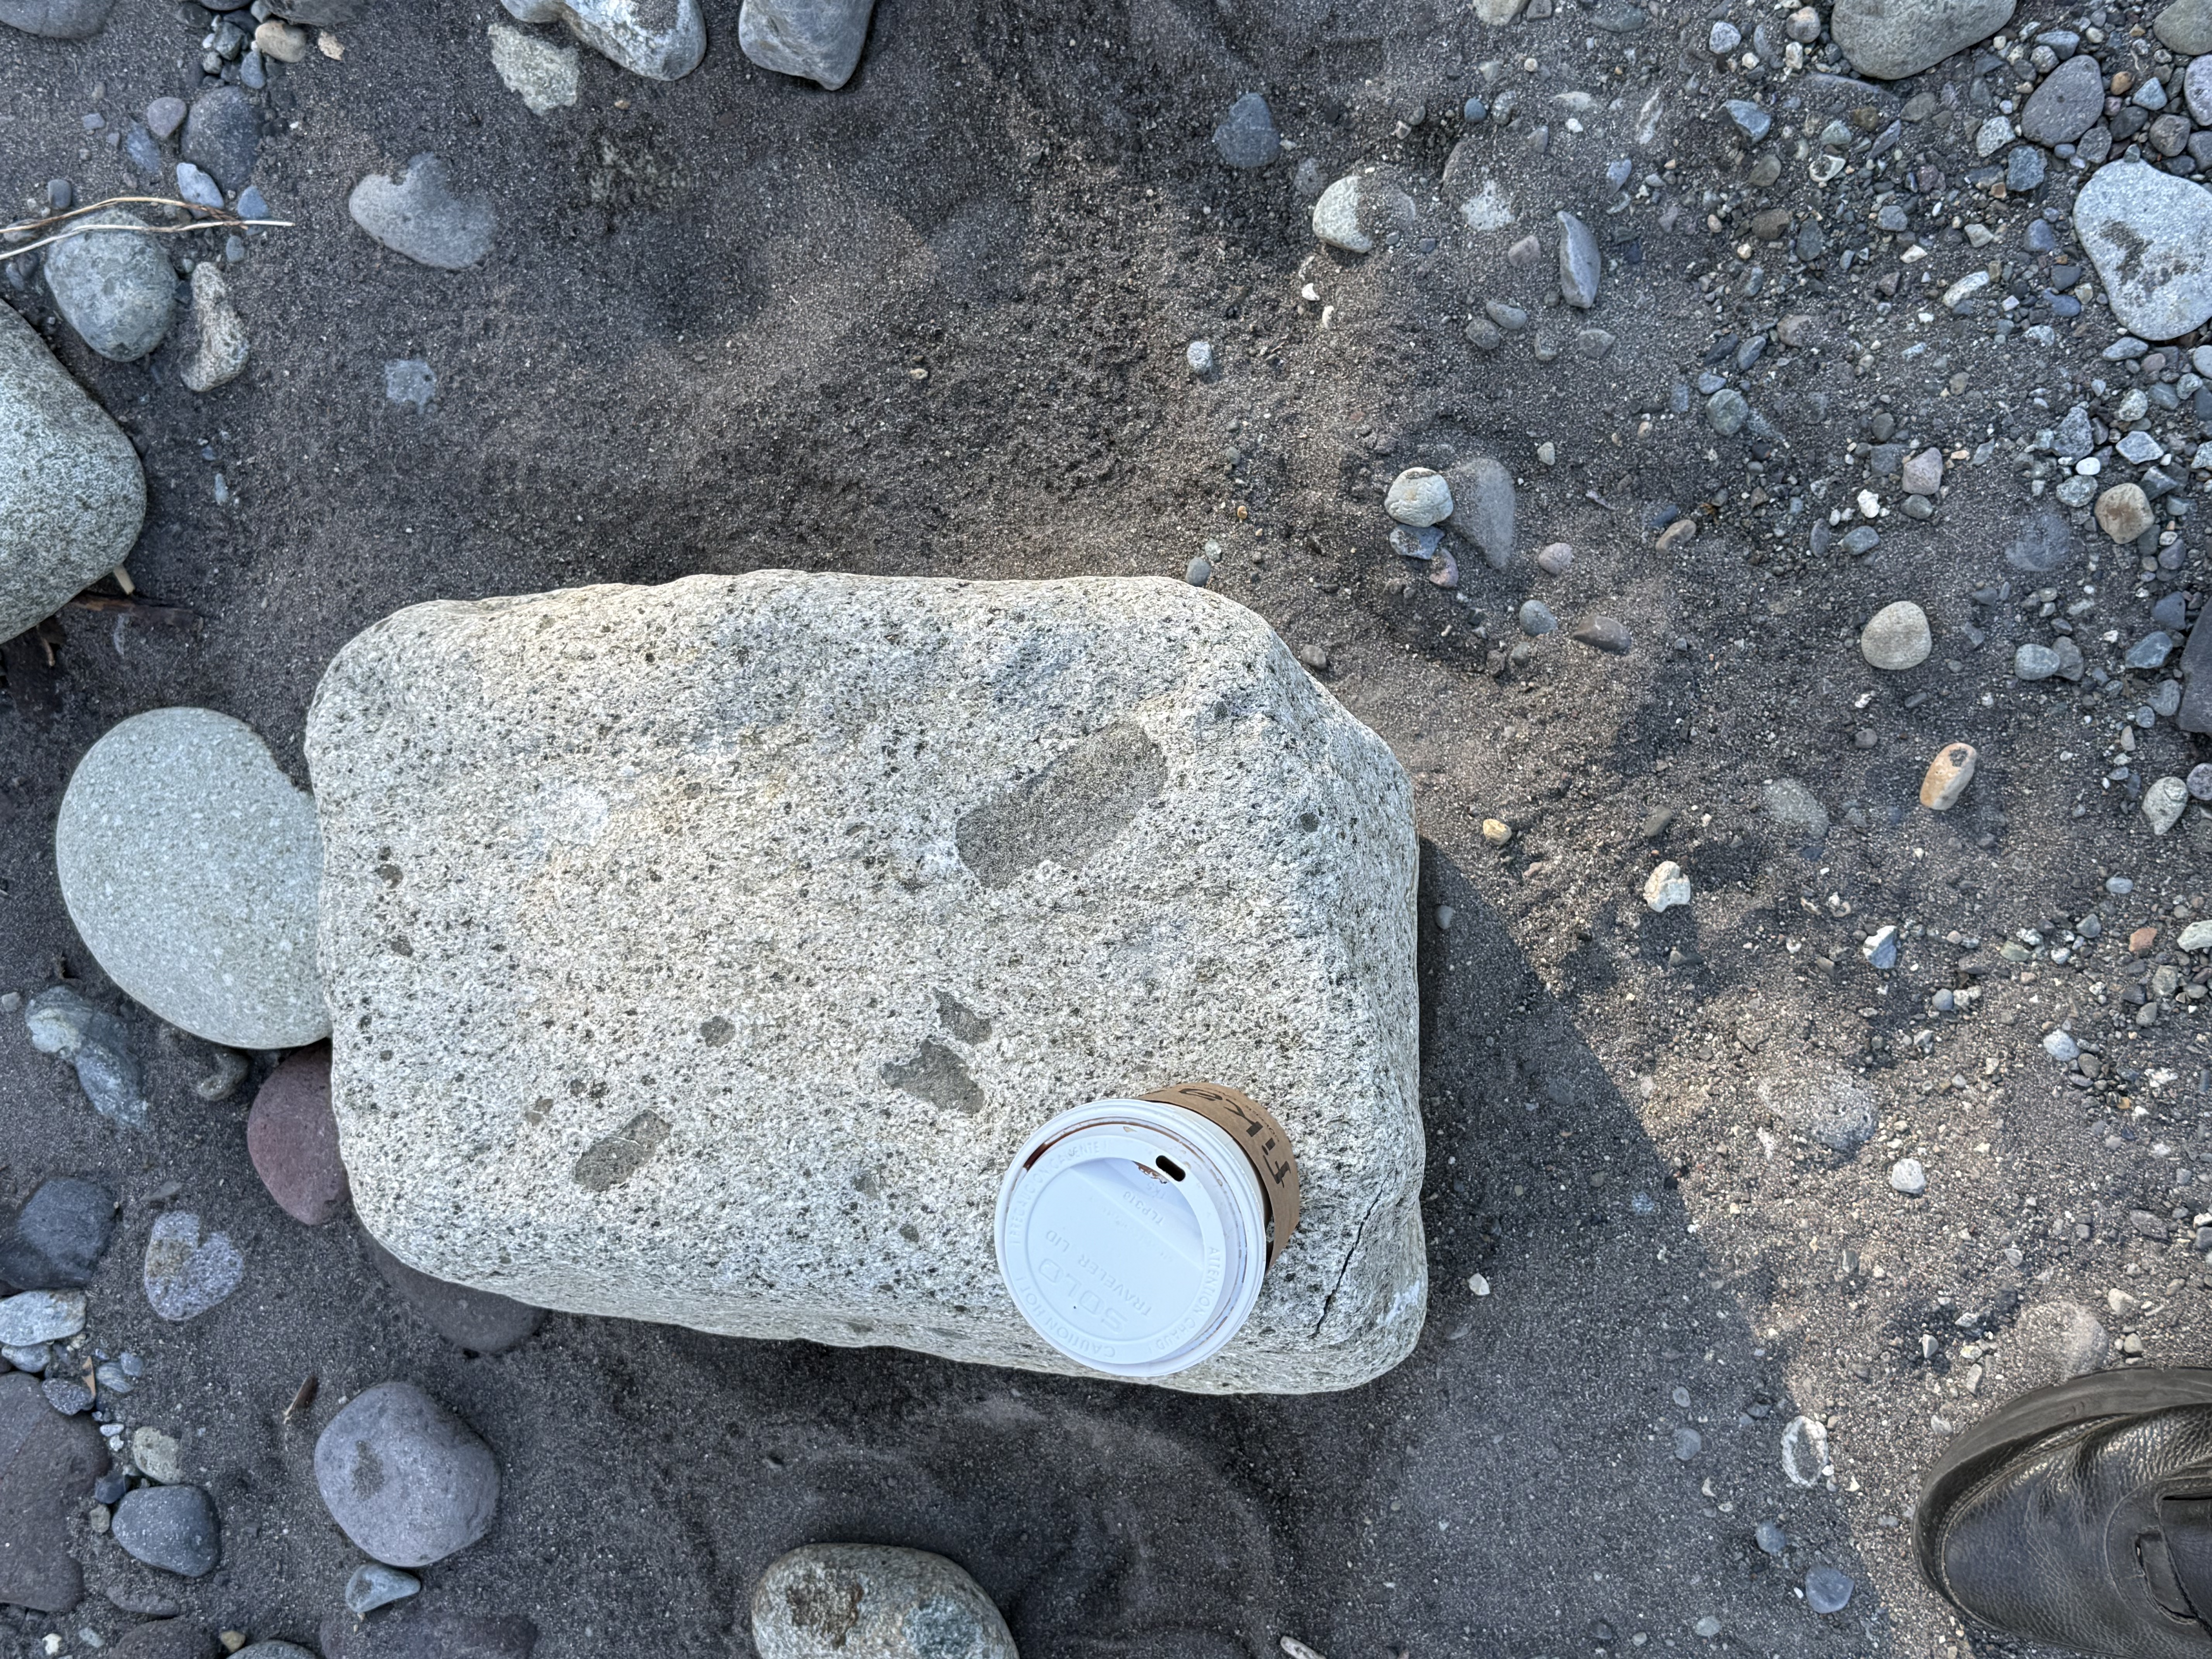
Figure 2. Our first stop was along the Carbon River near Orting (see Fig. 1A for location). River beds can be an excellent source of regional geology if they contain cobbles or boulders, which are good samples of source rock that may not be exposed.
This sample is of an intrusive igneous rock that contains lithic fragments (xenocrysts) of what looks like a darker, fine-grained rock. As magma moves upward through the crust, pieces of country rock are entrained, sometimes partially melting, but more often simple being captured by the cooling magma. This sample contains pieces of what I think is andesite. The host rock itself is probably also andesite, but its surface has been chemically weathered to form a white layer; this is a chemical process that involves the alteration of dark minerals like pyroxene and plagioclase into clays like kaolinite, which are light colored. Surface weathering also leeches out iron and magnesium, which darken a rock. This surface layer is usually only a few millimeters thick.
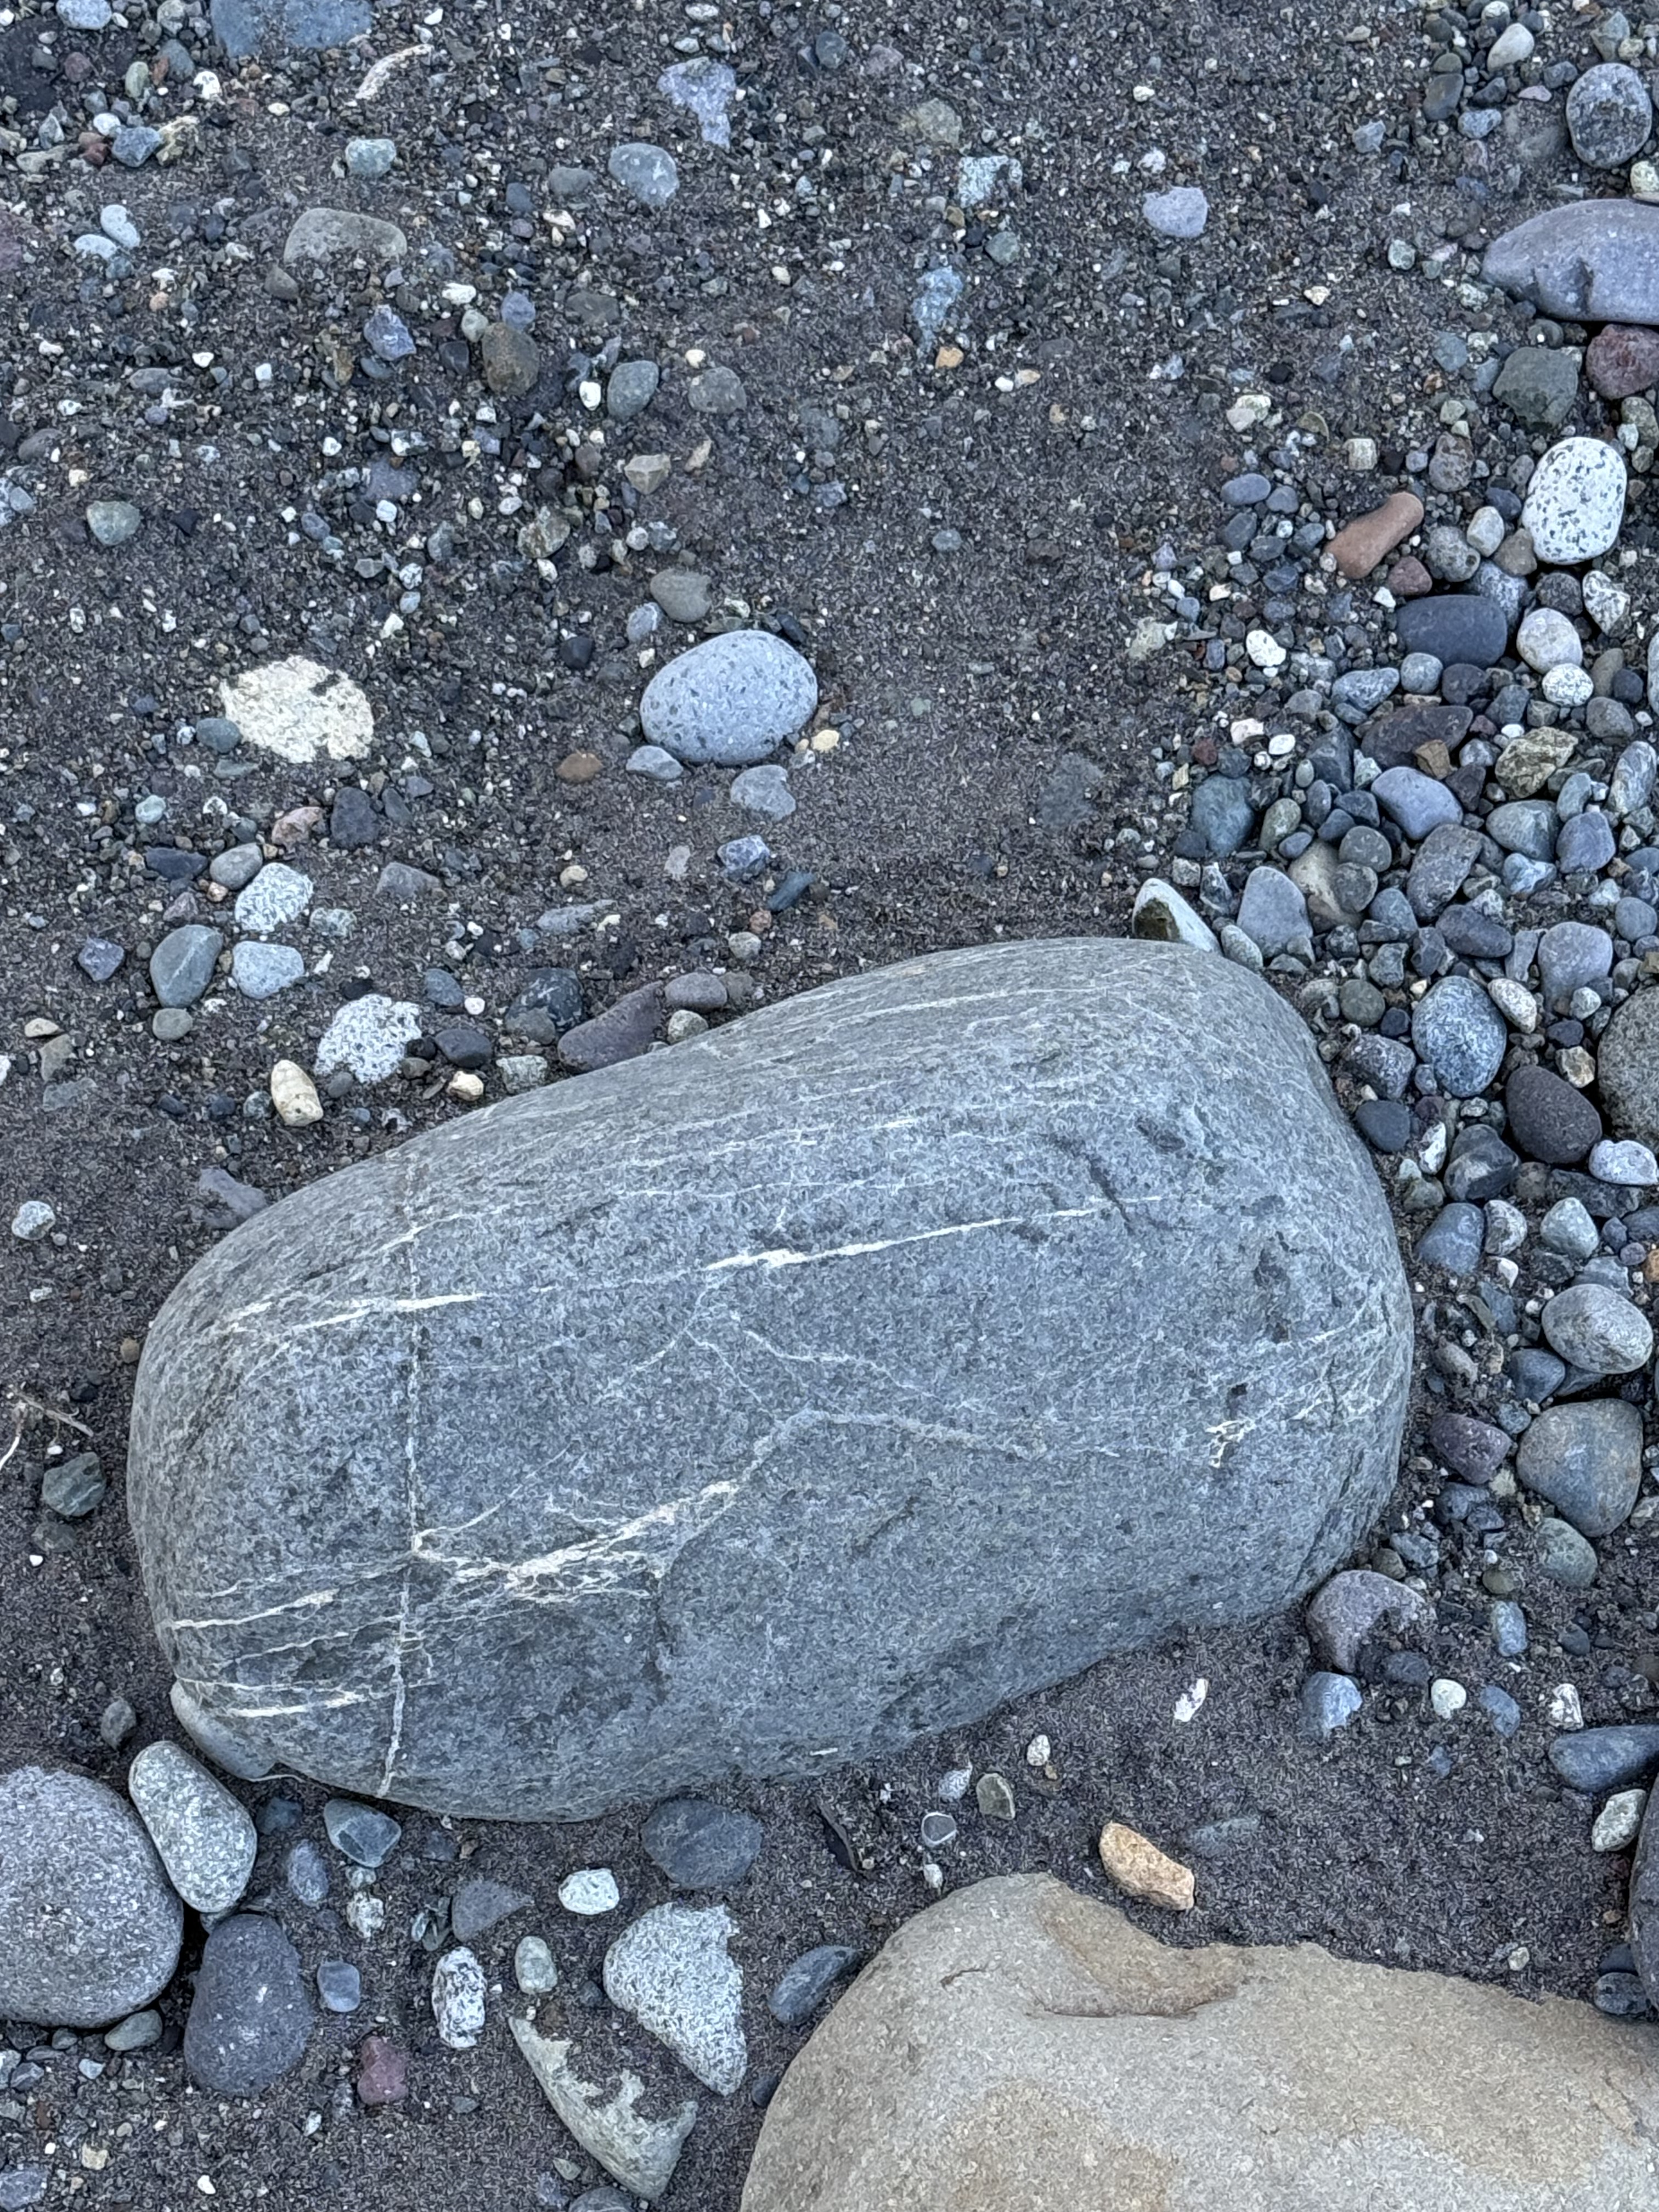
Figure 3. This sample tells a complex story. This is andesite (extrusive rock common to subduction zones), but any fractures within it were filled with magmatic fluids rich in Na, Ca and silica, by a later eruption. The result of this hydrothermal circulation is rocks that are neither extrusive nor intrusive; they are chemically altered by subsequent injections of magma at depths less than 1 mile, often even shallower.
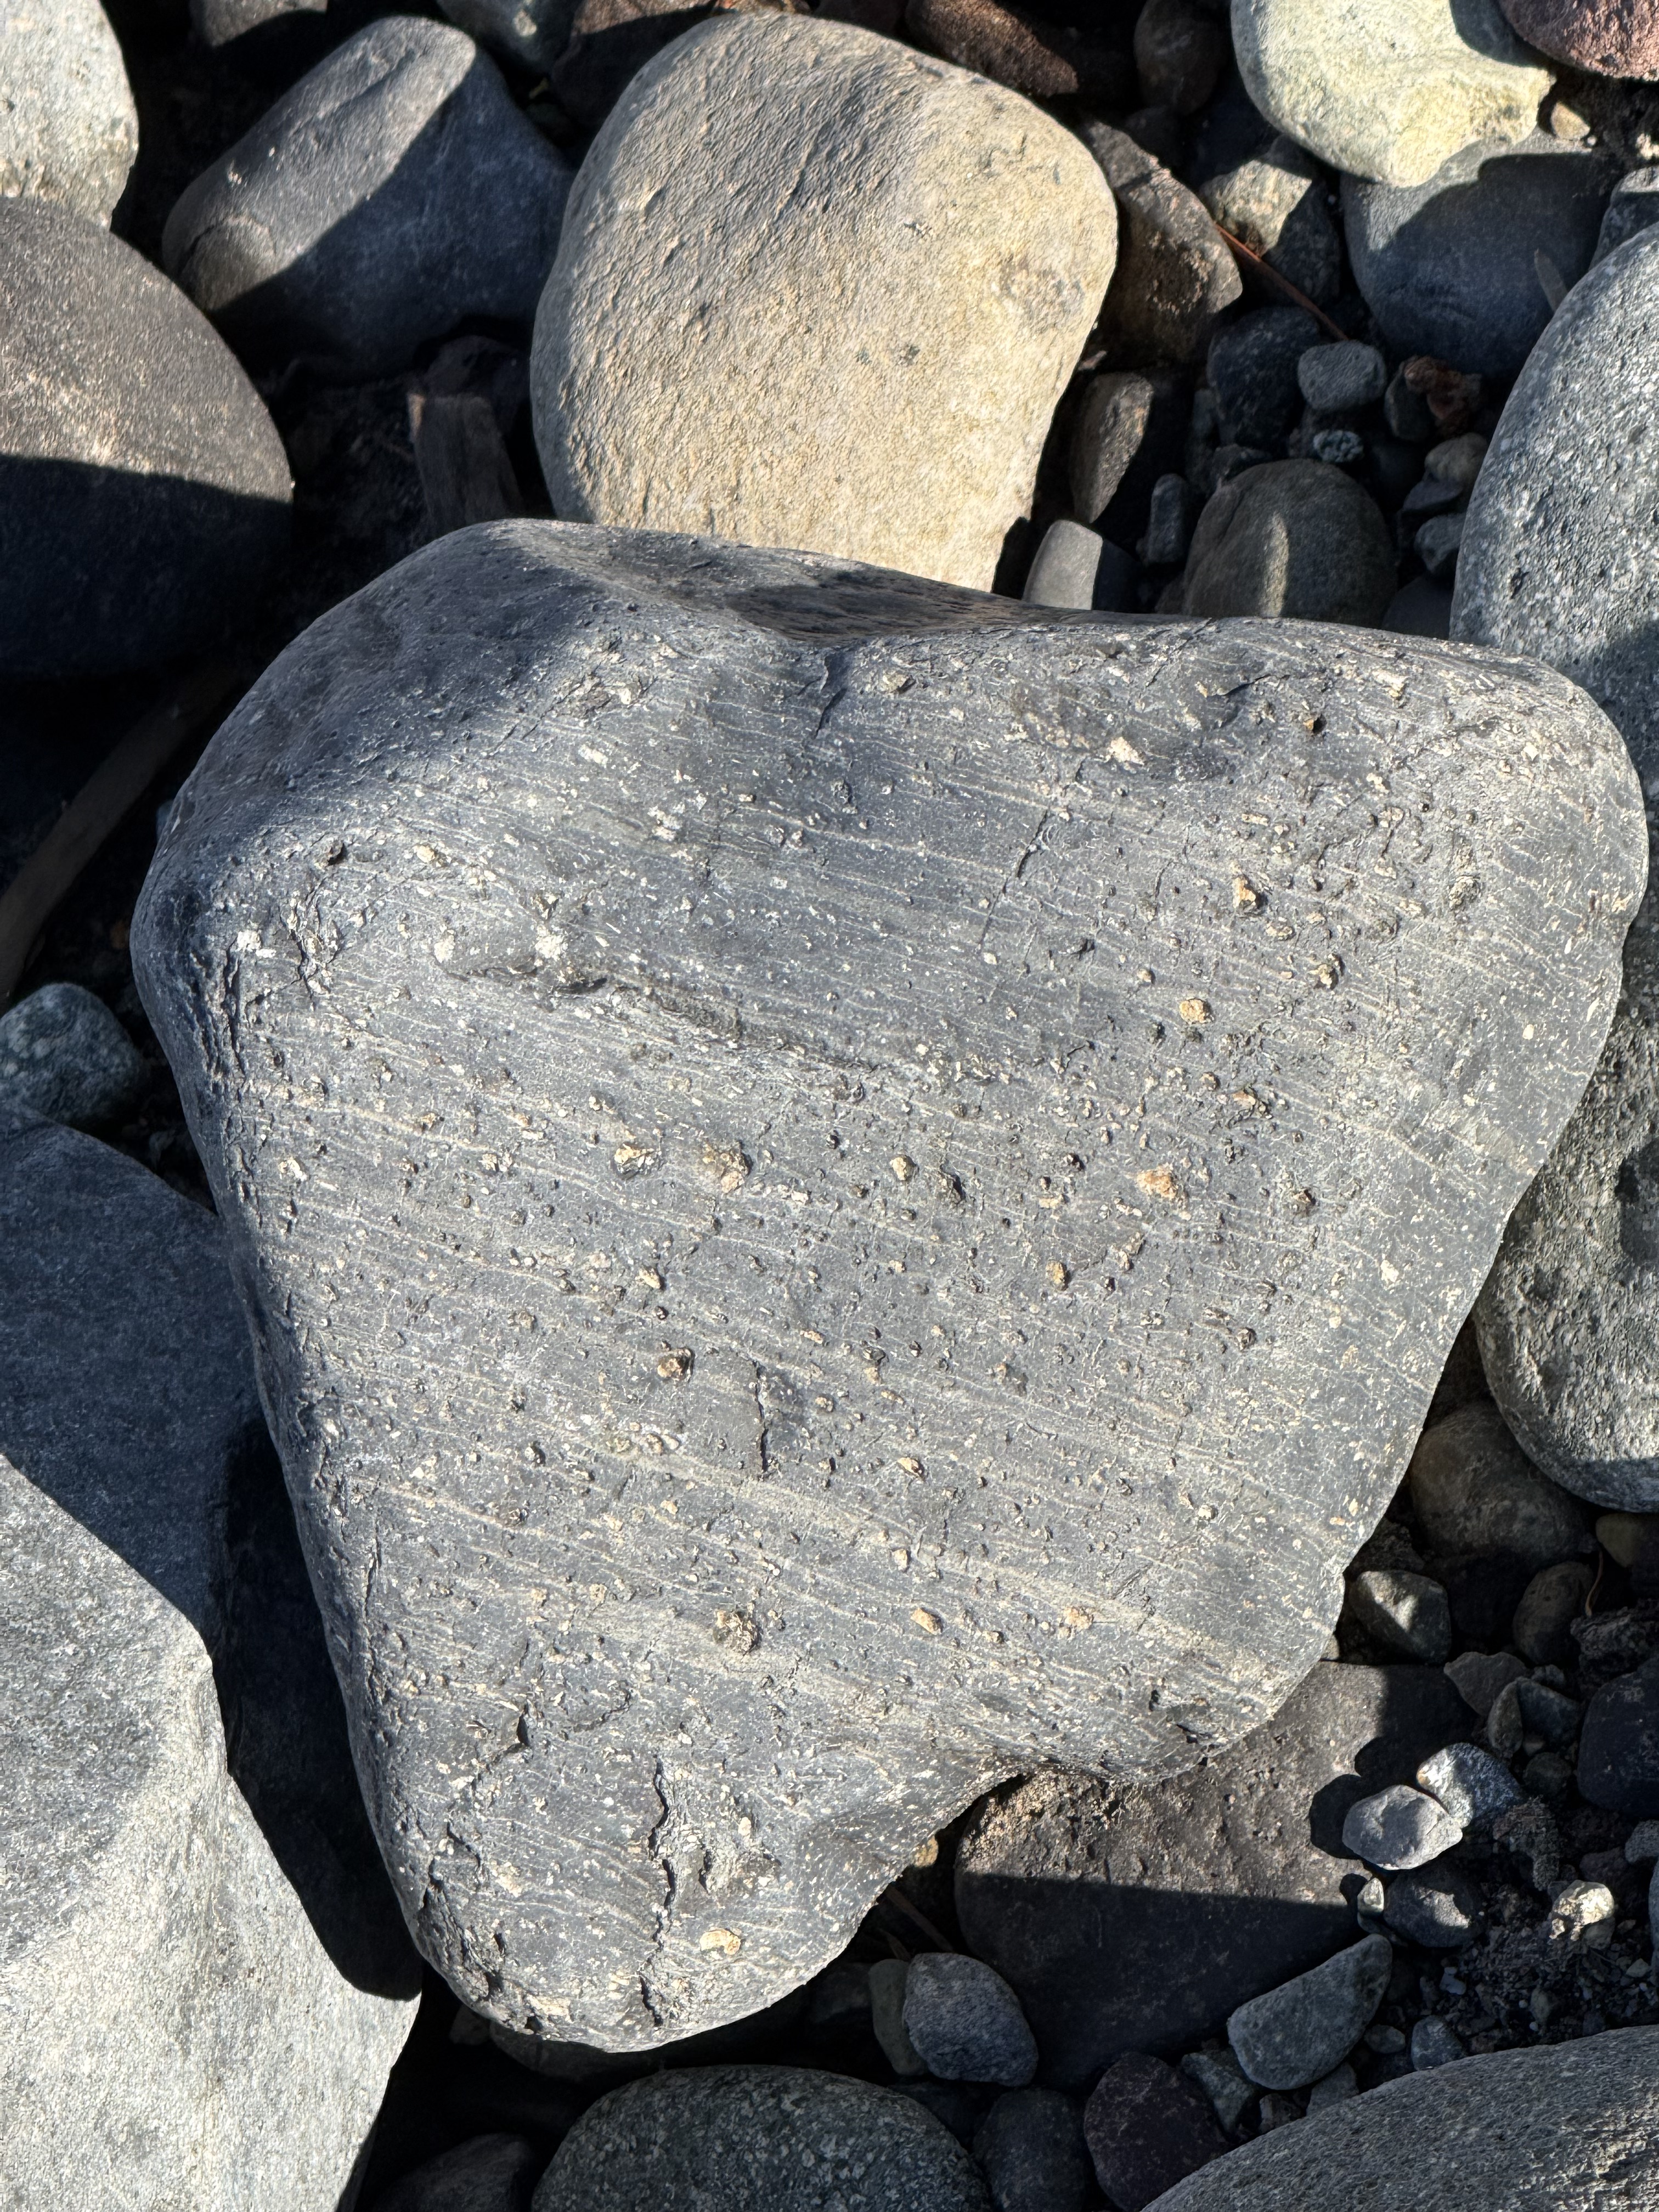
Figure 4. Another fascinating example, which tells a different tale. This andesite block wasn’t injected with magmatic fluids beneath the surface; this sample is the result of gaseous magma erupting within a few hundred yards of a vent. The laminae tell us that the composition was changing subtly on short time scales; this was the top of the boiling magma, and thus there was a lot of trapped gas (e.g. CO2, H2S) that formed the vesicles after the lava had settled–but not yet solidified.
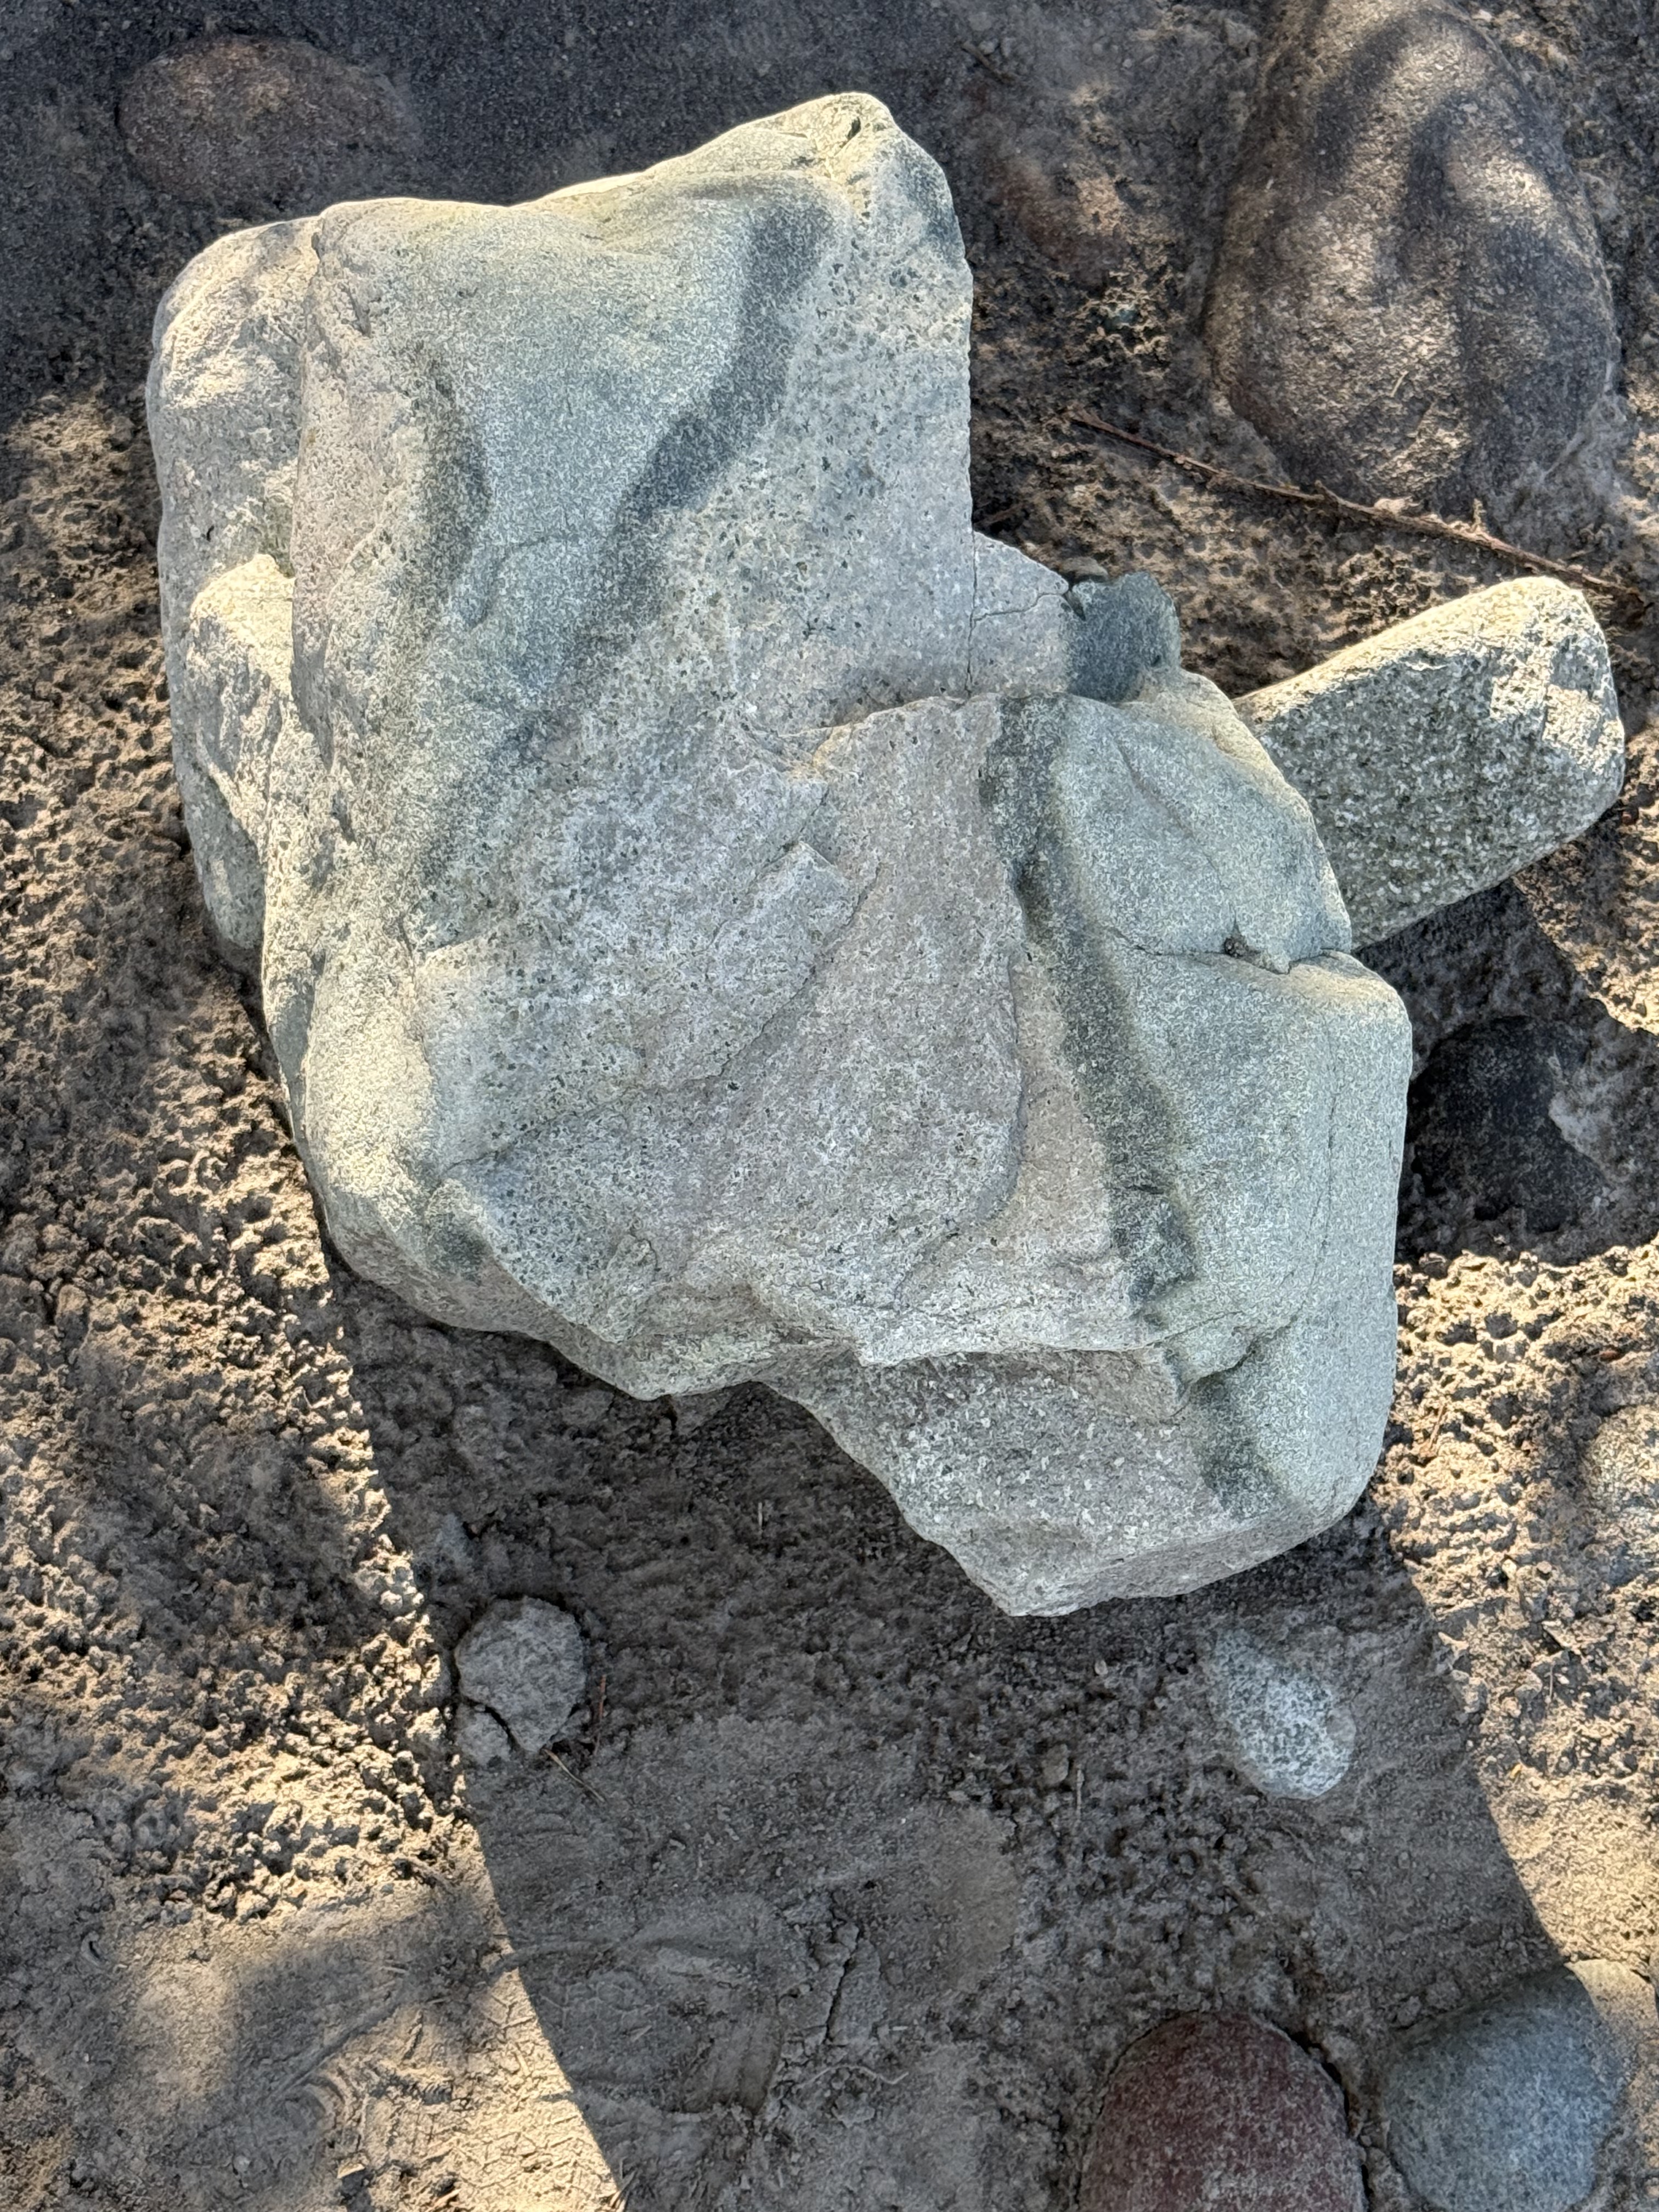
Figure 5. This irregular sample of andesite tells two stories: 1) The presence of phenocrysts (small white blebs at the bottom of the sample) implies slow cooling whereas the dark streaks imply a later stage of fast cooling, so that magmatic fluids with slightly different composition intermingled with the already hardening earlier stage. Imagine making taffy. 2) This sample wasn’t transported in the Carbon River more than a few miles. It would have broken along internal planes of weakness and become more like those we saw above. We aren’t far from the source.
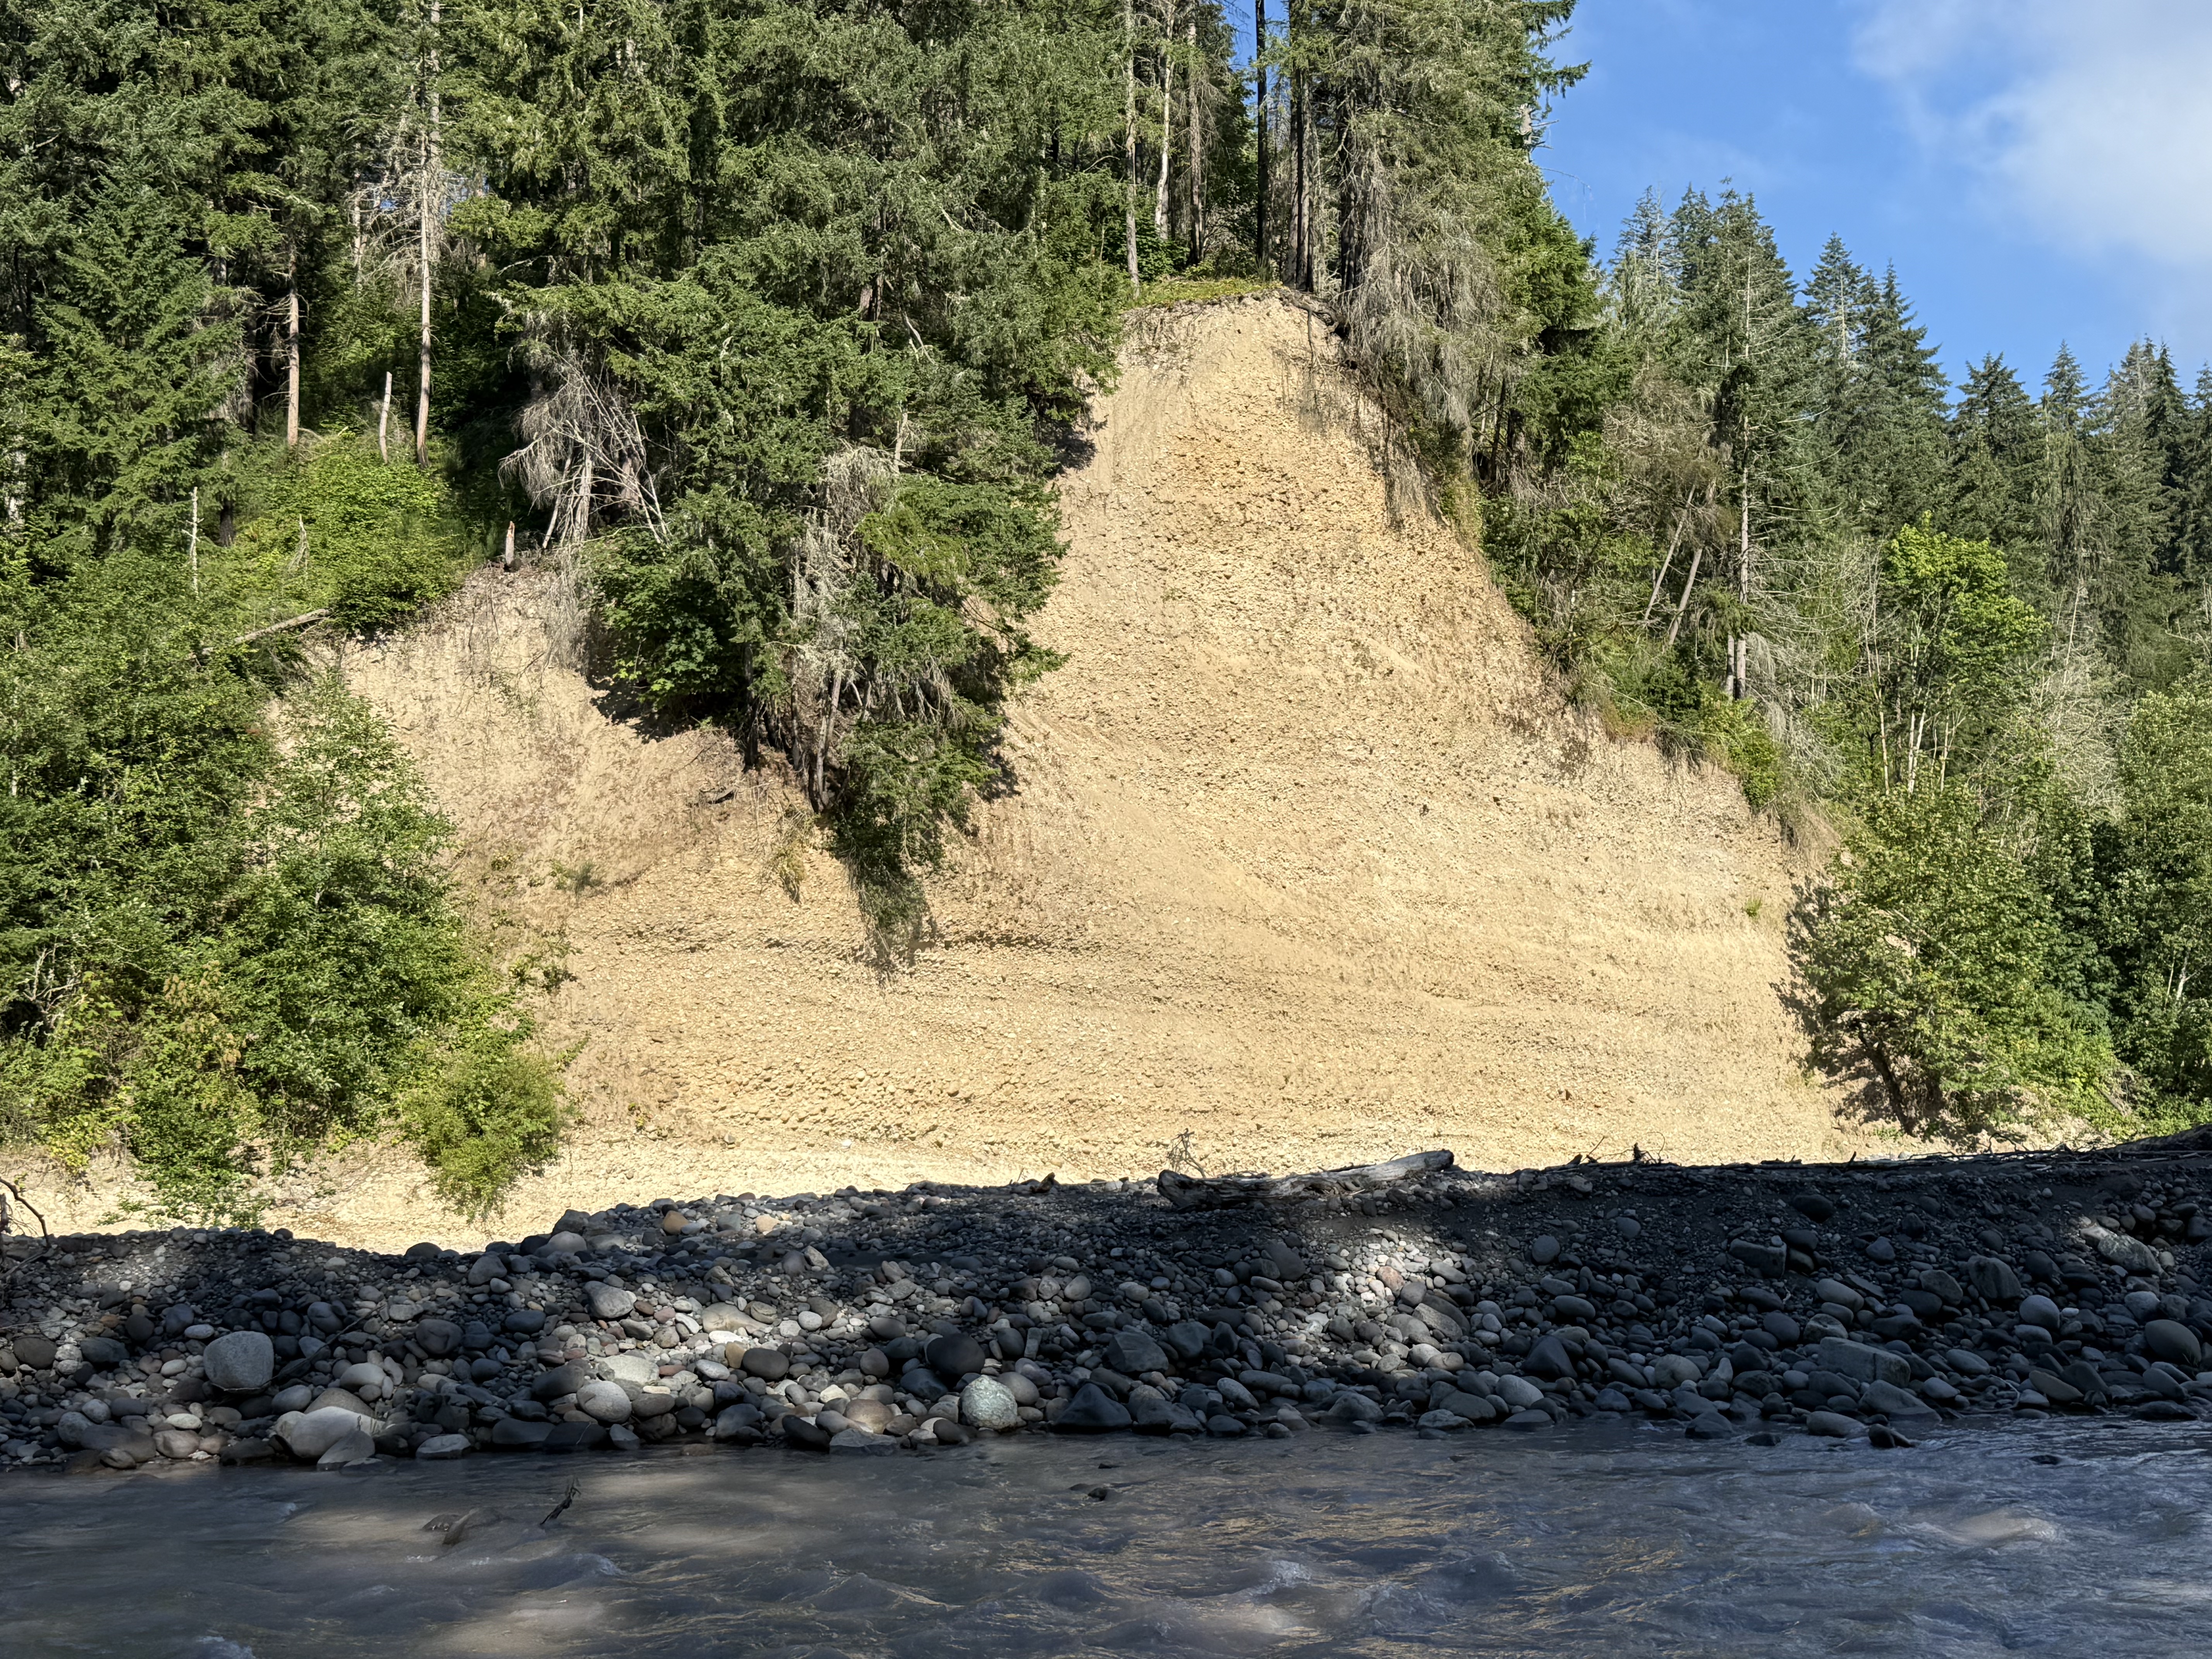
Figure 6. This is an excellent exposure in a cliff cut by the Carbon River. It could be dismissed as undifferentiated glacial till, but I’d like to give it a second thought: What if this location records the movement of continental glaciers through Puget Sound (i.e. the Vashon till), in addition to alpine glaciers moving down from the Cascades? Could we even tell the difference?
The bottom of this section contains cobbles in a sandy matrix deposited horizontally. The middle part is finer, as seen in the absence of large cobbles, but a channel containing larger clasts is visible in the center of the photo, forming a “V” that points towards the bright spot in the modern channel, slightly right of the center of the photo. The depositional environment must have changed quickly to produce such a contrast in lithology.
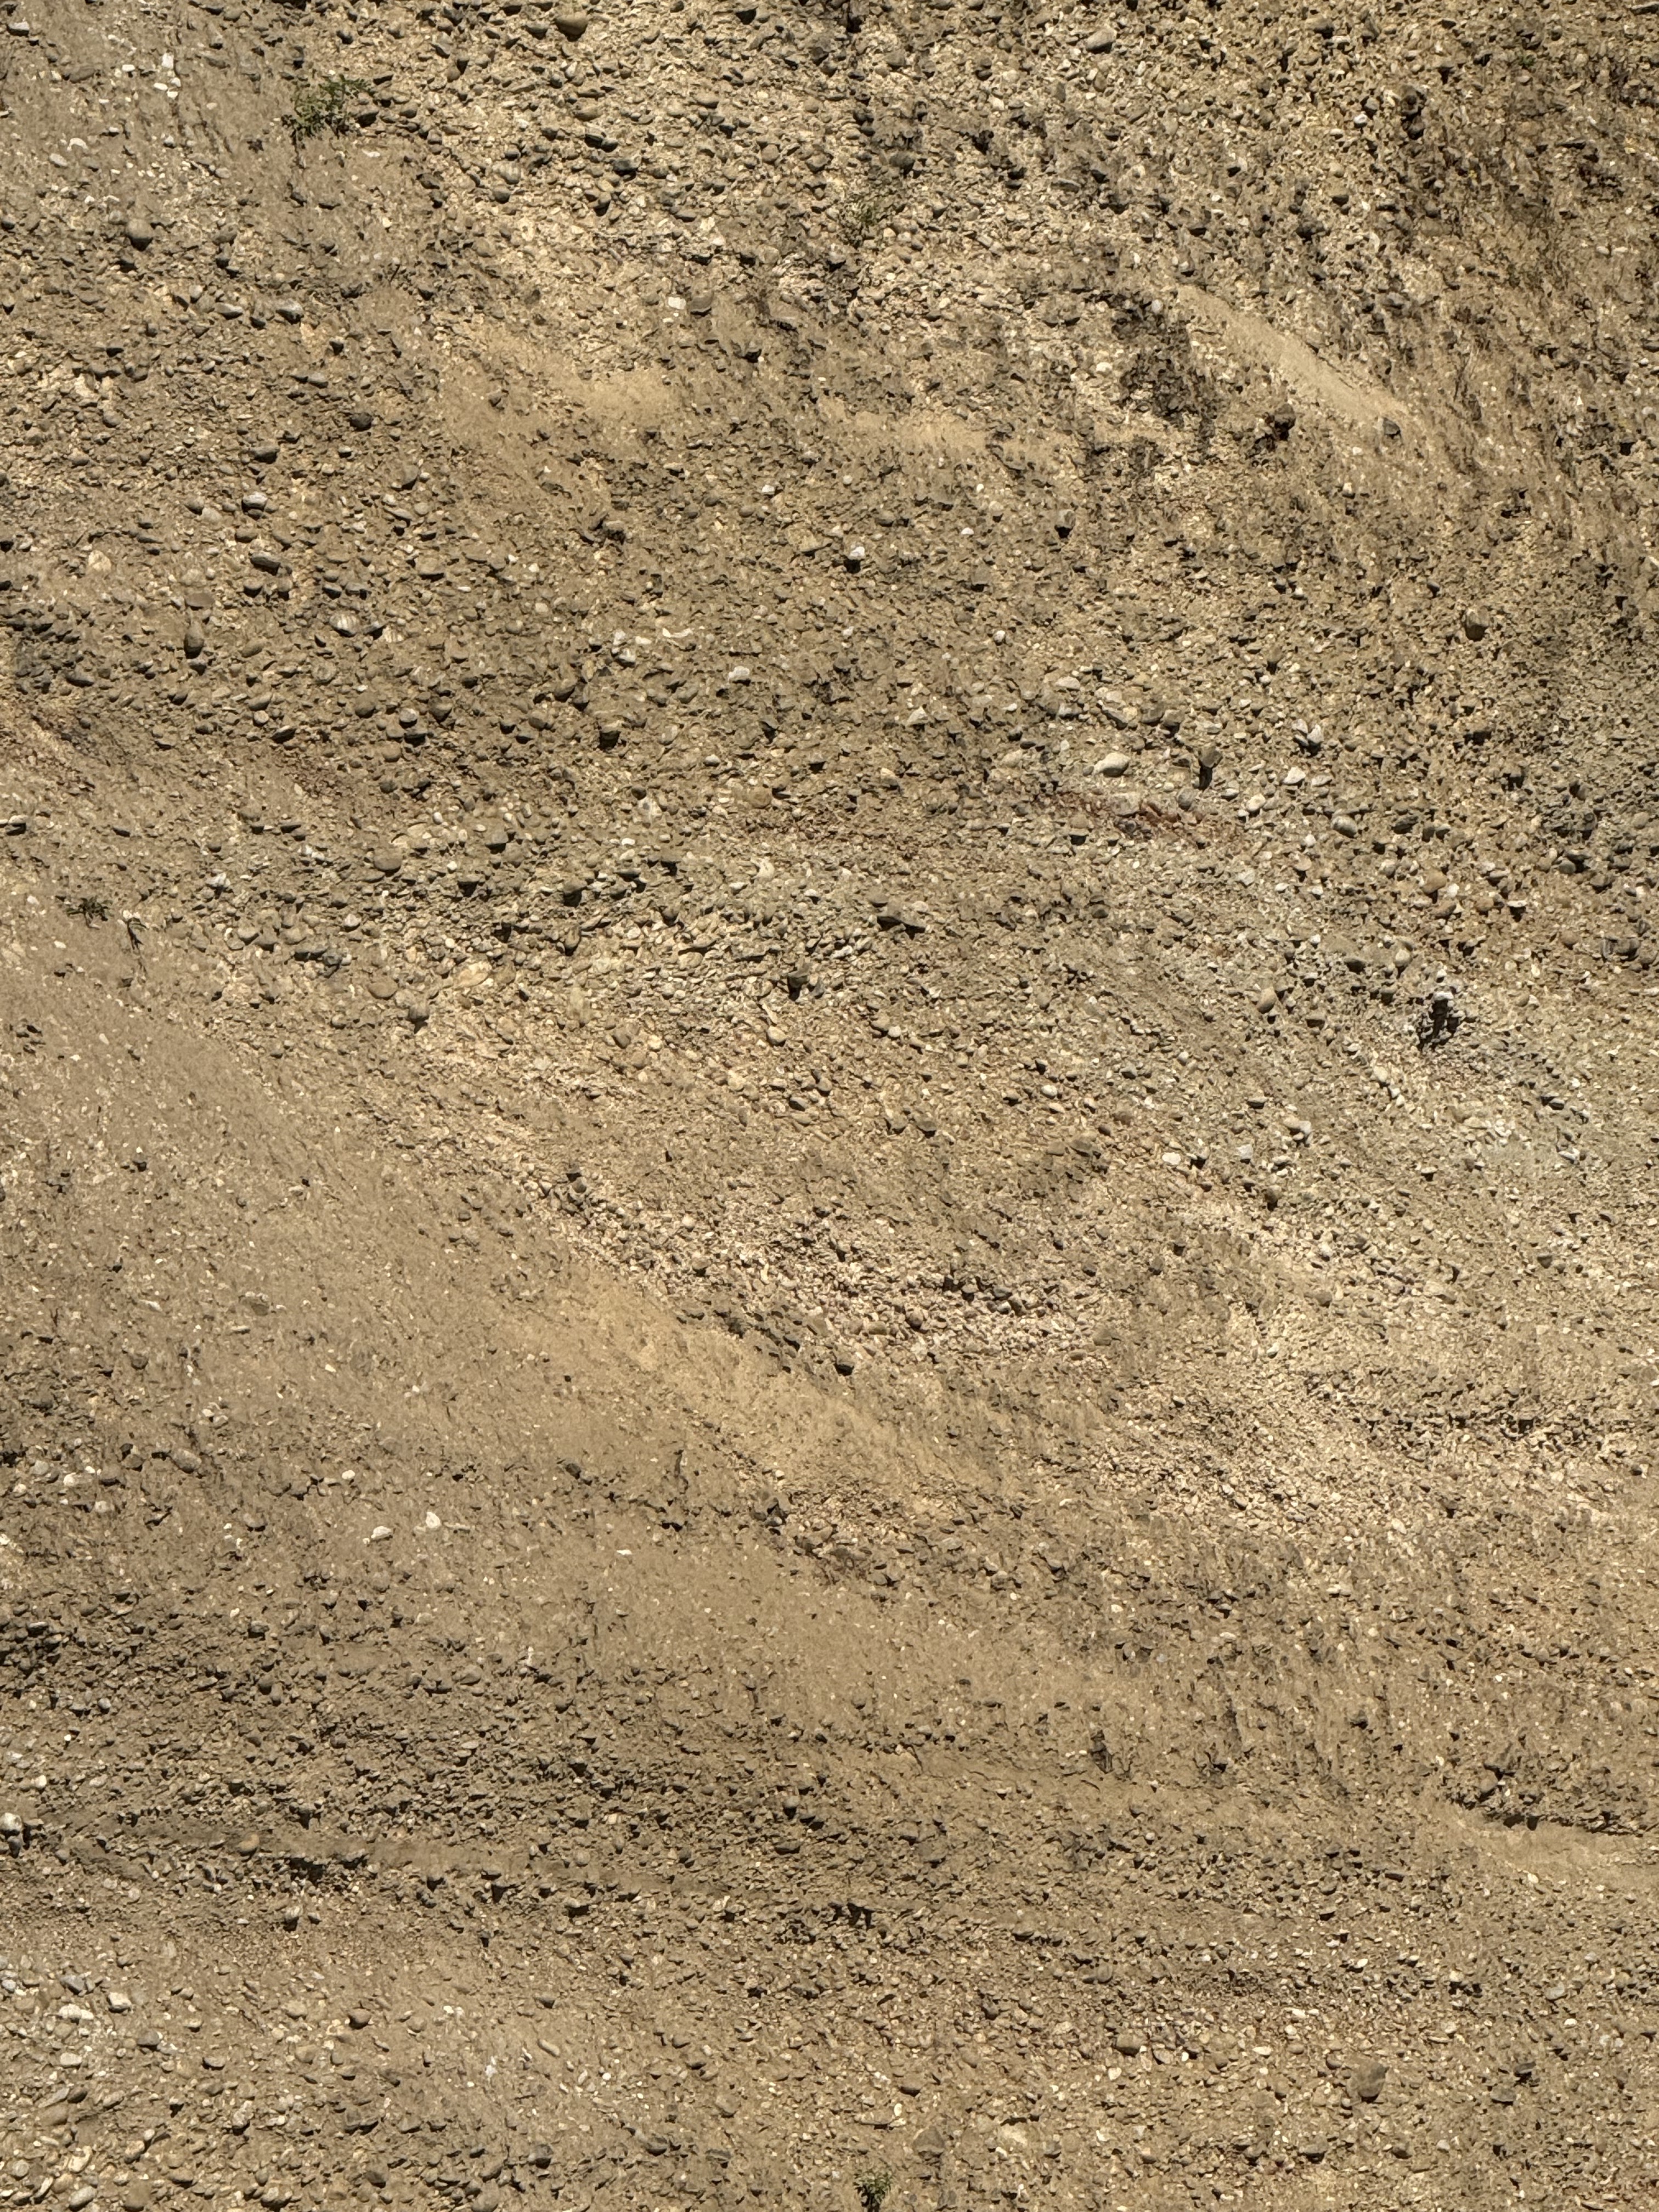
Figure 7. This is a close-up of the center of the cliff in Fig. 6, focusing on the contact between finer, sandier sediment to the left, and coarse material in the upper right. The unconformity contact between them was created by erosion, either by a glacier or a river like the modern Carbon River. Note the change in bedding between the lower part of the exposure and the irregular layers above the unconformity. The lower section reveals a fining-upward sequence; but this was partially removed and the entire upper part of the section is dominated by conglomerate.
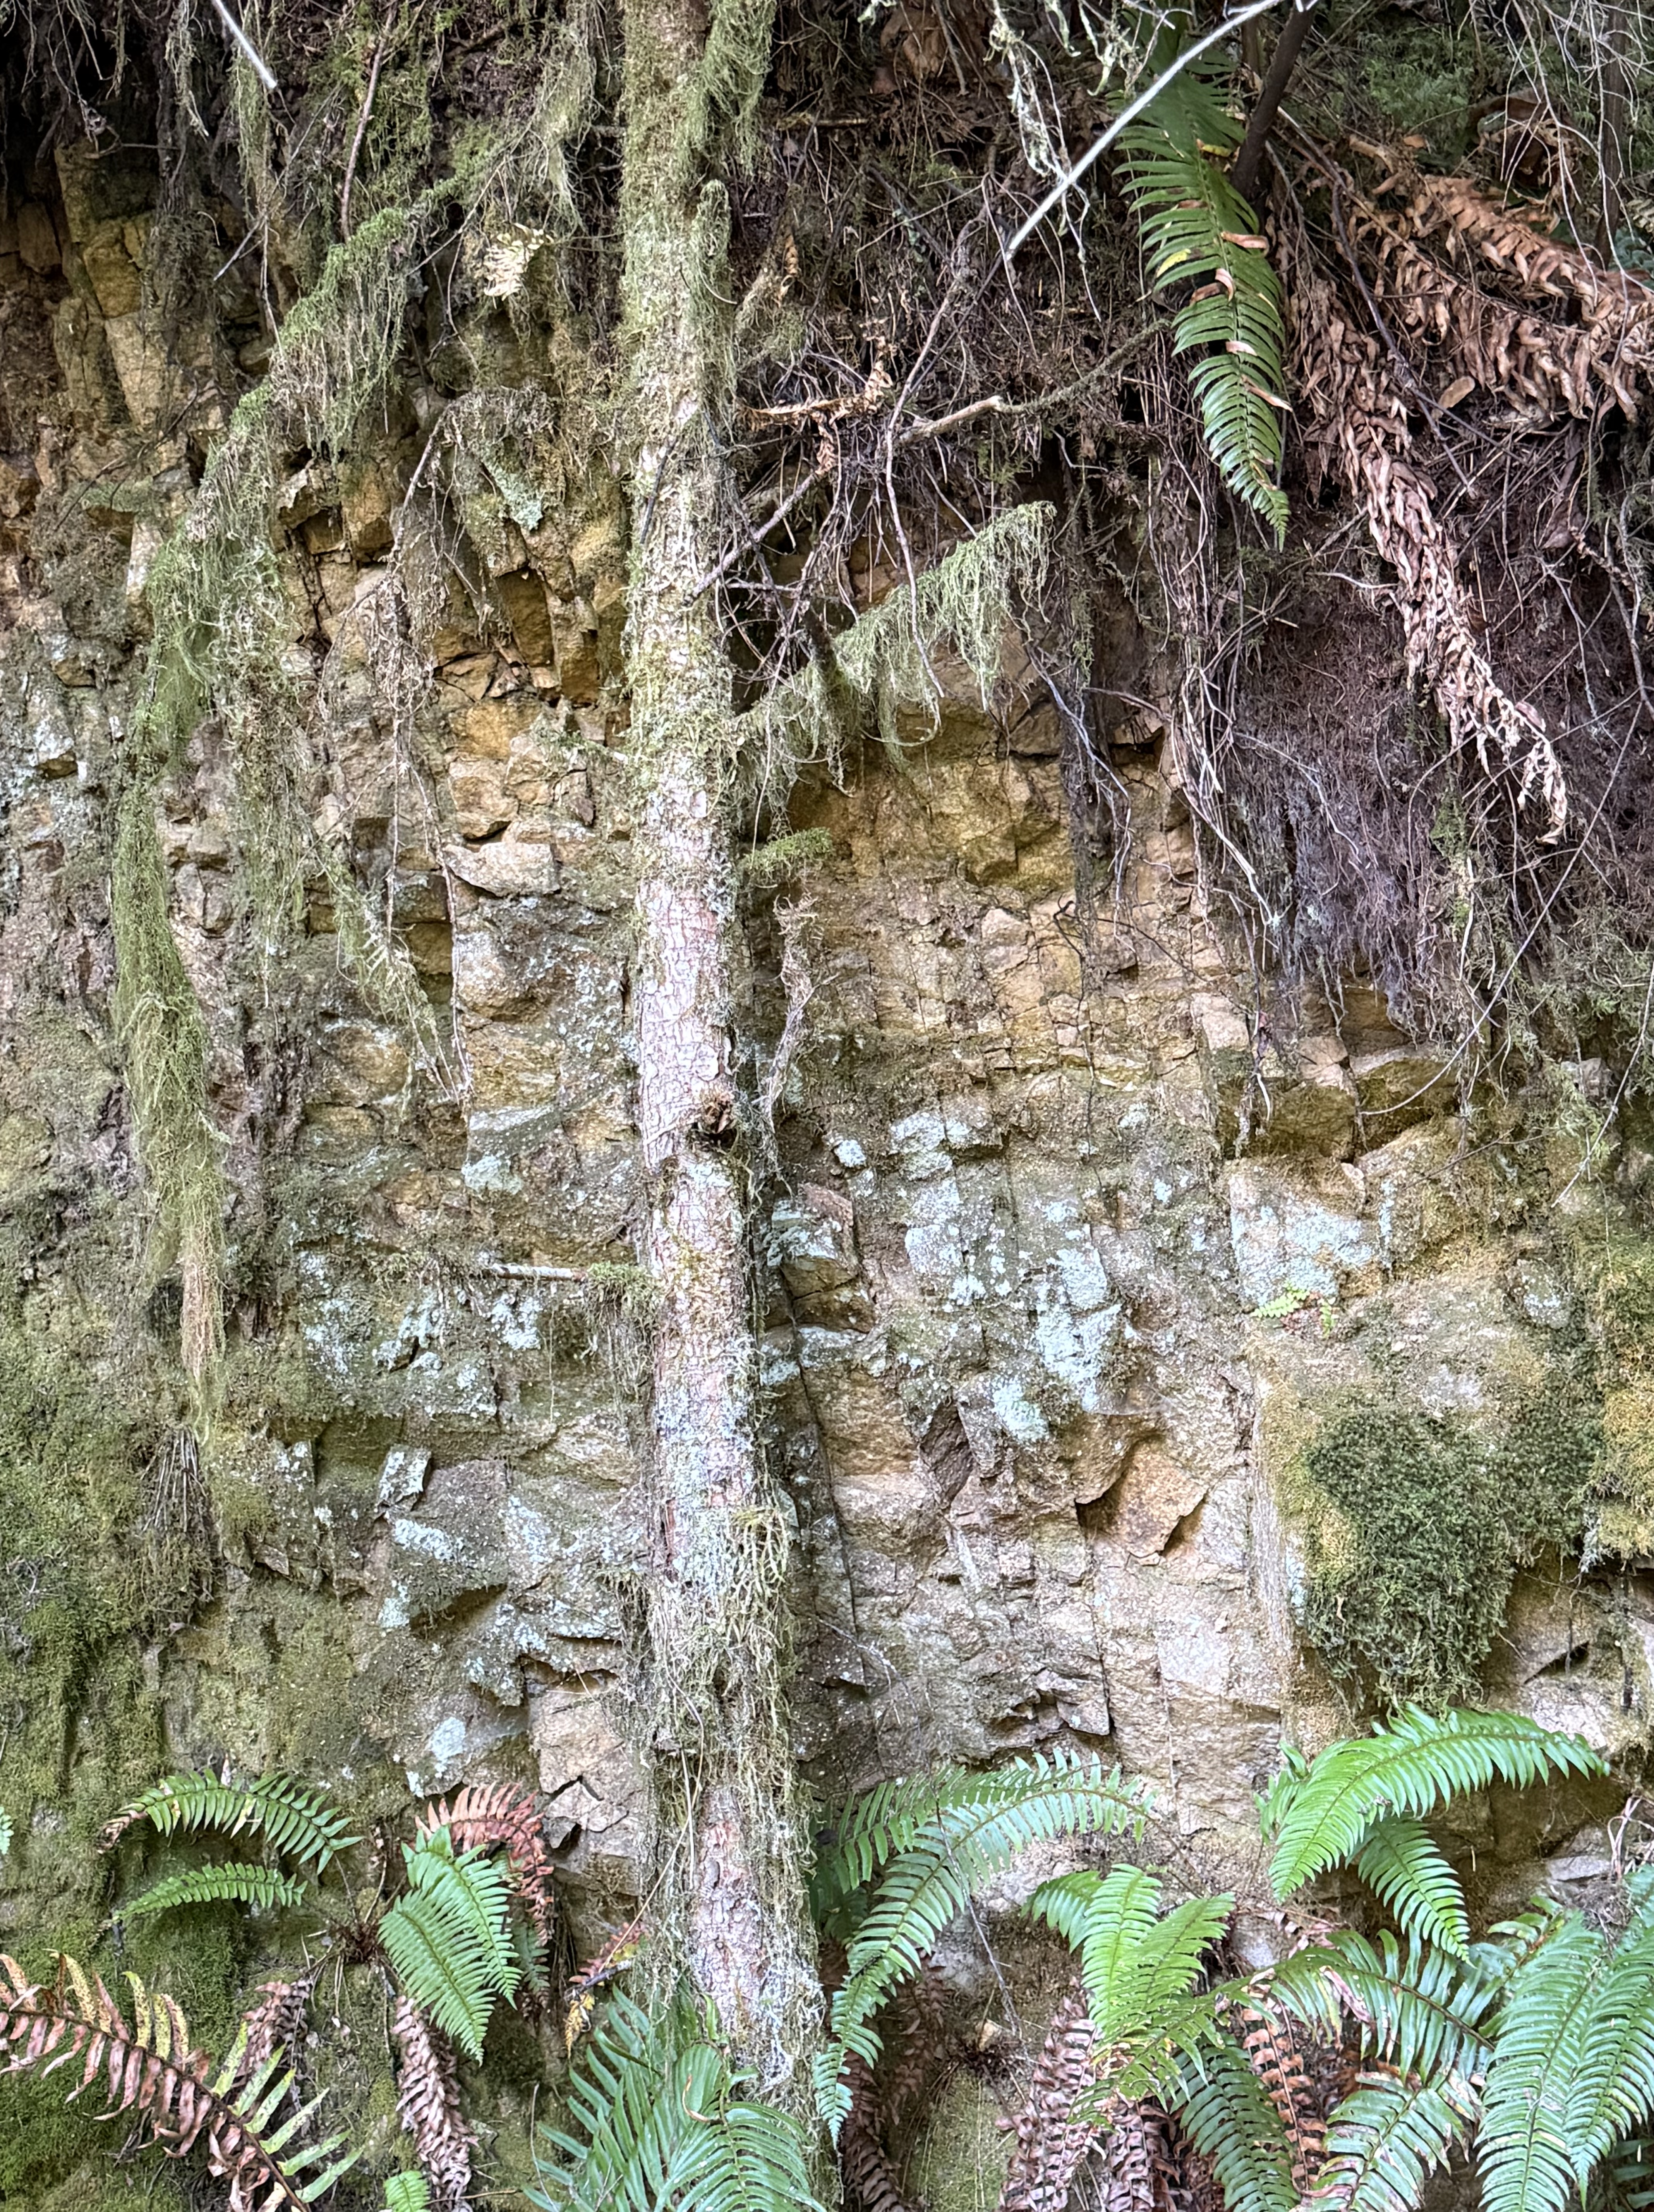
Figure 8. This photo was taken about halfway between Carbonado and the bridge (the star and triangle in Fig. 2B, respectively). The river was about 100 feet lower than the trail at this point. These bedded rocks are nearly vertical, as indicated by the dark, nearly vertical lines. They are Eocene terrestrial sediments that have been faulted and folded into their current orientation. They were probably deformed when the faults seen in Fig. 2C (thin lines on the geological map) were active.
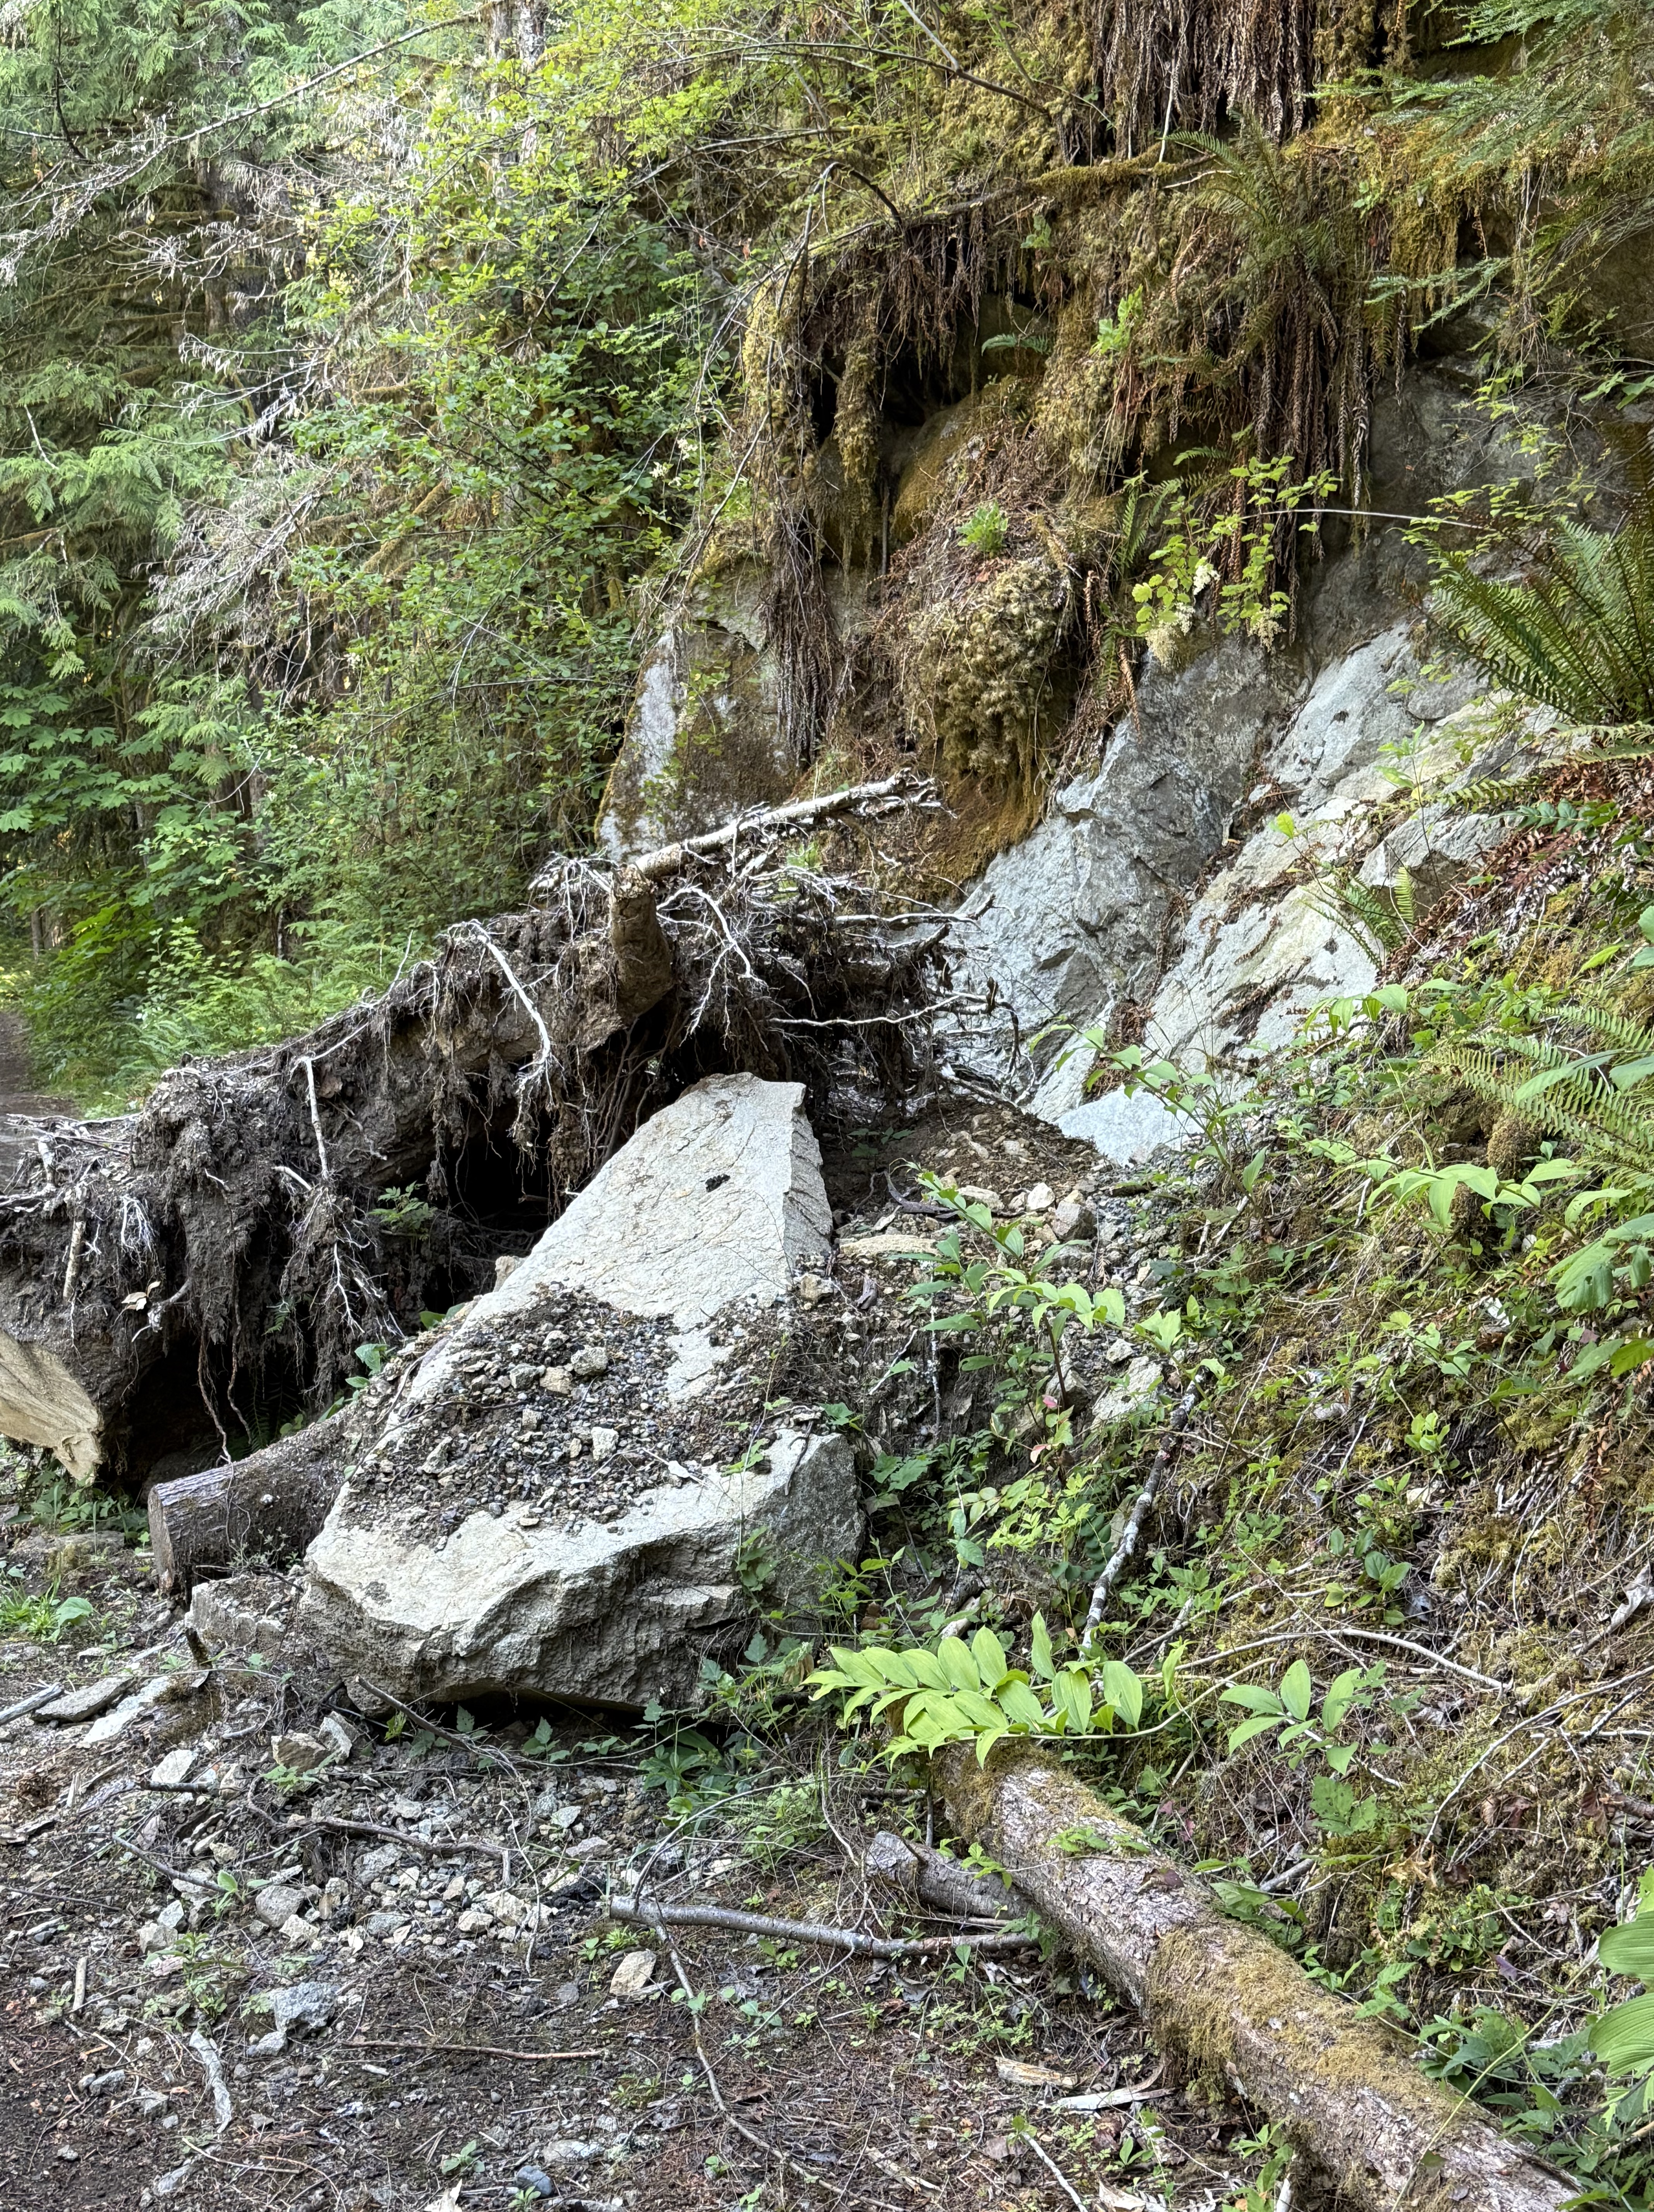
Figure 9. Further along the trail we encountered this small landslide. A tree that had rooted in cracks within the sedimentary rocks fell along with a piece (about 10 feet long) of rock. This is a great example of how erosion is a continuous process that never rests, inexorably removing mountains and transporting them to the sea.
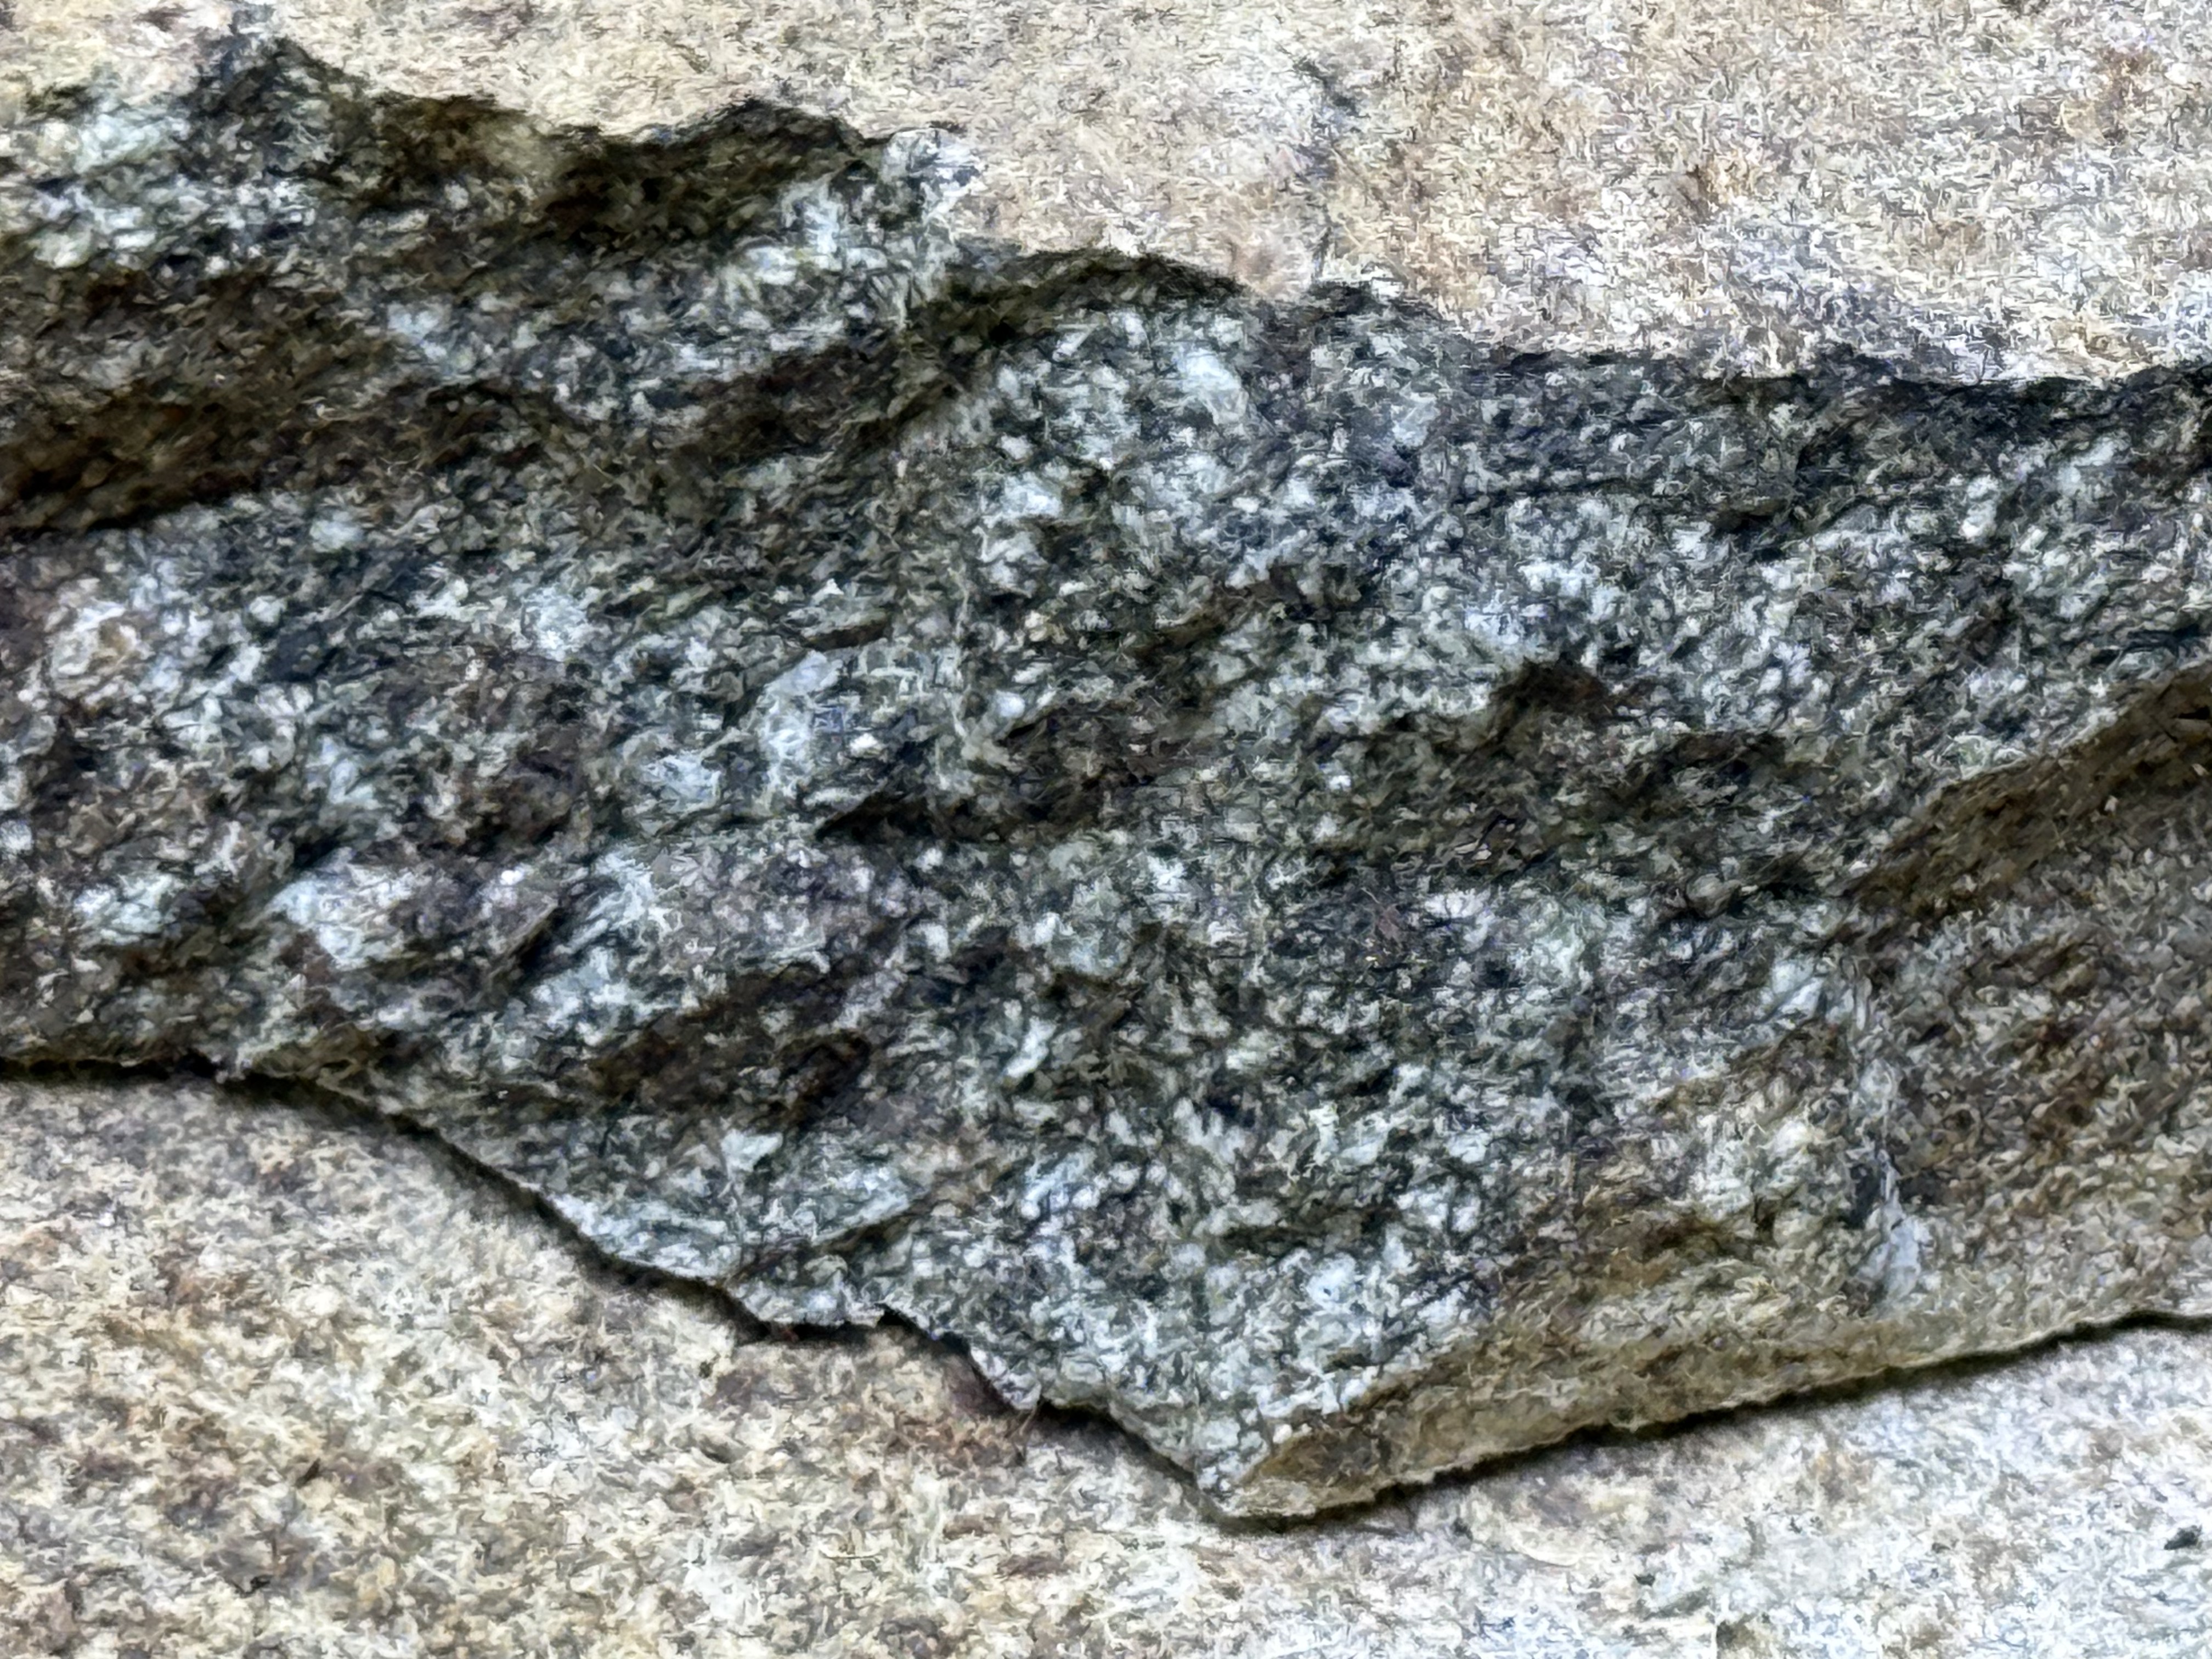
Figure 10. To the naked eye, this close-up of a recently broken piece of the slab in Fig. 9 looks like an intrusive, igneous rock, but it absolutely is not! Ignoring the dark coloration, which is either an organic stain or weathering product, I would say this is probably a coarse sandstone, possibly even a breccia or conglomerate. Breaking it with a rock hammer, to produce a fresh surface, would make identification easy; but we don’t do that in Rocks and (no) Roads. We use the geologic map instead.
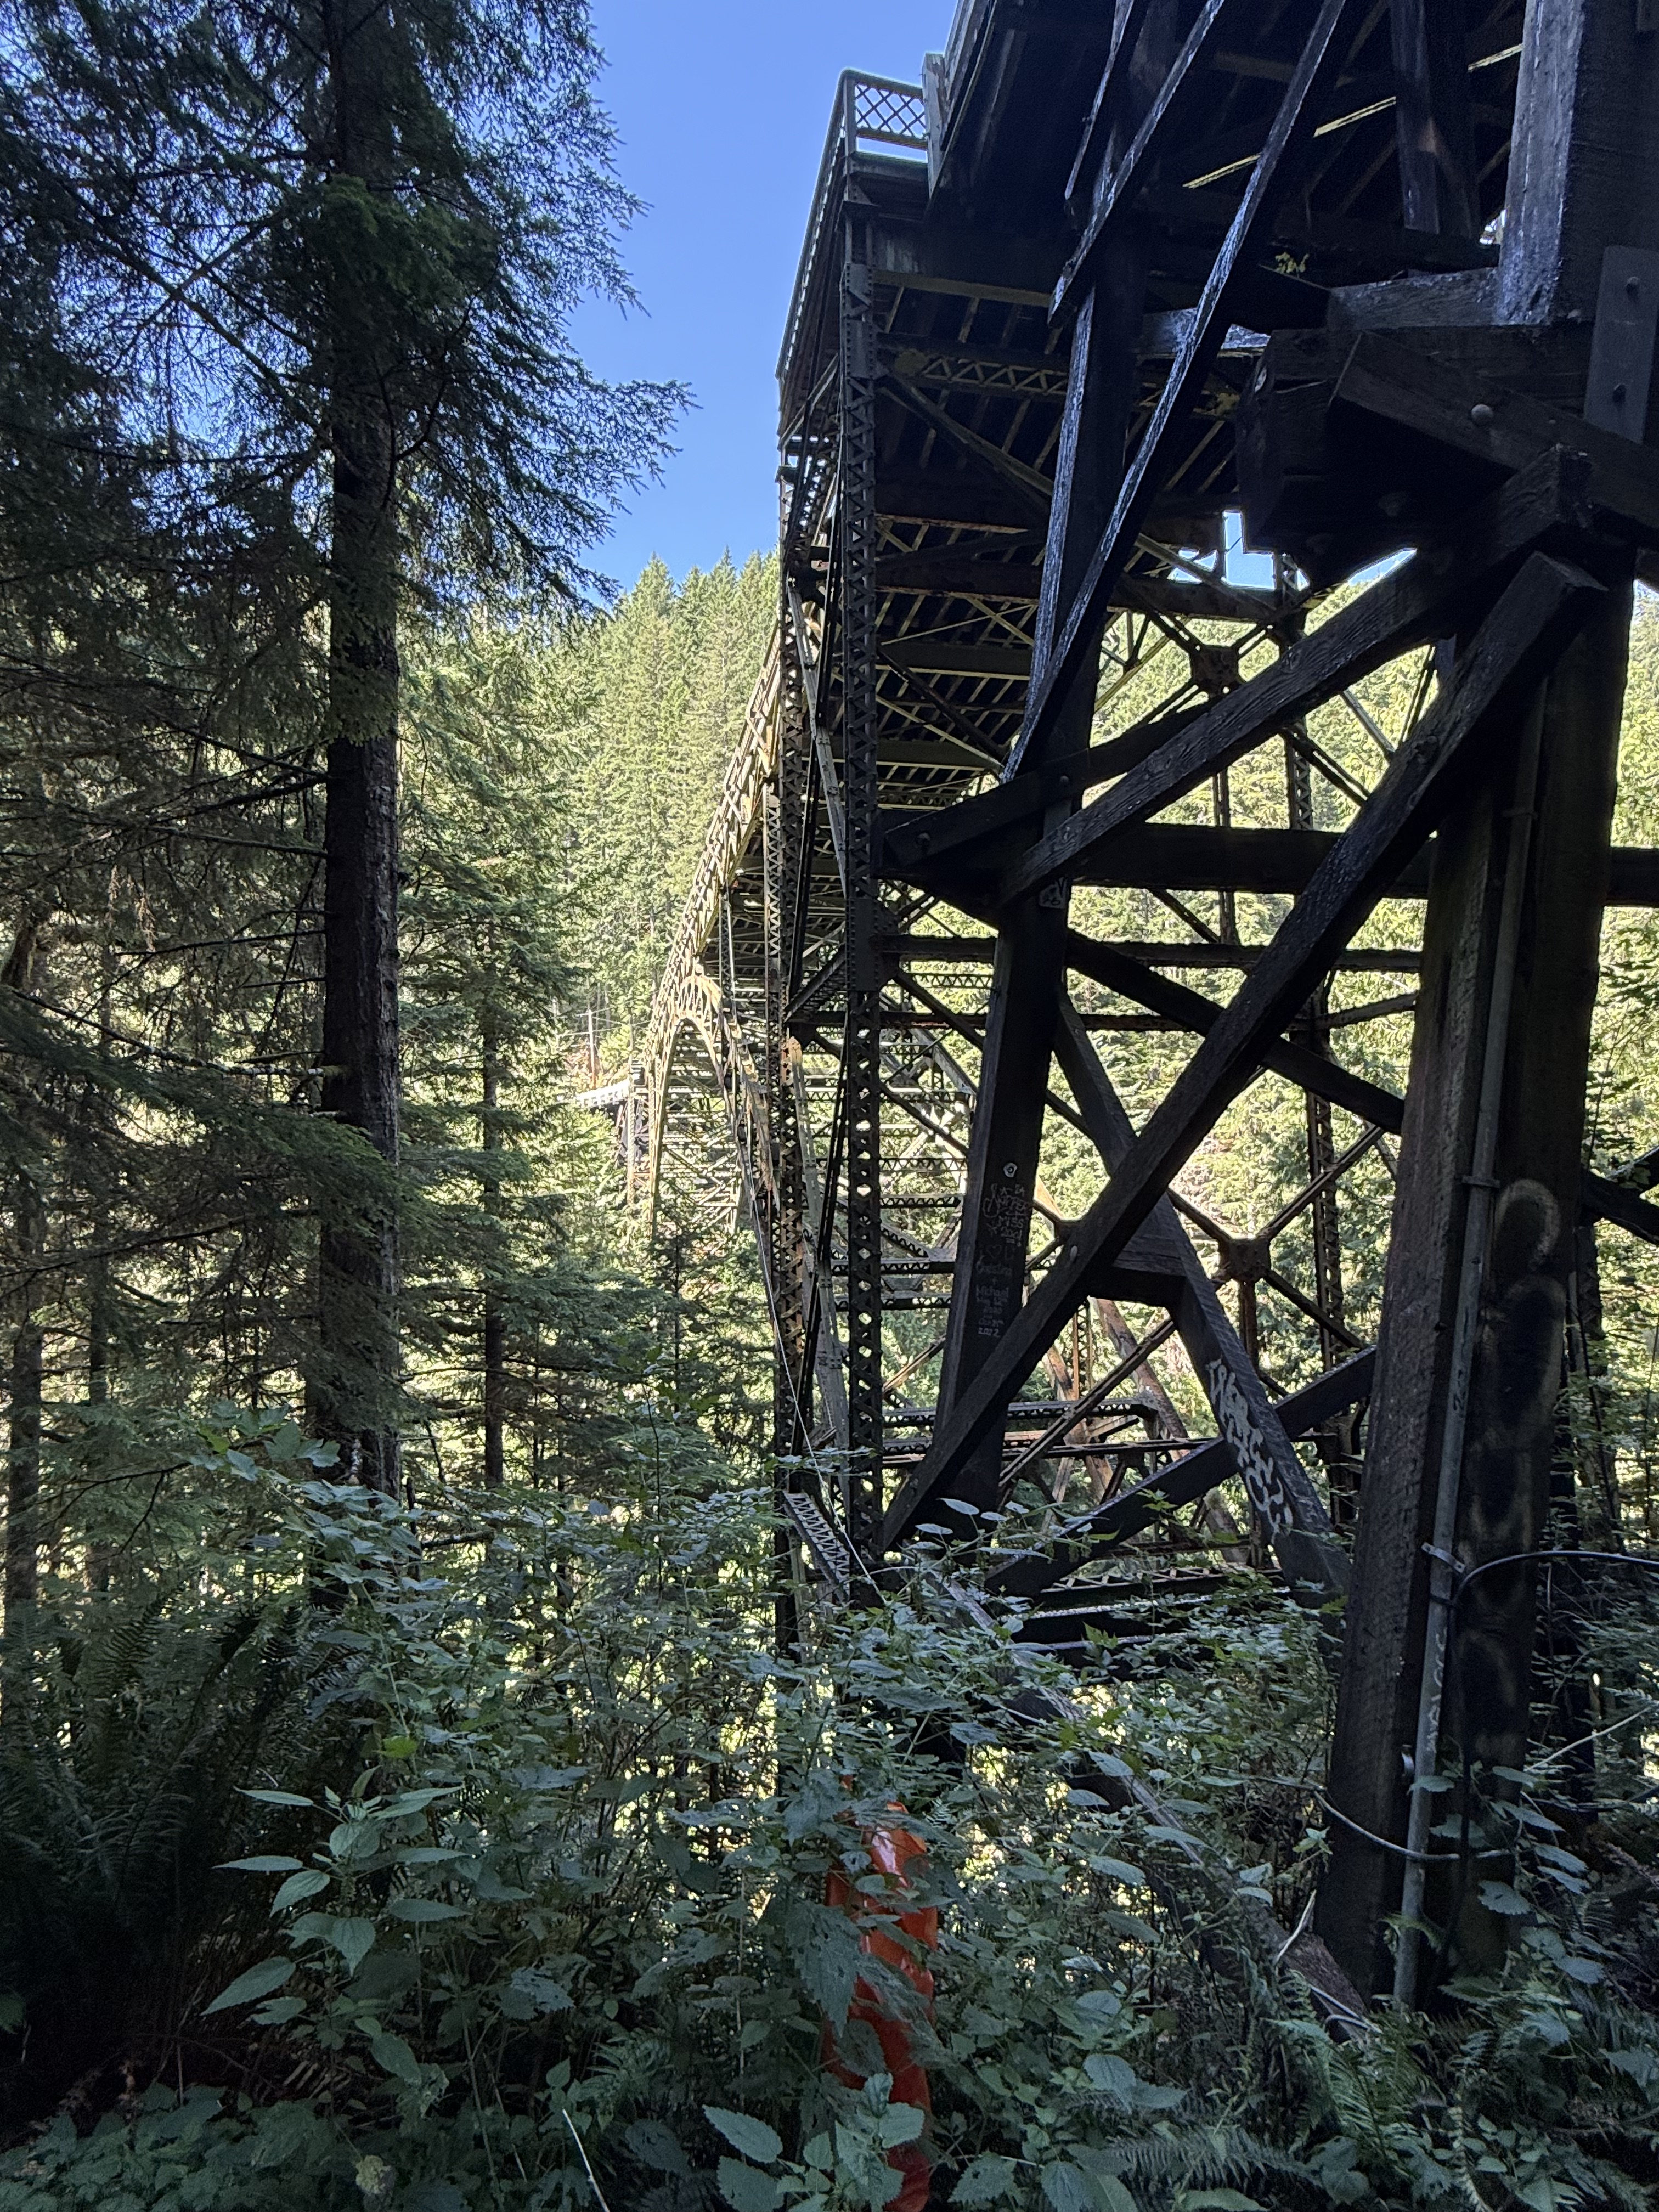
Figure 11. This is the end of the trail, where the road crosses Carbon River across the condemned Fairfax Bridge — closed even to pedestrian traffic. The canyon is 250-300 feet deep here. We climbed a trail to the bridge before we saw the signs on the highway declaring it unsafe for men or beasts.
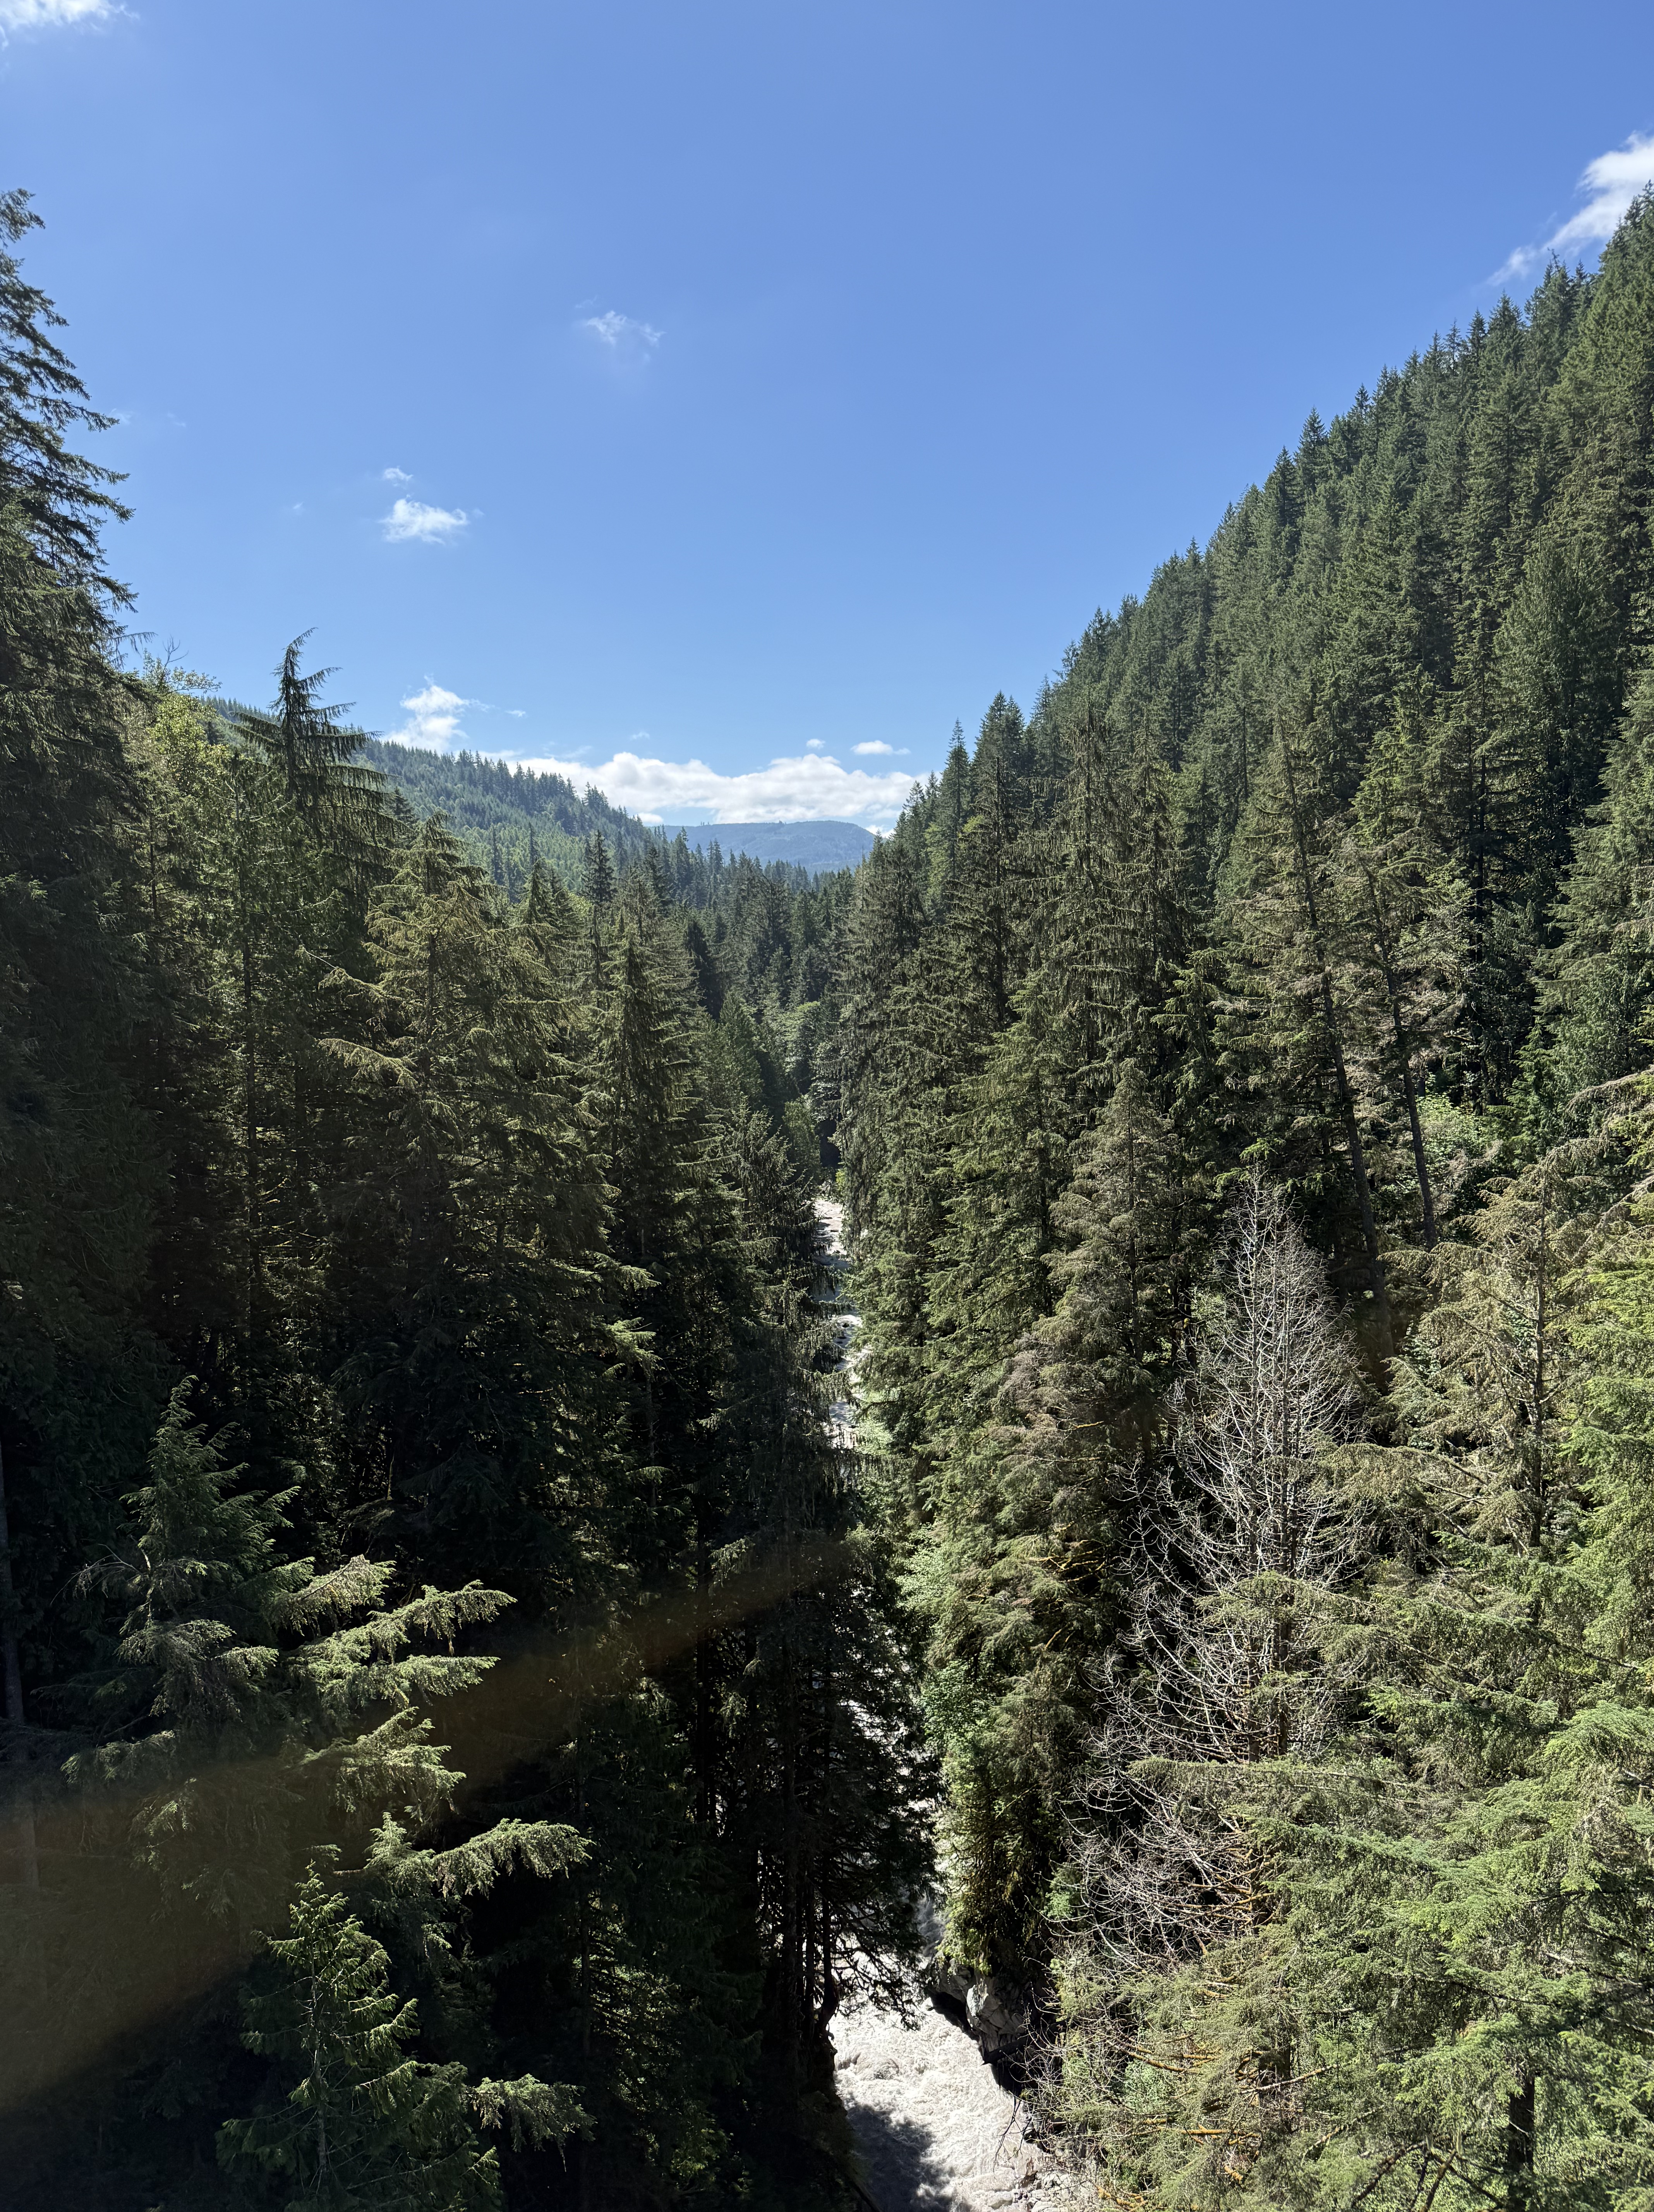
Figure 12. The canyon is very narrow at Fairfax Bridge, and Carbon River is forced into a bottleneck where it drops precipitously from the core of the Cascades. This entire canyon would have been filled with ice during the most recent glacial period. Compare this image, looking upstream, to those from the Nisqually glacier on Mount Rainier. That ice would have melted and advanced, pushing its way downstream, where it would have met the continental glacier covering Puget Sound.
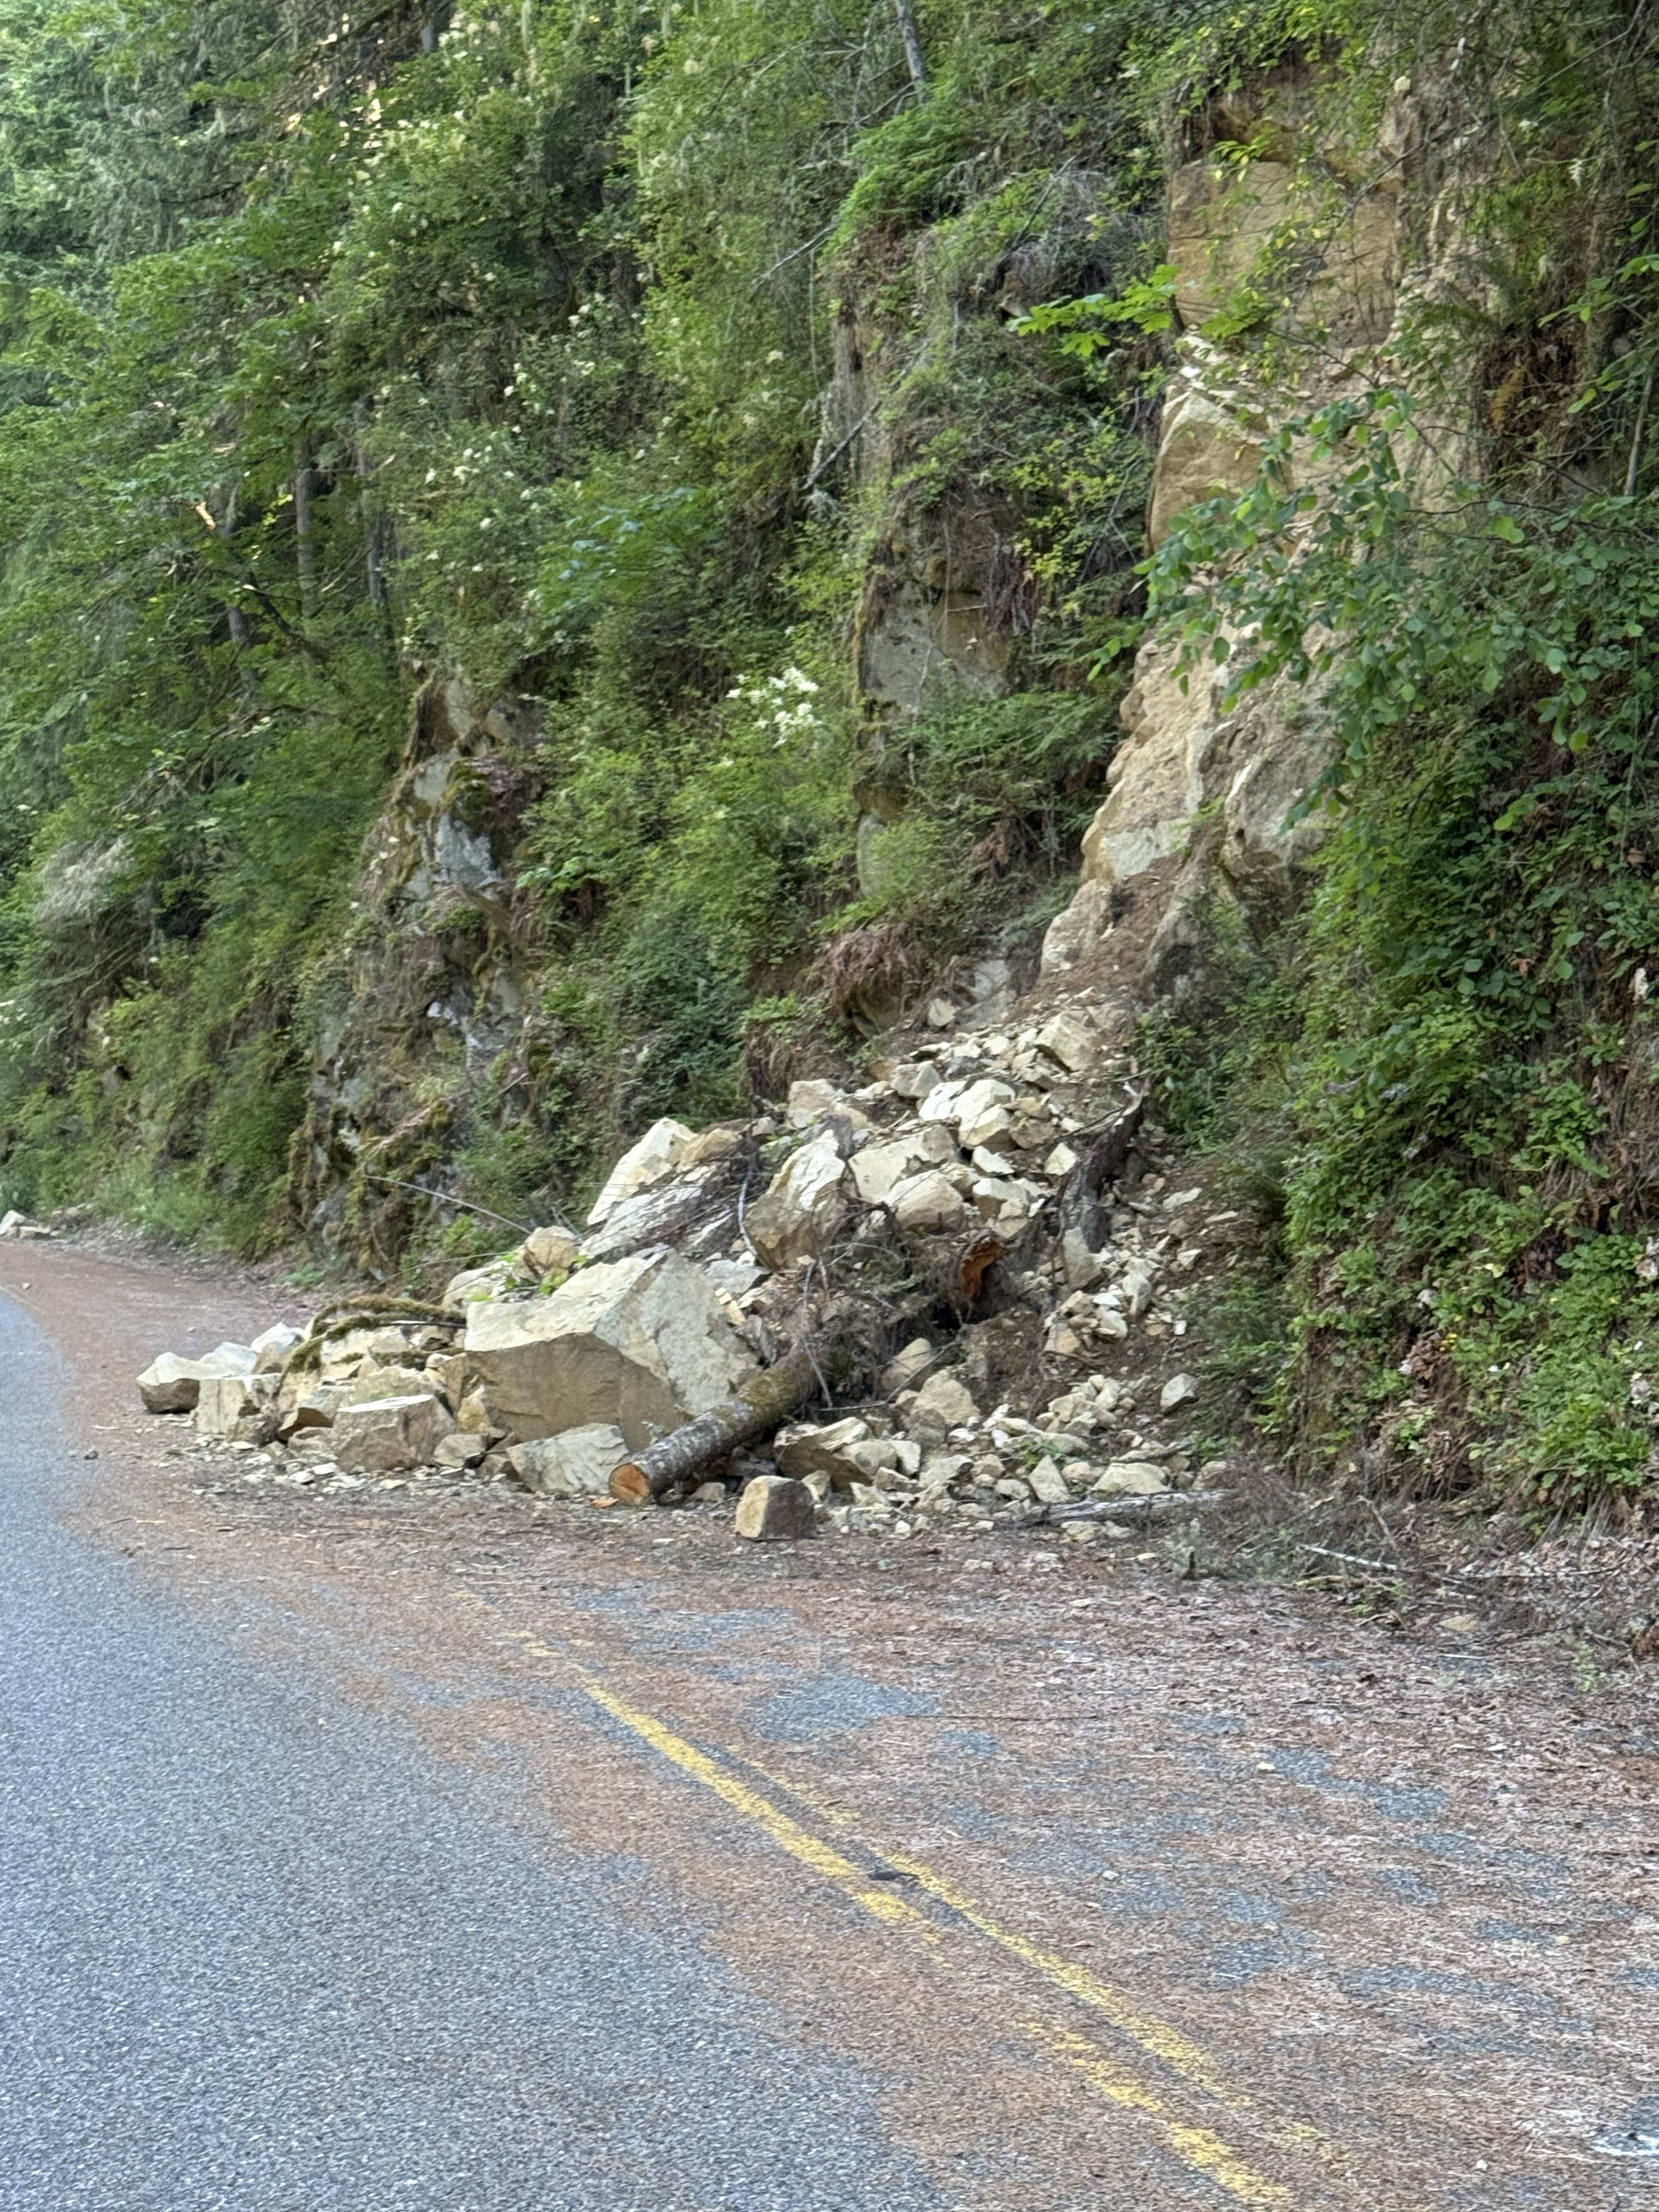
Figure 13. We took the highway back to Carbondale. However, Route 165 is closed and the highway department isn’t maintaining it, so slides like this one are left for geologists to examine. This block is, according to RockD’s geologic map, sedimentary; it looks like sandstone and I didn’t examine it at the time. Note the reddish face on the large block facing the camera; red means this rock was deposited with a lot of oxygen, which means it was in a river and not the ocean, which has a much lower concentration of oxygen.
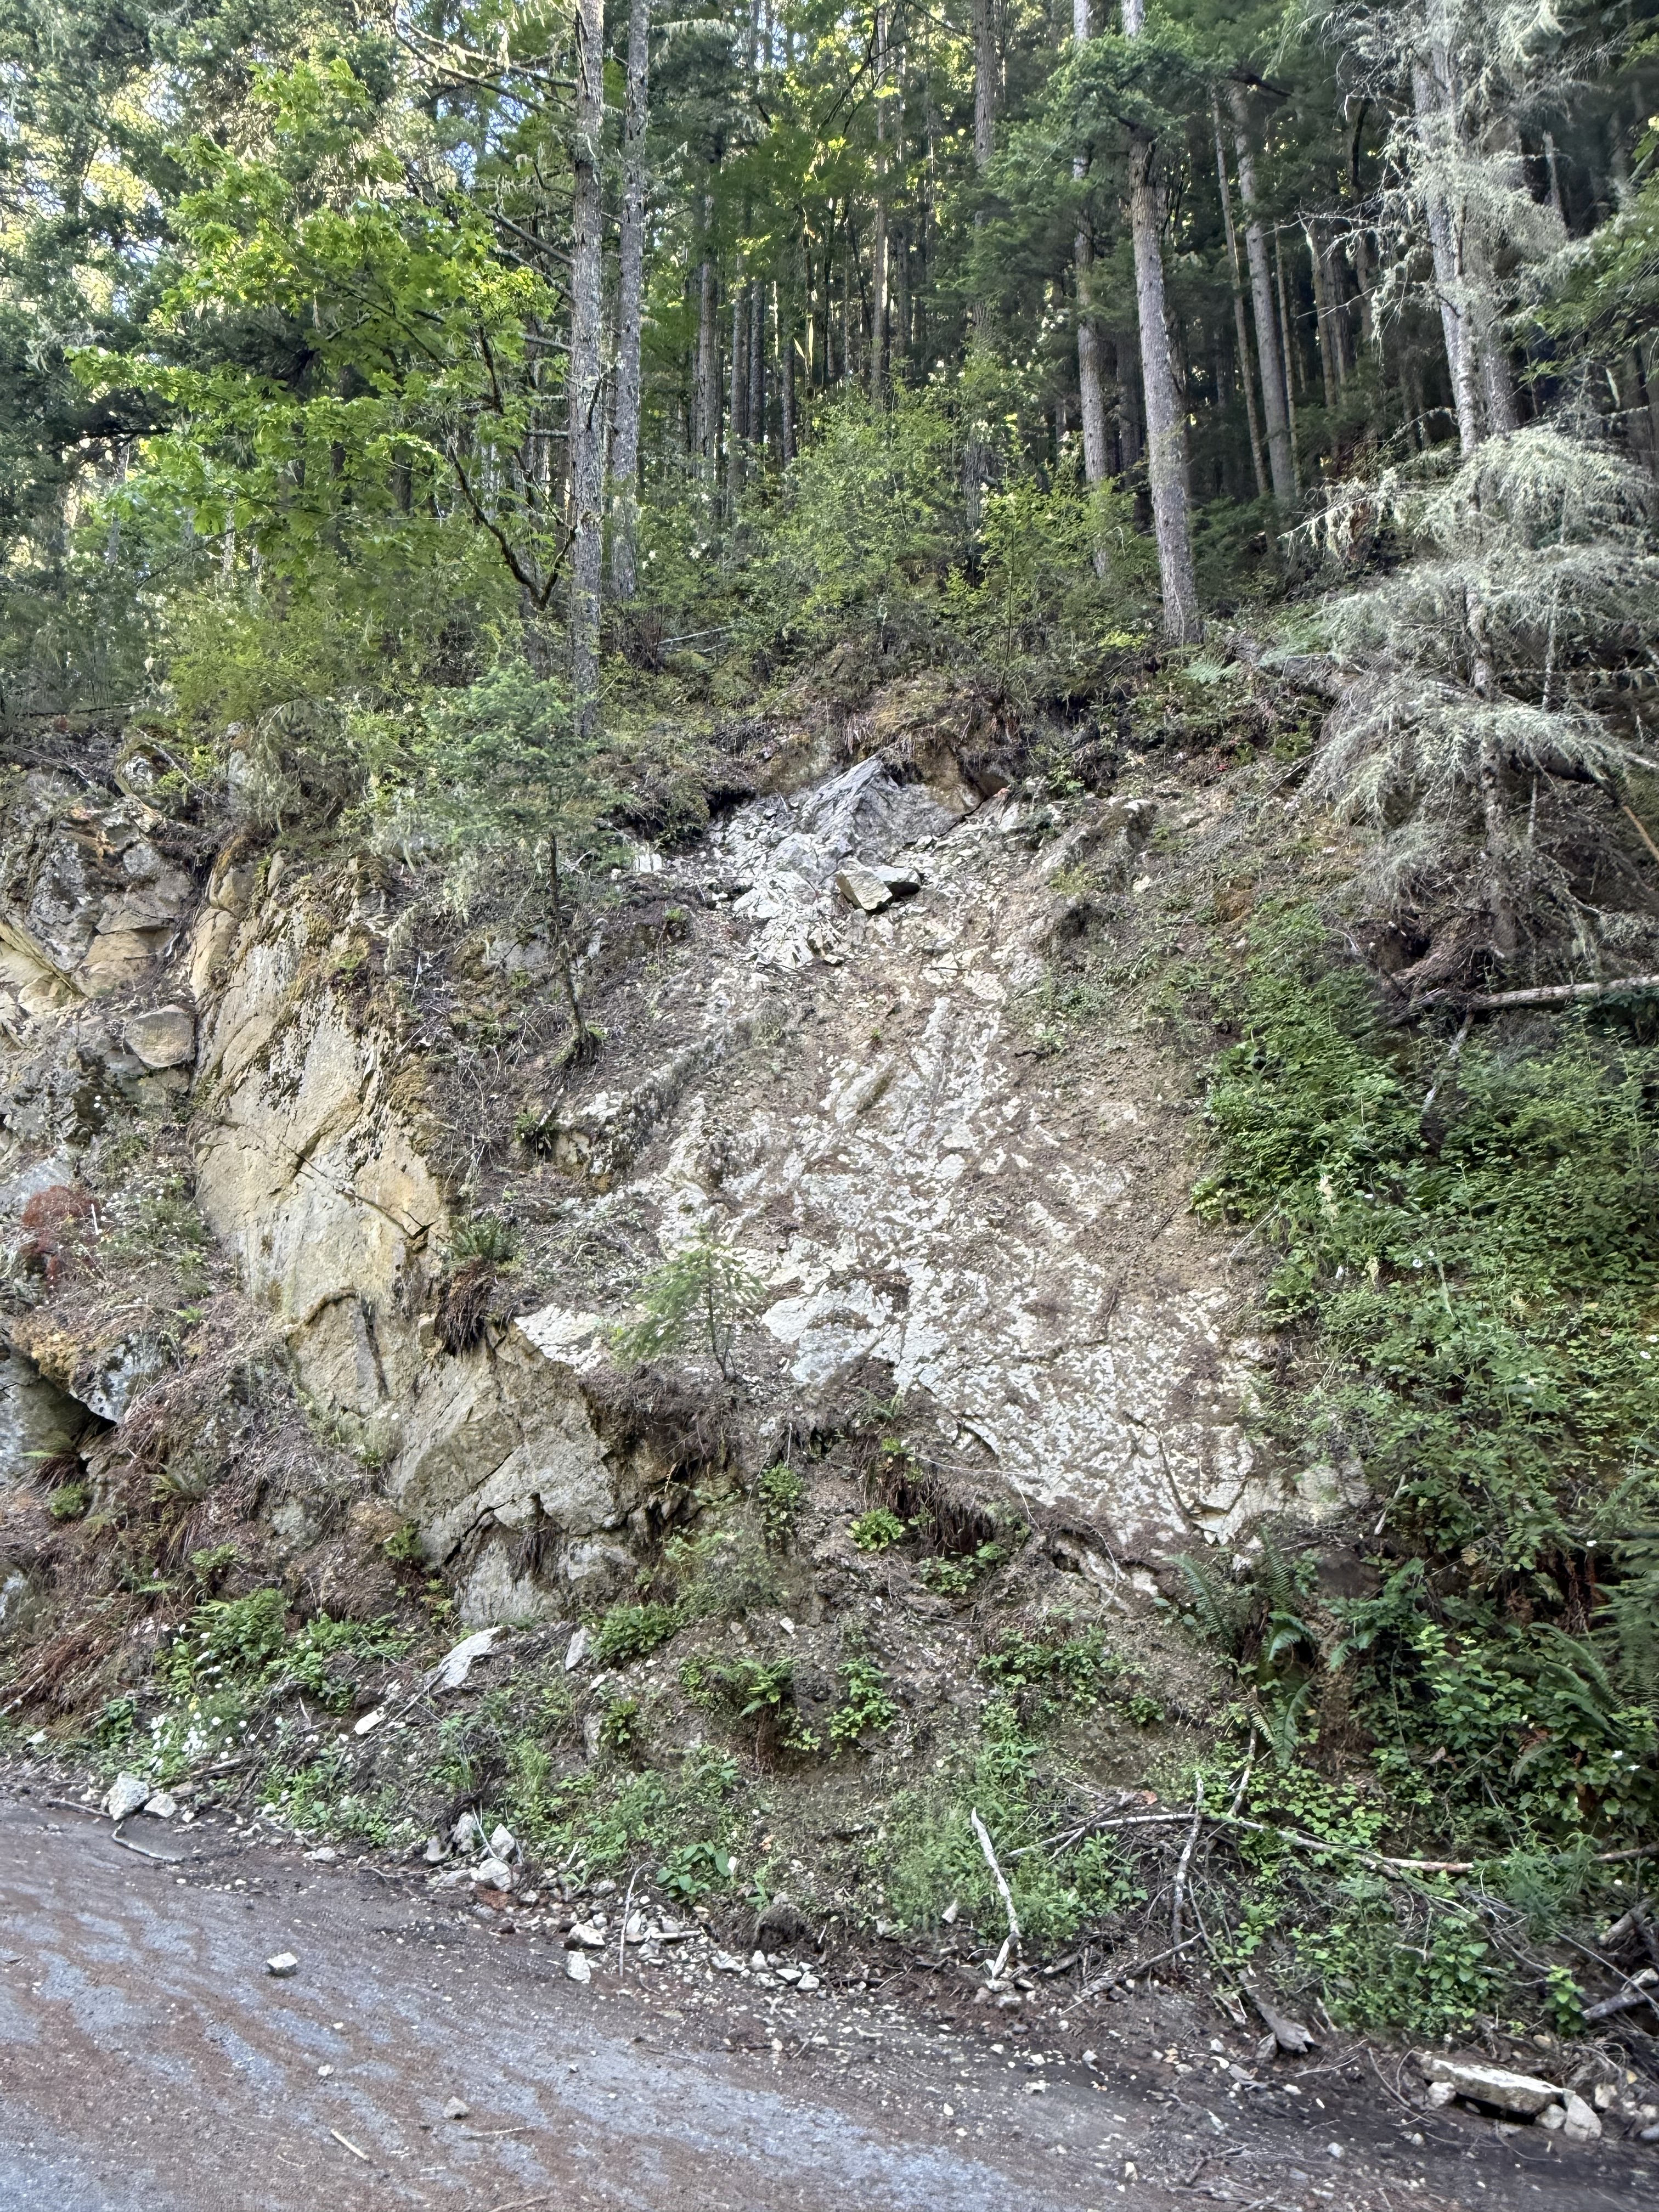
Figure 14. This photo presents a bizarre juxtaposition of geologic features. It was taken a few hundred yards downstream of Fairfax Bridge. The thick layer of sandstone to the left represents the unaltered strata, which has been tilted towards the NE, but not as much as the strata seen in Fig. 8. Such a sudden (spatially) change in orientation is probably why the geologic map (Fig. 2C) shows a fault along the river canyon.
Another interesting feature is the white patch in the center of the photo. I had several hypotheses about this but, after discussing it with CoPilot (aka ChatGPT), I’m going to go with the most plausible scenario: I think this is a layer of shale within the Carbonado Formation, which is both more easily weathered than sandstone, and a surface that can accommodate slippage on a fault more readily. The apparent bedding plane (i.e. the white surface) is an illusion, created by uneven weathering and the constant flow of water down an established channel.
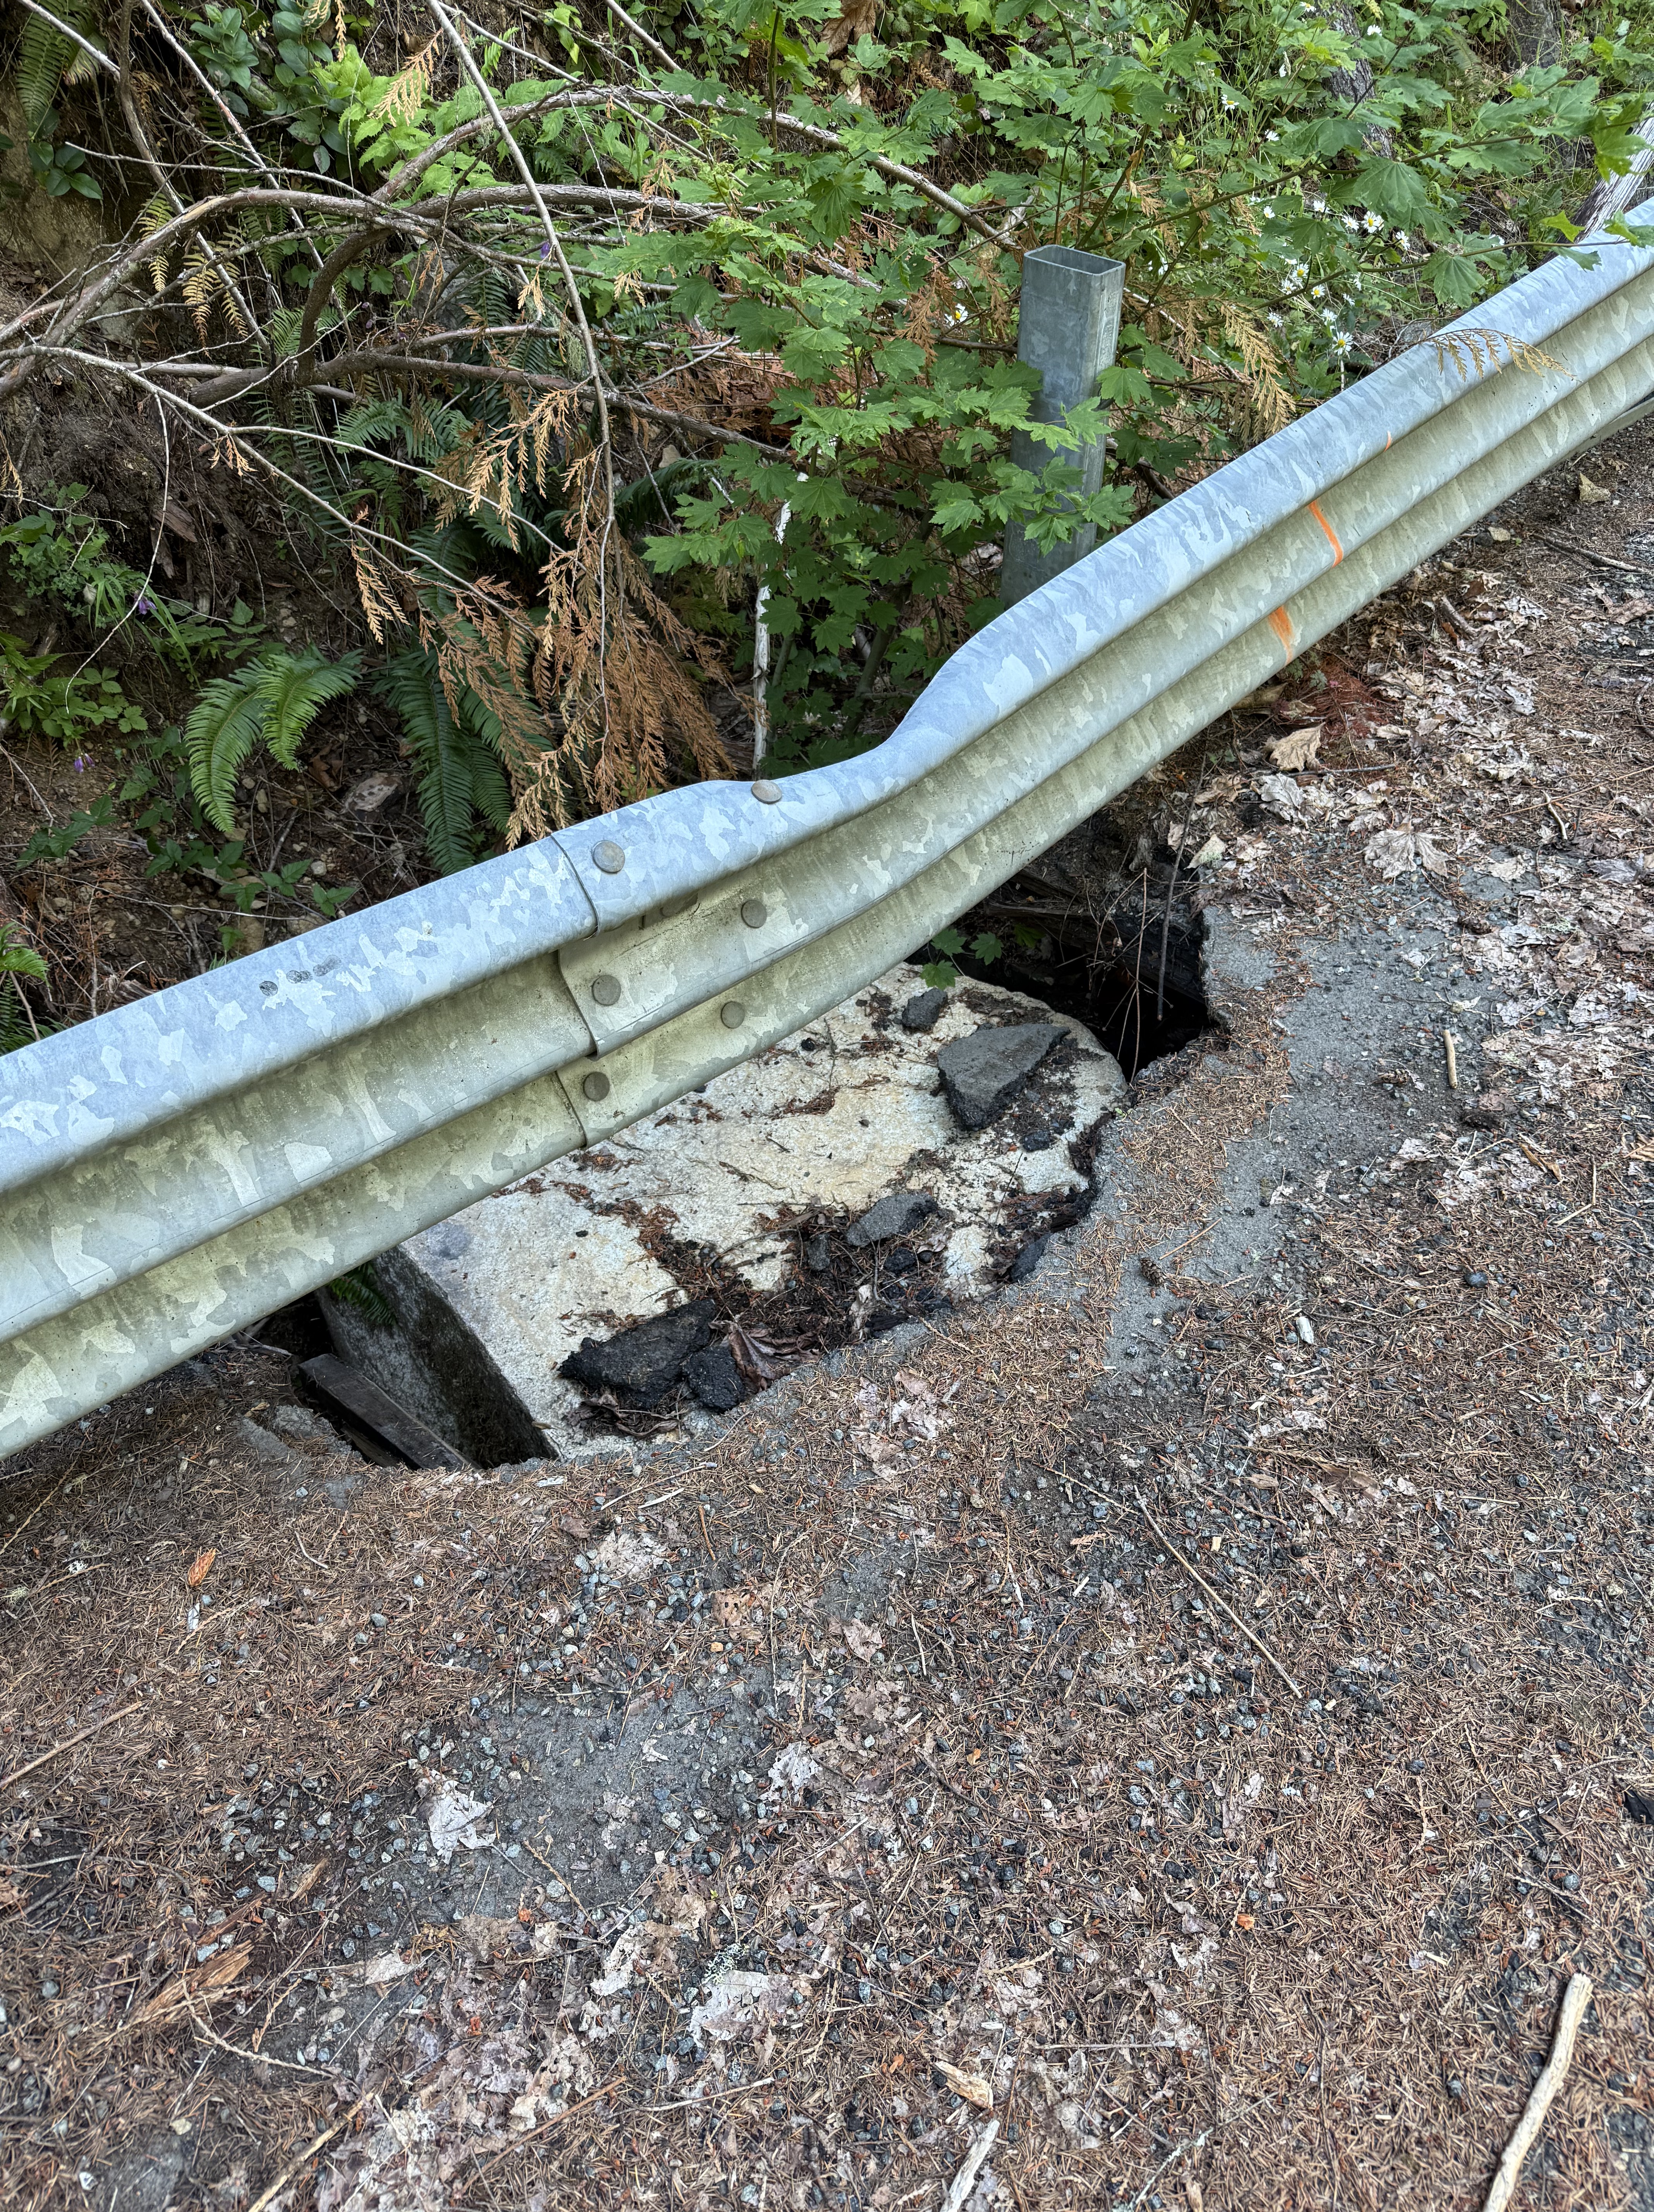
Figure 15. I had to include this image. A block of sandstone, weighing more than a ton, rolled down the steep slope, hit the guardrail, bending it, before slamming into the asphalt road that was weakened by erosion, and smashing into the underlying, water-saturated ground. We noticed several spots where the culverts draining the road were insufficient, allowing water to collect and weaken the roadbed.
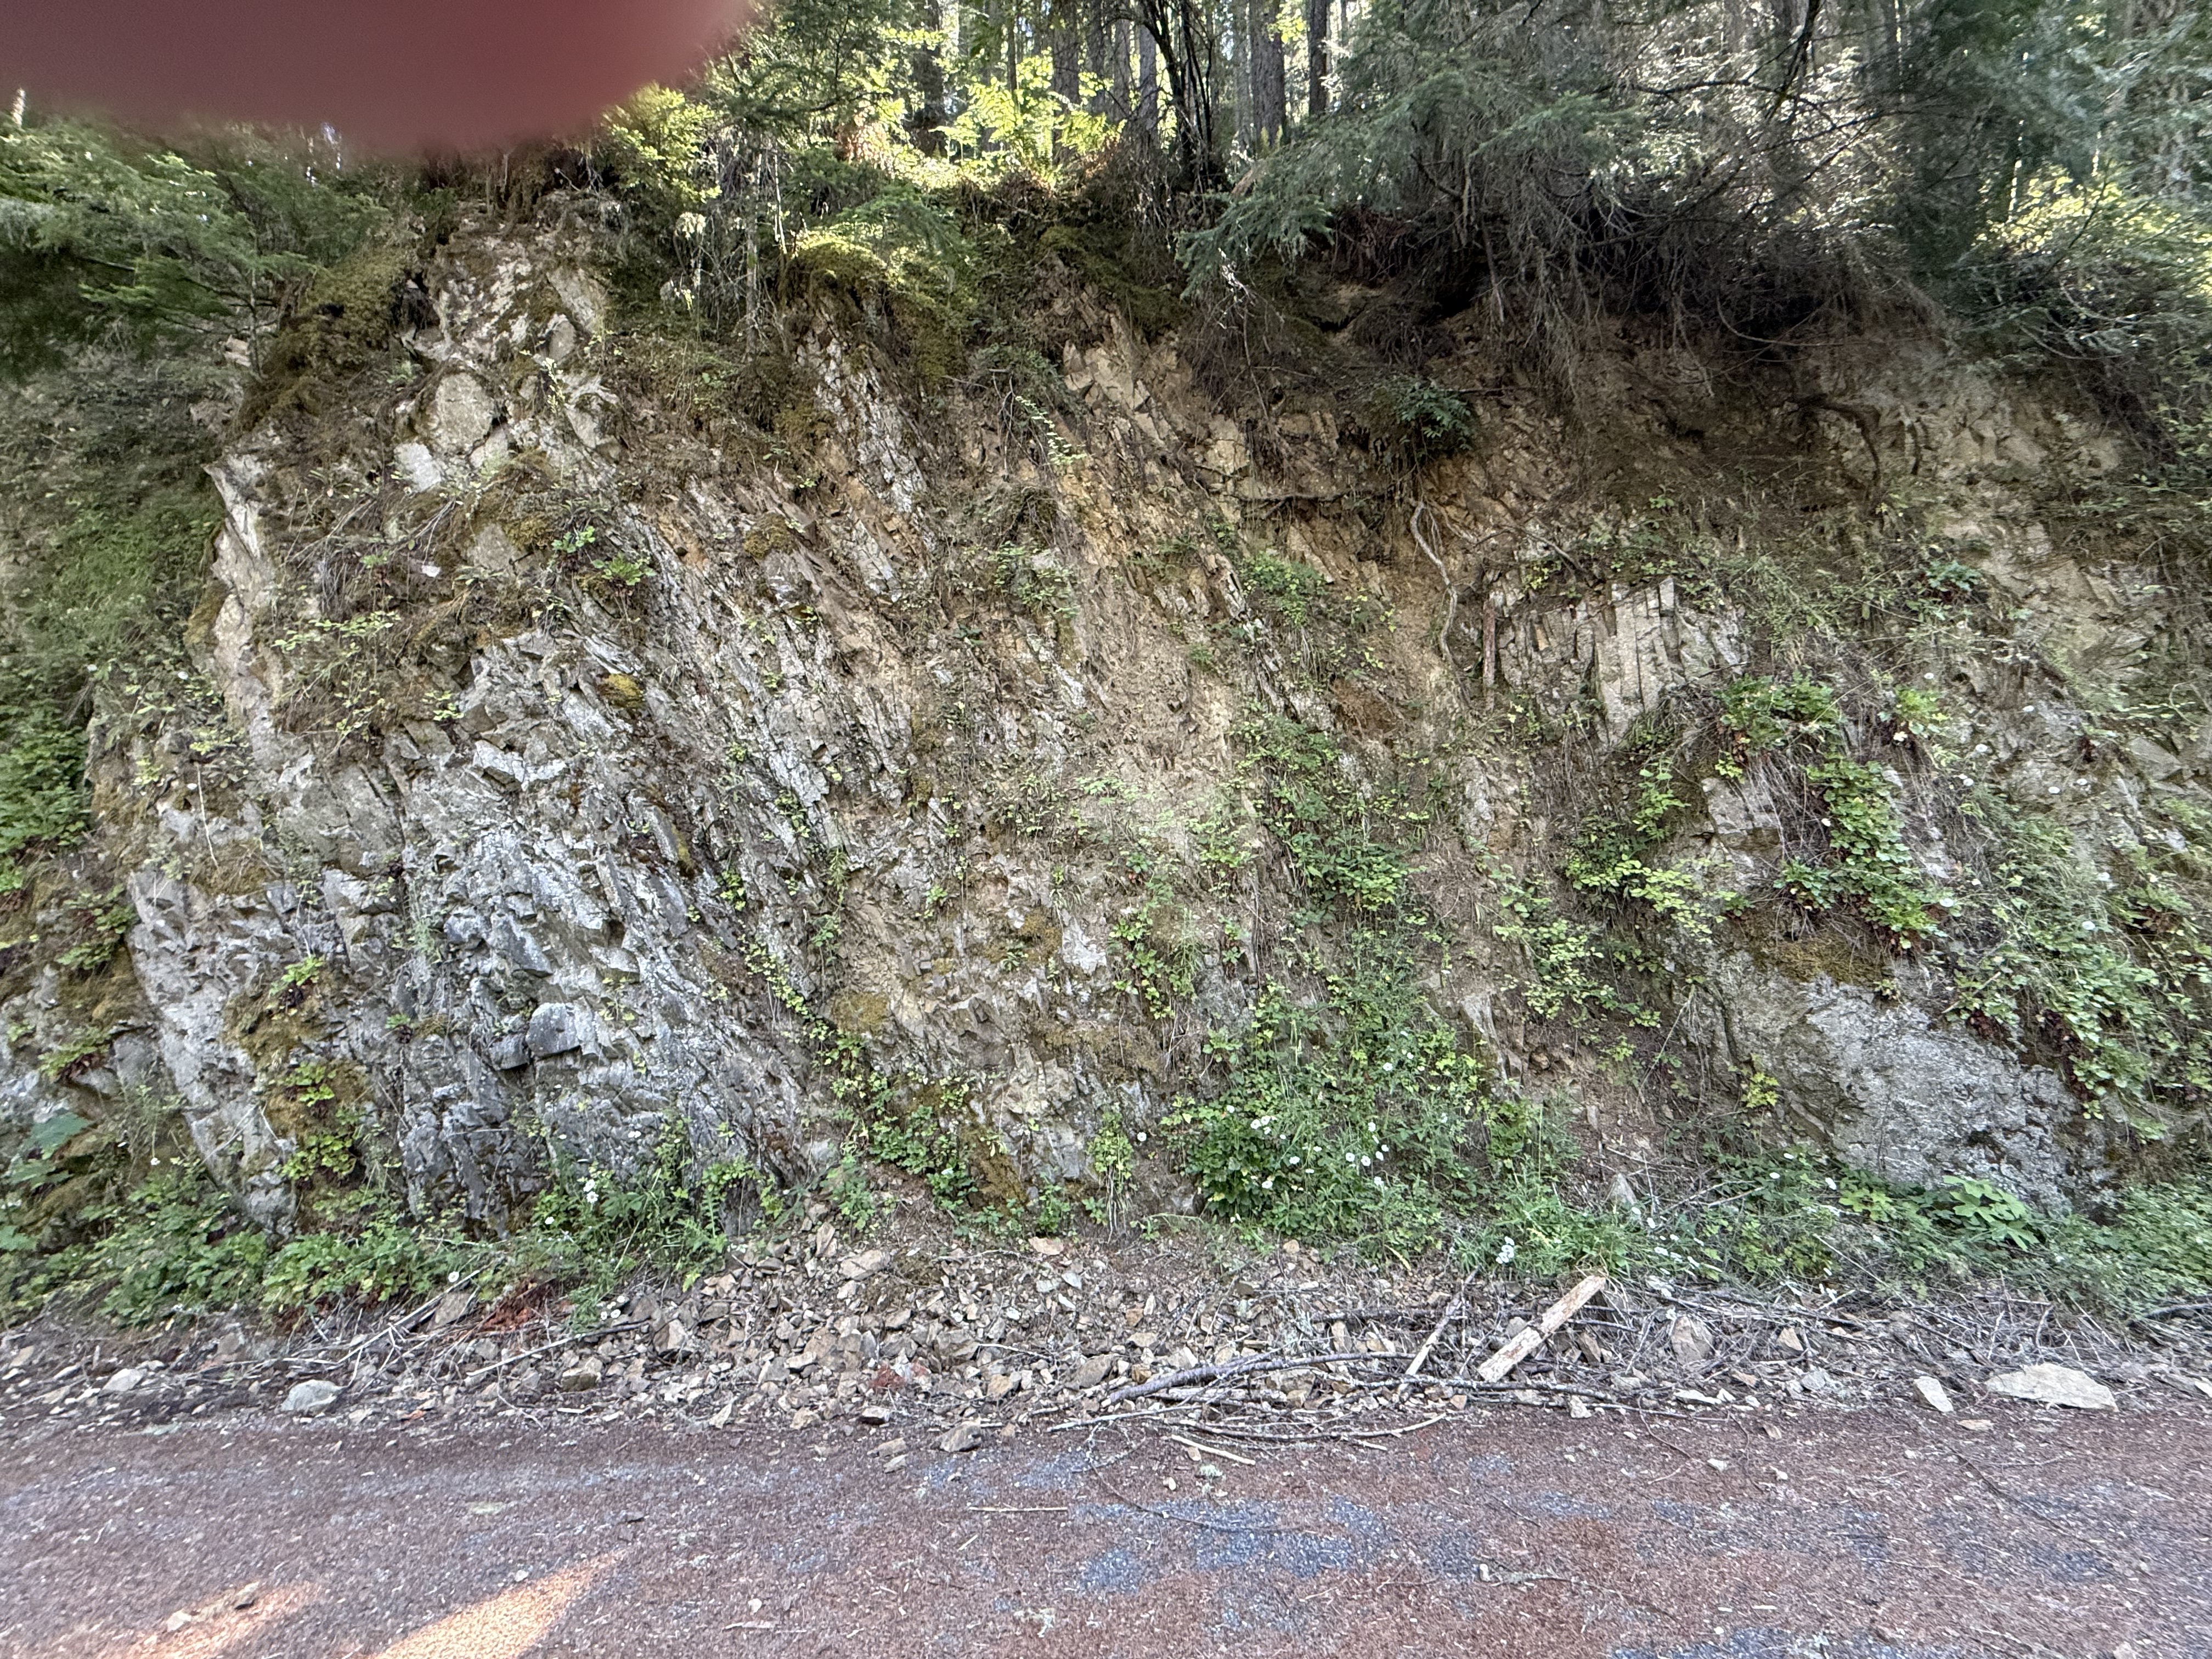
Figure 16. Another couple hundred yards further downstream (towards Carbonado in Fig. 2B), and we find thin layers of shale/sandstone nearly vertical, just like in Fig. 8. I didn’t measure my location precisely, but I wouldn’t be surprised if this is just above (uphill) the earlier observation. Note the layers of mud that resulted from differential weathering of clay layers within the Carbonado Formation.
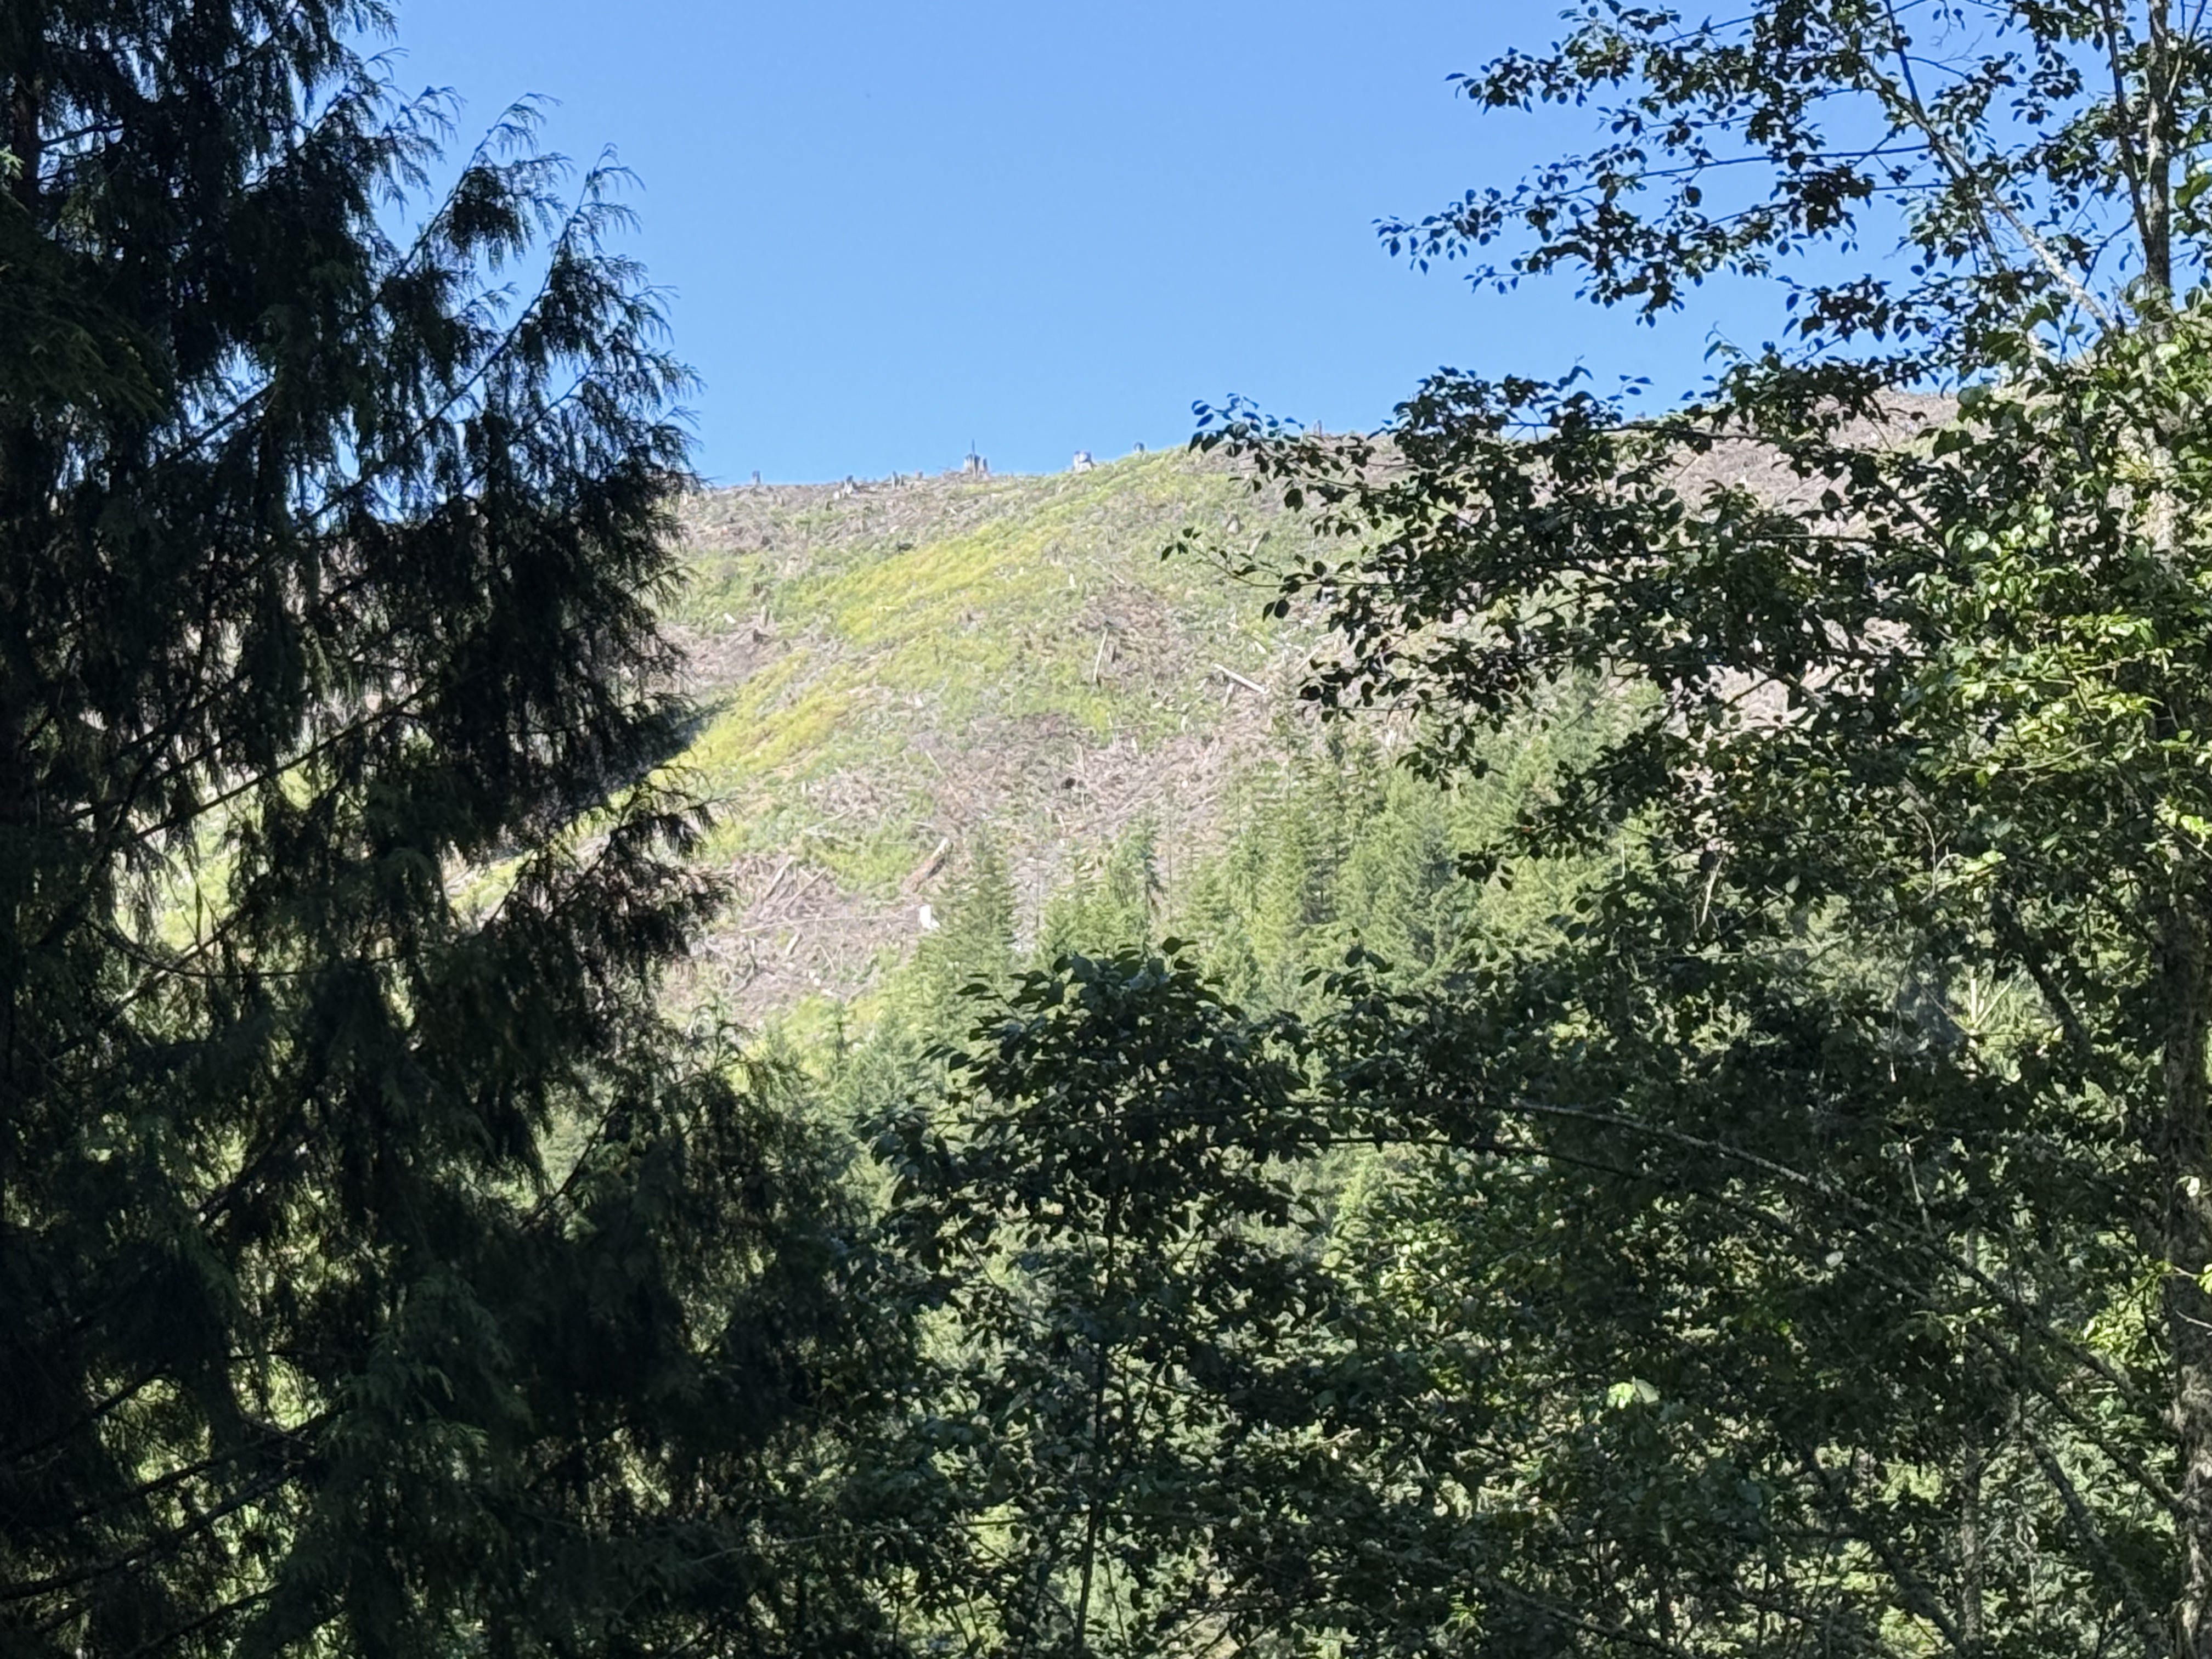
Figure 17. I included this image to explain why the Carbon River was so muddy a few miles downstream (Fig. 1). The canyon wall to the west has been clear cut recently, allowing massive erosion of soil into the Carbon River. This is an ongoing practice in Washington with no attempts to rein in such destructive deforestation — all for the sake of profits. It just pisses me off!
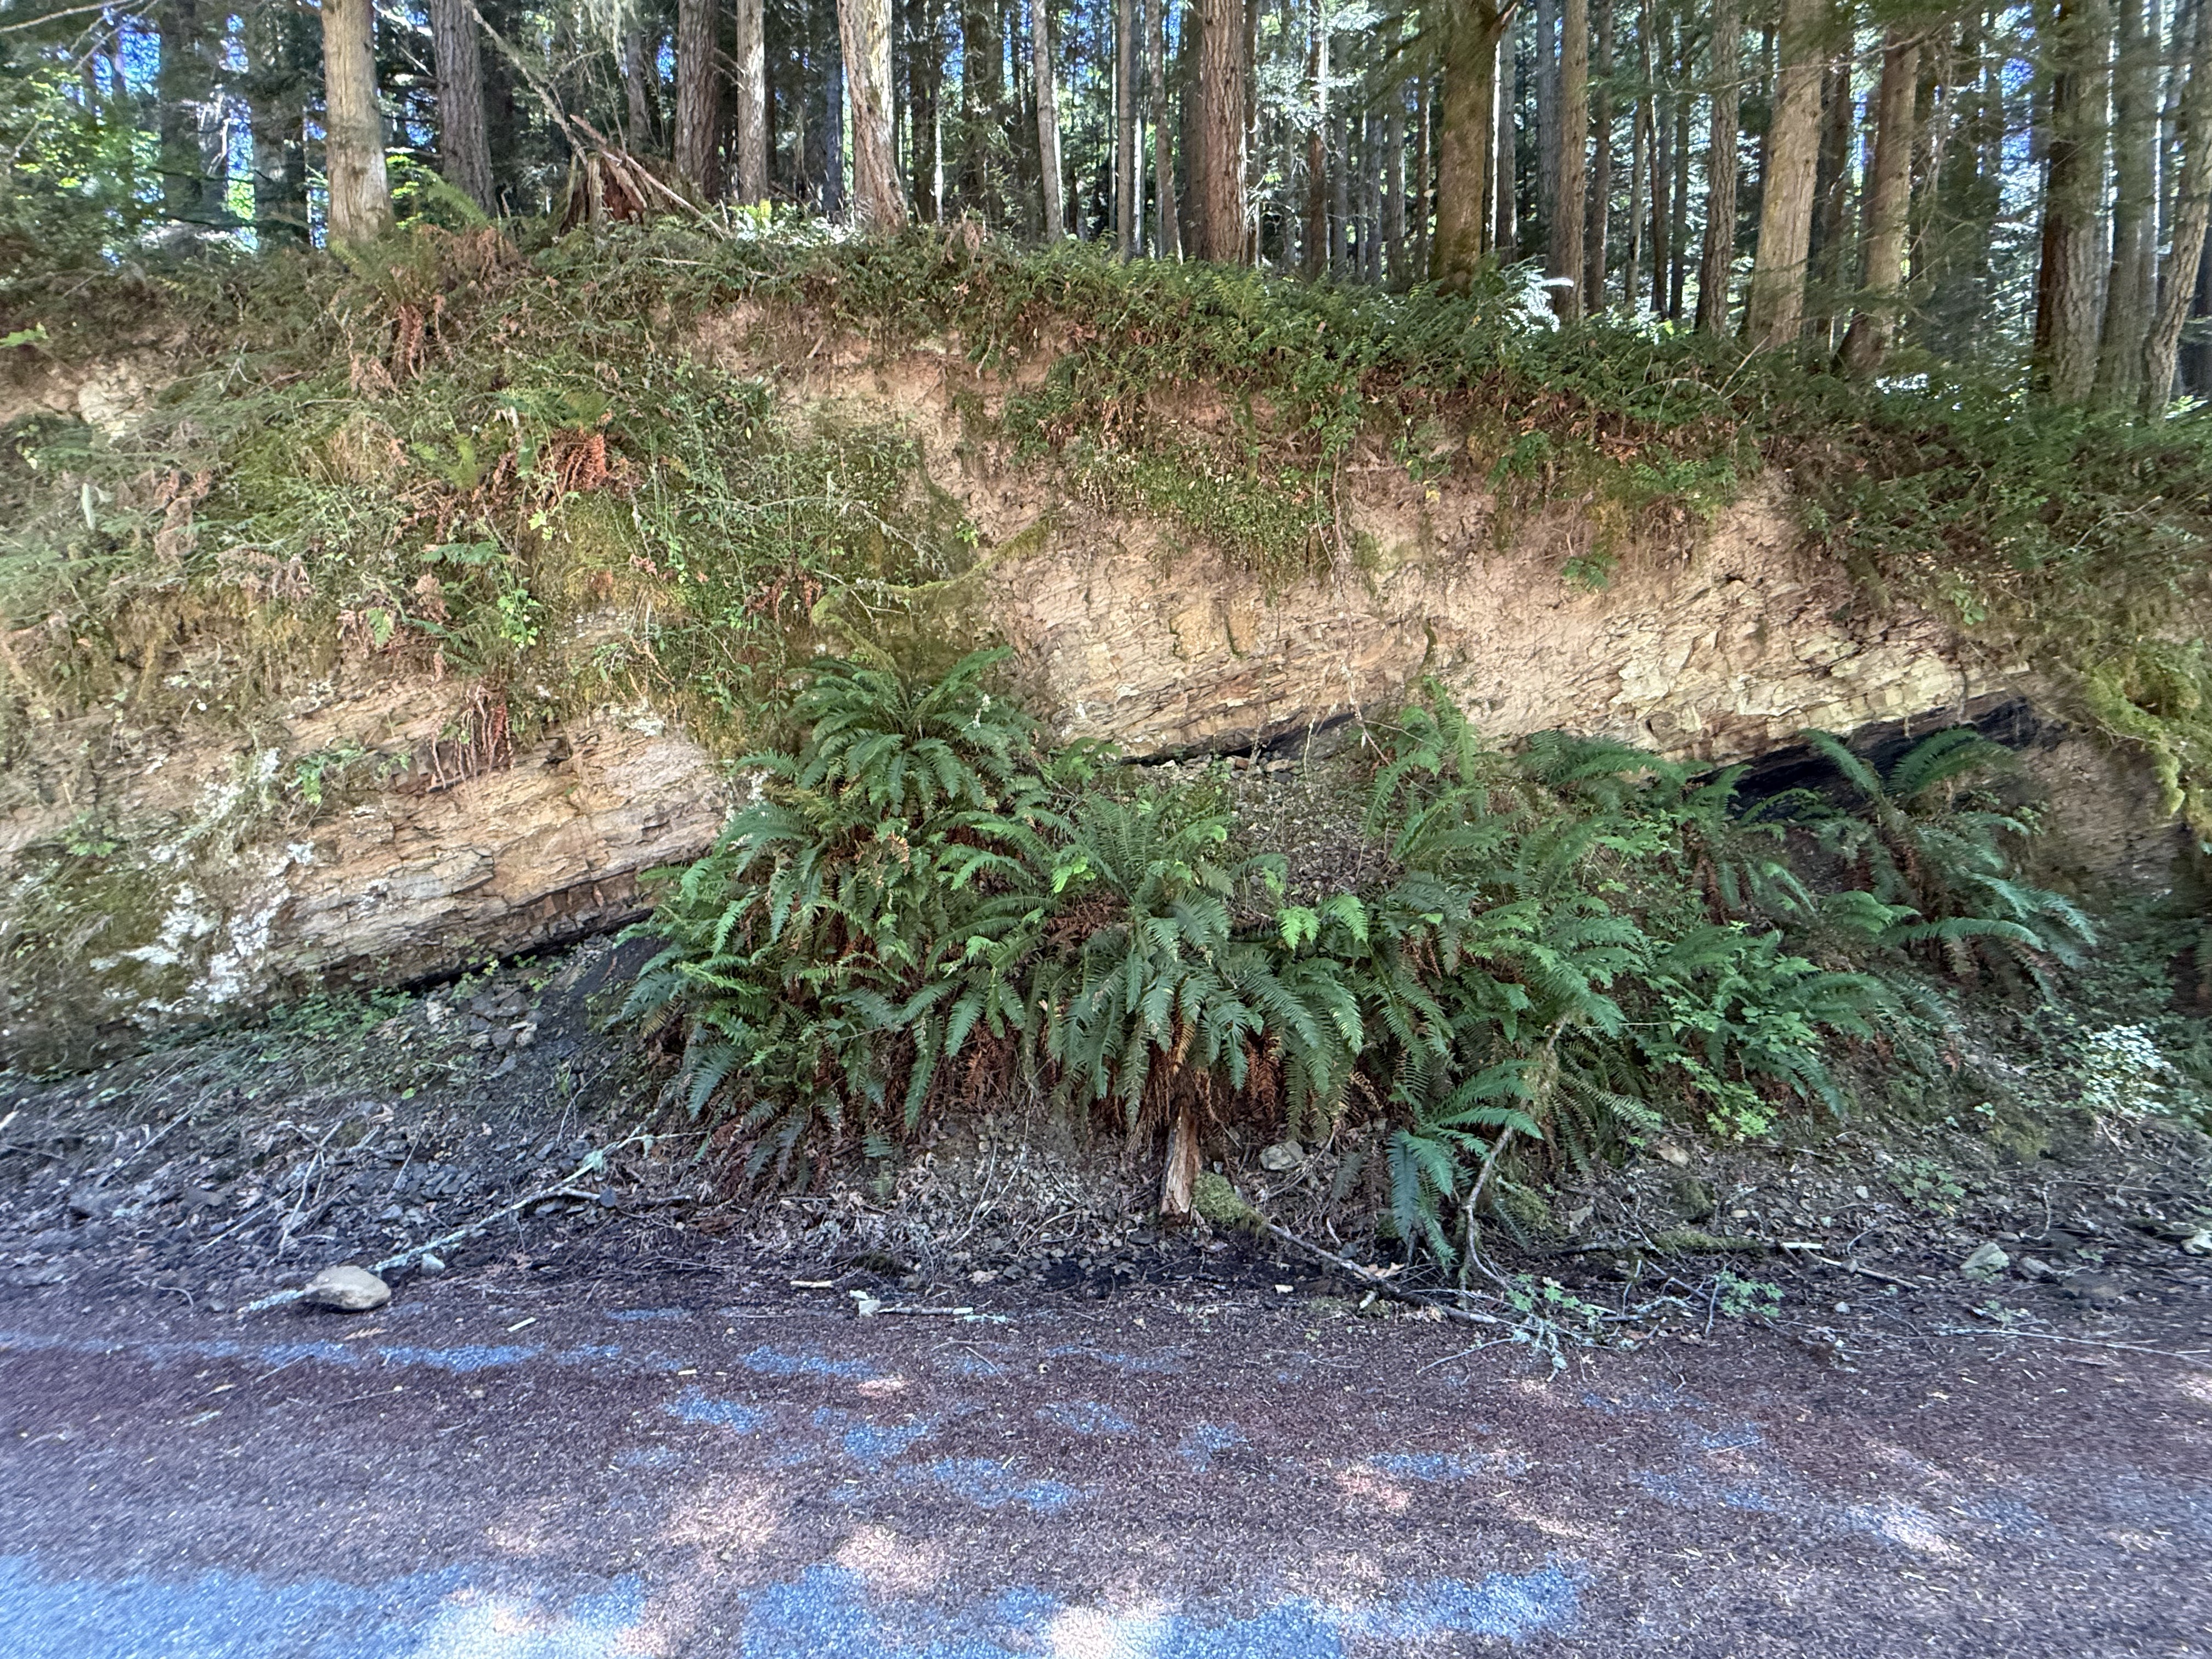
Figure 18. The main point of interest in this photo is that the Eocene sedimentary rocks are oriented differently from those in Figs. 14 and 16; these rock strata are dipping WNW(I didn’t measure strike and dip), rather than vertical or ENE. Faults don’t occur at the surface, but only shallow enough for the rock layers to break rather than bend. Identifying and mapping crustal faults is as much an art as a science because we don’t have the remote-sensing tools to see what lies beneath the surface, whether it is glacial till or bedrock.
Summary
We saw a lot more on this trip than I’d imagined during the 45 minute drive to Carbonado. I’ll put it all together into a chronology and try to relate it to other nearby locations we’ve visited. Let’s start as far back as the rocks will take us.
During the Eocene epoch, about 50 million-years ago, this area was covered with streams, lakes, and, presumably, forests. There were no rivers like the Carbon back then — the sediment consisted primarily of sand and silt, with a smattering of clay. These sediments were eroded from an active volcanic complex. Further west, along the Pacific coast of the Olympic Peninsula, contemporary rocks include turbidites deposited in deep water, probably submarine fans, and tectonic breccias. This tectonic environment has persisted to the present day. We examined one of these volcanoes, from the Miocene (~23-5 Ma), at Pinnacle Peak. We didn’t see any evidence of a nearby volcano today; instead, we saw several boulders that revealed what was going on within the magma chambers beneath the Cascades volcanoes.
Subduction didn’t end during the ensuing millions of years, but the earth changed. Ice sheets appeared during the Pleistocene (~2.4 Ma), covering the PNW while alpine glaciers formed in the valleys dissecting the volcanoes. Finally, about 500 thousand years ago, a really big magma chamber constructed Mt. Rainier; and Carbon River began to wind its way from the flanks of this monstrous volcano to the Puget Sound trough during interglacial periods. This entire canyon would have been filled with ice during cold periods. It was during this period that Carbon River would have emerged from the eroding, ice-covered terrain. It didn’t cut its canyon but inherited it, and transported the remnants of a permanently altered terrain.
During glacial retreat, thick blankets of sediment were deposited by rapidly flowing rivers fed by the glaciers. This occurred repeatedly for two million years, culminating in the most recent glacial deposits seen in Fig. 6. However, this process of glacial advance and retreat occurred within both the vast continental glacier and the alpine glaciers, resulting in overlapping layers of poorly sorted sediment.
One final word: the muddy water we saw in the Carbon River is probably caused by the clear-cutting of the steep slopes defining its canyon; however, glacial melt during the summer transports a lot of fine material from beneath the glaciers covering Mt. Rainier. When we visited the Nisqually glacier and viewed the headwaters of Nisqually River in December, the water was crystal clear. Maybe the water turns opaque every summer.
It has been a wild ride through the last 50 million years along the modern Carbon River.
The Flora of Point Defiance Park
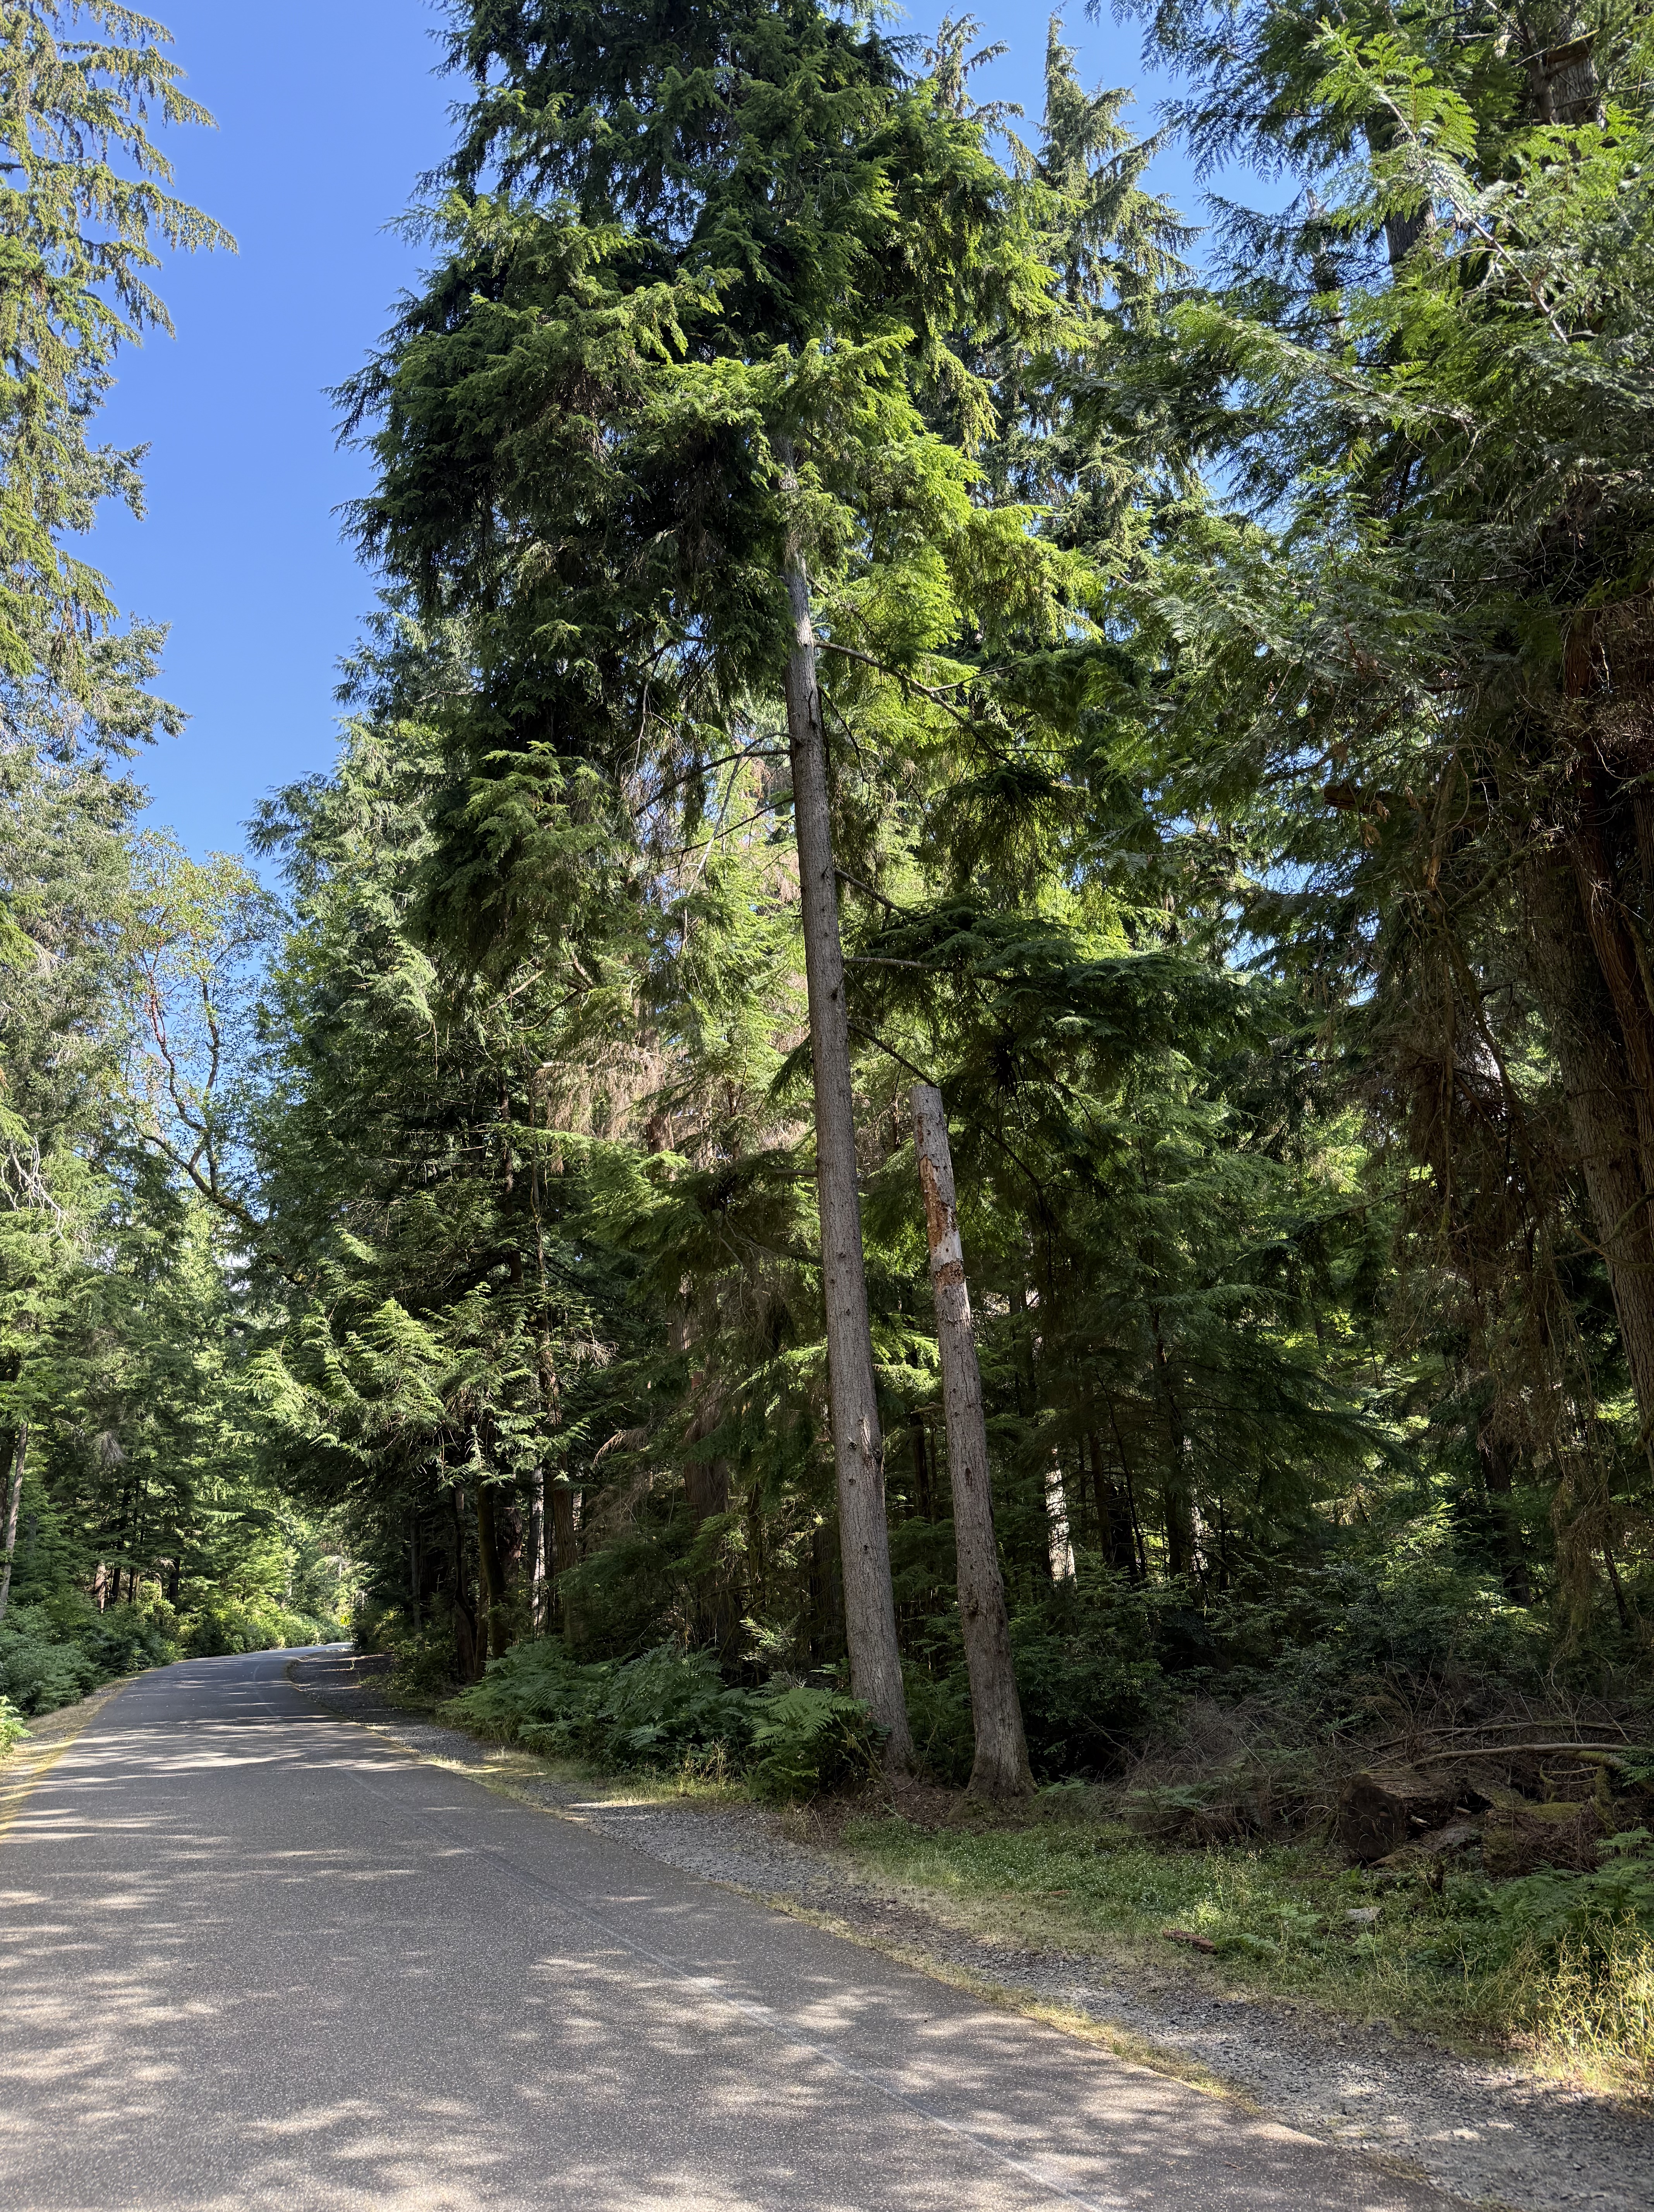
This beautiful, mature second‑growth coastal temperate rainforest is only ten minutes from my house. I should get there more often, and perhaps I will after taking an interest in ecosystems in addition to geology. Today’s outing was an opportunity to begin acquainting myself with the ecosystem I inhabit, so I made an effort to identify several plants along Five Mile Drive, a road that circumnavigates the forest and is permanently closed to auto traffic. When I started walking along this path, this forest was nothing but a lot of green trees and stuff. My perspective changed over an hour or so, and about 2.5 miles.
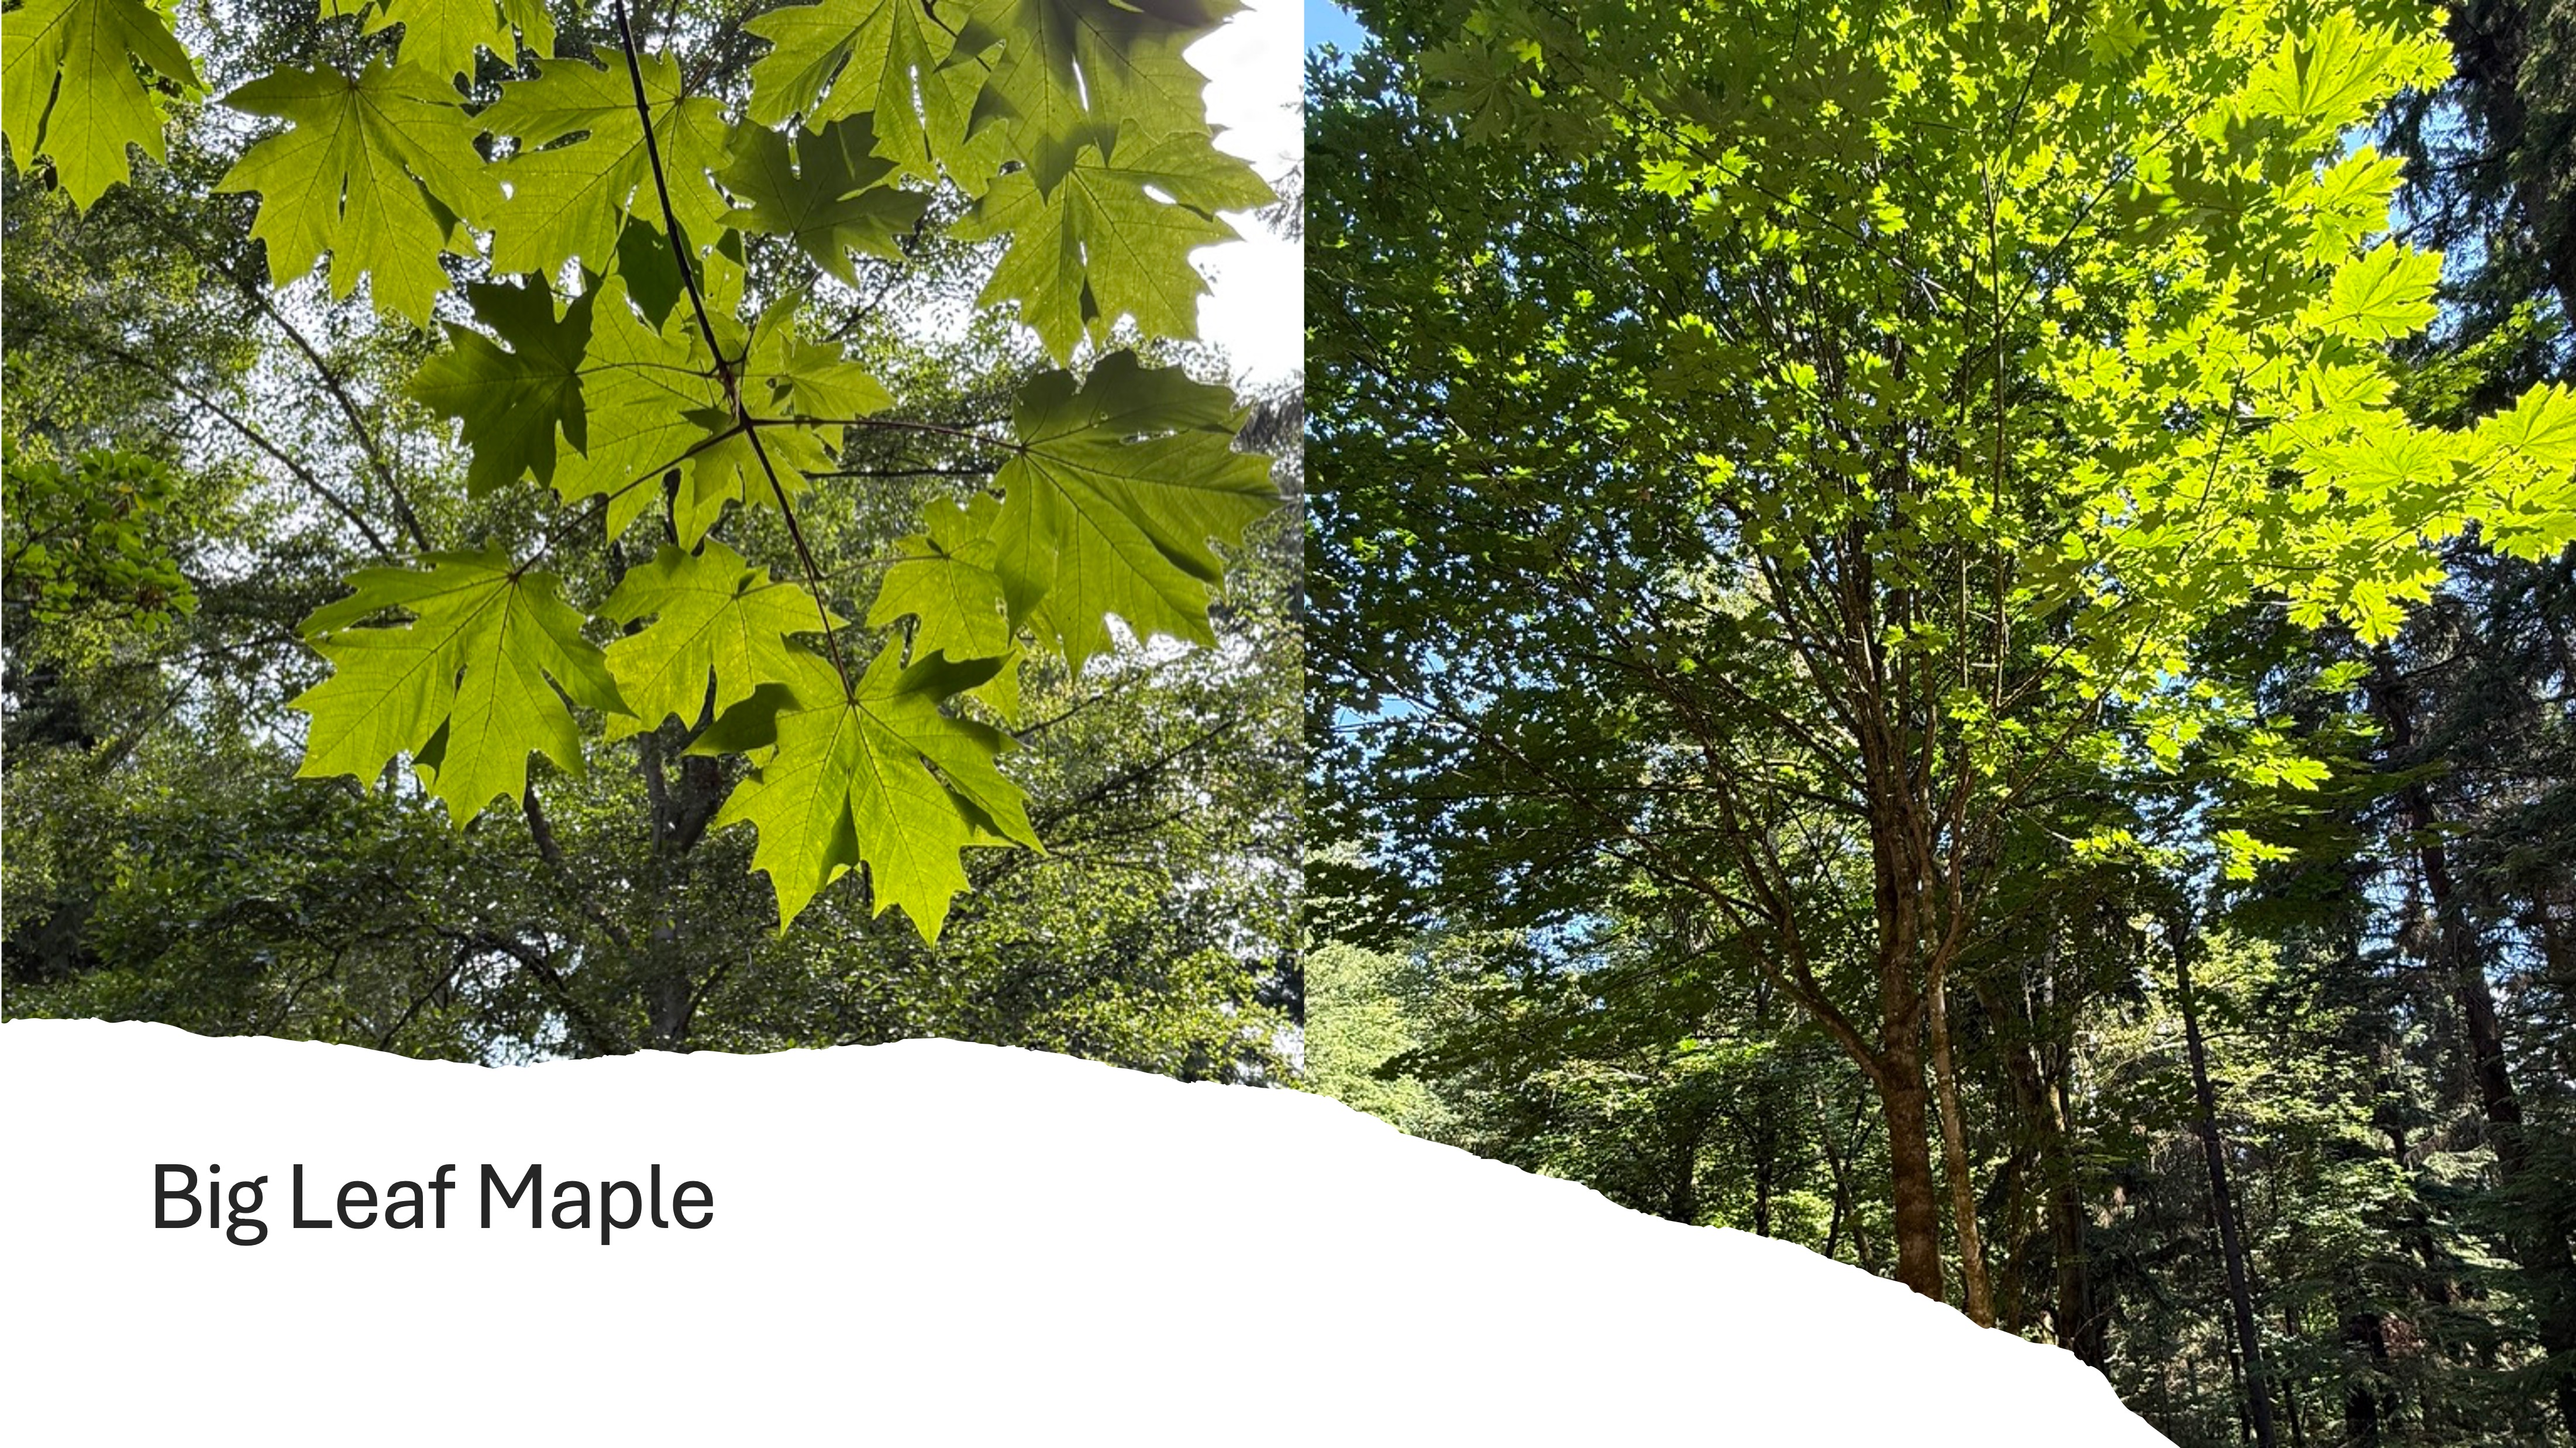
This colorful maple tree is a native to Puget Sound. It earns its name because those deeply lobed leaves are up to a foot across. But what are its roles in this forest? CoPilot had a lot to say about that. The Big Leaf Maple is fundamental to this ecosystem because it creates a huge amount of leaf litter that contributes to the forest floor and thus supports a vast microbiome, as well as a nurturing environment for conifer seedlings. This large tree (50-150 feet) fills in gaps in the forest canopy, supplying shade and catching rainwater, as well as dew. Its dappled shade creates a diverse understory for new growth. It is important in the success of birds, insects, bats, squirrels, and deer. They all hang around it and depend on its large mass for homes and meals. Its large root system contributes to hydrologic stability by stabilizing slopes, slowing runoff (and erosion), retaining moisture, improving soil infiltration.
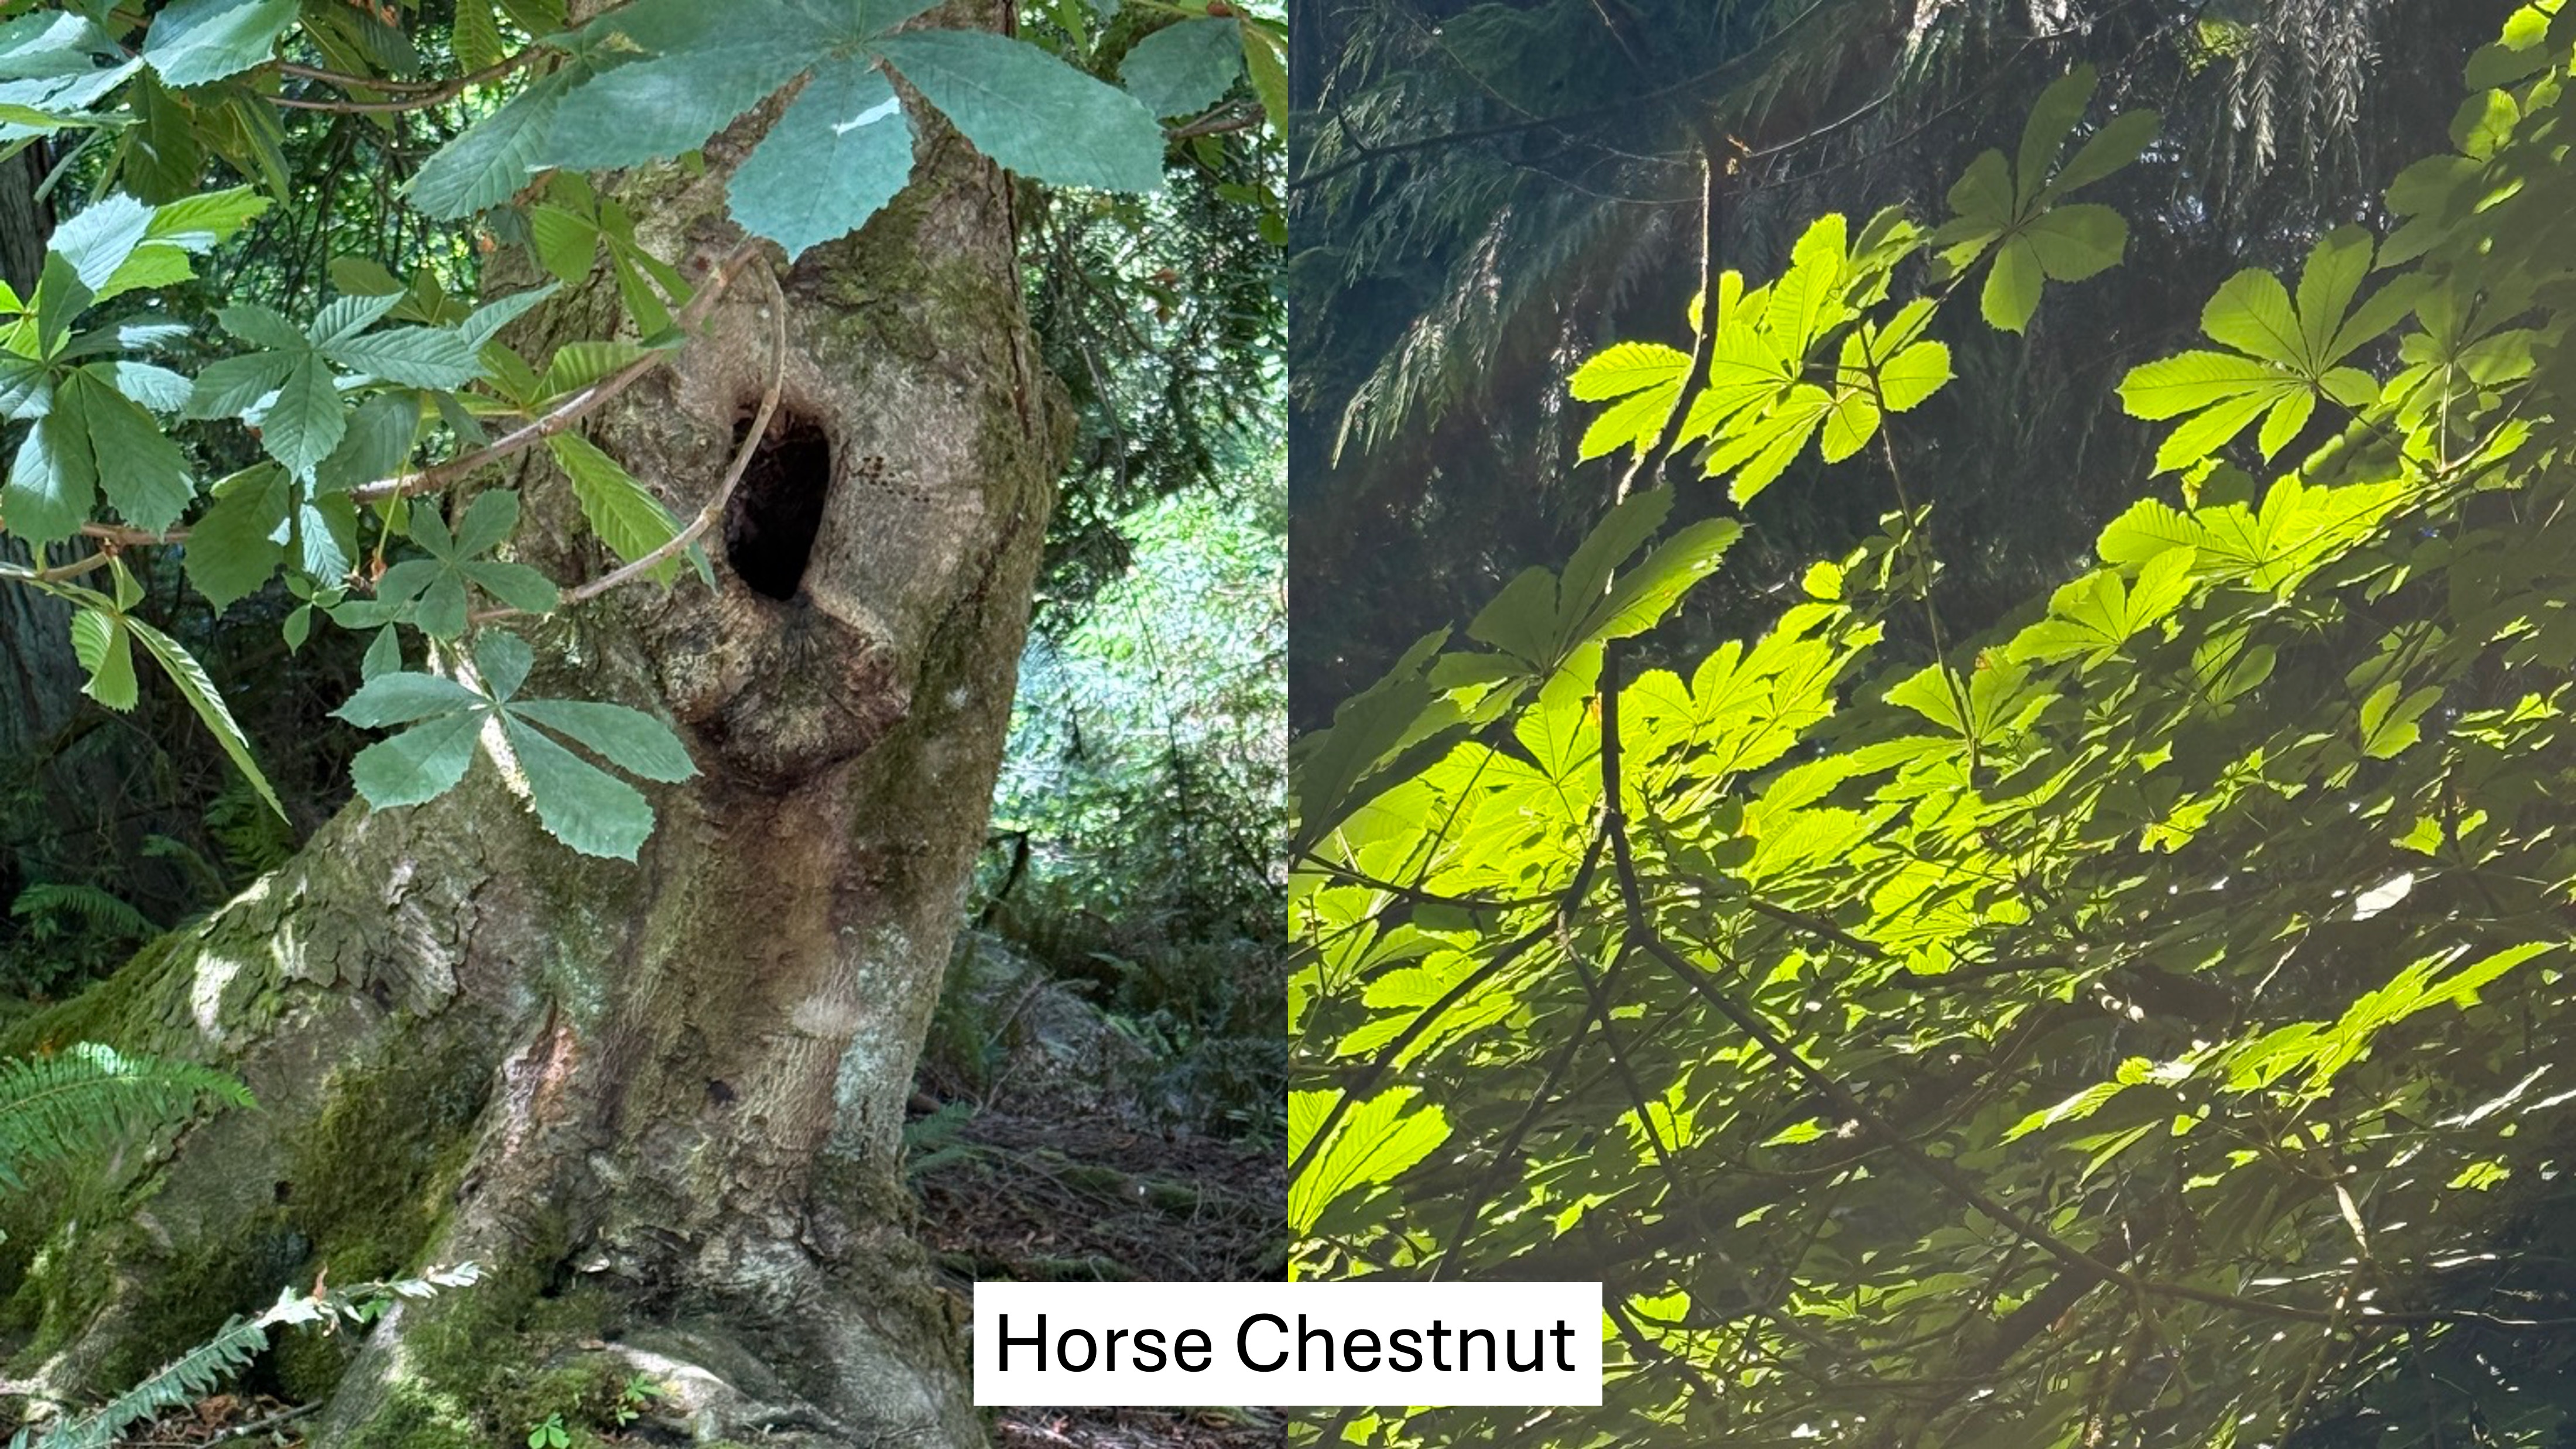
This large tree is native to SE Europe and they were introduced after the logging boom led to immigration. However, it is not an aggressive invader; this lovely tree does not form thickets, outcompete conifers, spread wildly, alter soil chemistry, suppress understory diversity, or create monocultures. In CoPilot’s words, “It’s a polite non-native.”
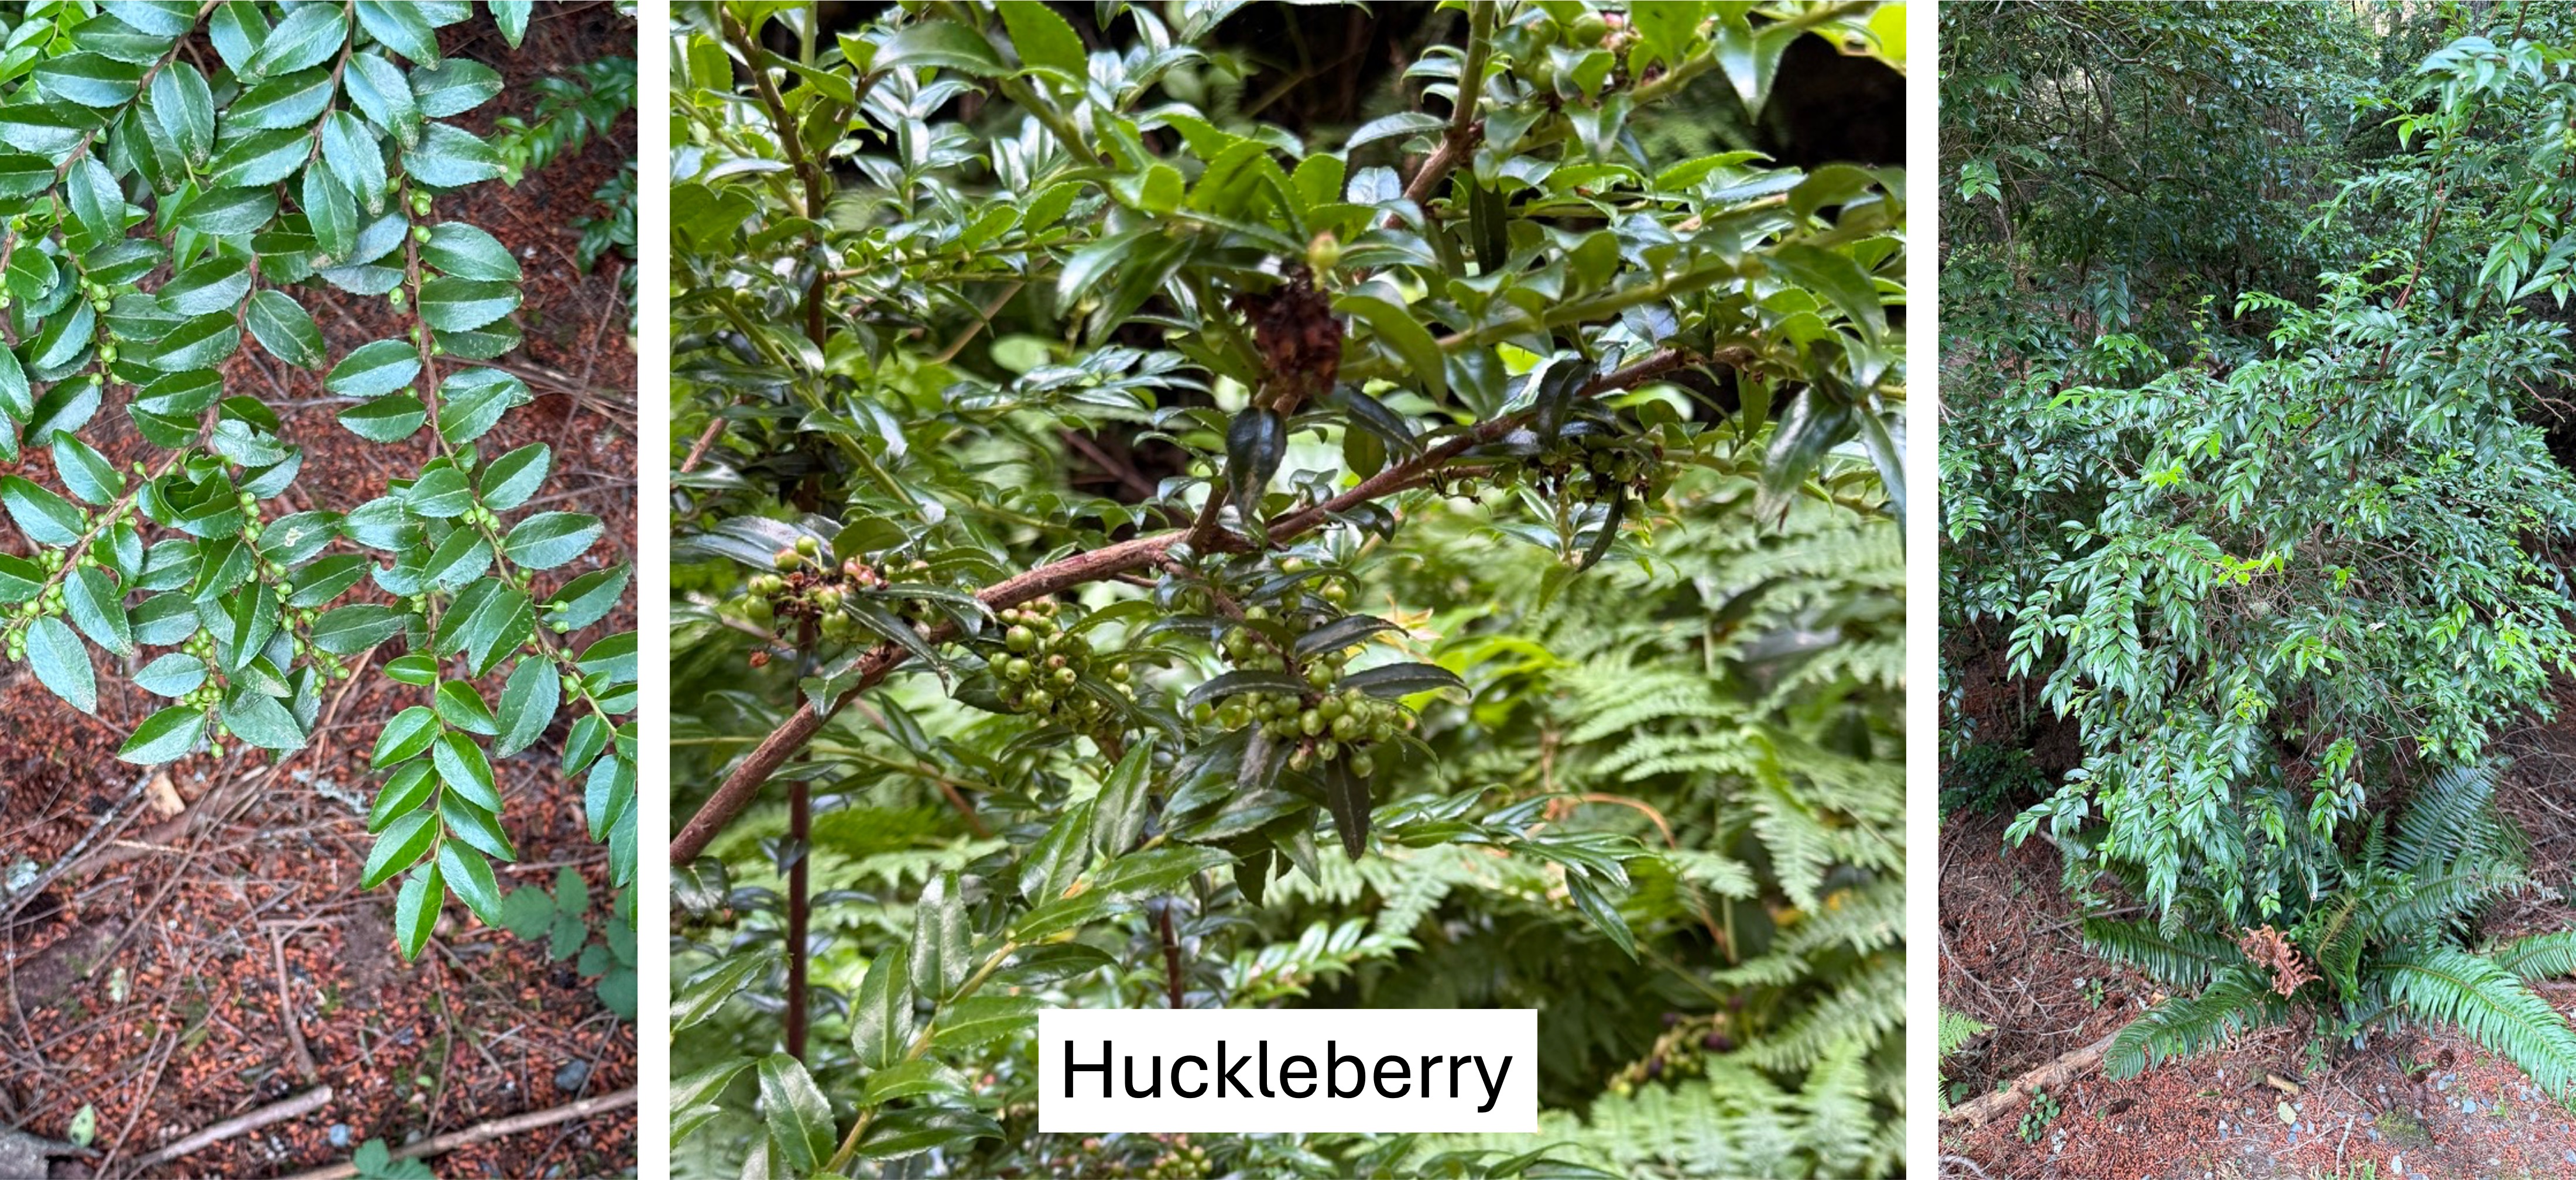
This nondescript shrub gives the forest its lush, evergreen understory identity. It is one of the top berry producers in the Puget Sound lowland forest but, more importantly, its berries ripen later in the season, extending the berry window into early fall. It also thrives in the acidic soils Douglas fir and hemlock create, in turn moderating soil conditions. It bridges the gap between ecological disturbance (i.e. logging) and late-successional forest. One could say that it serves as a node in the forest’s ecological web. This is an unrecognized keystone species in the understory.
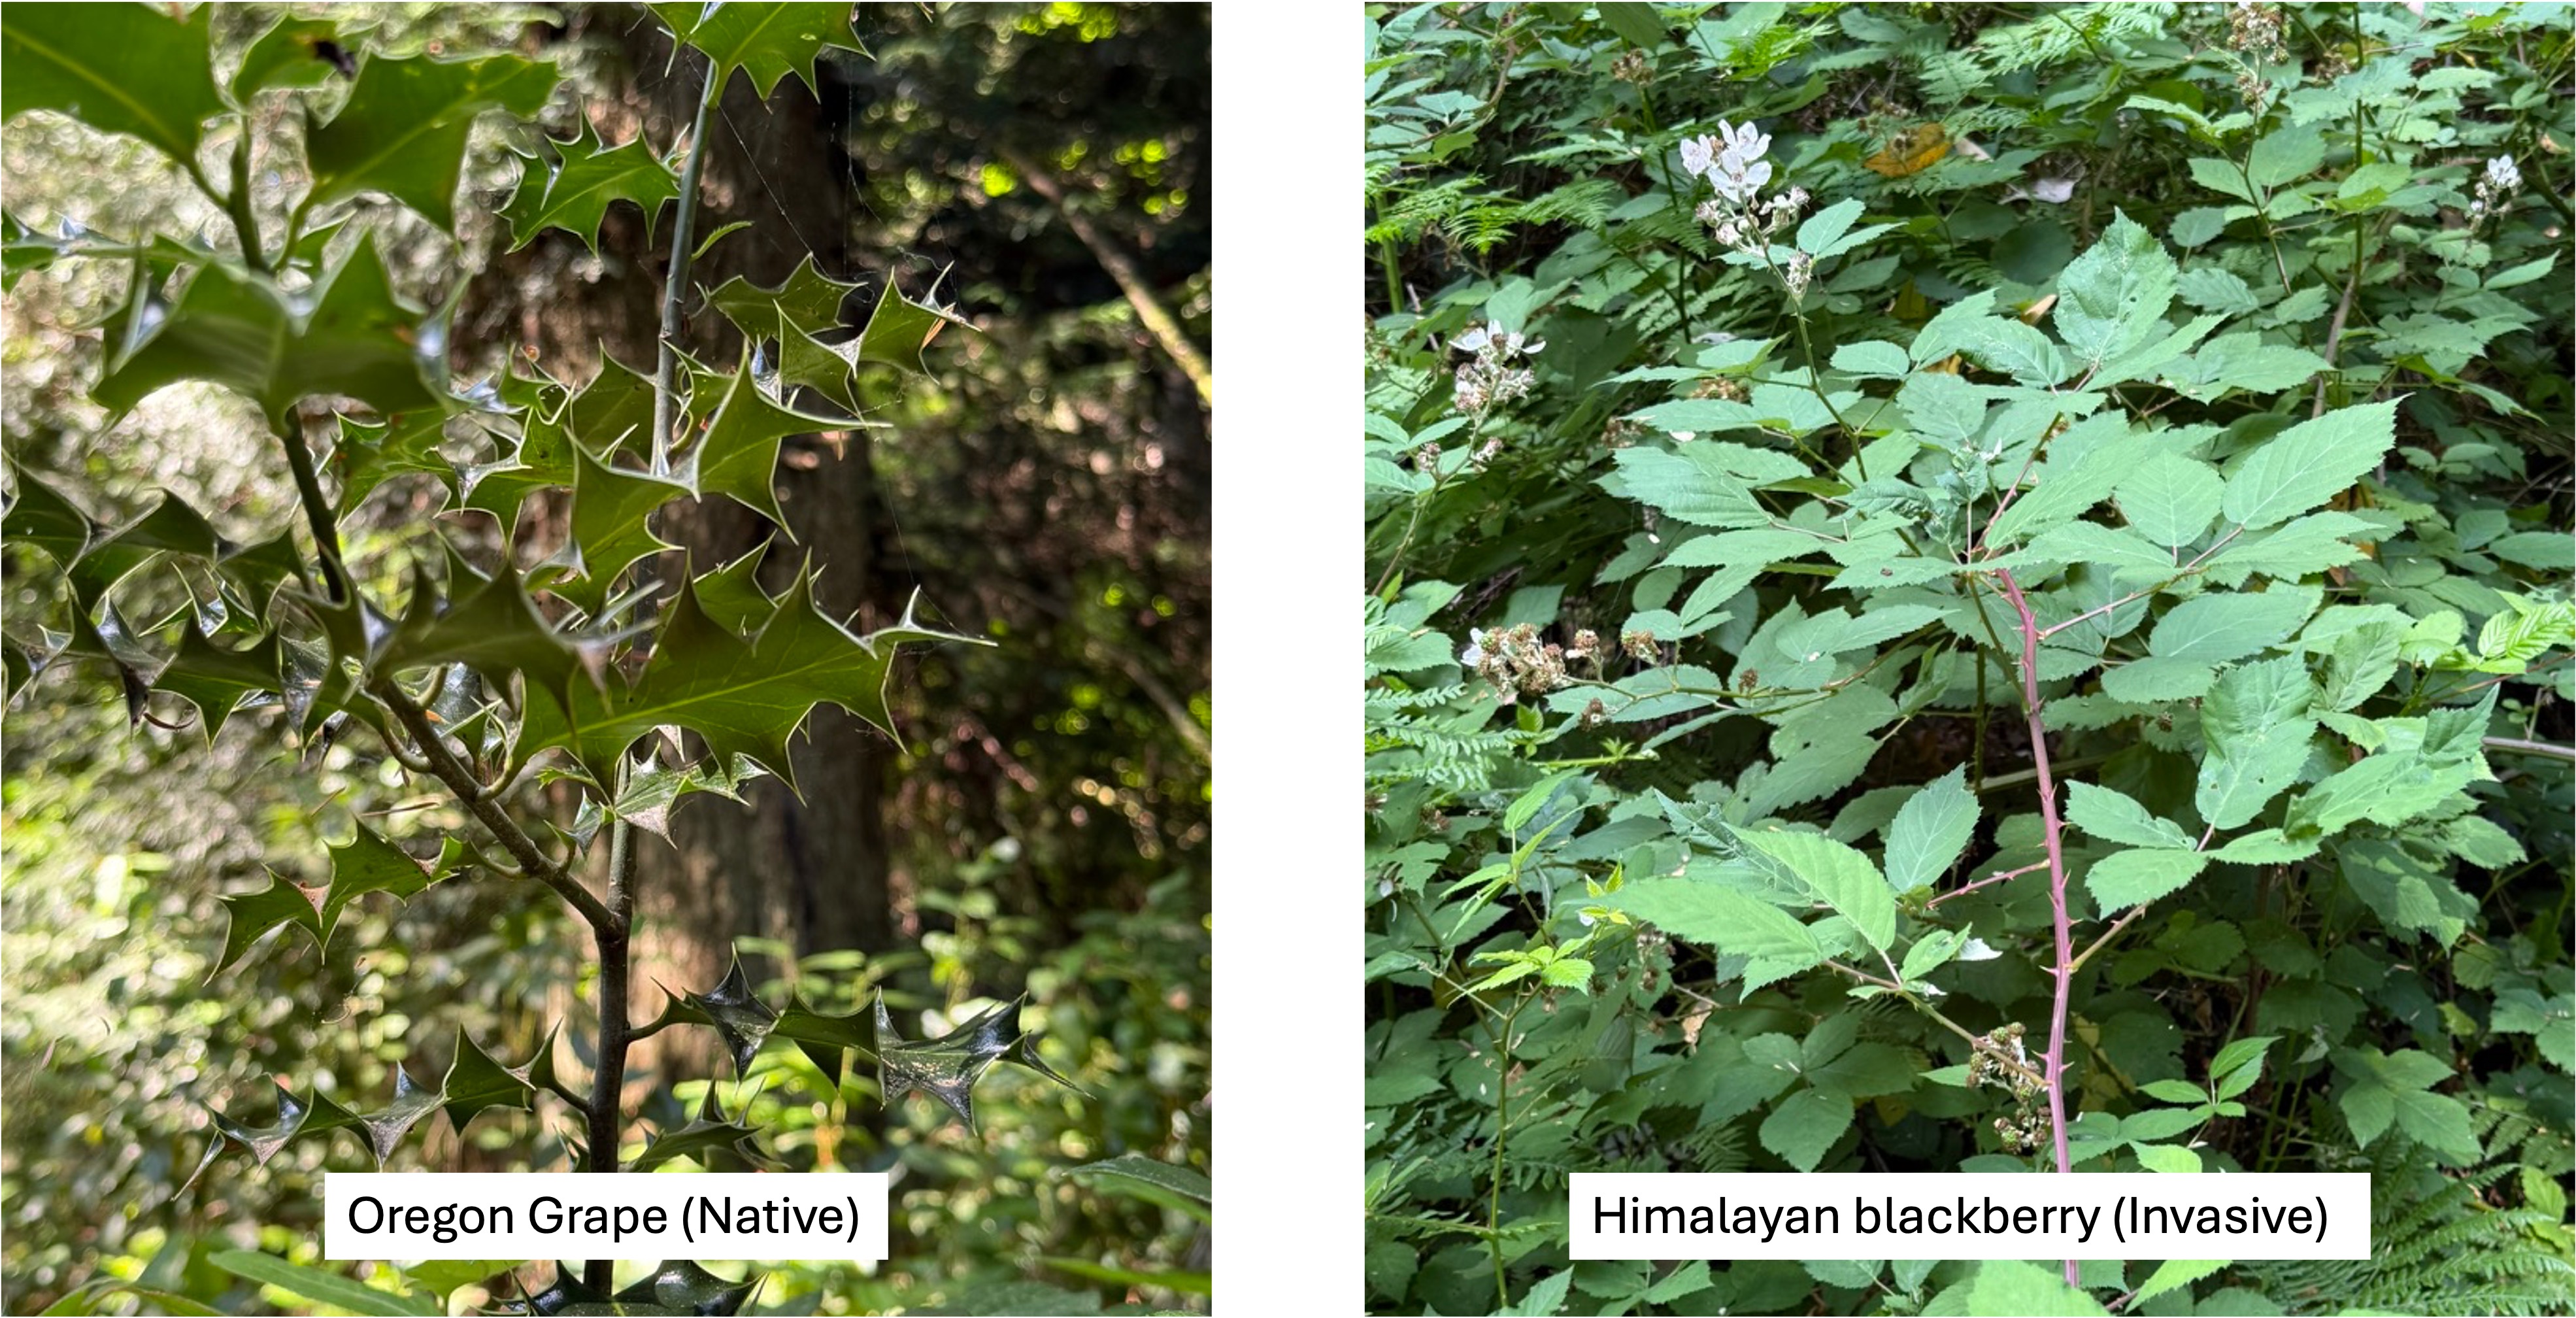
Oregon grape is the huckleberry’s silent partner in keeping the understory secure because it is also an evergreen shrub. In addition, it supplements the food web by blooming in March-April, providing nectar when few other shrubs are in bloom. Its berries ripen by mid-summer, bridging the gap between early berry producers like salad and late huckleberries. It precedes huckleberry in forest succession but persists as the canopy creates a shadier understory.
Himalayan blackberry is less like the fruit-bearing huckleberry and Oregon grape, and more like the Trojan Horse. The fruit are abundant and sweet, produced for a long season, and loved by all the denizens of the forest; thus, they are spread like wildfire, colonizing the entire forest–without predators in Pt. Defiance. The result of this invasion includes impenetrable thickets, root masses that choke other species, spreading by long, arching canes, and monocultures. It kills all the other stabilizing shrubs and creates a single mass of Himalayan blackberry. If left unchecked it can destroy an entire ecosystem, including the conifers. Holy shit!
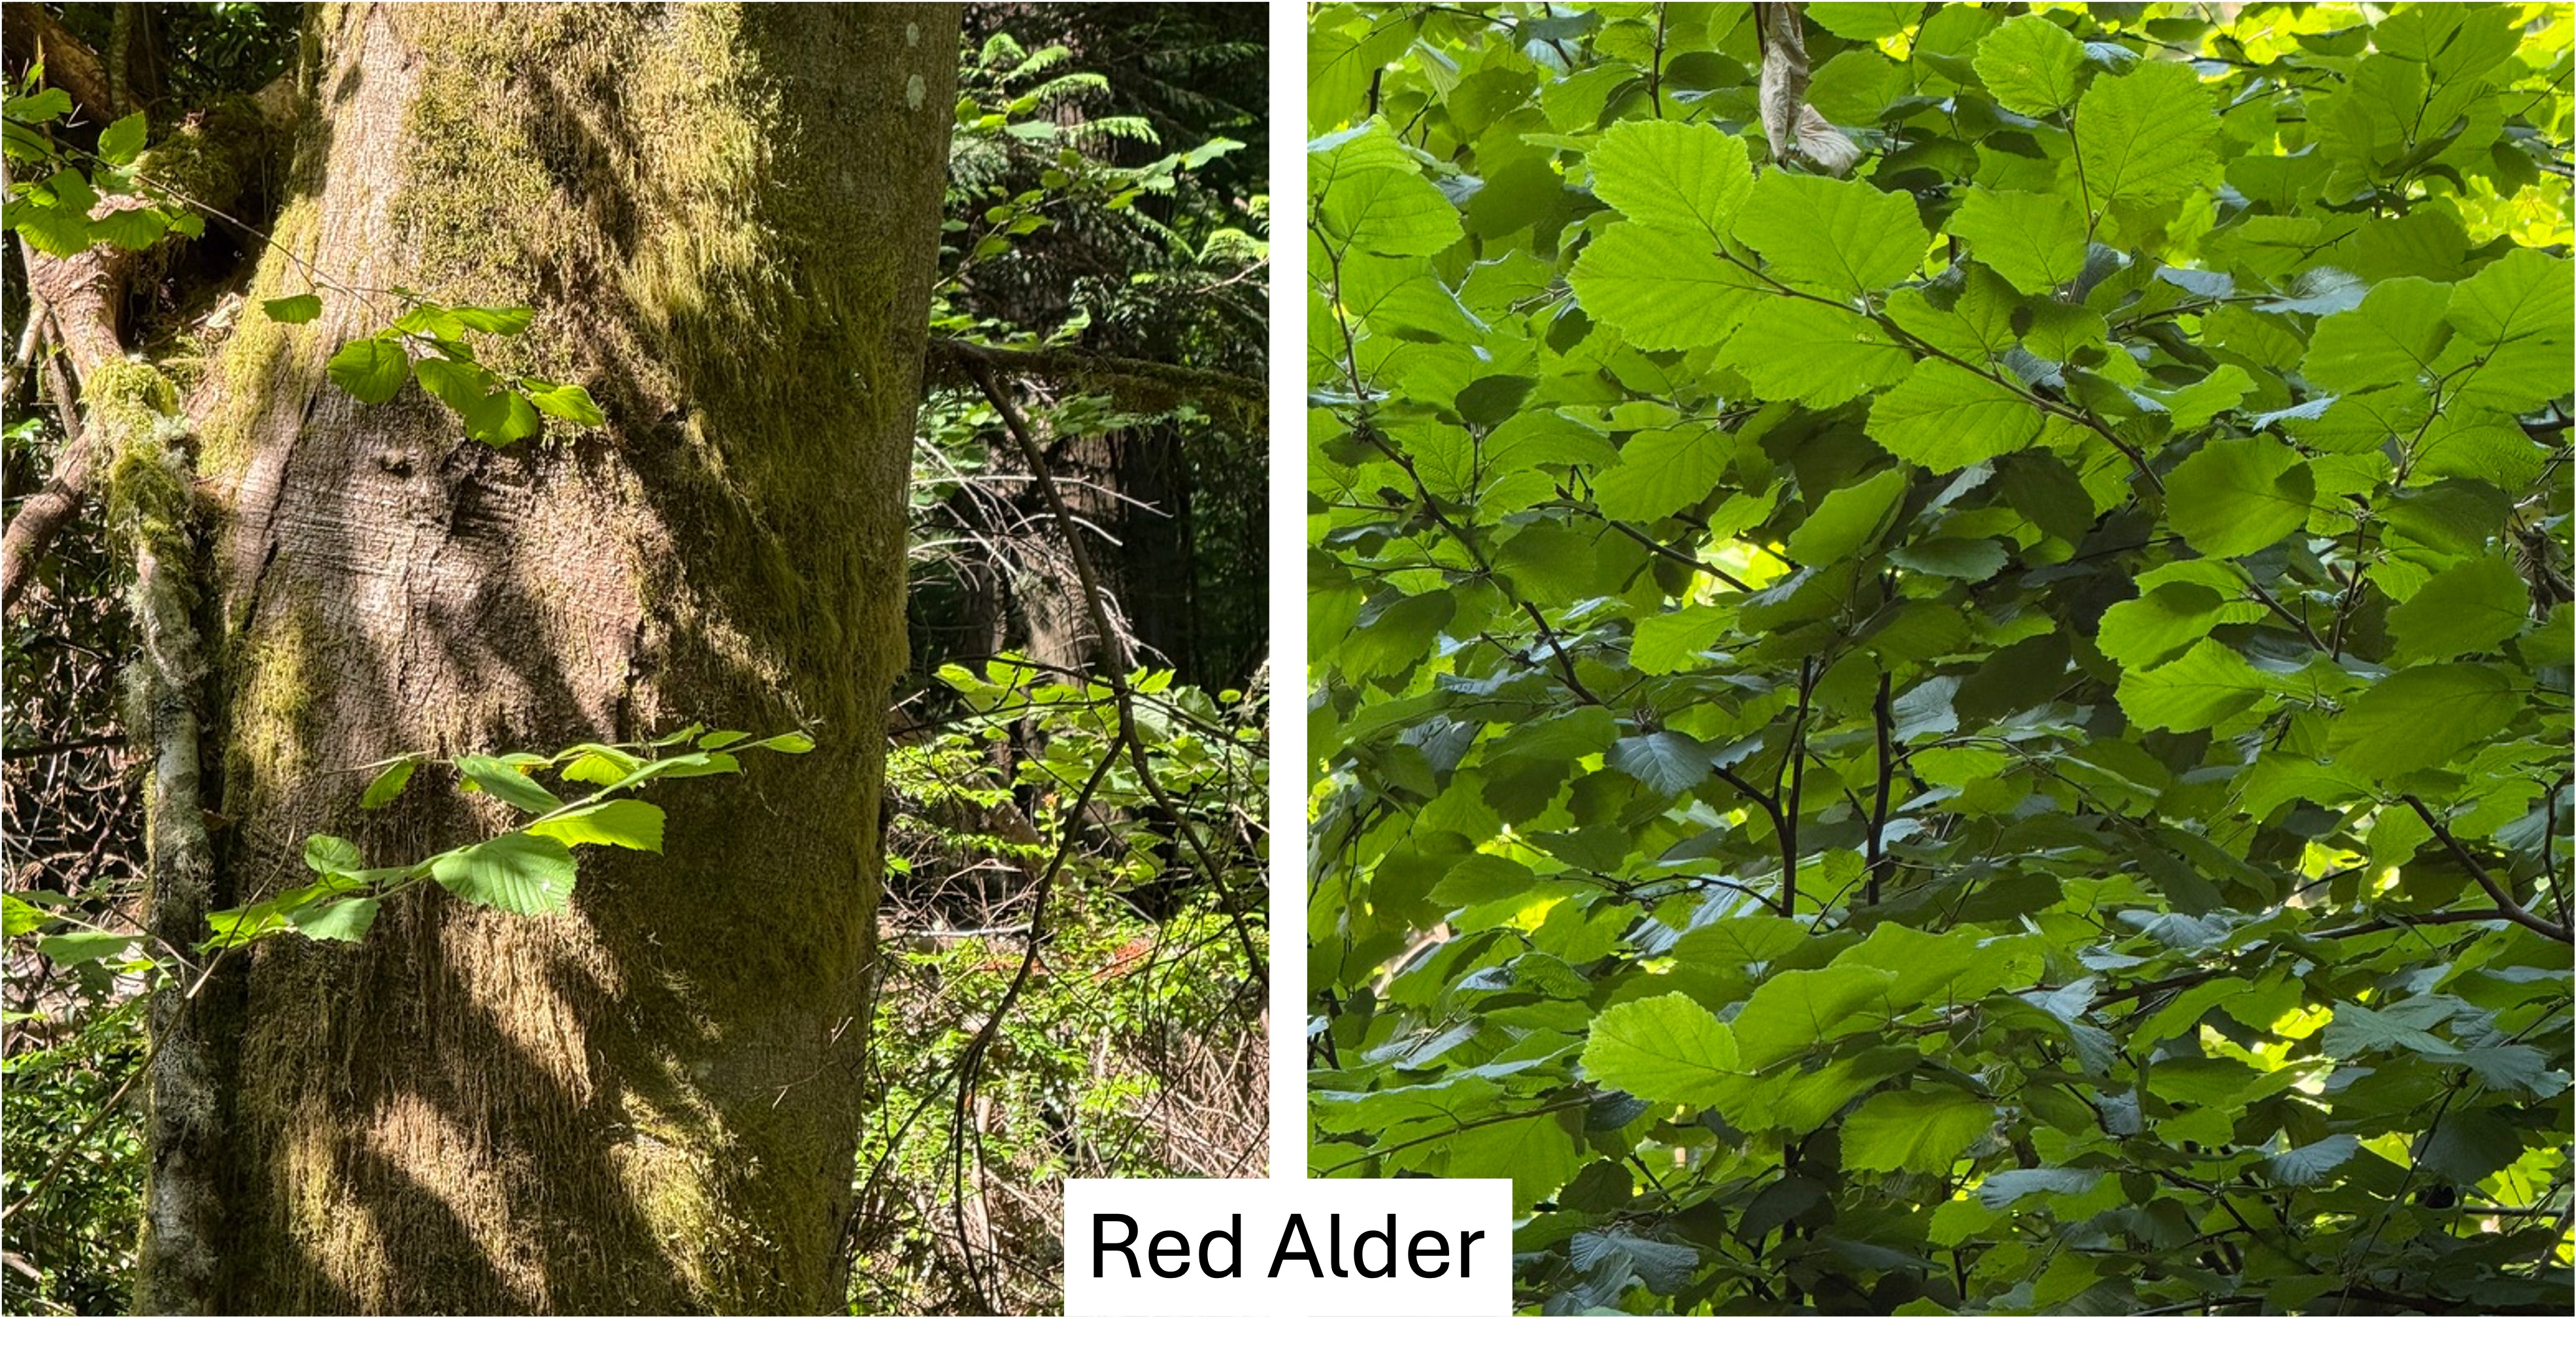
This nitrogen-fixing tree is the first responder when the forest is disturbed. As such it enriches soil, accelerates forest recovery, feeds the next generation of conifers, increases understory diversity, boosts fungal activity, and generally improves growth rates of proximal plants. Alder is the first tree to reoccupy damaged land, preparing the site for the conifers that will come later. Wherever alder stands exist, the biodiversity of the forest is increased. Because it gives so much to the forest, alders only live 40-60 years, thus acting as a continuous healing agent as a forest recovers from an environmental shock. This is the pioneer tree of the lowland forest. I hope it can defeat the Himalayan blackberry.
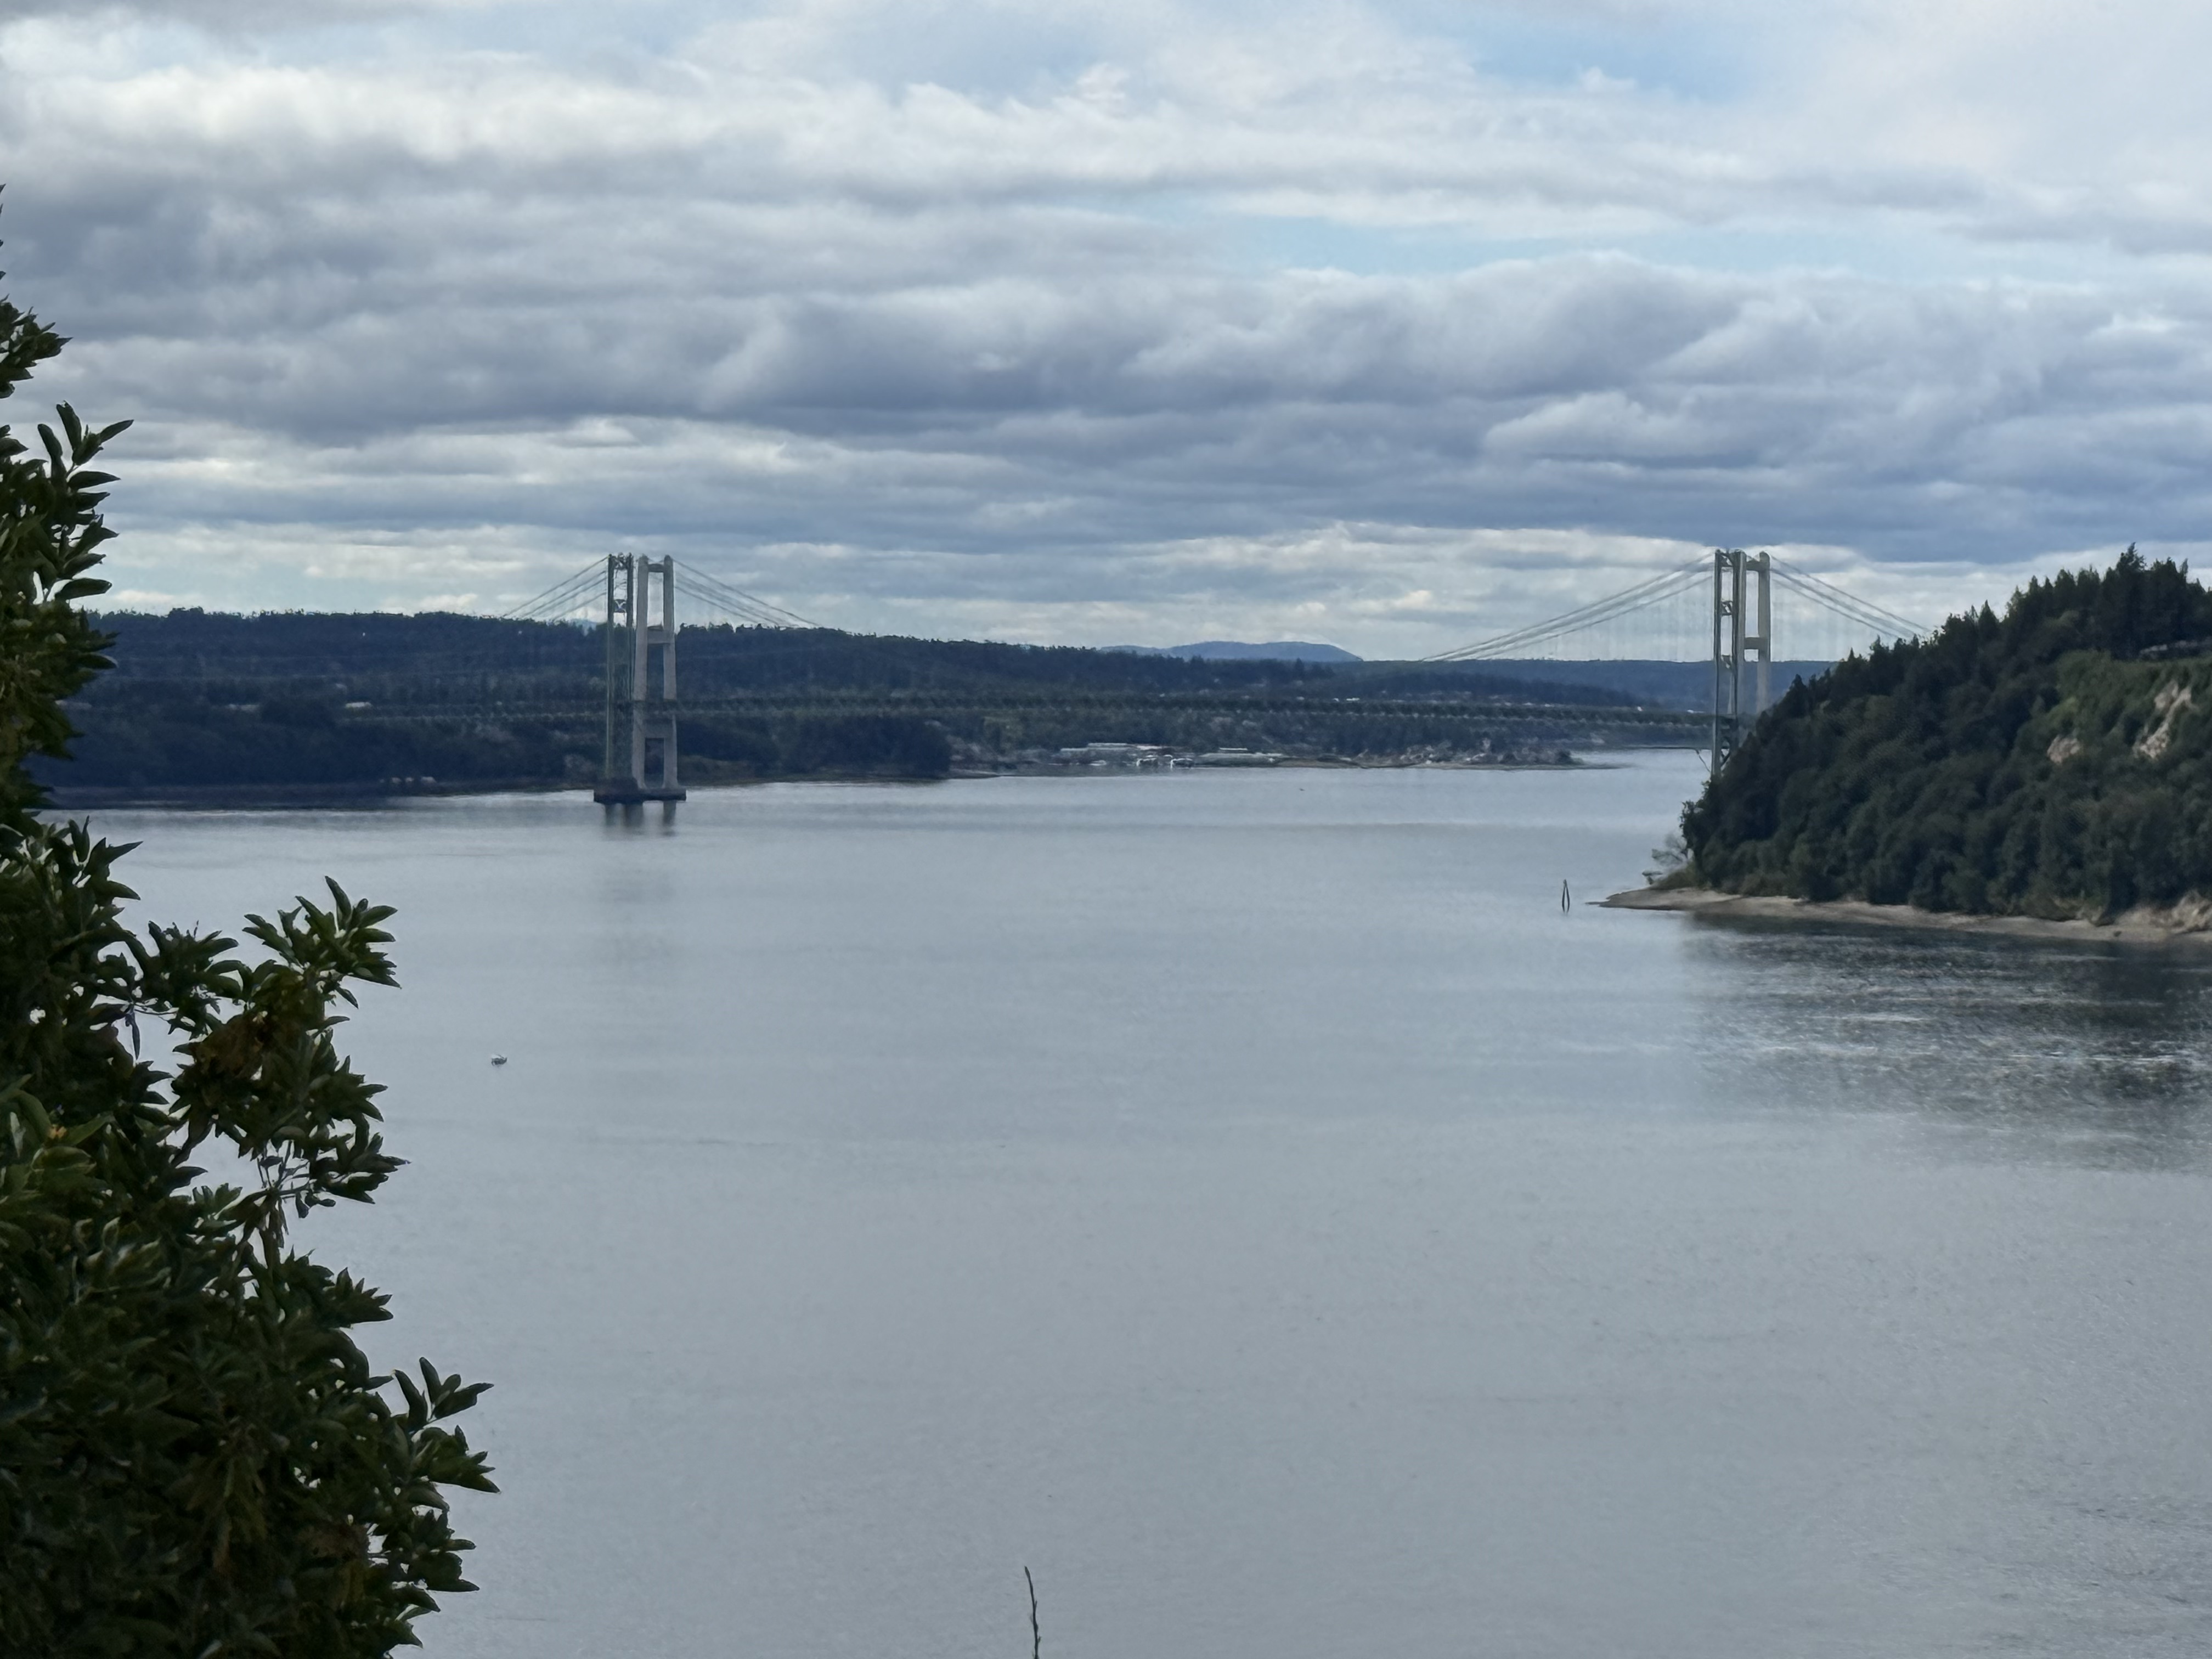
This view of the Tacoma Narrows bridge through the thick forest reveals a green landscape perched atop high bluffs overlooking Puget Sound. As far as the eye can see, from this vantage point, the forests were clear-cut to make profits and fuel the economic development of the Pacific Northwest.
But at what cost?


Recent Comments