Chapter 13. Review
The model I’ve presented in previous chapters is sufficiently complex that I think it should be reviewed, especially with respect to how it can be used to improve our mental and physical condition. I haven’t discussed that very much, instead focusing on describing how the model might be implemented within our brains using the example of vision.
The Tripartite Organismic Stimulus-Response Cortical Augmentation (TOSCA) model consists of:
Tripartite: a synthesis of the body, subconscious mind (System One), and conscious mind (System Two).
Organismic: of or relating to or belonging to an organism (considered as a whole).
Stimulus-Response: our mind-body system responds to environmental input.
Cortical: we are focused on the brain and thinking.
Augmentation: the objective is to improve how we think.
The Dao De Jing presents a model similar to TOSCAM in pre-scientific terms, with a lot of information lost during the centuries before it was written down. I have brought it up to date and focused on its application to personal behavior. However, the model is holistic (i.e., organismic) and applicable to every scale of human endeavor. The DDJ lays out general principles that can be followed by individuals and societies, hopefully leading to modified behavior through improved, rational thinking.
My purpose has been to find physical and chemical mechanisms to explain our (mis)behavior. I have introduced the idea of qualia composed of virtual networks of neuron signals, sometimes arriving in an orderly manner but just as likely to be random and anomalous. This concept has been demonstrated primarily using visual perceptions without retinal input.
Anomalous perceptions of sensory input, memories, or thoughts are far more common than we would like to think. They are responsible for much of our irrational behavior and bad decision making. Not to mention simple errors based on faulty sensory perceptions.
There is some evidence that we can modify our conscious and subconscious processing of these anomalous perceptions, but it takes a lot of work. Neural pathways have to be modified, deleted, or created in a process we call learning; and no one ever learned anything without repetition. This is what several philosophical traditions have been practicing for centuries. I’m referring to Buddhism, Hinduism, Catholicism, to name a few.
The substantial investment in time required to see improvement in cognitive performance has restricted the application of TOSCA-like models to a select few (e.g., monks), a situation worsened by the common focus on meaningless objectives rather than improved mental functioning. Fortunately, we don’t have to rely on so-called experts with the time for intensive reflection to share their (often poor) insight with us through religious dogma and transcendental mumbo-jumbo.
Some improvement is possible through rigorous studies, such as required for advanced degrees, but those programs are designed for narrow purposes and not general cognitive enhancement.
I will now turn to the DDJ in earnest and try to interpret the set of rules it presents (in somewhat jumbled fashion thanks to the work of innumerable translators, propagandists, etc), in terms that can be applied in a daily program designed to improve how our minds operate.
When Granite Meets the Ocean
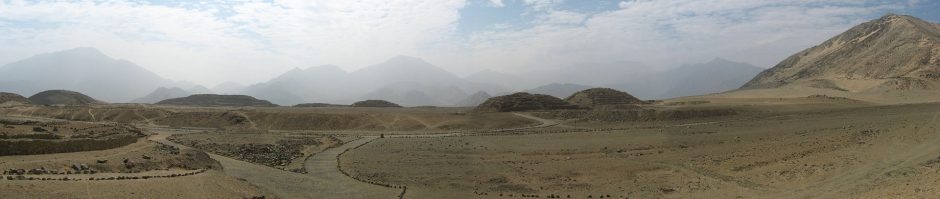
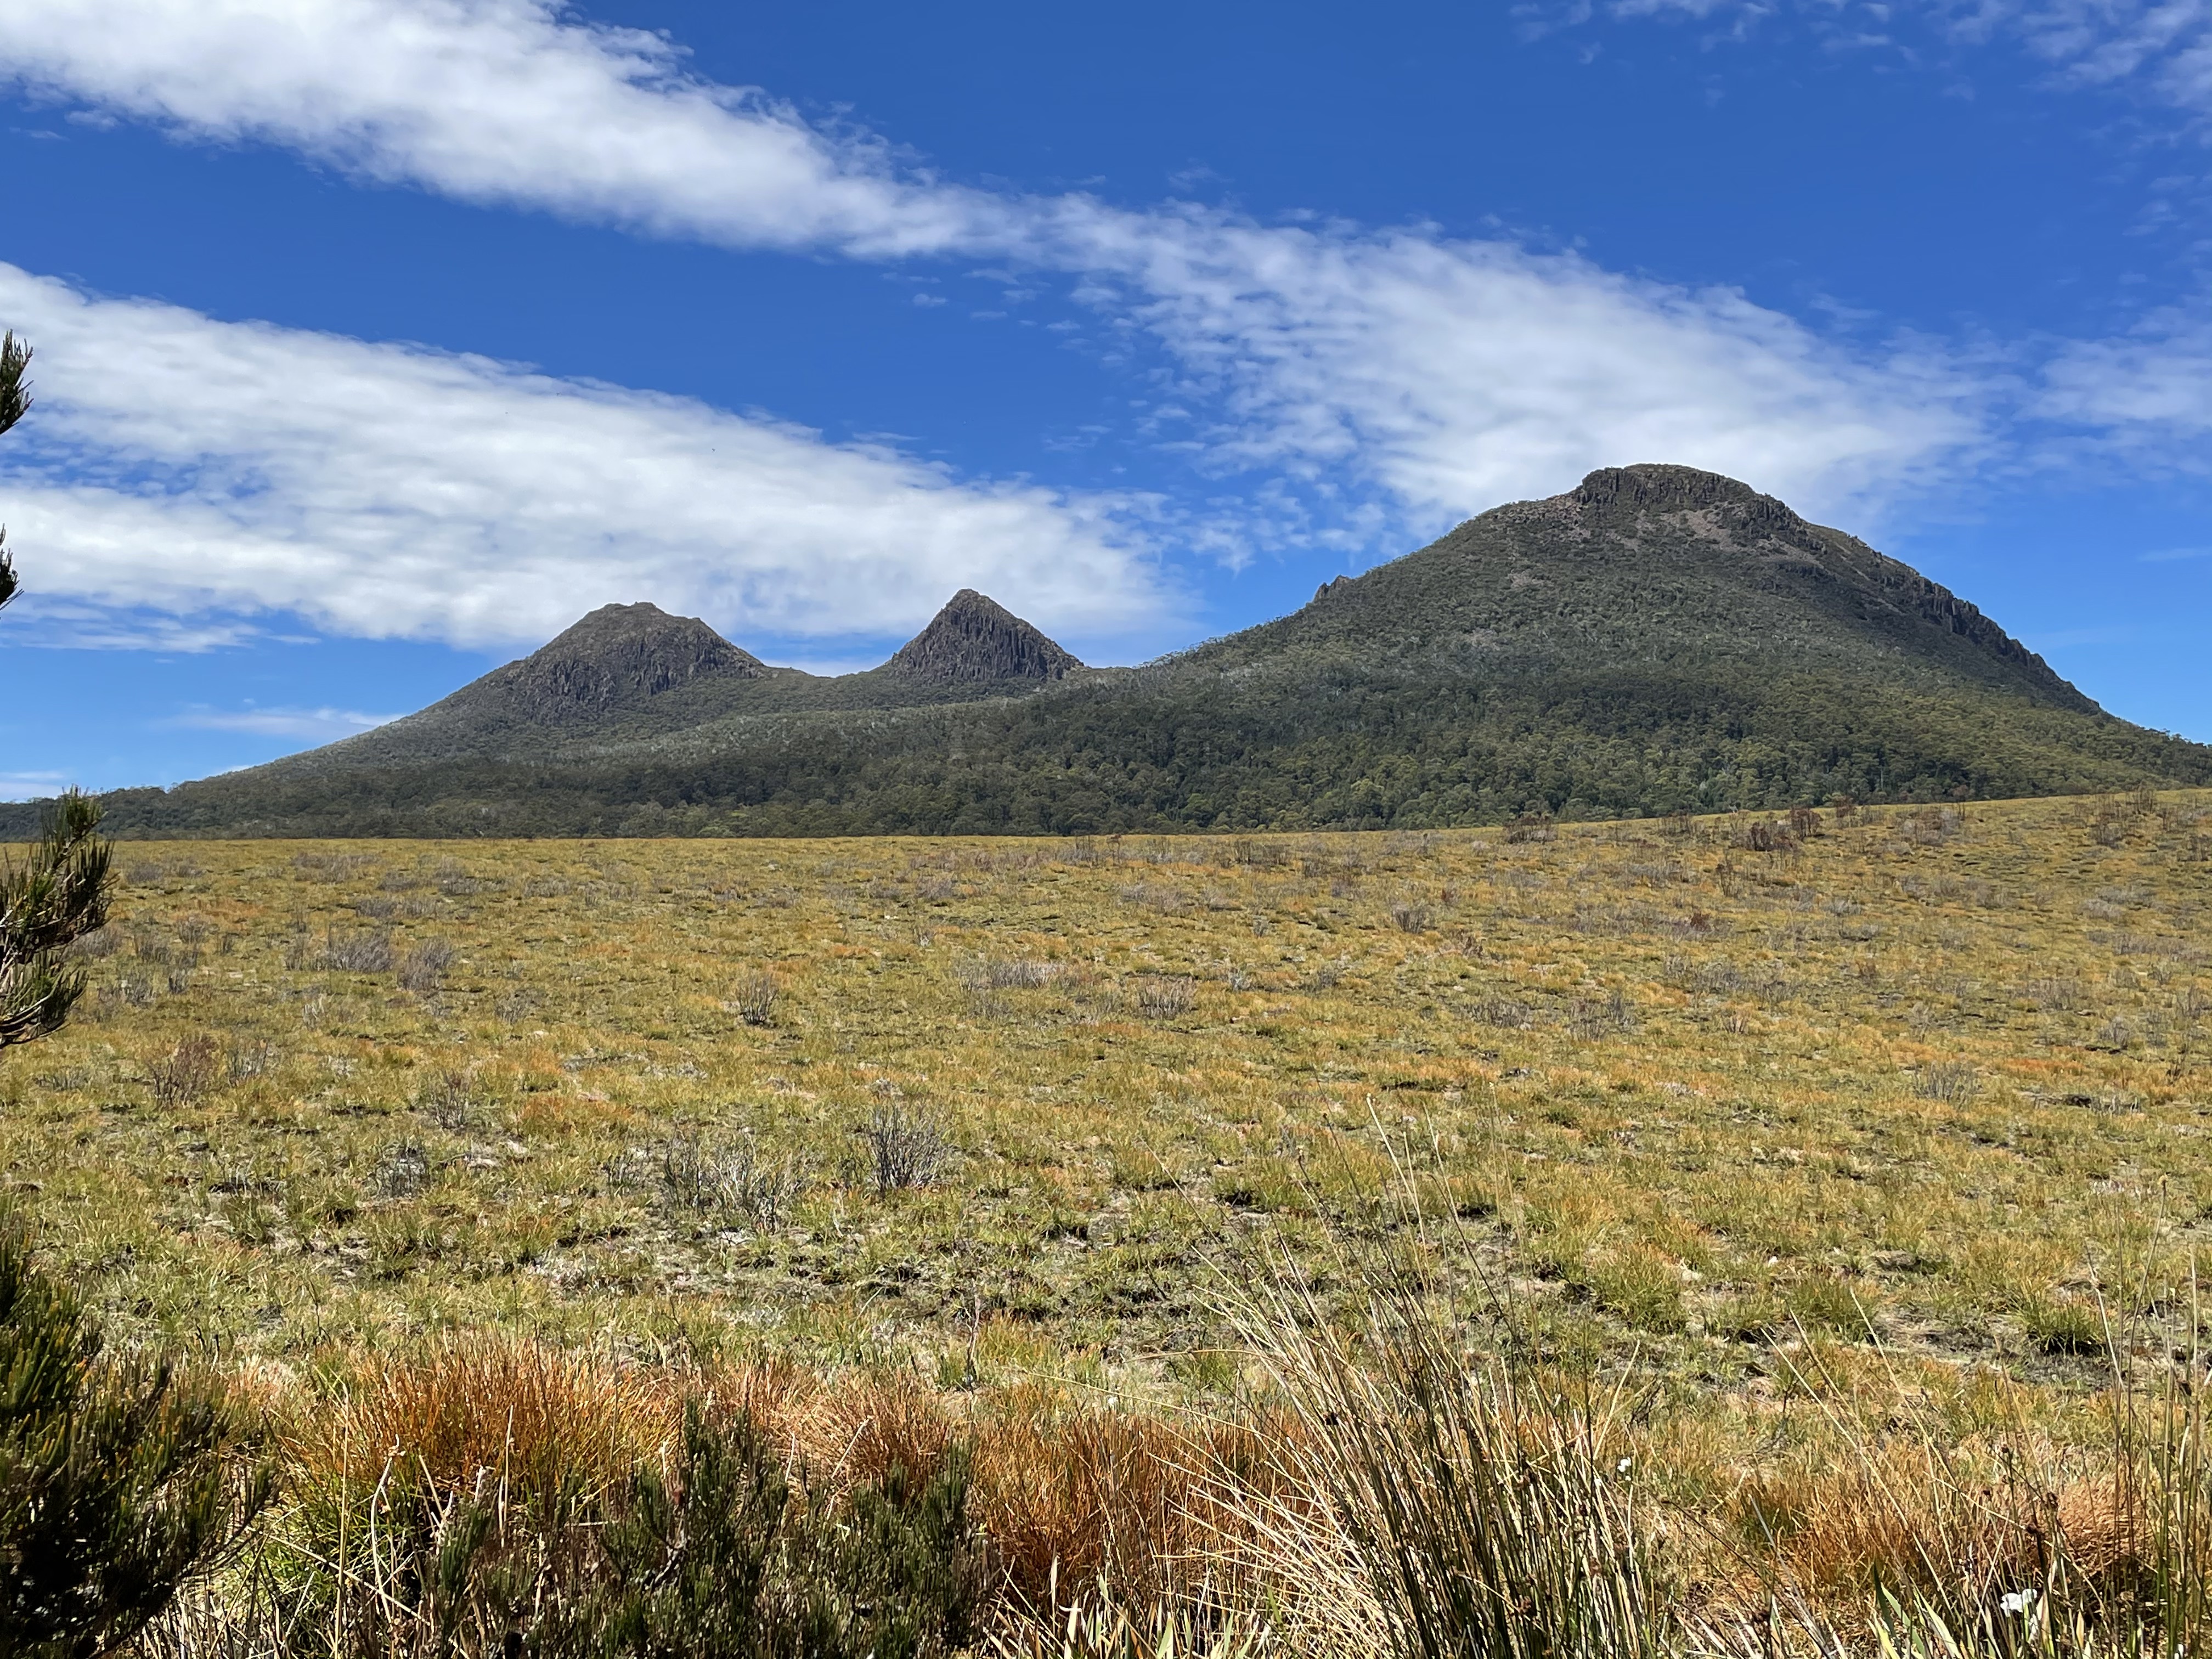
This is the last post from Tasmania, so it’s fitting that we’re going to examine a dynamic modern environment that gives an idea of the past erosion of all those rocks we’ve seen. We’re going to visit the Hazards Granite mentioned in the last post. I think it’s the second mountain from the right in Fig. 1.
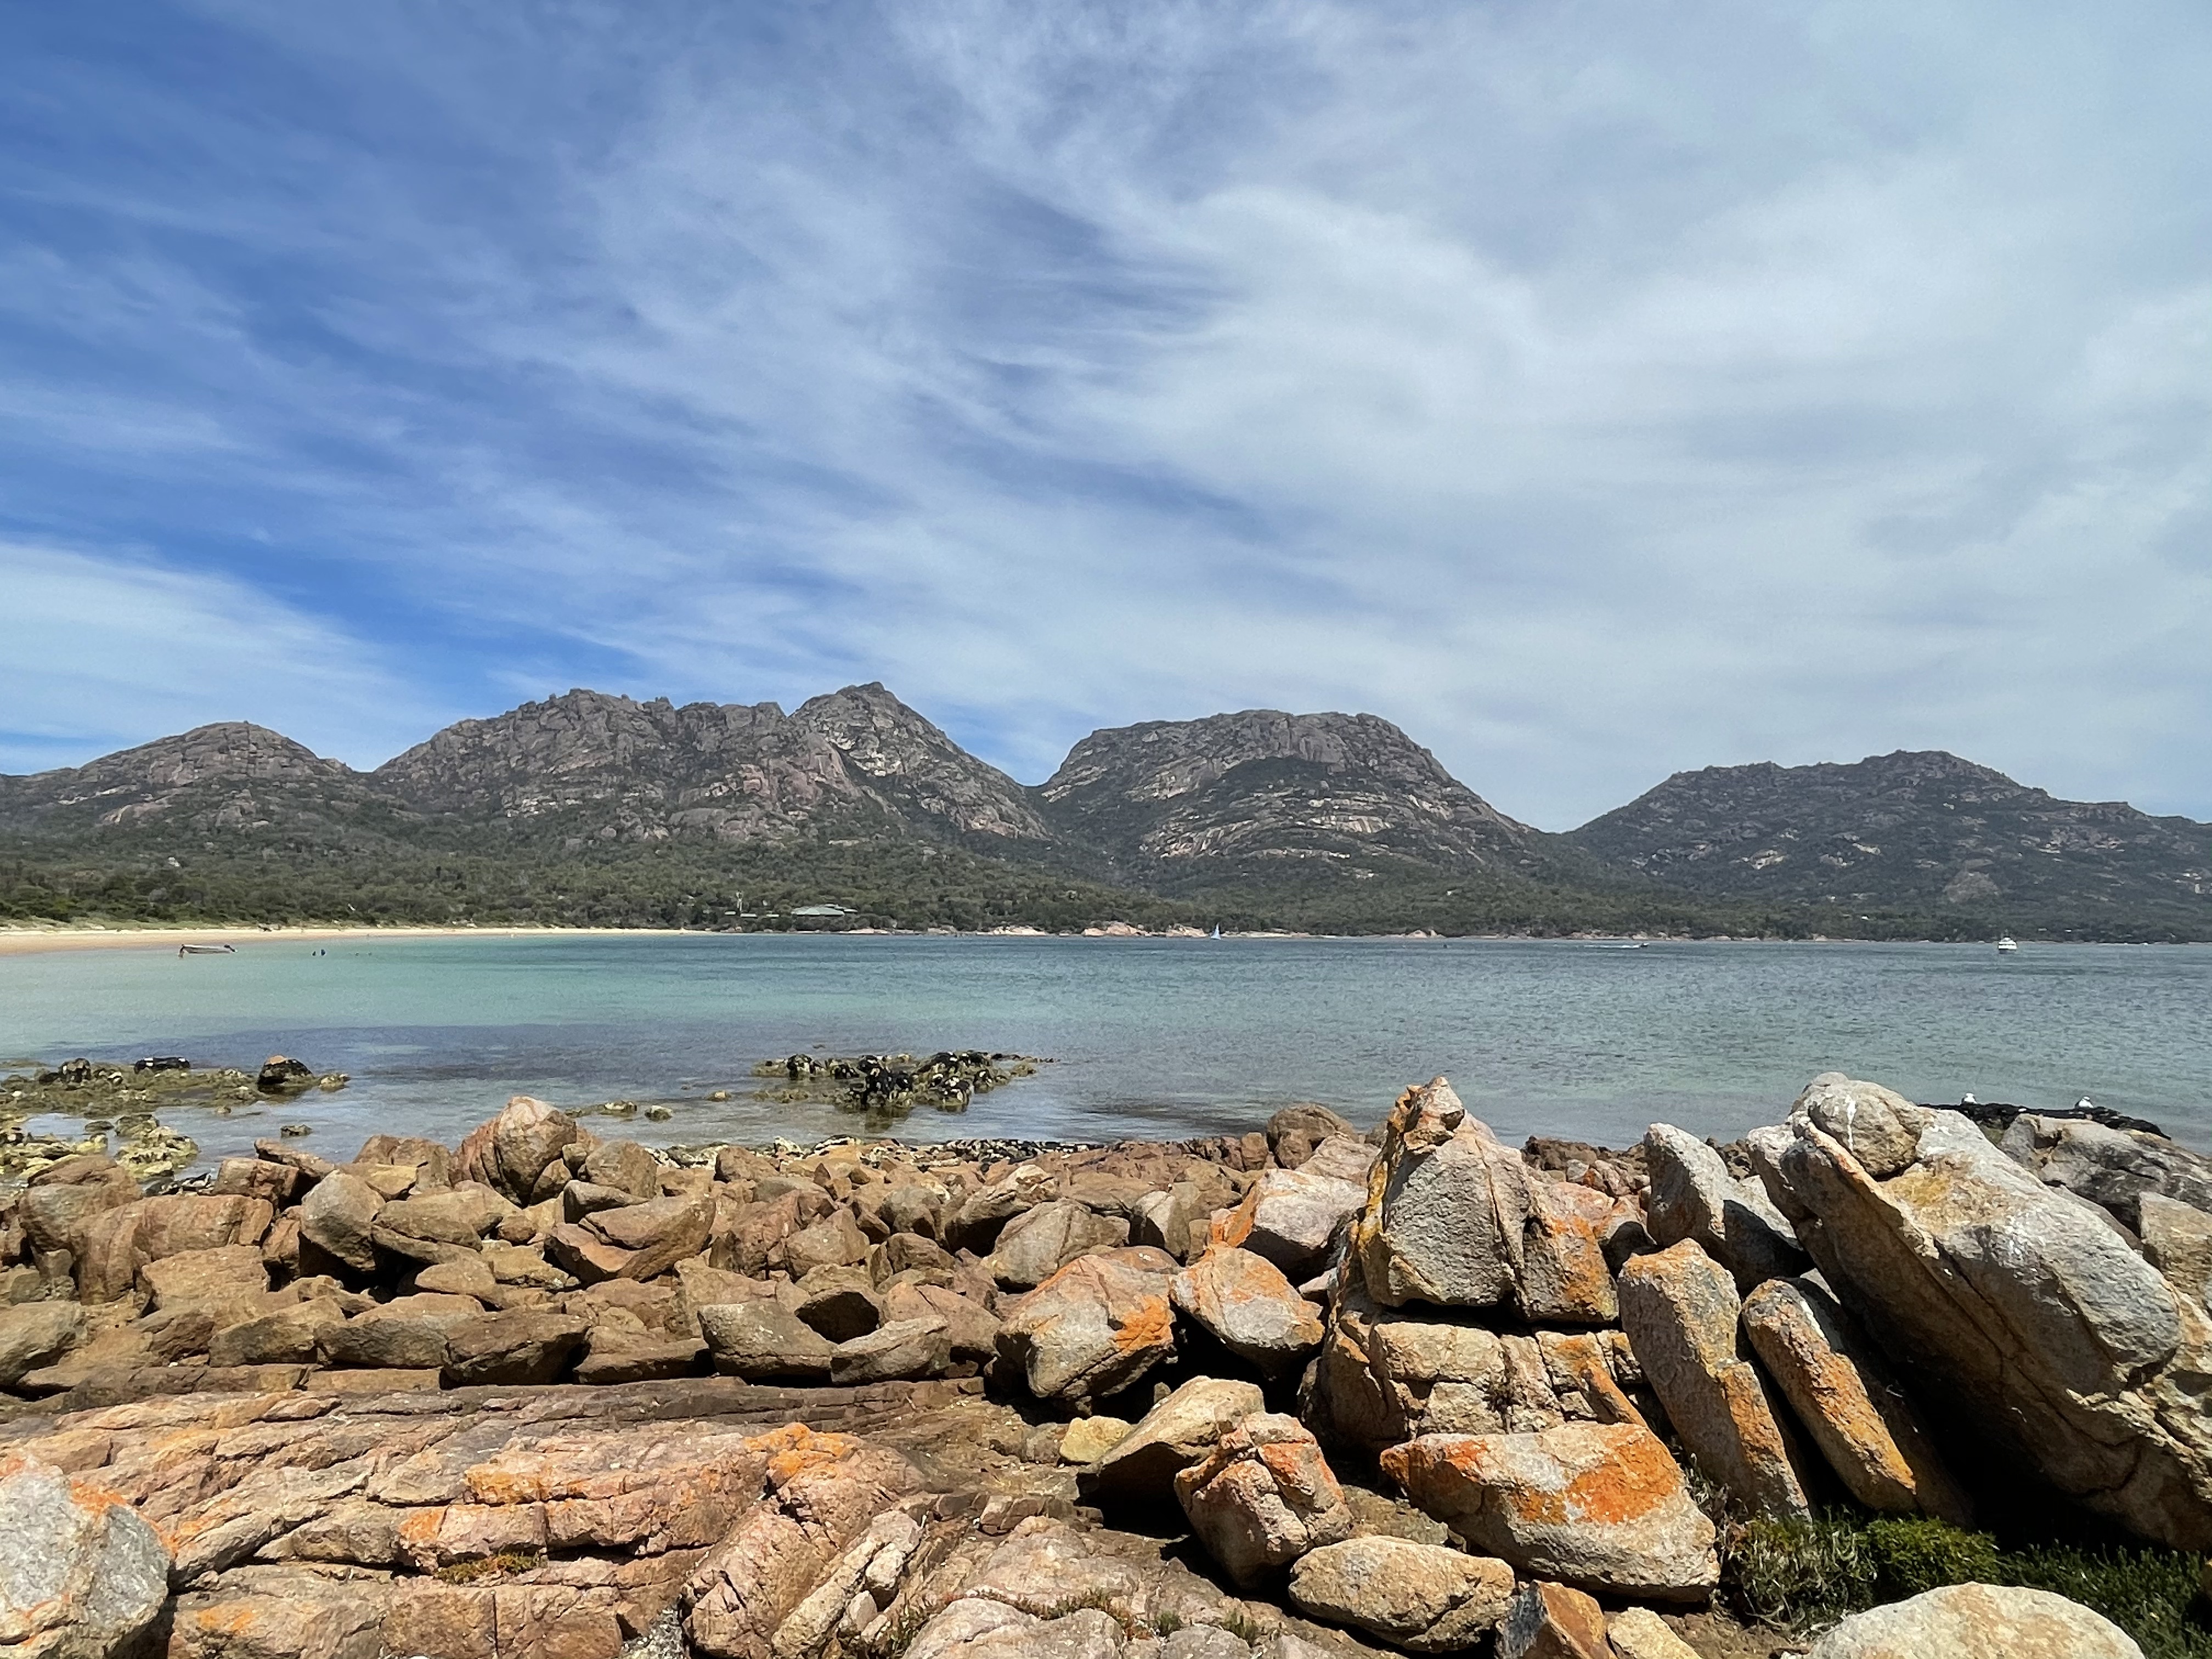 Fig. 1
We went to the top of the second peak from the left last time. That’s the Coles Bay Granite. Each mountain is a pluton of these igneous rocks, which were emplaced during the Devonian period (between 390 and 360 MY). From the lighthouse on top of the Coles Bay pluton we have a good view of the Hazards pluton (Fig. 2).
 Fig. 2
Note the vertical streaks, which are probably a staining phenomenon rather than compositional. However, the orange-red color in the lower third of the pluton is real, being due to high concentration of orthoclase we found in the lower parts of the Coles Bay Granite. From Fig. 2 it is safe to say that the Hazards Granite is going to be a fractionated alkali granite.
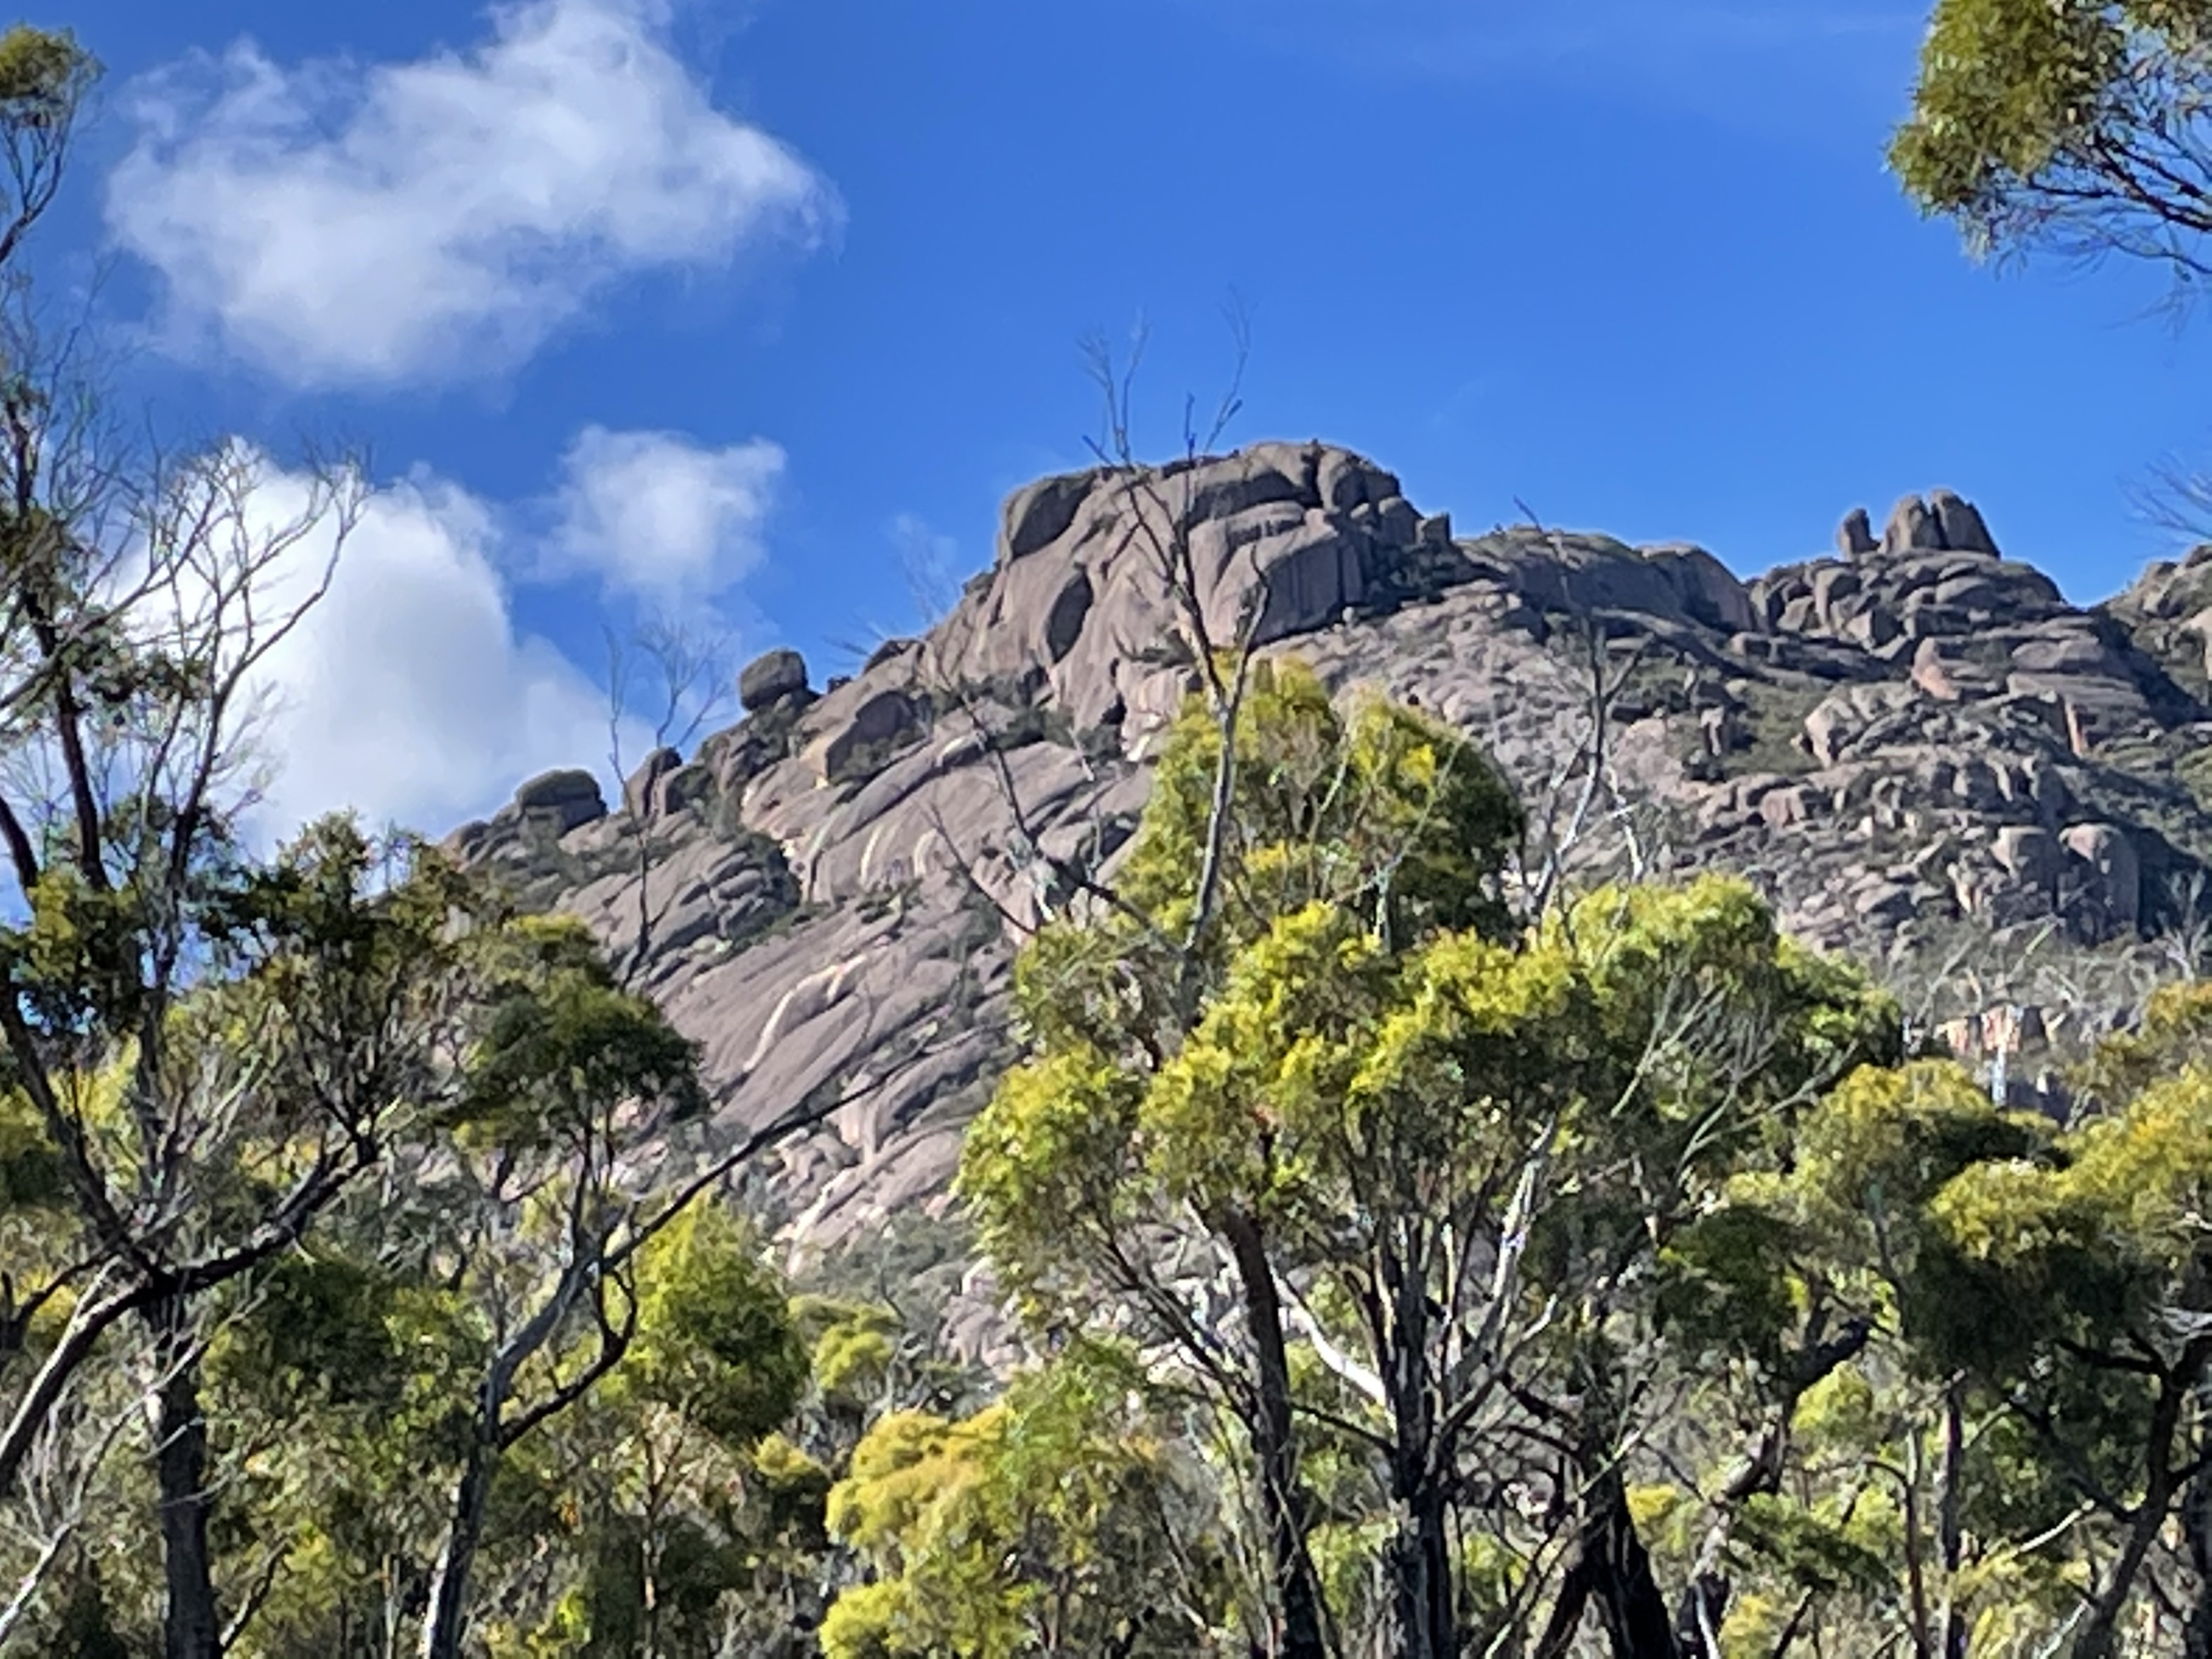
We can get a good view of the shape of the magma chamber from Fig. 3, which reveals elongate protrusions in the upper part of the pluton. This is very likely the form it took as it pushed against the surrounding rock, which has all eroded away, leaving the magma chamber available for examination.
Fig. 3
 A
A  B
B
We walked about a half-mile along the edge of the steep sided pluton, through microenvironment such as the thick ferns shown in Fig. 4. This looks to be the rainy side of the mountain.
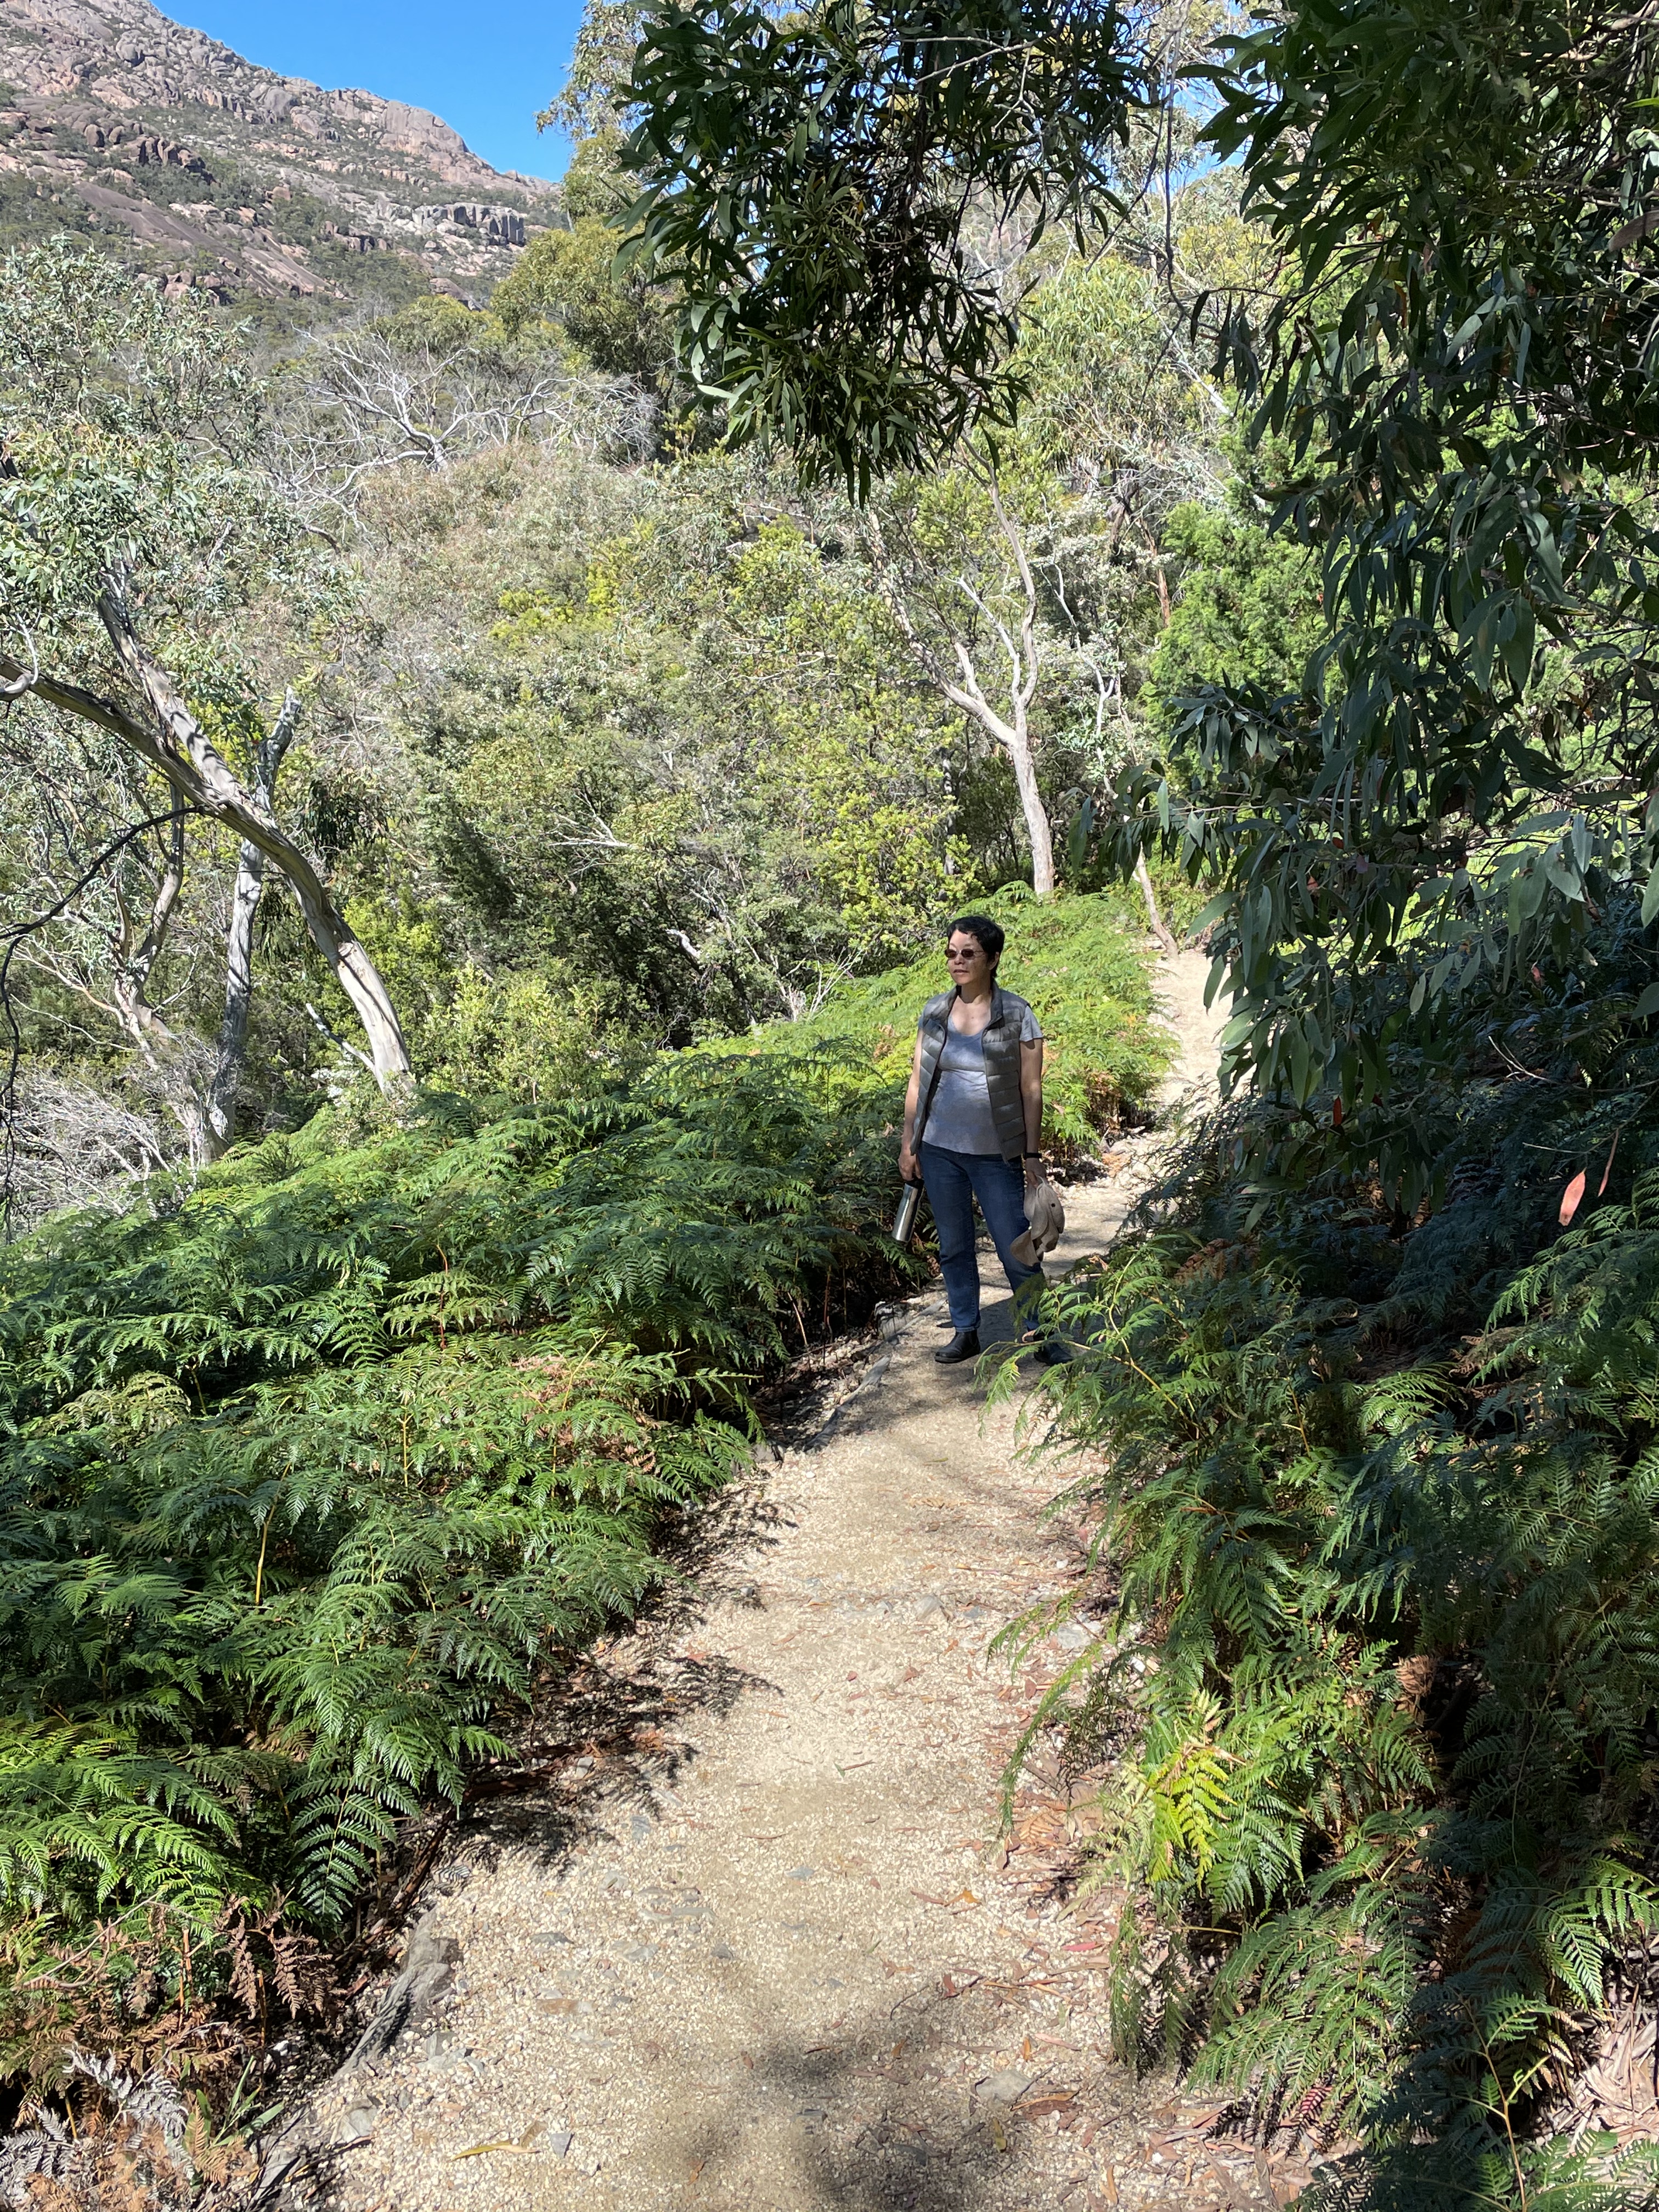 Fig. 4
Figure 5 is looking down obliquely at the water about 60 feet below us. This view shows how the joints are weak points at which waves can hurl rock fragments to chip away at the granite, widening the joints in a very robust and orderly process.
 Fig. 5
We dropped down an easy slope to an inlet called Sleepy Cove (Fig. 6).
 Fig. 6
The tide was low so the beach was accessible. We’ll take a look at how granite turns directly into sand and forms a beach with practically no transport. First, we see that the rock has the same composition as the Coles Bay Granite (Fig. 7).
 Fig. 7
We see a lot of orthoclase (red crystals) and quartz (Gray) with albite/microcline (white minerals) and a little hornblende and biotite (dark minerals). The assemblage changes however when the grains are weathered from the original rock (Fig. 8).
 Fig. 8
Where has the reddish orthoclase gone? There are also no dark mineral grains, the hornblende and biotite. These minerals are susceptible to chemical weathering. They are as strong as quartz and albite, but they aren’t as stable. In fact, the albite and microcline crystals (white grains in Fig. 8) will break down quickly as well, leaving only quartz as the final mineral. This is the reason that almost every beach in the world is primarily if not entirely composed of quartz.
Let’s look at some ways the rock (Fig. 7) turns into sand (Fig. 8). First, joints widen under the pounding of grains already weathered from the rock (Fig. 9). This process can be seen to be important at every scale in Fig. 6.
 Fig. 9
The constant blasting by wave-carried sand grains (especially the slightly harder quartz) works on every weak or exposed part. For example, the two boulders in Fig. 10A are being removed from the inside in a modified version of spalling.
Fig. 10
 A
A  B
B
 C
C  D
D
Figure 10B shows the removal of the inside of the boulder on the right in Fig. 10A and Fig. 10C shows the beginning of this process on the left boulder. This is a common process for erosion of granites, but it doesn’t usually advance so rapidly. Figure 10D shows a hole worn in a slab thinned by erosion along a horizontal joint.
The rocks surrounding Sleepy Cove are being simultaneously weathered by abrasion and chemical breakdown in a microcosm of the complex erosion of mountains into layers of sedimentary rock like we’ve seen all across Tasmania (Figs. 11 and 12).
 Fig. 11
 Fig. 12
A synapsis of the geological history of Tasmania preserved in the rocks we’ve discussed in these posts would require a separate post. Instead, I’d like to end with a note on uniformitarianism: The granite mountains seen in Fig. 1 will be worn down by the processes demonstrated in Fig. 12, in as little as 10 million years (a wild guess), and a thick layer of sand will replace them. Of course, plate tectonics may have a different future in store for Tasmania. Only time will tell.
Alkali Granite
We’re still in Freycinet National Park for this post (Fig. 1), but we’re going to leave the beach at least for today.
 Fig. 1
The peninsula comprises three granite plutons (Fig. 2), but we’re only going to visit two of them. The Coles Bay Granite (the tan colored area in Fig. 2) and the Hazards Granite (orangish area) are both Devonian but aren’t differentiated on the geologic map I’m using.
 Fig. 2
The Coles Bay Granite is described as strongly fractionated, reduced, felsic, I-type biotite alkali-feldspar granite. That’s a mouthful. The Hazards Granite has a slightly less-wordy definition: I-type biotite alkali-feldspar granite. I think the first description includes redundant terms, such as reduced, fractionated, and felsic. You could even drop the biotite descriptor since I-type granites generally contain biotite.
The most recent research I found on the origin of I-type granites contradicts most of what I read on the internet. According to Clemens et al (2011), this kind of granite most likely originated from the melting of crustal rocks beneath an island arc, not by fractionation of a mantle source. This means that the simple S (Sedimentary) and I (Igneous) classification of granites is nonsense, although their mineral and chemical composition are certainly different, and reflect different source rocks.
We had a block of granite right outside our room (Fig. 3). It is not in place but probably hasn’t been moved more than a few yards. The hotel is built on granite.
 Fig. 3
The lower-left part of the boulder is fairly fresh and is very red, which indicates a high percentage of orthoclase feldspar, earning this rock the appellation, Alkali Granite (i.e., large potassium or sodium content in the feldspar). A close-up photo of an unweathered surface (Fig. 4) gives us a sense of the composition.
 Fig. 4
Zooming in a little on Fig. 4 reveals two main minerals: the orange is orthoclase (aka K-spar or potassium feldspar); and a gray mineral which is almost certainly quartz. There are also dark and white minerals in smaller proportions. These are probably albite (Na feldspar) and hornblende (the darker mineral), although there’s certainly biotite (another dark mineral) and some plagioclase (calcium feldspar) in there as well. Overall, I would estimate the composition to be (drum roll): 40% orthoclase; 30% quartz; 20% albite/plagioclase; and 10% hornblende and biotite, plus other minor minerals. According to the QAPF classification, this would be squarely in the alkali granite category.
We drove a short distance to the other side of the peninsula (~2 miles) and had an excellent view of the rocky coastline (Fig. 5), revealing the other plutons. The one in the distance is an island. The road ends a short distance from this point.
 Fig. 5
This granite is not red, but white in outcrop (Fig. 6).
 Fig. 6
Looking at it a little closer (Fig. 7; ignore the lichen covering the middle of the photo), we see very little orthoclase, but instead a white mineral that forms crystals.
 Fig. 7
Zooming in (Fig. 8), we can easily identify quartz (the smooth, grayish mineral) and a white mineral that is most certainly either albite (sodium feldspar) or microcline (potassium feldspar), but probably both.
 Fig. 8
We can estimate the composition of this rock from Fig. 7: 60% albite/microcline; 25% quartz; 10% dark minerals (hornblende and biotite); and ~5% orthoclase and other minor minerals. Turning to the QAFP diagram, we see that this is also an alkali granite, even though it has a different mineralogical composition. The difference in mineralogy between Figs. 4 and 7 supports the description of this granite as strongly fractionated. Because granites typically cool very slowly, they are often fractionated, and produce a continuum of rock types. Most collectible mineral samples come from areas with granite. For example, Fig. 9 shows very well formed crystals of microcline (I think).
 Fig. 9
Another interesting feature of this exposure is the joint pattern, which has been enlarged by weathering (Fig. 10).
 Fig. 10
Finally, we find micro joints filled with what appears to be orthoclase (Fig. 11), from its pinkish color.
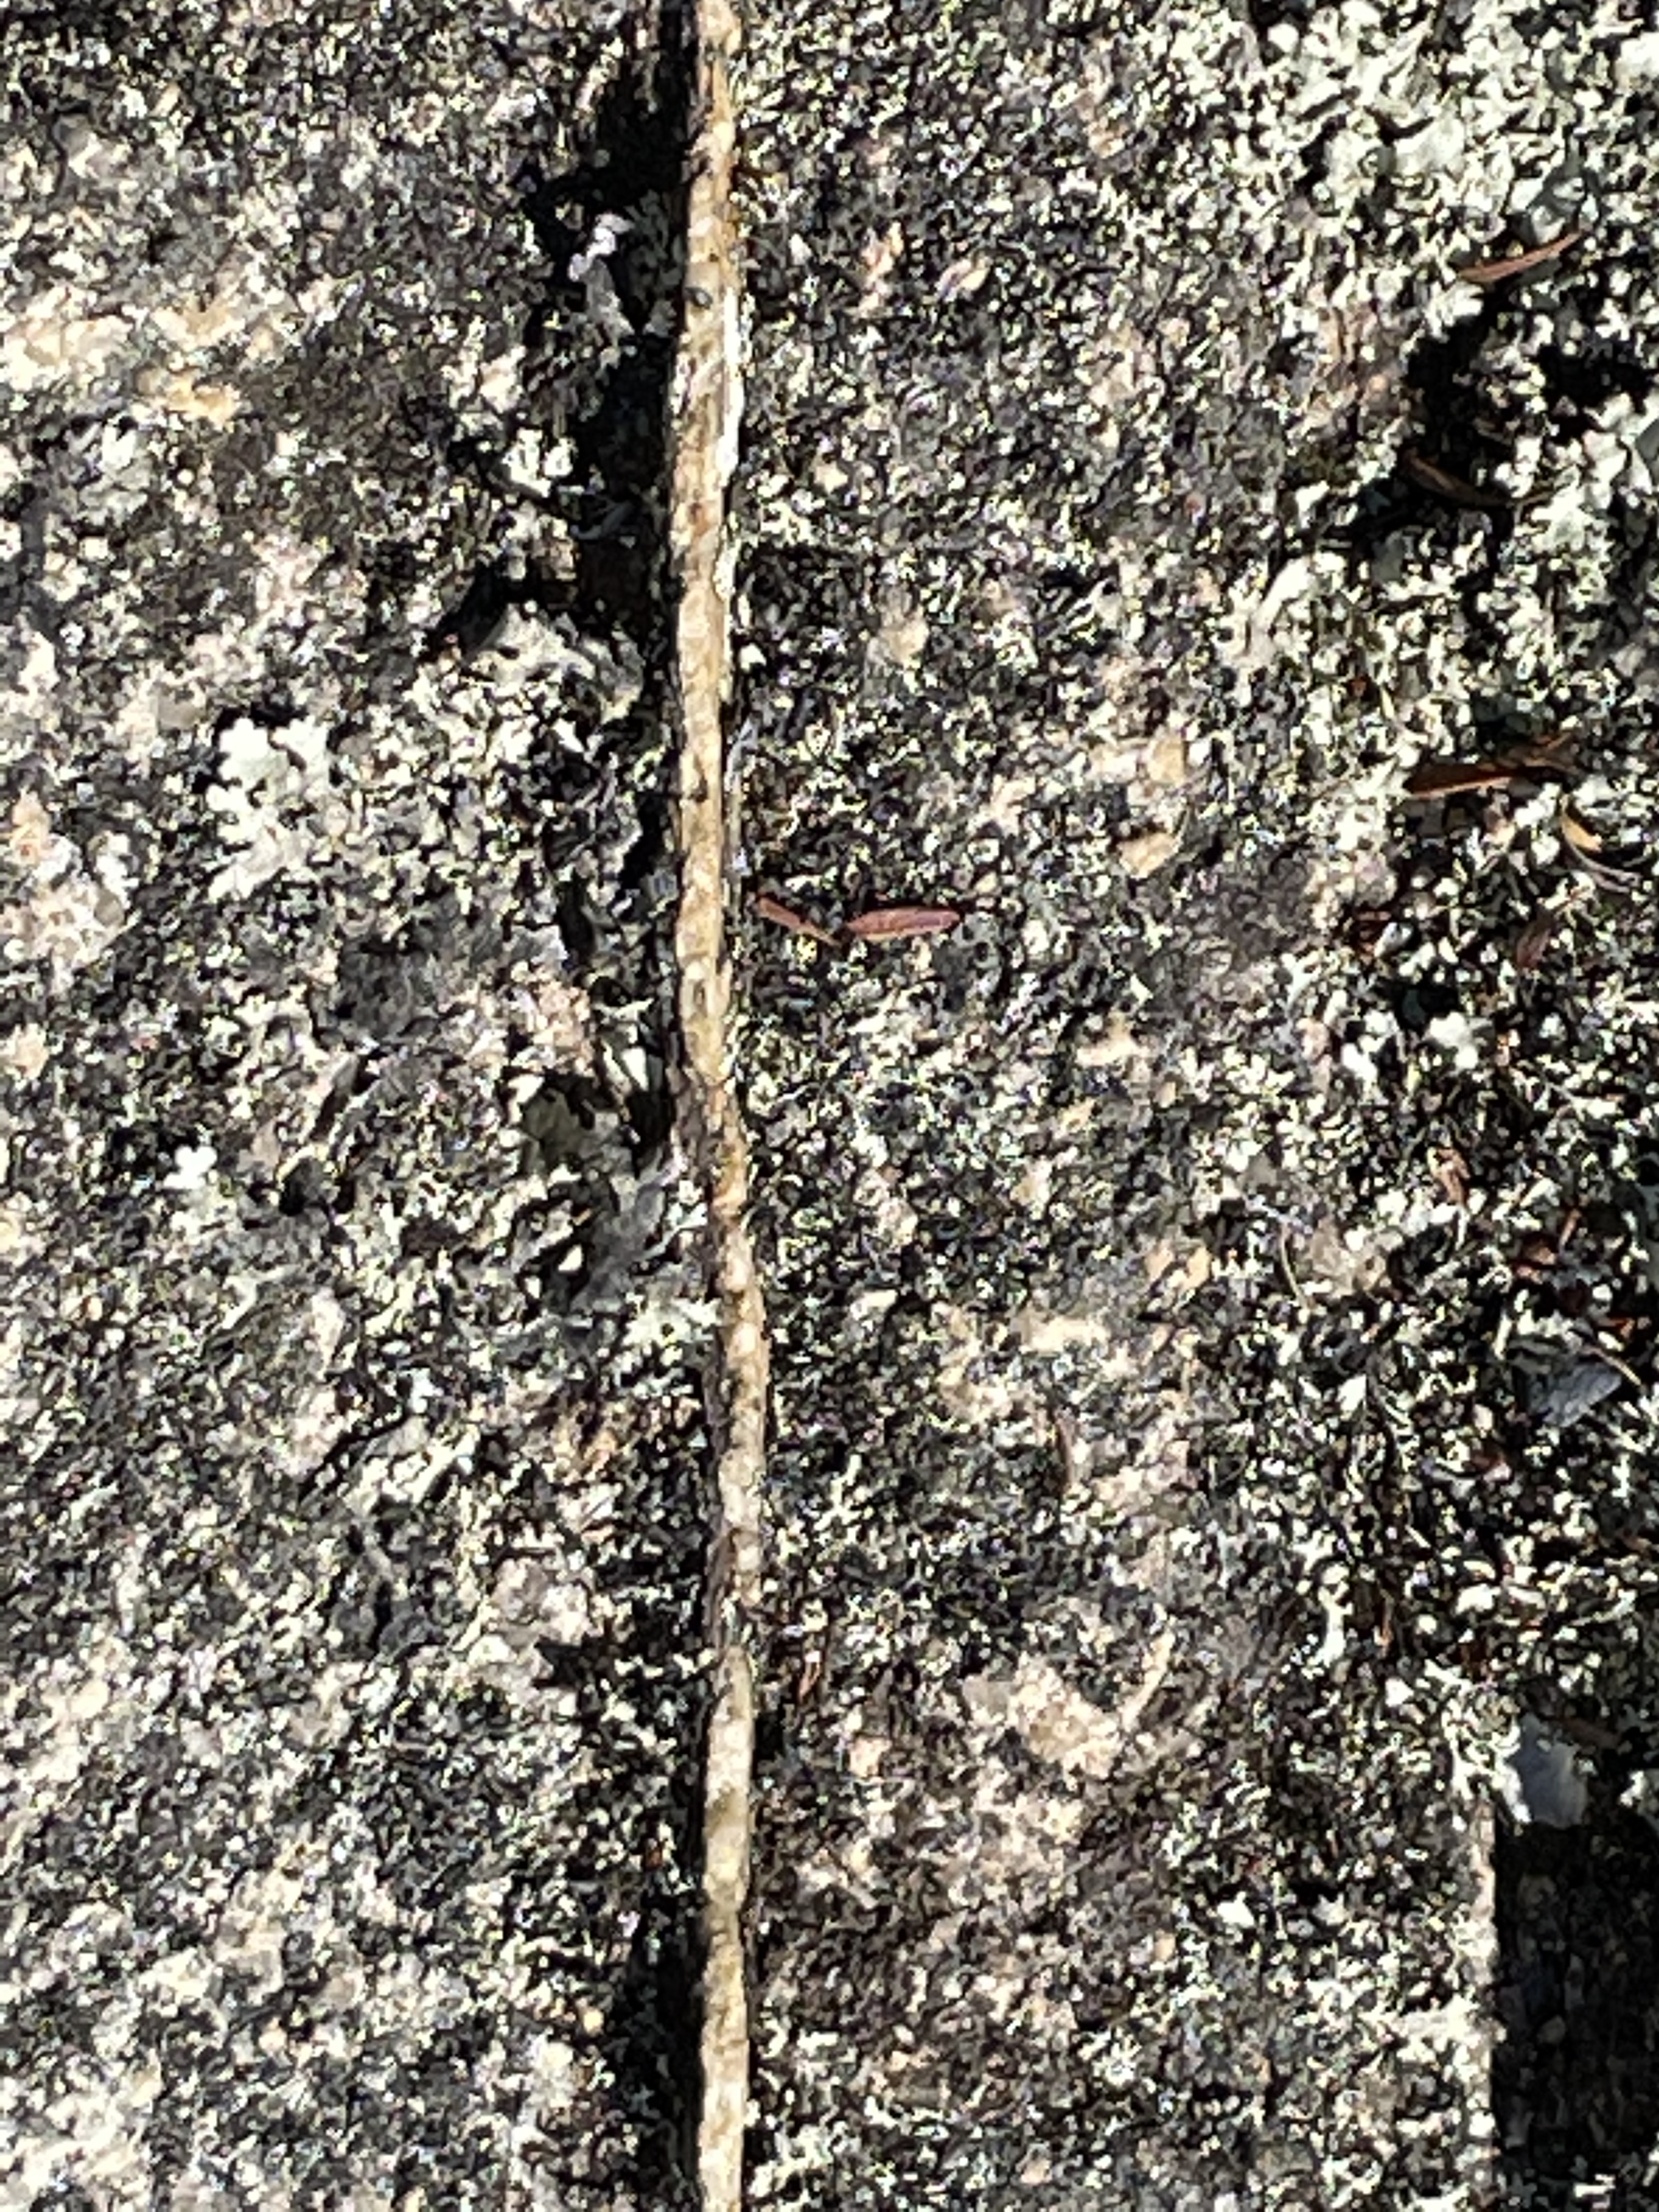 Fig. 11
These thin (<1/4 inch) dikes were oriented in only one direction and were uncommon. I only saw a couple of them. This is interesting because it suggests that the magma had cooled enough to fracture but there was still a highly fractionated magma component available to fill the openings.
The Coles Bay Granite was emplaced into crustal rocks about 350 My ago, at the same time as Australia/Tasmania were becoming solidly connected to Gondwana. The composition of this plutonic rock suggests that it was formed from the melted remains of an island arc (like Japan today) that had previously slid beneath the Australian Craton. The magma took hundreds of thousands of years to cool into solid rock, starting from the top of the magma chamber, where the molten rock was in contact with cooler rocks. Thus, the granite from Figs. 6-11 cooled first and became solid enough to fracture, allowing the still molten magma from lower in the chamber to fill the cracks (Fig. 11). Finally this magma solidified as well to form the rock seen in Figs. 3 and 4. At least, that’s what I think happened.
The next post will examine the Hazards Granite…
A Special Moment Caught in the Sands of Time
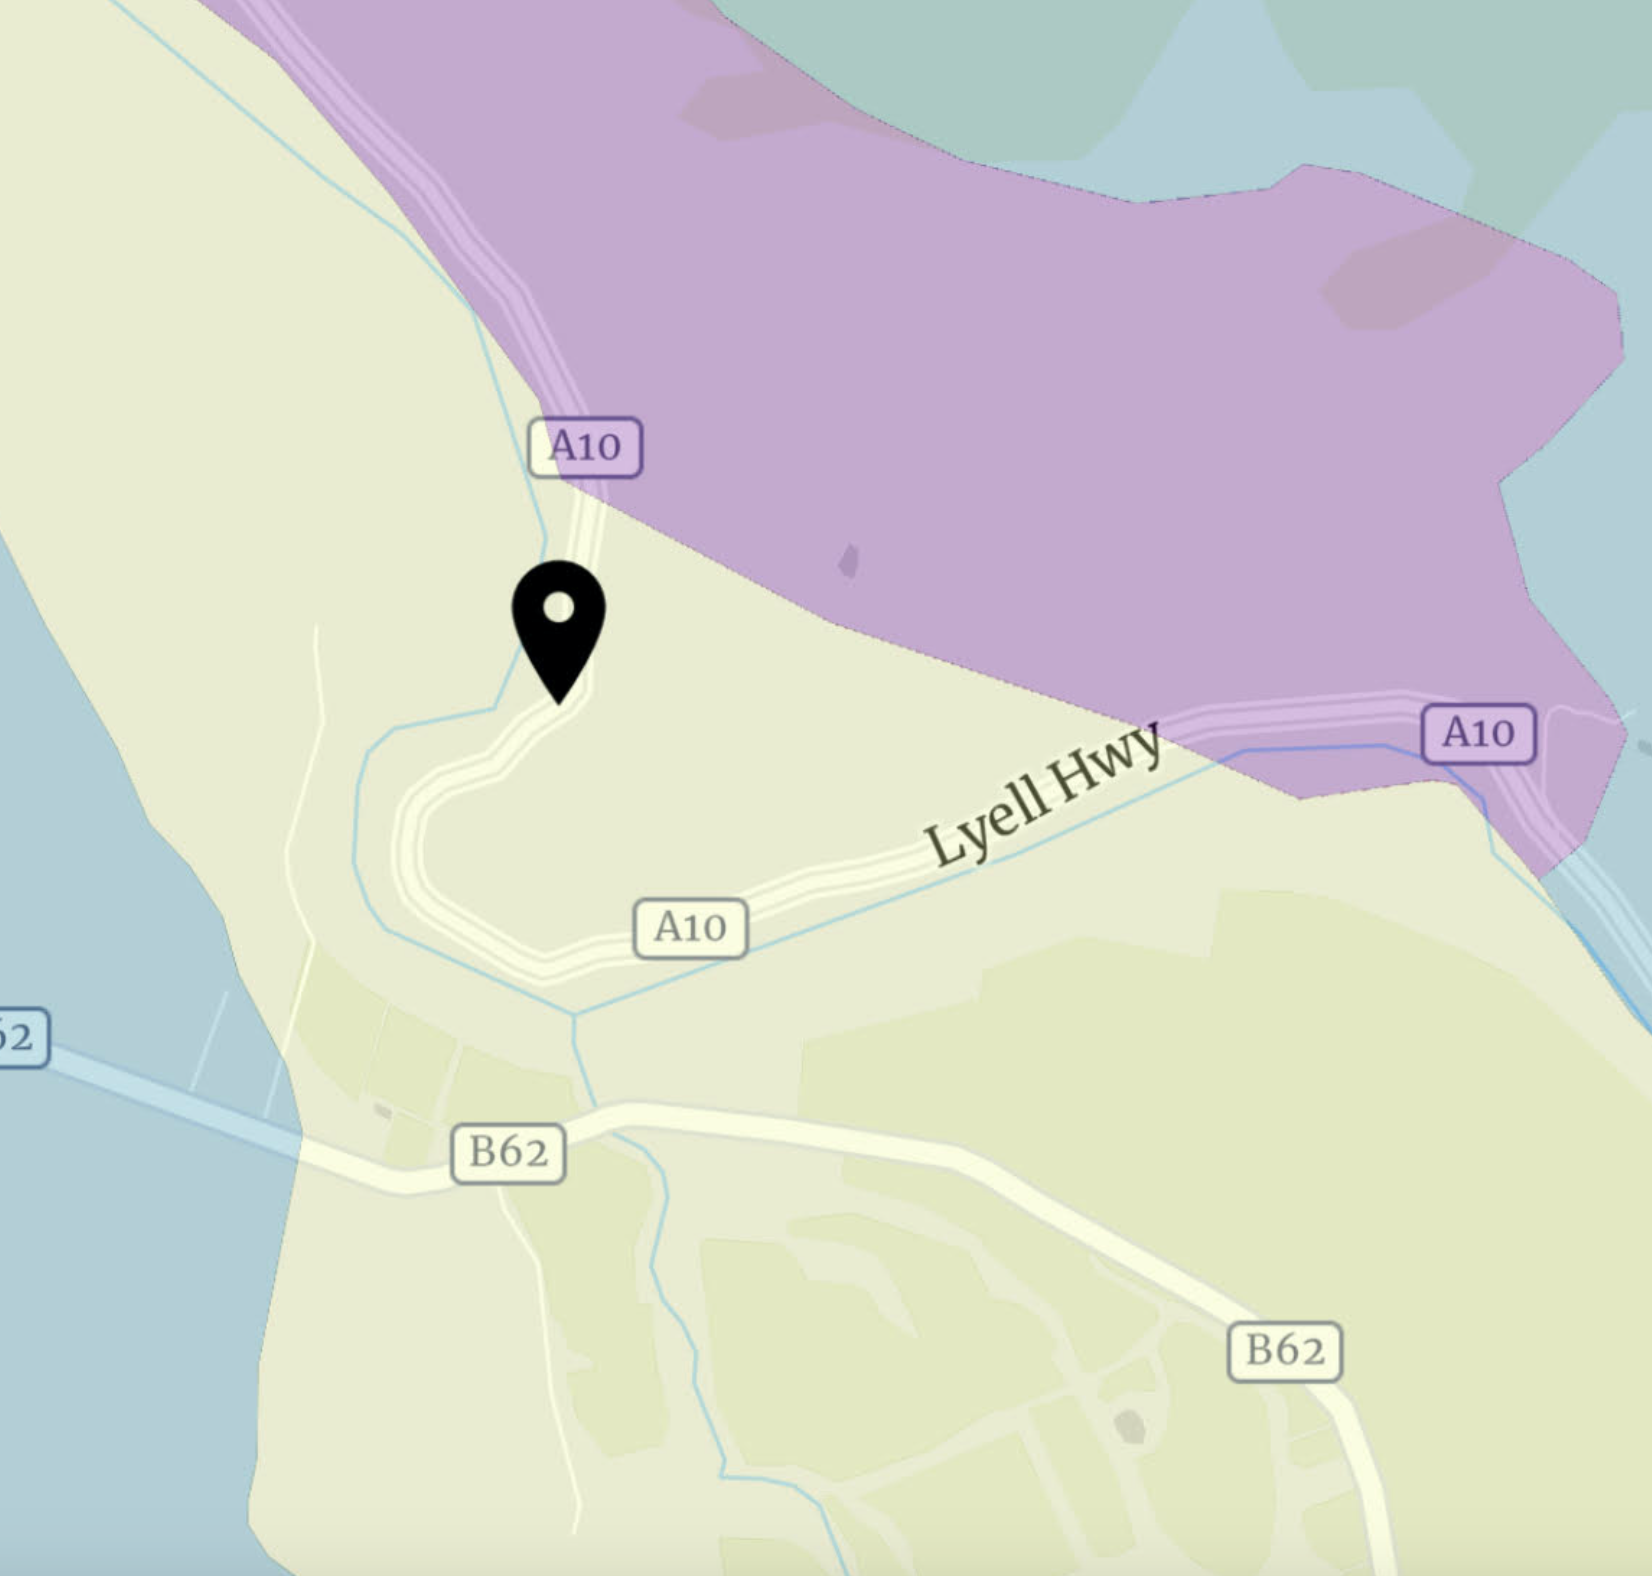
The previous post examined a couple of beaches along the eastern Tasmania coast and discussed coastal erosion in areas with very little sediment input. We finally reached our destination after a couple more hours, Freycinet National Park, located on an isolated peninsula (indicated by the pin in Fig. 1).
Fig. 1
We drove across the Tasmanian Dolerite (green/gray areas in Fig. 2) and quaternary colluvium (yellow in Fig. 2) to get there, but the rocks changed drastically on the peninsula itself.
Fig. 2
The peninsula is entirely composed of Devonian granite (393-359 MY). The best reason for this magmatism without major deformation (i.e., an orogeny) that I could find is that Tasmania was squeezed between Australia and Antarctica during assembly of Gondwana. The upper mantle was hot and would have produced granitic magma. It’s safe to assume that this area would have had relatively high elevations at that time as well, delivering sediment to the ocean.
This post isn’t going to discuss the granites in and around Coles Bay, but instead continue our examination of coastal geology. Great Oyster Bay is a relatively sheltered body of water. Coles Bay is even more protected from waves because it faces west (see Fig. 2) and the larger bay is only 10 miles across.
The nearby granite supplies crystals of minerals like quartz and alkali feldspars, which are more resistant to chemical weathering than the minerals comprising dolerite, so an ample supply of sand-sized grains is available from two rivers that enter Great Oyster bay at its northern end. This wasn’t the case at the beaches we visited in the last post. Consequently, a wide, shallow beach has been produced at the eastern margin of Coles Bay (Fig. 3).
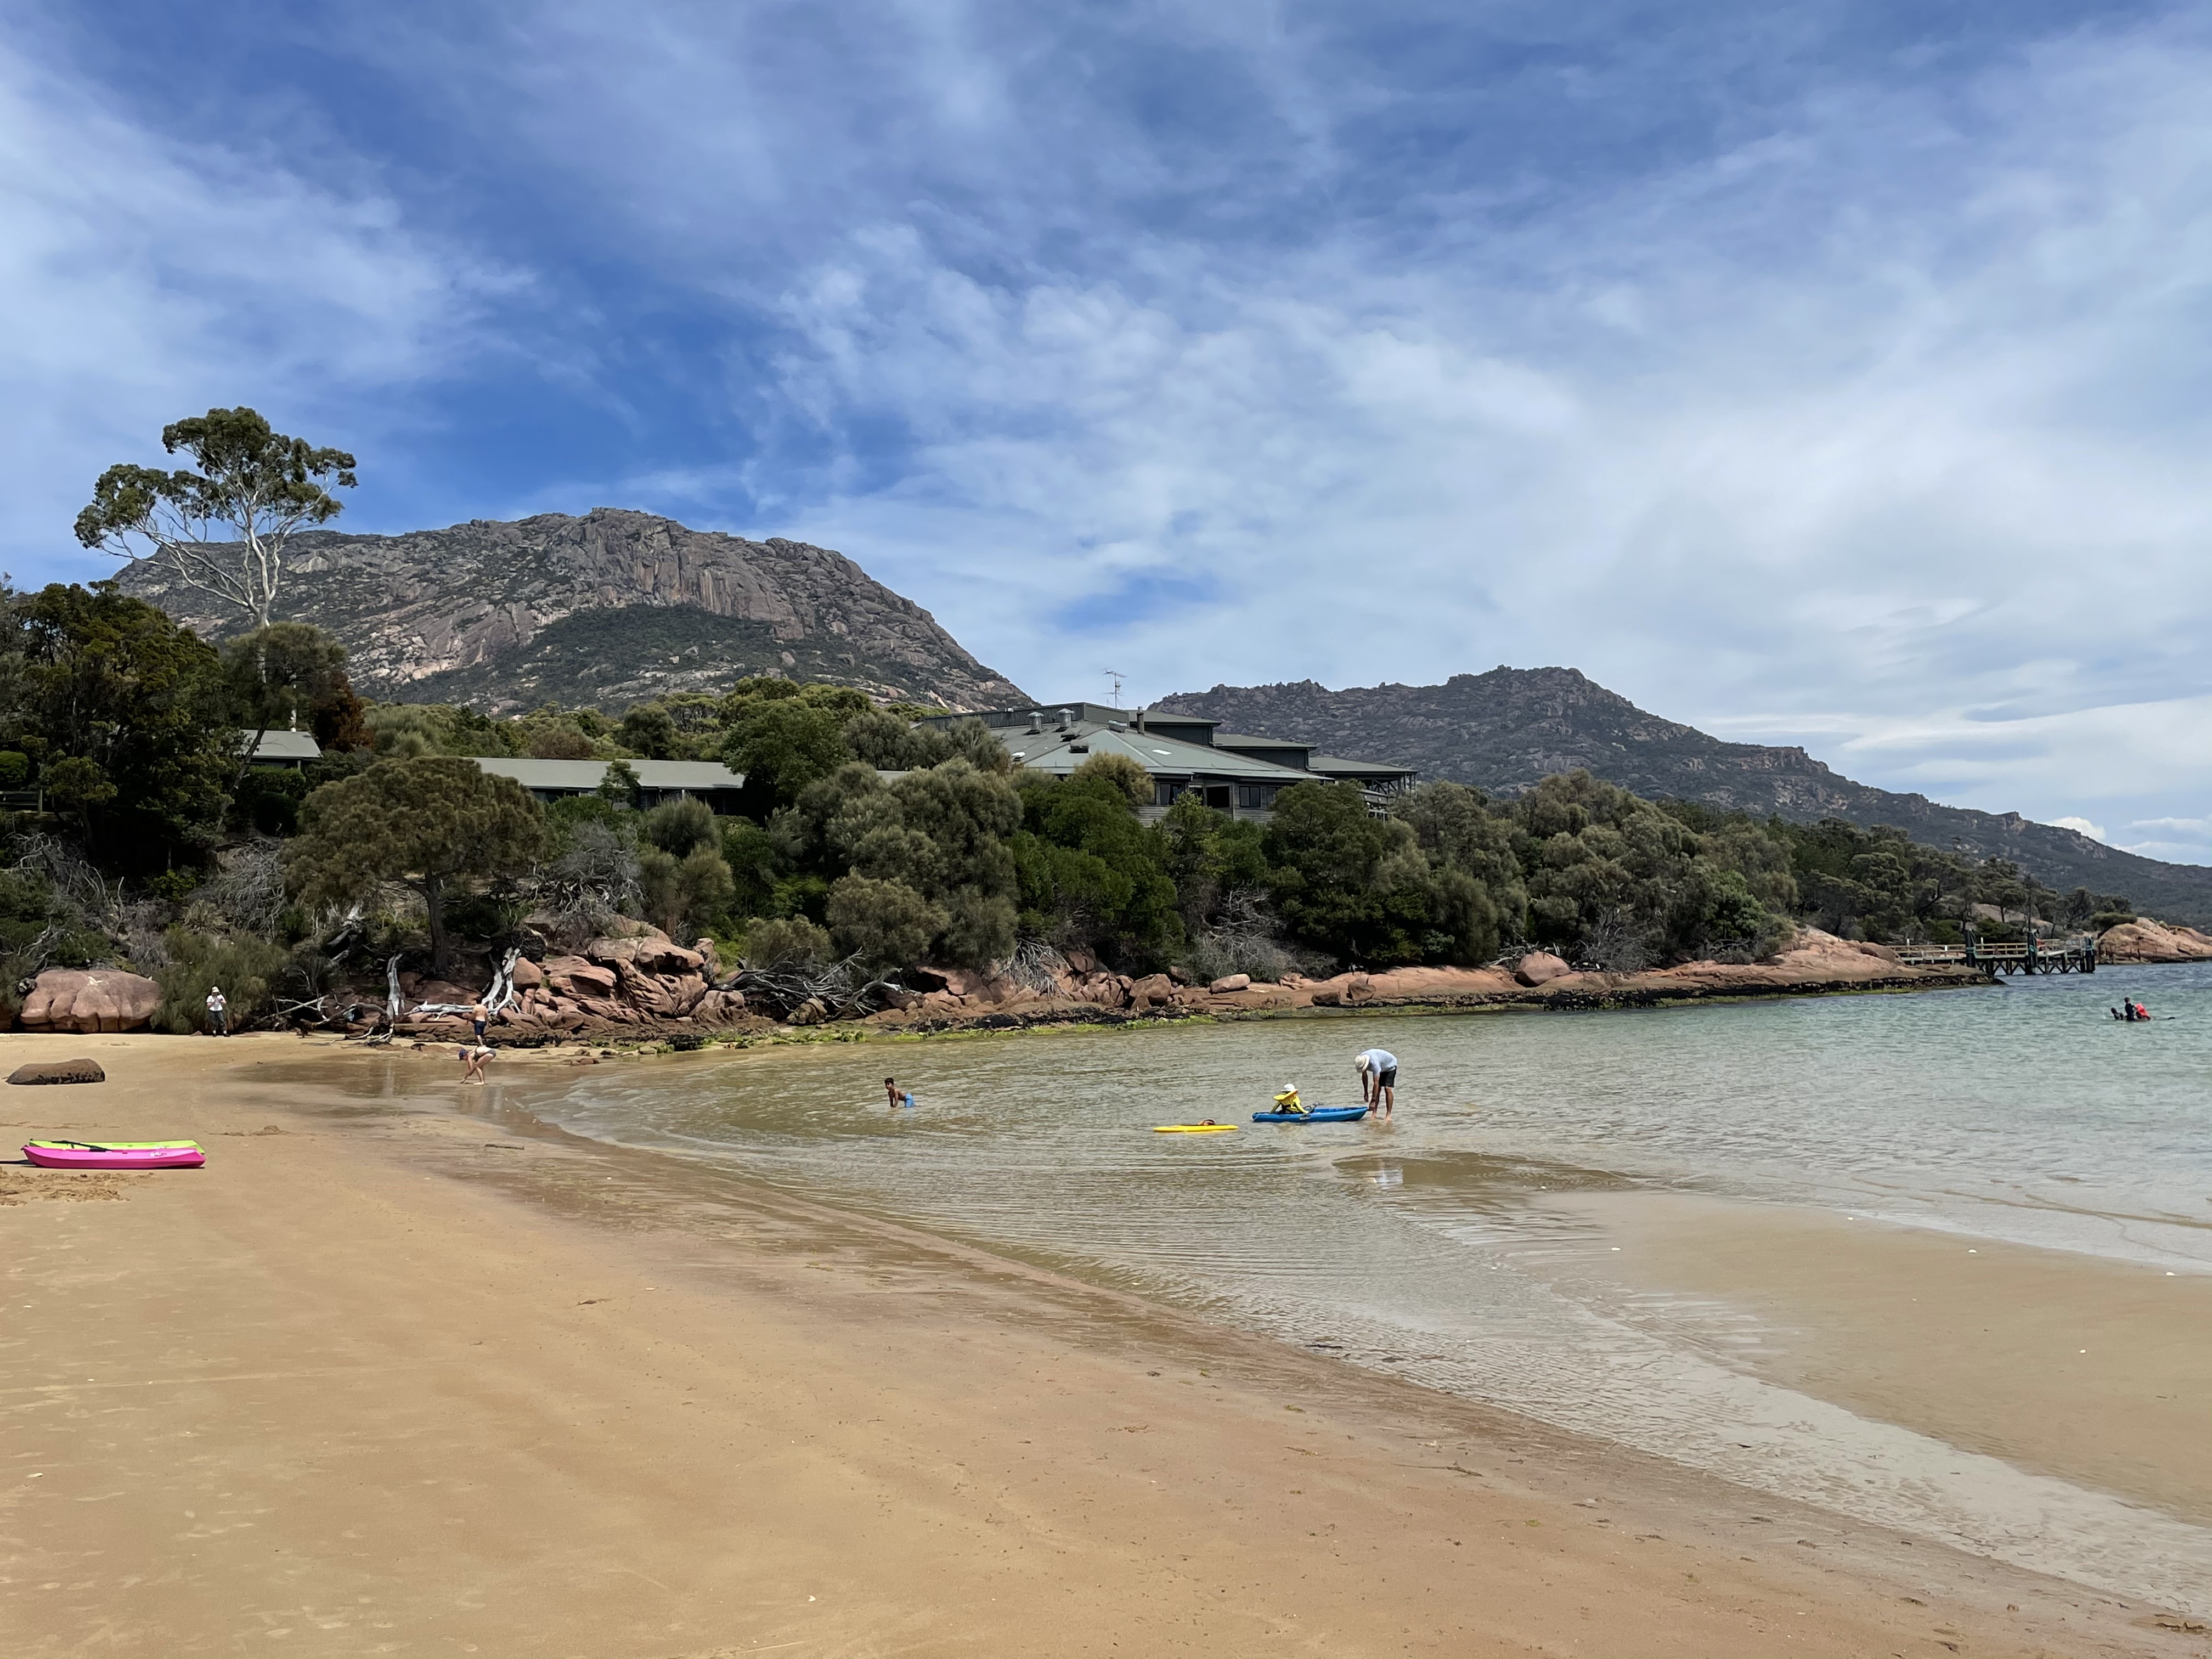 Fig. 3
The beach terminates to the south against the monolithic granite mountains that form the peninsula. Note how shallow the water is at approximately low tide in Fig. 3. Also take notice of the lack of surf because of the very shallow water. This is very interesting.
Looking to the north (Fig. 4) we see a berm at the high-tide line with a runnel (darker sand to the right) behind it. The tidal range is predicted to be 4.5-6 feet in Great Oyster Bay. Note the relatively steep beach face.
 Fig. 4
High tide laps at the toe of the dunes (Fig. 5), which consist of individual-to-merged primary dunes (created by sand blowing from the beach) with irregular spacing, rather than a single, continuous dune facing the beach. Plants appear to be important in building and maintaining the dunes.
 Fig. 5
There are some anomalies in Fig. 5, however; for example, there are black areas (organic matter), that should be buried, as well as wave-eroded scarps. We can take a look along the beach (Fig. 6) and notice some more features.
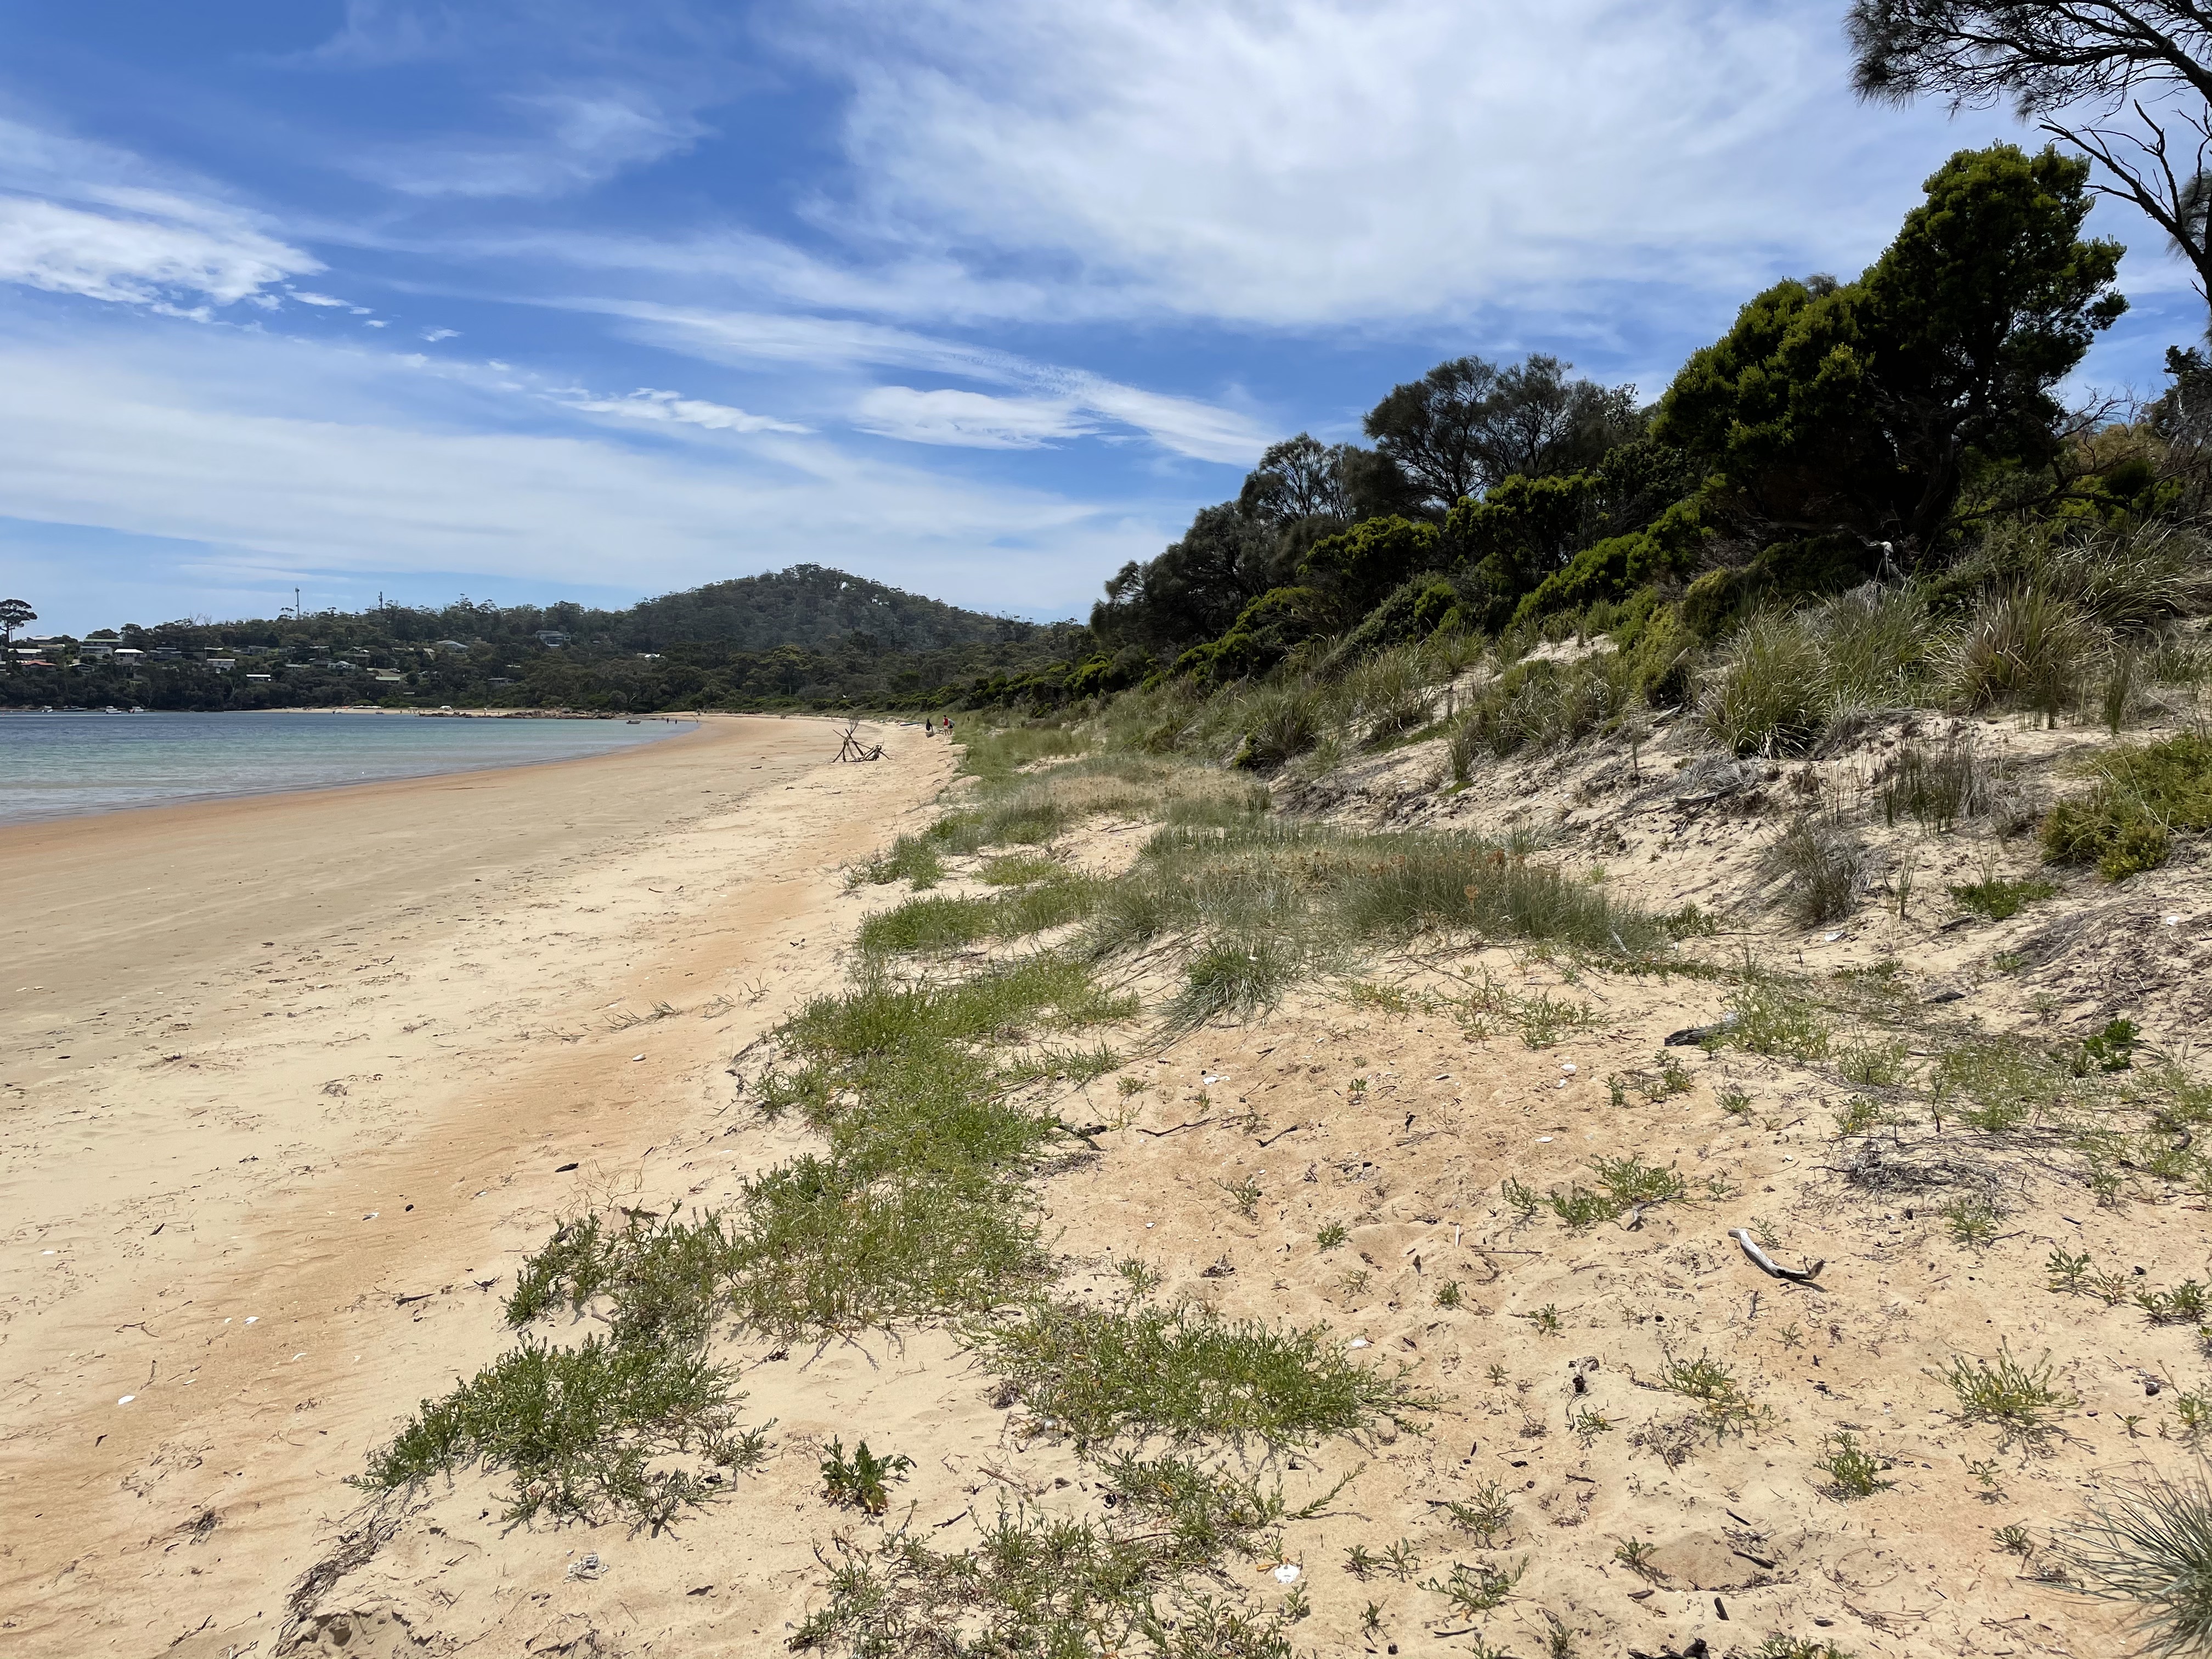 Fig. 6
To the right, on the larger dune, we see the erosional surface stained dark. It is recovering, however, unlike at the previous beaches we observed. In fact, in front of the main dunes, incipient dunes are forming, as seen across most of the foreground of Fig. 6. High tide reaches and thus limits development of these dunes. There is a good supply of sand.
About 100 yards north of where Fig. 6 was taken, incipient dunes are not evident (Fig. 7) although sand is collecting at the toe of the main dunes. Note the low (~12 inches) scarp at the base (aka toe) of the dunes.
 Fig. 7
Near the northern extent of the beach, the dunes are low and irregular (Fig. 8). They are also more fully covered by plants.
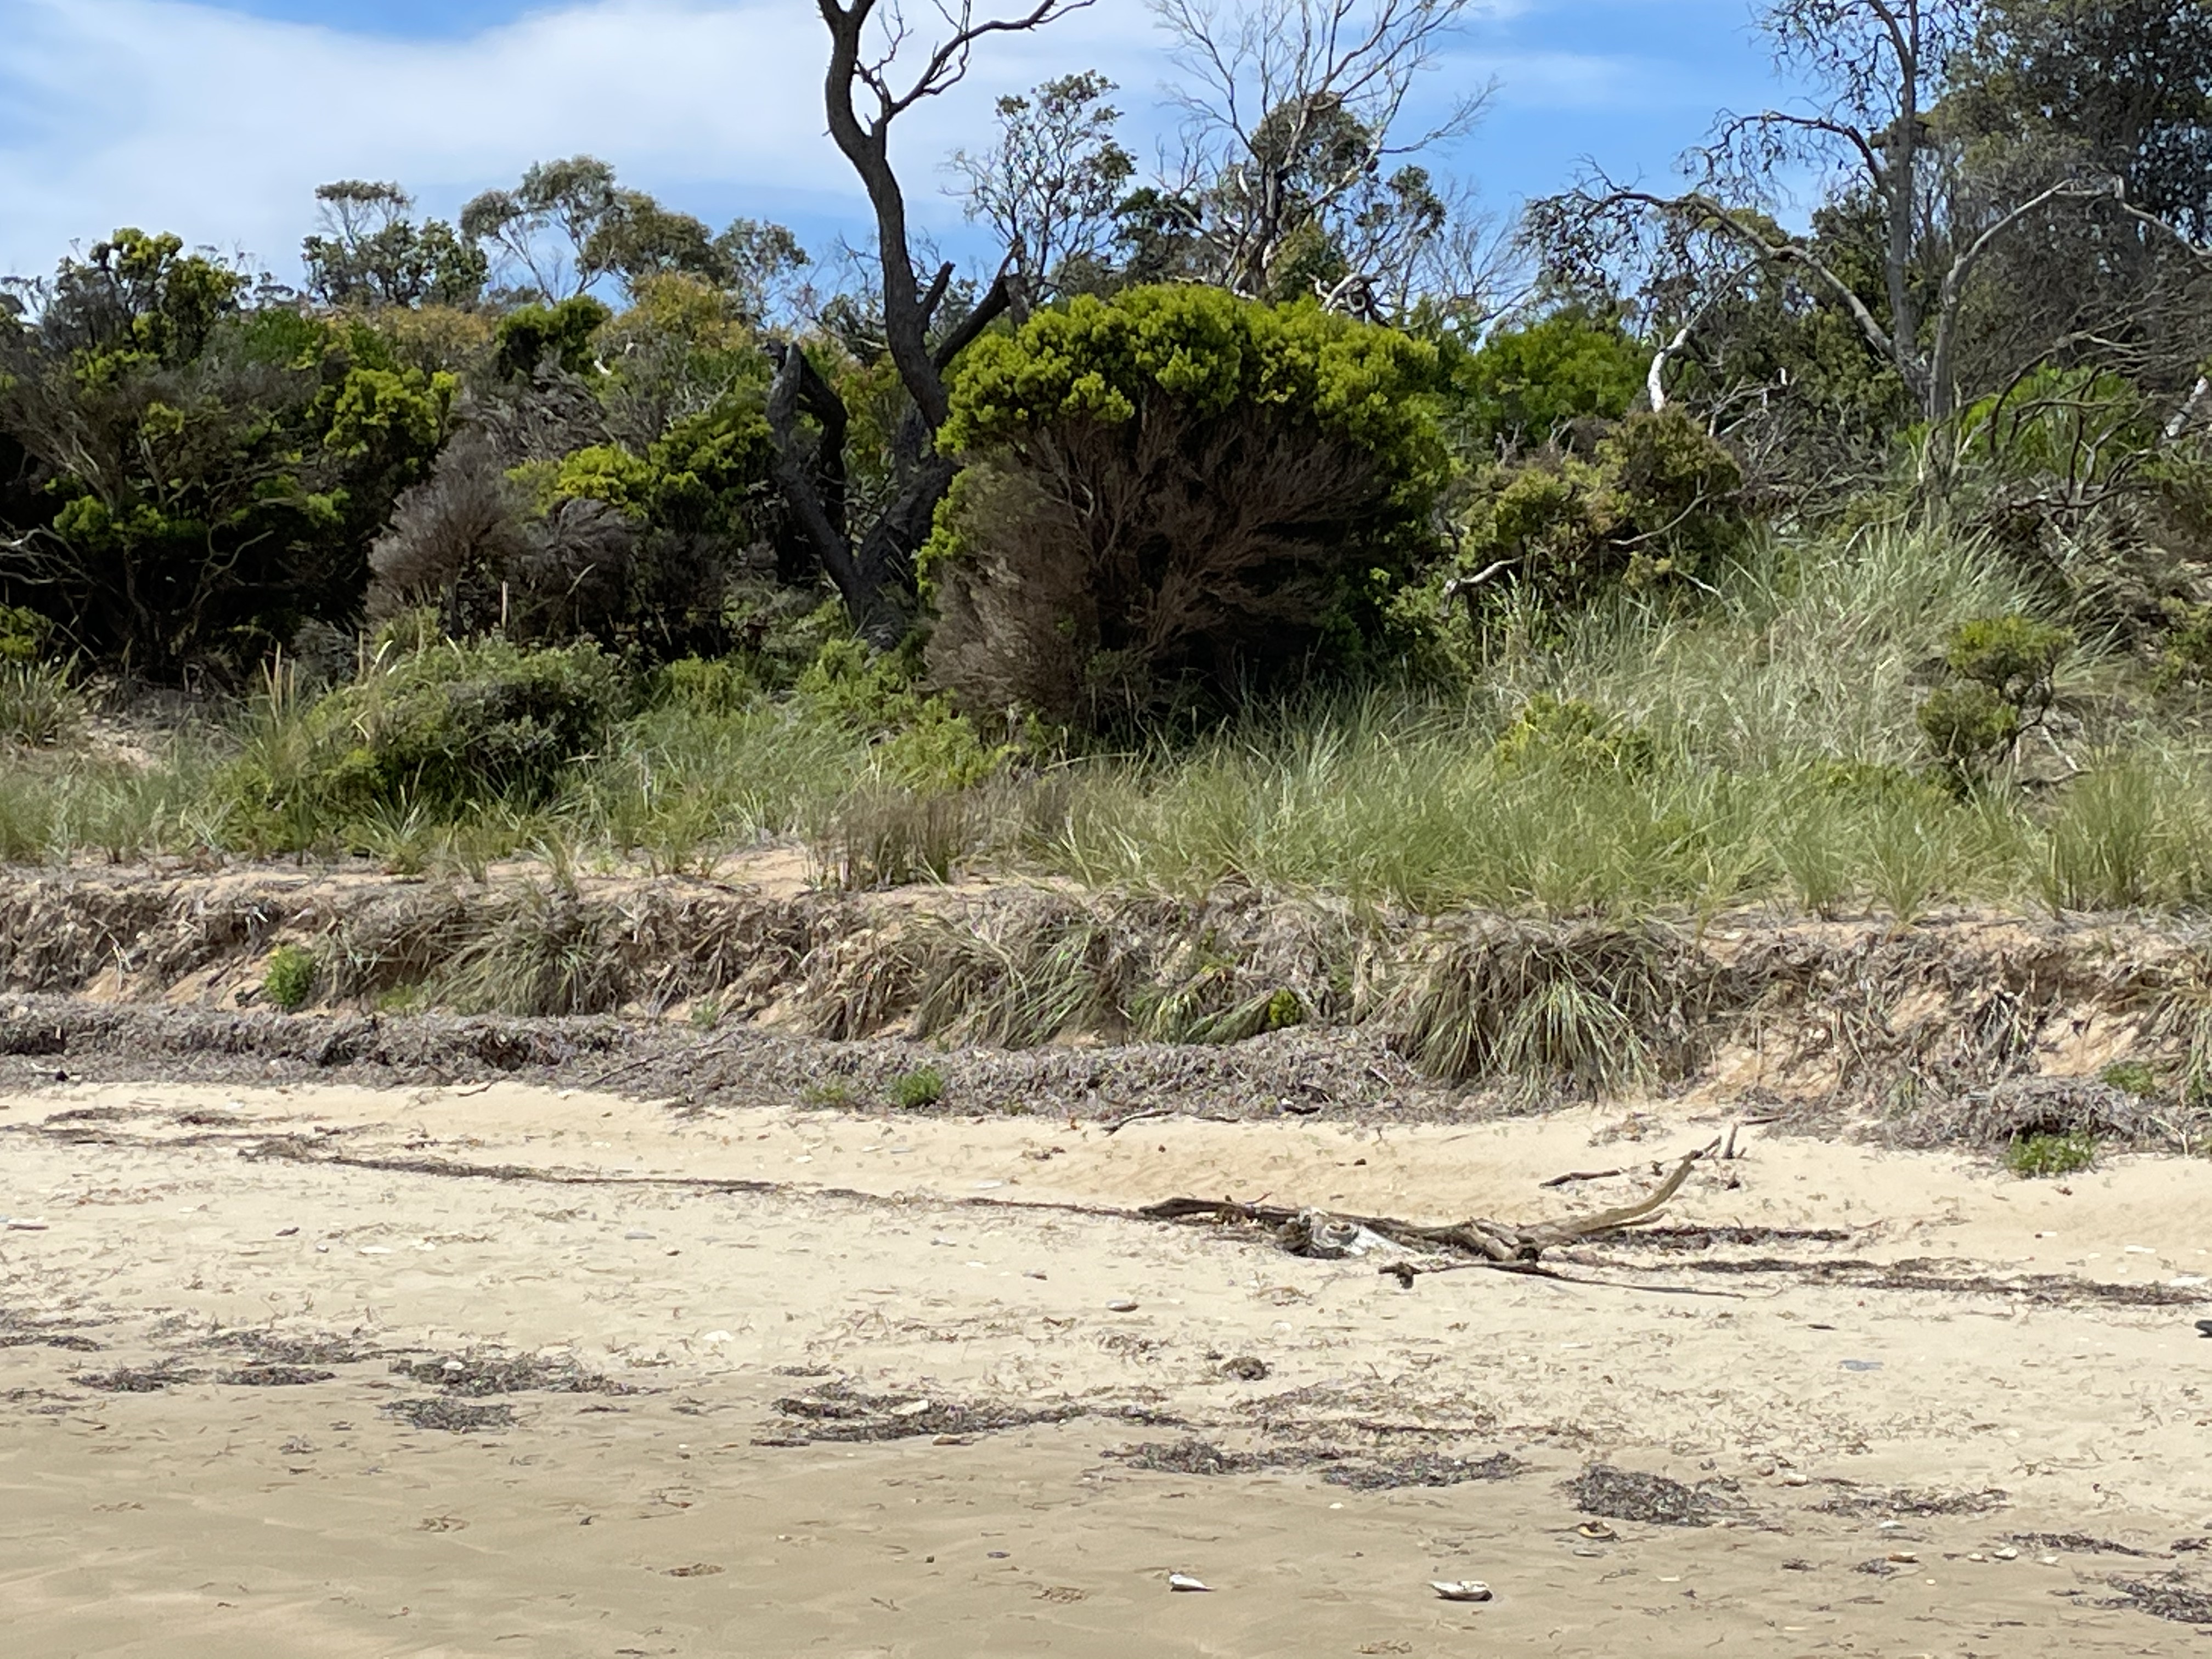 Fig. 8
Another interesting point in Fig. 8 is the lack of recovery of the beach toe. Dead grass covers the rough and steep cut in the sand. A line of debris marks a previous high-water event, possibly a spring tide or a storm.
The beach and dunes change character over the extent of this beach, which is less than a mile in length. How is that possible? The short answer is that there is more sand available at the southern end of the beach. More sand to build a berm and a robust dune system, and then to recover those dunes when they are eroded by storm waves. Let’s try and dig a little deeper.
Figure 9 is a view looking south from the northern end of the beach. Besides showing the granite peaks we’ll talk about next time, they show a wide, flat beach. It looks like it was created with a bulldozer, by the Corps of Engineers. It wasn’t. This beach hasn’t been modified in any way because it’s in a national forest.
 Fig. 9
This is an example of the limitations of models. Beaches have been classified by their dynamic behavior as either dissipative, with large waves expending their energy over a wide surf zone with several bars, or reflective. The latter type of beach has very low waves and a narrow surf zone on a steep beach face.
Do you see any waves in Fig. 9? There are nearshore bars visible in Fig. 3, however. So what’s up?
I have to rely on my experience with storm deposition on low-energy beaches in the Gulf of Mexico (see Keen and Stone, 2000). This is a topic not often addressed in the scientific literature because of the rarity of such situations. I have proposed in the past that a low-energy beach (small waves), with bars and a wide, shallow face (dissipative), is relict — leftover from a high-energy event. It’s a snapshot frozen in time because the low waves that usually occur are unable to move sand around. Such a beach, out of equilibrium, may persist for years before returning to its proper configuration. It’s even possible that it could last decades if storms are sufficiently rare.
What about the other question: Why is the northern end of the beach (Figs. 8 and 10) so different from the southern end (Fig. 3)?
 Fig. 10
The beach face is about as steep at the northern limit as at the southern terminus (compare Figs. 10 and 4), and both are much steeper than in the middle (Fig. 9). The northern end is becoming reflective (steep and narrow beach face) because sand is being removed, allowing the weak waves to do their wimpy thing. The sand has been transported to the southern end of Coles Bay by waves in a process called longshore drift. Waves never approach the coast at ninety degrees and thus they slowly roll sand particles in one direction or the other, up and down the beach face. This can be reinforced by tidal circulation, which is also an asymmetrical hydrodynamic process.
The southern end is becoming more reflective, despite the high sediment load, because of slightly higher wave energy and help from the large tidal range, which allows higher waves to approach closer to shore during high tide. The center of Coles Bay is not recovering and remains a wide flat beach typical of a “storm” profile.
Finally, let’s look across Coles Bay at the granite plutons we’ll be examining next. Figure 10 reveals that this beach, like so many pocket beaches in Tasmania and Australia, is a quantity of sand trapped between rocky headlands. The sediment has no where to go but back and forth, to and fro, for eons, until plate tectonics changes the situation drastically.
Fig. 11
Which it always does…
Coastal Geology: Uniformitarian Principles
The hectic pace of the last few posts is going to lighten up a little today. Not because there’s nothing going on; rather, there’s so much going on, spanning all of geologic time (the history of the earth), that we have to turn to general principles to stay on track.
I’m going to get a little philosophical here and talk about a basic tenet of geology: Uniformitarianism (yes, another ism) posits that chemical and physical processes have remained constant throughout earth’s history. Apparent irregularities are due to changes in past physical and chemical environments that we are unaware of; physics has not changed. For most classical geological processes, this means that we know more about the past than the present, even if in a somewhat static way.
One subdiscipline in which this is not the case is sedimentology, and other process-based disciplines that study processes that operate at standard pressure and temperature (e.g. 68 F and 1 bar used by NIST); I’m referring to things we can see with our eyes. Touch and not get burned or crushed.
For example, previous posts have discussed metamorphism and the ductile/brittle deformation of sedimentary rocks, without a shred of observational evidence that such processes exist. We haven’t seen any of these processes in action — not enough to convince a skeptic anyway. We extrapolate to geological scales from laboratory experiments or theory, but we are prevented from observing these processes directly by spatial and temporal constraints beyond our control.
For the record, I think geology is founded on a robust theory that is continuously tested with observations, and updated to reflect what is being learned as our observational skills improve.
The sedimentary rocks we examined in previous posts were originally deposited in familiar modern environments, like nearshore marine and rivers/lakes. Thus they look just like sands and muds we can examine in modern depositional environments, right down to the ripples and organisms found in them. The principle of uniformitarianism also applies to regional and global scales; in other words, we shouldn’t expect to find the same depositional environments in modern Tasmania that existed in the past.
For example, most of the sedimentary rocks we’ve examined were part of thick sequences, sometimes miles thick, representing the erosion of large mountain ranges. As fascinating as the mountains of Tasmania are, they are less than 5000 feet in elevation. Furthermore, the rivers are small and carrying very little sediment, so neither sand nor mud are being delivered to the ocean. In other words, there are no swamps, wetlands, barrier islands, lagoons, river deltas, or any other coastal areas like in the northern Gulf of Mexico, the Bay of Bengal, or other areas with high sedimentation rates. What do we find instead?
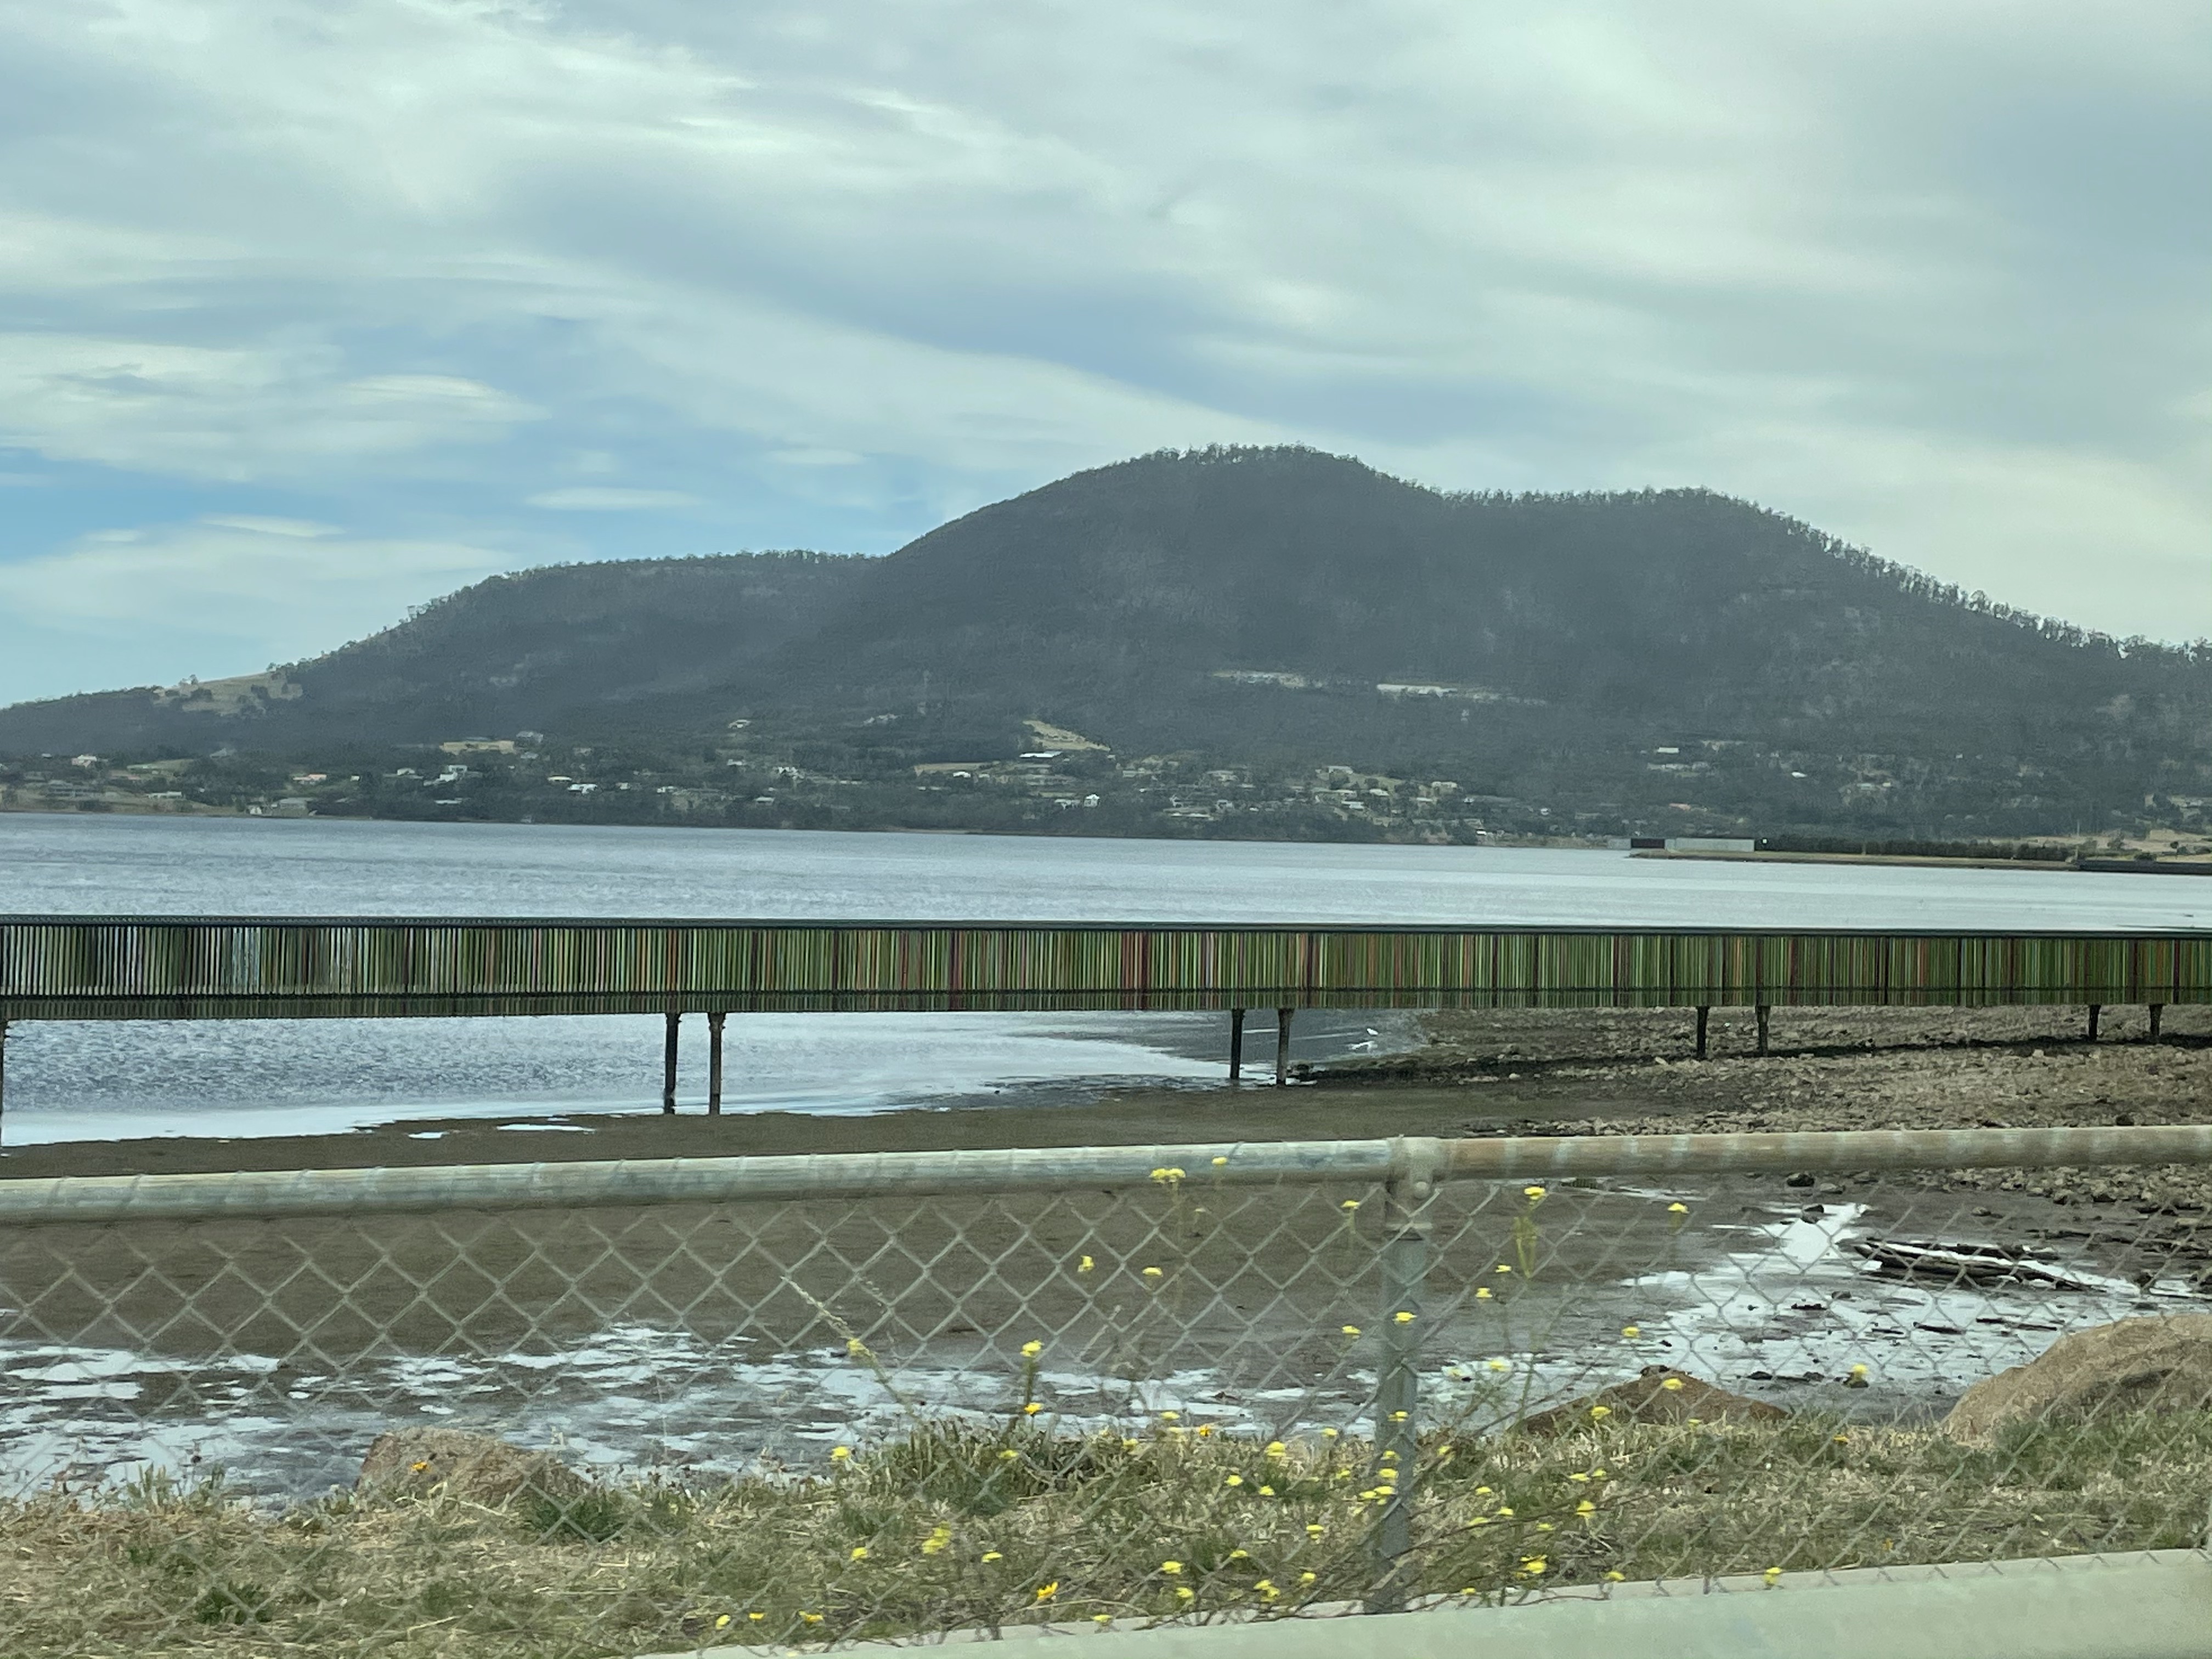
Figure 1 shows a typical pocket beach/bay from the east coast of Tasmania, not very far north of Hobart (see Fig. 2 for location). The beach face is rather steep because of the coarse sand available (larger sand grains form steeper slopes). The beach is missing something, however; there is no berm at the top, even though the tidal range is about 3 feet here. This is like the beach in a lake.
 Fig. 1
Note that this location is in a small bay with a restricted mouth, which prevents most waves from entering. There is a small, tidal-dominated river that supplies no sediment. There isn’t even a bar at the mouth of the river.
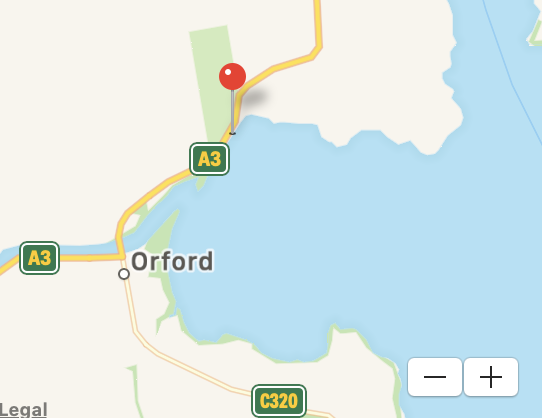 Fig. 2
Figure 3 is an aerial photo of Orford Bay from Google Earth.
 Fig. 3
This image reveals that the river was filling its estuary with sand, the beach propagating seaward, until the supply of sediment was exhausted, leaving a small bay. There has been very little sediment deposited after the groins were constructed at the river mouth.
Can we use the principle of uniformitarianism to apply what we see at Orford Bay to the sedimentary rocks we’ve encountered so far on our journey? The physical processes controlling erosion and deposition (i.e., waves, tides, currents) were present in the past but operating under different conditions. For one thing, Tasmania was not an island but part of a larger landmass; in fact, most of the area was under water and receiving sediment from adjacent land through much of geologic time. That’s why there are marine sediments mixed with volcanics in the older rocks we’ve examined. Nevertheless, we saw nearshore marine features in the Proterozoic rocks discussed in a previous post, which contained thin beds of mudstone intercalated with sandstone, as well as cross-bedding.
We can’t apply what we see here to the scale of rock sequences, however, because there is no active deposition occurring at Orford Bay. There will be no record of Orford Beach in the geological record because the sediment is relict; any particles in this area are being shuffled around endlessly, perhaps slowly moving offshore. There will be no future Orford Formation, the individual particles we see on this beach instead being dispersed as part of a larger layer of sediment created by weathering of igneous rocks within the region. However, as with any sediment, the destiny of this tiny, starving bay ultimately depends on plate tectonics.
What about those igneous rocks I alluded to?
Figure 4 shows a dark, highly fractured/jointed rock that has been worn down by the ravages of chemical and physical weathering — oh yeh, that’s Tasmanian Dolerite exposed (barely – Fig. 4 is less than 6 feet in height) along the coast.
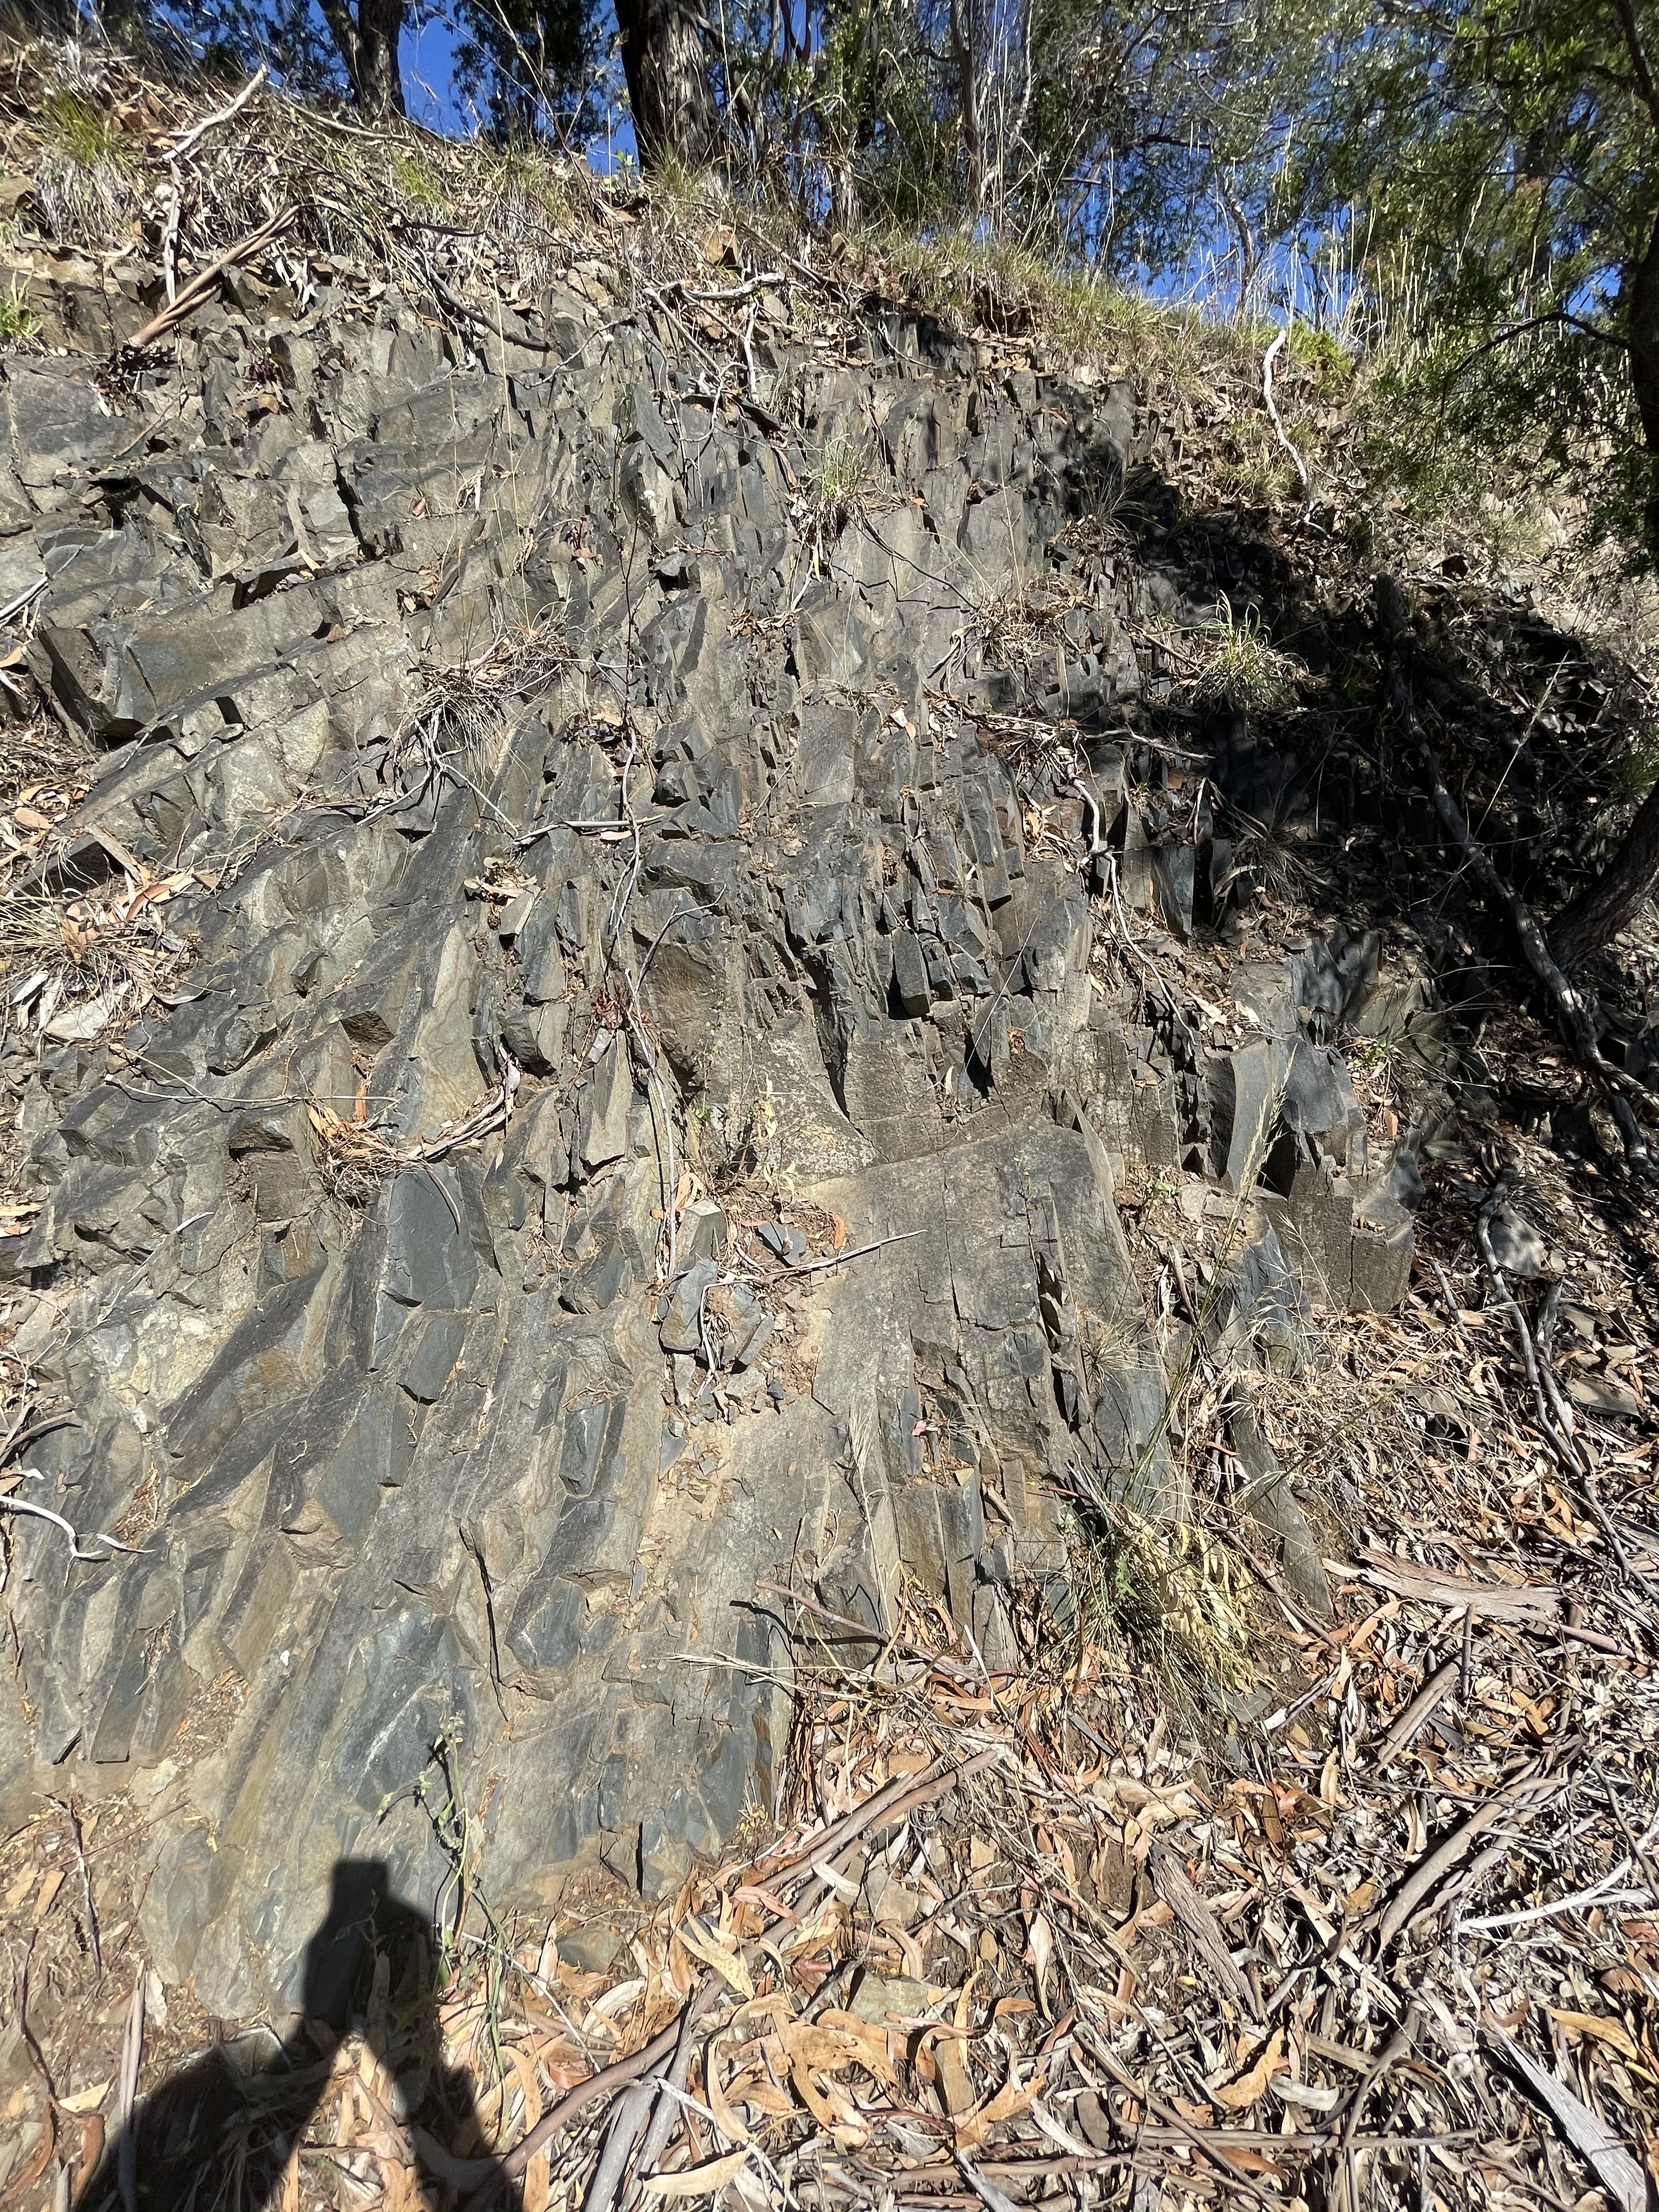 Fig. 4
I’m going to go out on a limb here (again) and say that the Jurassic dolerite in Fig. 4 is not contributing to the lovely, coarse-sand beach we saw in Fig. 1. Those sand grains came from the long-gone Triassic sandstones we saw in the last post. The Parmeener rocks, which are absent in this area, contain a lot of quartz and feldspar to form beaches.
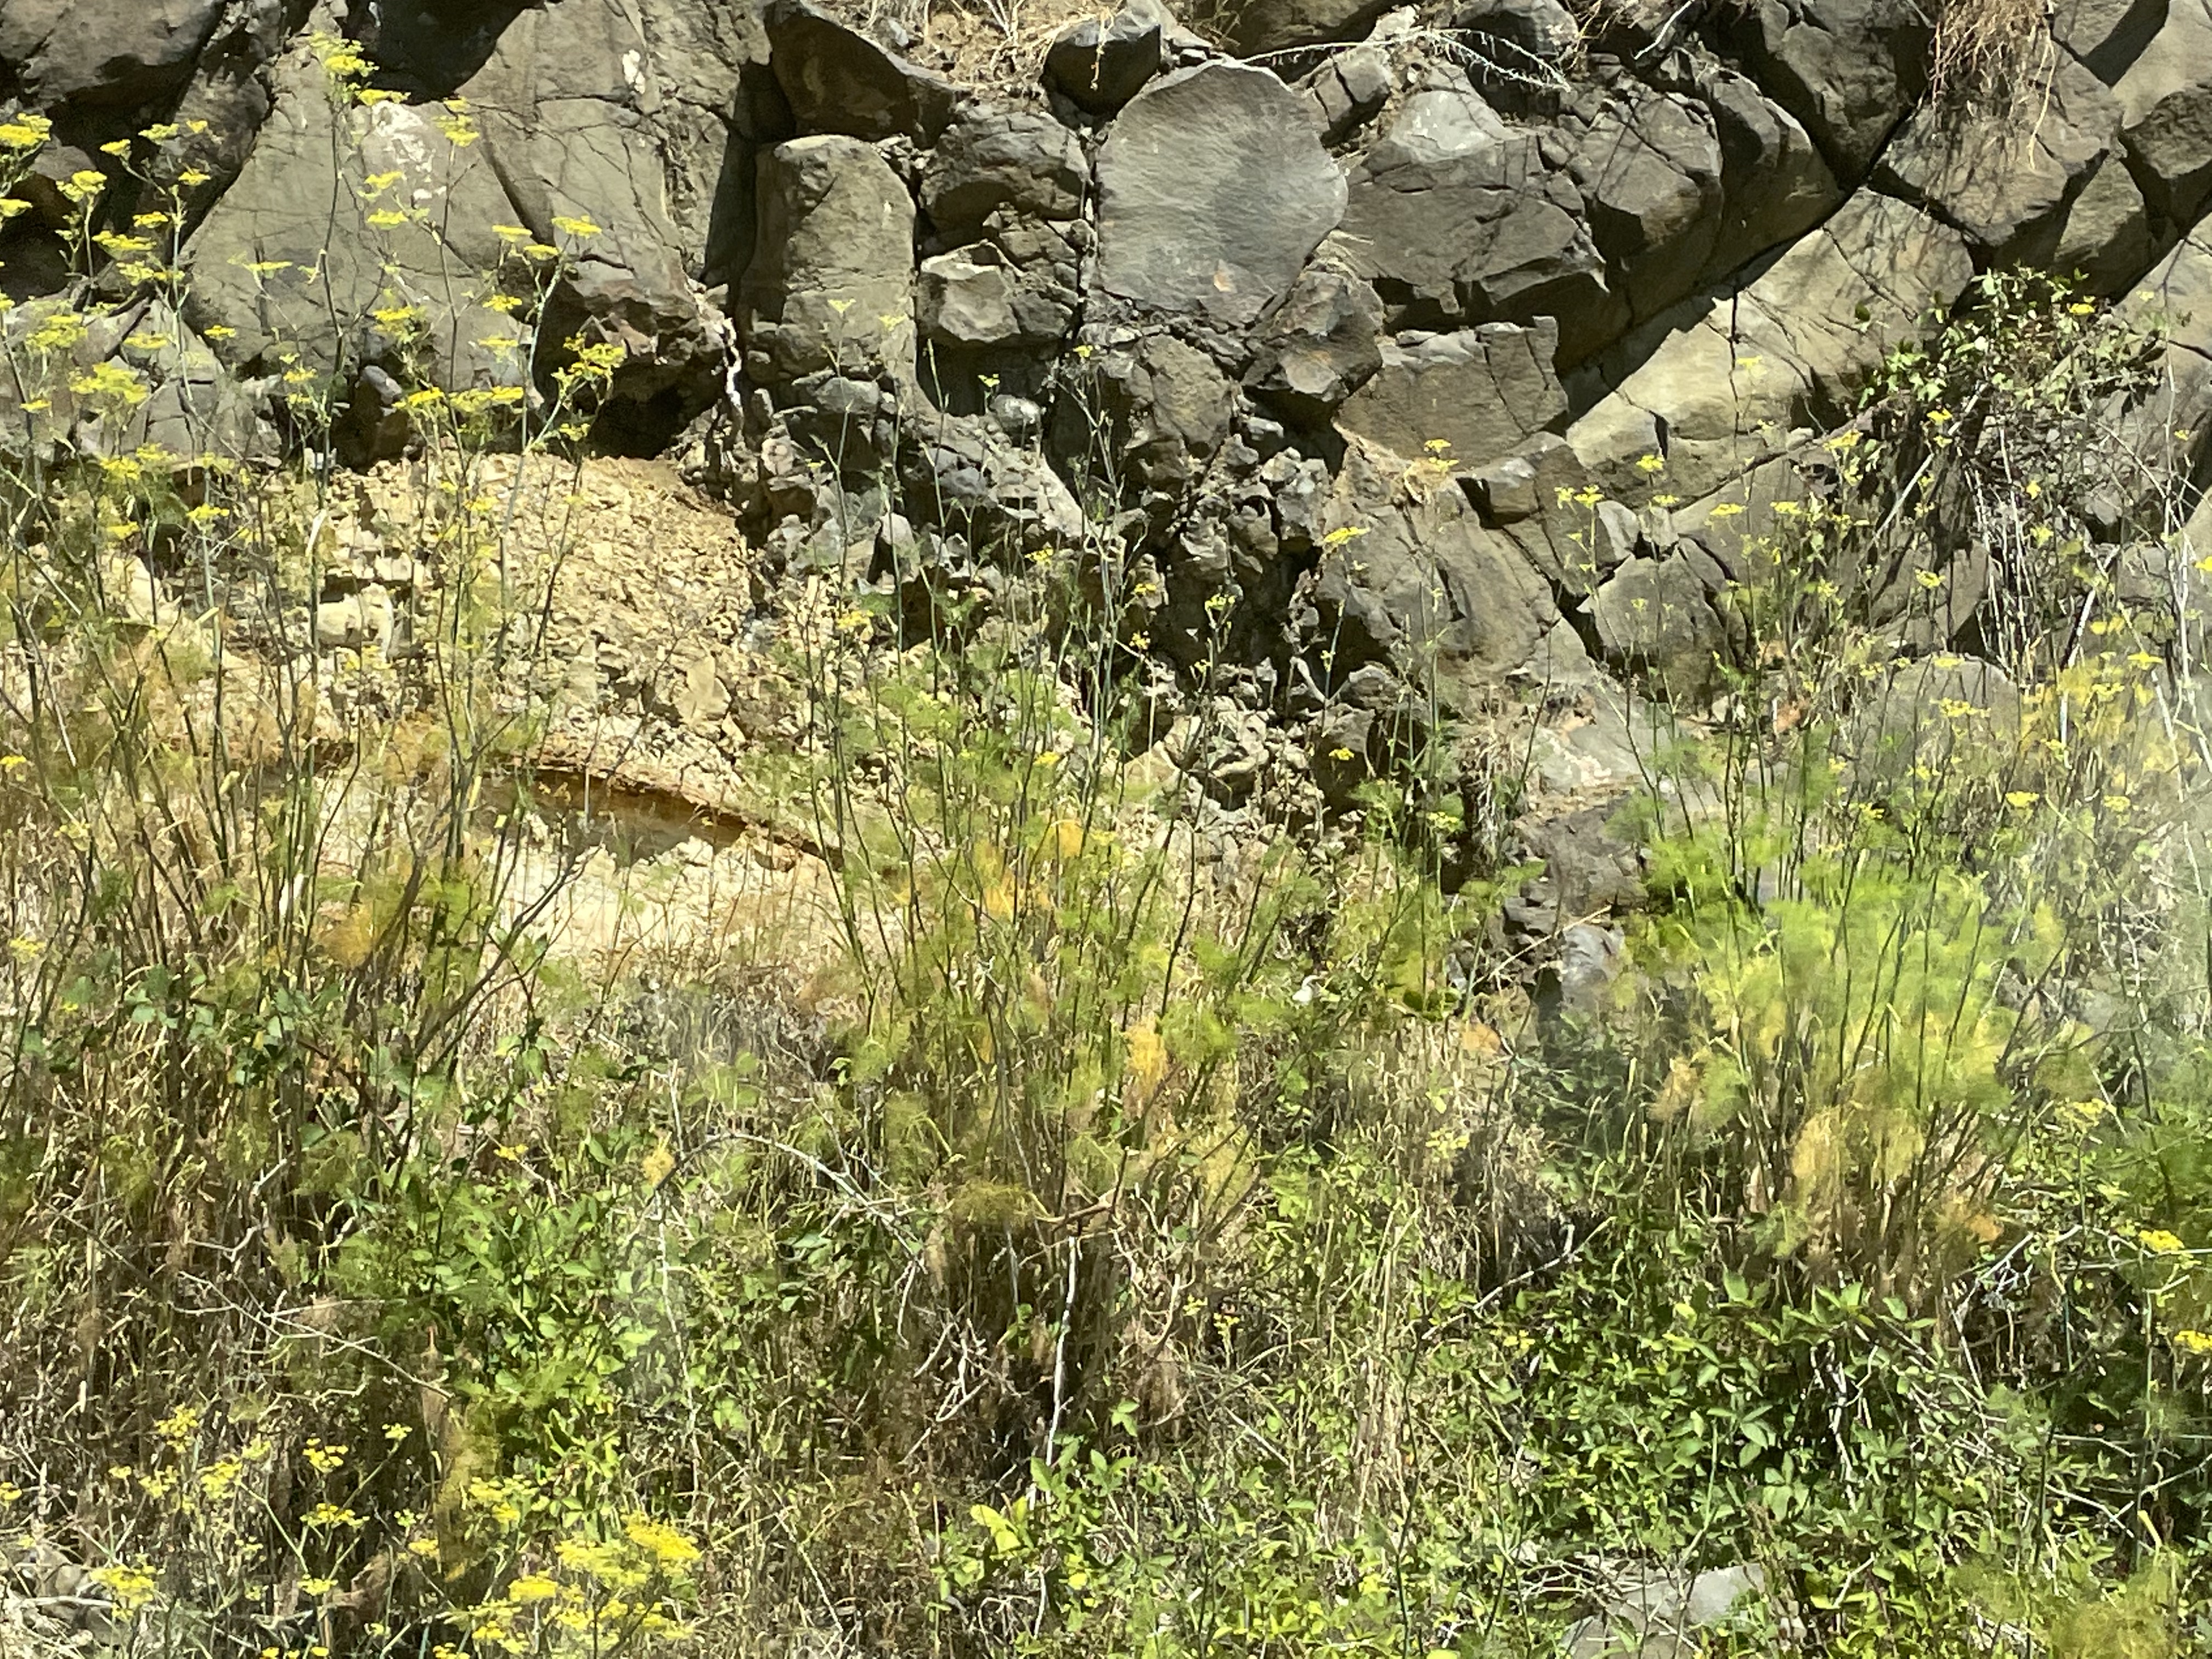
For some reason, the Tasmanian Dolerite is pristine in this location and is photogenic (Fig. 5).
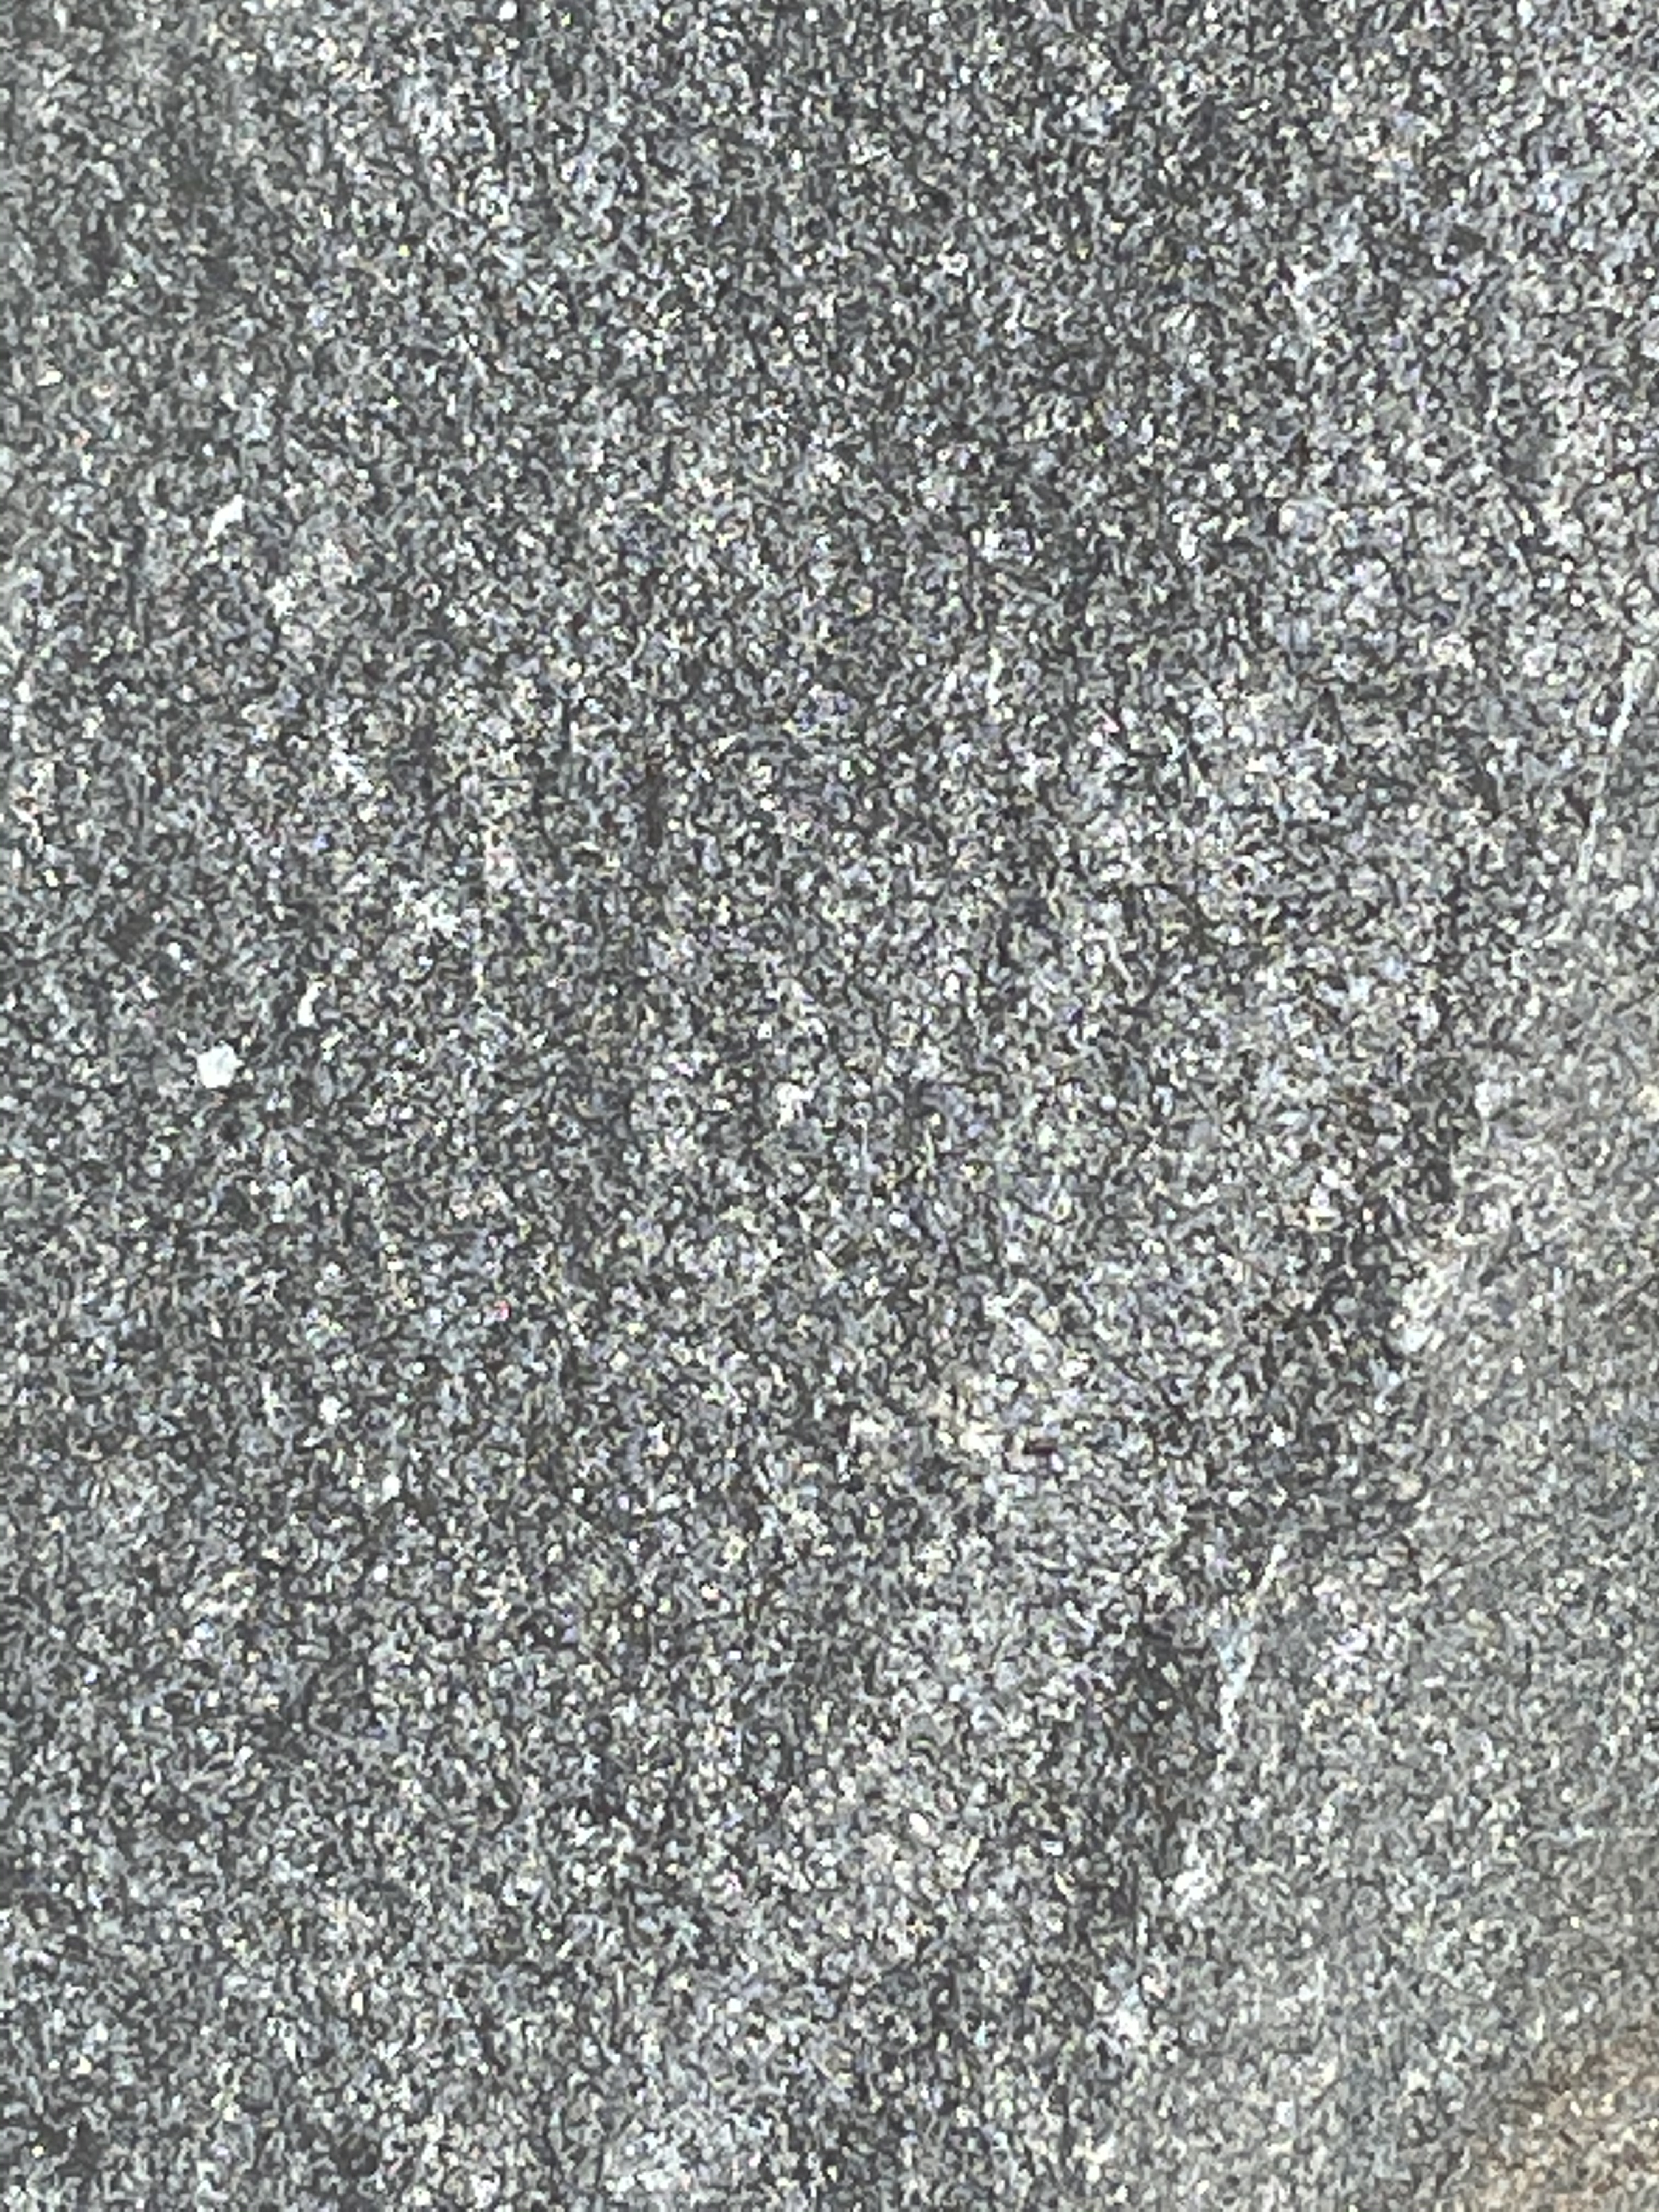 Fig. 5
Careful examination of Fig. 5 (field of view ~2 inches) reveals white and gray particles which we can assume are mineral crystals, albeit tiny ones. However, they are not shaped like the crystals we see in museums and most rocks. Some of them look more like organisms than minerals.
Studying Fig. 5 has made me struggle to remember my mafic intrusive mineralogy to no avail. I’m not an expert but I’ll share my explanation of the irregular crystals seen in Fig. 5. Mafic magma, from which dolerite crystallizes, typically contains pyroxenes such as augite, which has a high iron content and thus weathers into hematite, a red mineral. Magma is not uniform however, and this sample could have cooled and crystallized in a part of the original magma with a more alkaline composition (i.e. sodium, potassium, and possibly rare earth elements). Alkaline pyroxenes like Aegirine can crystallize with the right chemical composition of the magma and cooling history.
I couldn’t find anything general on the topic of weathering products of these minerals, but it makes sense to me that Na and Ca will weather into whitish minerals at low temperature and pressure. Feldspars with these elements certainly weather to produce white byproducts because of the sodium and calcium.
Bottom line: this dolerite is contributing nothing but quartz, and little of that (hard to tell from Fig. 5), to the beaches of SE Tasmania. The other minerals in a dolerite are either dissolved or bound to the clay minerals formed from original olivine, feldspar and pyroxene minerals. Clay minerals have a mineral structure that accepts almost any element.
About twenty miles north, we came to Kelvedon Beach near the town of Swansea.
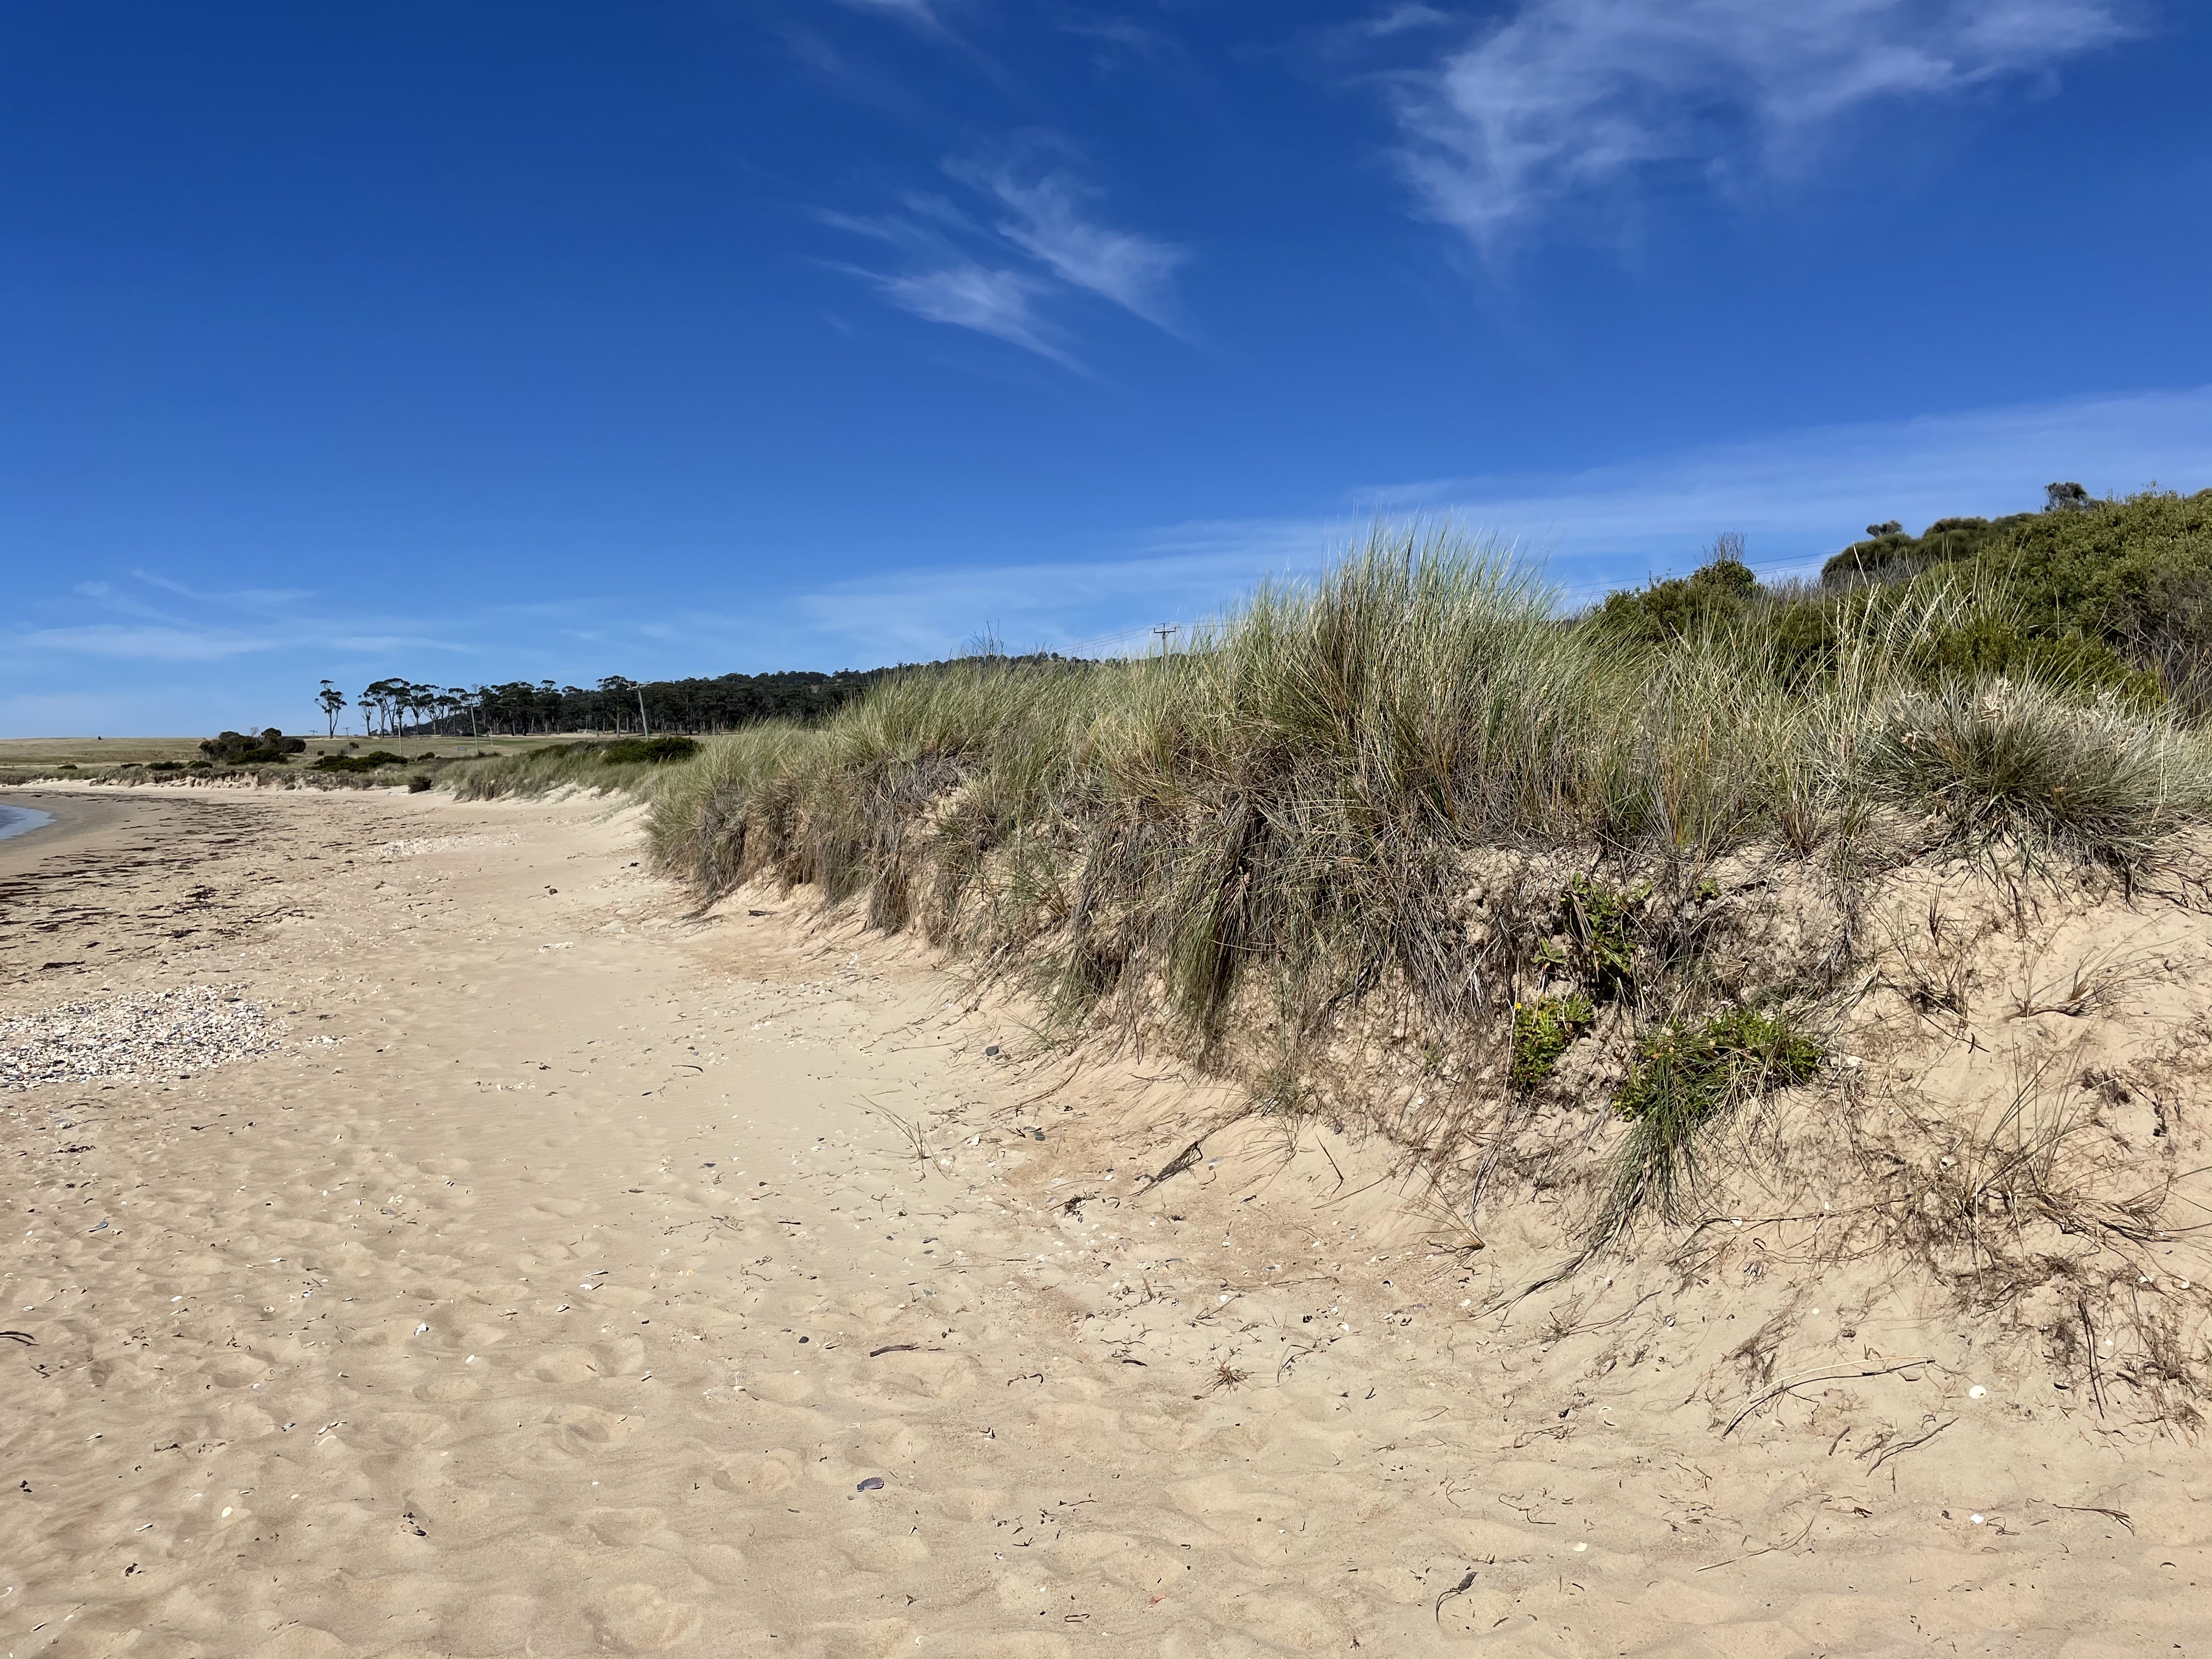 Fig. 6A
The foreshore, looking to the south (Fig. 6), shows an eroded dune and flat upper beach. Plants have regrown quite a bit, so it has probably been several years since the erosional event that removed half of the dune. That is a substantial volume of sand, possibly as much as 6 feet of dune.
 Fig. 6B
The high-water line (limit of slightly darker sand in Fig. 6B) is marked by an increase in shell material but there is no sign of berm growth, which suggests a lack of sand to replenish the shoreface. The assumption of a catastrophic event is supported by relict shell beds on the upper beach (Fig. 6C), located on slightly elevated areas where a berm should be. Further evidence of a huge storm is the low volume of sand being returned to the beach by wave action, a natural process that restores beaches after storm erosion. The lack of beach recovery, during an interval long enough for seagrass to be reestablished, implies that the offshore flow during the event was truly catastrophic, taking sand out of reach of fair-weather waves.
 Fig. 6C
Most of the shells seen in Fig. 6C were unbroken, as if deposited suddenly, rather than worked for months or years by waves, and broken into fragments. There were several patches of shells distributed irregularly along the shore, suggesting areas of concentrated wave power during the high-water event that eroded the dune. The lack of any burial or removal of the shells indicates that waves haven’t reached this high up the beach since the event. This beach is on a relatively open coast (pin in Fig. 6D). Waves interfere constructively to focus on sections of beach for various physical and meteorological reasons, and this is where erosion is greatest. The deposition of intact, disarticulated shells and excess sand in a low berm at hot spots, is what would be expected.
 Fig. 6D
The beaches of eastern Tasmania can teach us so much.
For one thing, timing is everything. With waves and currents about the same in the past, this region was receiving vast quantities of sediment in a rich variety of coastal environments. Today, there isn’t enough sediment to stave off the storms that impact the coast and thus the shoreline is eroding, slowly but surely. Bad timing. There’s absolutely nothing we can do about continental drift, but that isn’t the only factor affecting coastal erosion.
Erosion is also what happens to most coastlines during when sea level rises, such as has been happening steadily for the last 10,000 years. Rising sea level requires a massive input of sediment to fill all that newly acquired accommodation space. Very few coastlines meet the criteria.
We’re certainly not driving the train, but we aren’t helping the situation either, pumping greenhouse gases into an already warming atmosphere.
Nor can we get off at the next stop…
From the Continental Divide to the East Coast: Mesozoic Rocks
Thus far on our Tasmanian field trip, we have seen glacial deposits and landforms, highly metamorphosed schists, remineralization and emplacement of granites, and deformed Proterozoic sedimentary rocks. This post is taking us from the continental divide to the southeast coast at Hobart. We’ll be encountering mostly Mesozoic rocks on this leg (Fig. 1). The extensive hydrothermal activity associated with volcanism and intrusion along the Dundas Trough didn’t occur in this part of proto-Tasmania.
 Fig. 1
These sedimentary rocks were deposited in both terrestrial and marine environments after mountain building and erosion during the previous 200 million years. Thus, we start out (see Fig. 1) in Triassic rocks of the Upper Parmeener Supergroup (252-201 MY), which includes sandstone, siltstone, and mudstone interbedded with coal and alkali basalt. The Triassic rocks in the NW part of our study area (along Hwy A10) are fine grained and exposed in borrow pits (Fig. 2).
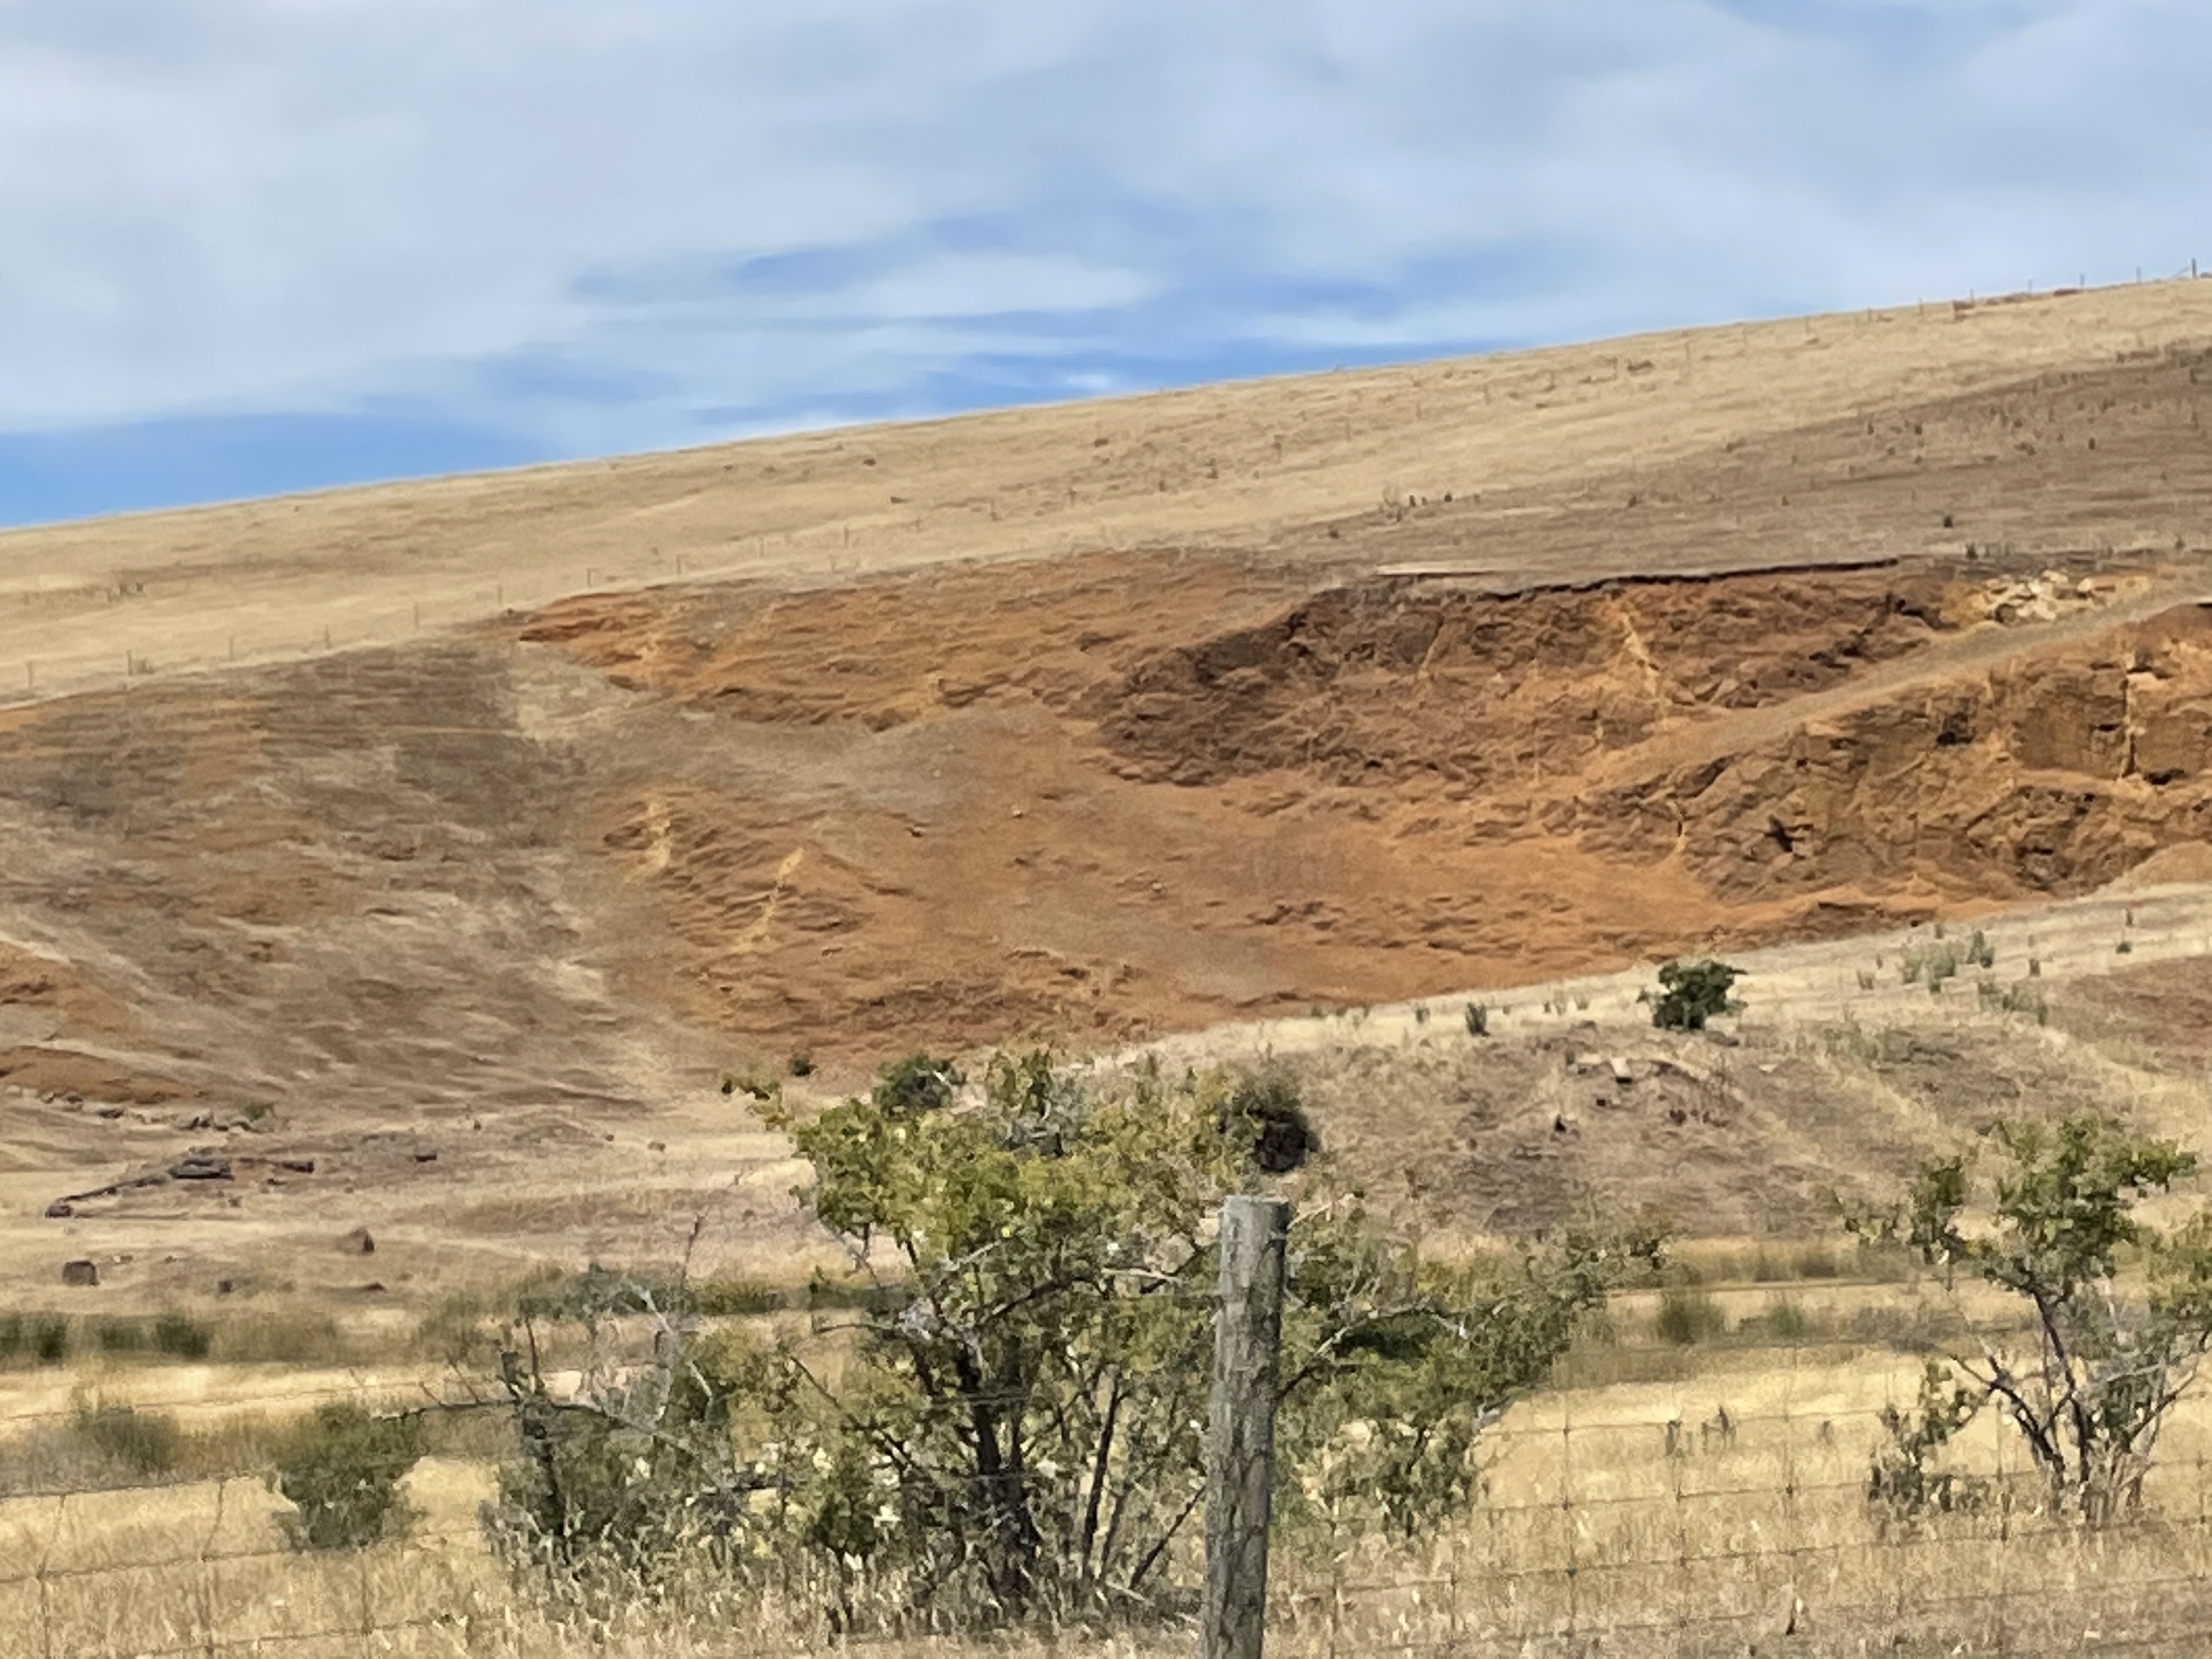 Fig. 2
Note the red color. Triassic sedimentary rocks throughout the world are red because they were deposited in oxygen-rich environments like rivers and lakes. They are thus called “red beds” colloquially. This was a time of high mountains and extensive land in Pangea and Gondwana that took a long time to erode.
After fifty million years, the Pangea supercontinent became unstable because of plate tectonics. When the crust thinned, mafic magma welled up and began to intrude into the thinned, terrestrial sedimentary rocks that had collected in the eastern part of proto-Tasmania. These weren’t deep rocks like gabbros, which have visible crystals in them, but were instead intruded near the surface and so formed small-grained rocks with some larger crystals that had already cooled. They are called dolerite. Dolerite is hard but variable in composition and, because of its mineral assemblage, it weathers quickly.
We encountered dolerite (diabase to American geologists) as a low bluff, about 10 feet hight (Fig. 3). This is known as the Tasmanian Dolerite. It is Jurassic in age, having been intruded between 201 and 145 MY ago. It underlies much of eastern Tasmania.
 Fig. 3
Note the blocky joint pattern that makes this look like a bedded sedimentary rock. Also, take notice of the red color, which has nothing to do with the red beds common to Triassic sedimentary rocks. The red comes from minerals like amphibole and augite, which have high concentrations of iron (Fe) and thus weather (i.e. rust) to form iron oxide.
Because of the variability in mineral composition and grain size, dolerite is often exposed only by road construction (Fig. 4). Thus, the same rock may form cliffs and mountains or low valleys.
 Fig. 4
For example, high ridges and mountains are typically underlain by dolerite in this part of Tasmania (Fig. 5).
 Fig. 5
We didn’t see any other examples of the contact between the Parmeener sediments and the dolerite, not even on the tops of mountains. They were either one or the other. It’s important to recall that because the dolerite was injected between layers of rock, it was originally in contact with the older sediments on either the top or the bottom of a sill or dike or as part of a laccolith. Thus, when we see Triassic sediments dipping slightly to form a cliff at the top of a hill (Fig. 6), we can’t be sure what’s beneath the resistant sandstone. However, the geologic map suggests that this is not sitting on top of Tasmanian Dolerite.
 Fig. 6
We will return to the Jurassic dolerite later. For now, let’s focus on the Triassic terrigenous sediments known as red beds. We didn’t see very many depositional sedimentary structures in the highly deformed rocks encountered so far on our field trip. It’s a little easier with these rocks, however, because they haven’t been subjected to mountain building (i.e., heating and compression). The first thing we notice is the high variability within a narrow window of time (Fig. 7).
Fig. 7
 A
A
The broad yellow line in Fig. 7A demarcates planar beds in an earlier time from irregular layers at a later date, presumably not too long (maybe a couple of years or the next day). Note that the view is slightly oblique looking down on the upper surface of the lower beds. As a general rule (be careful but still…), the planar beds were created when sand and silt were dominantly carried along by suspended sediment transport. Or at least by very gentle currents. Irregular beds as in the upper part of Fig. 7A are often indicators of channels, which are eroded into sediments, creating an irregular quiltwork of bedding.
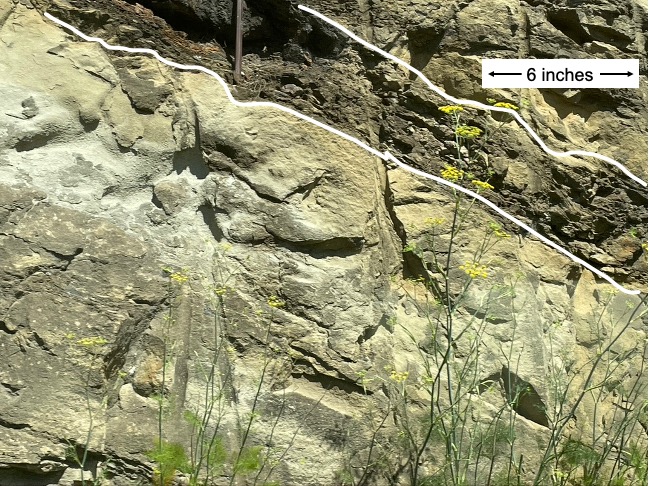 B
B
Another complicating factor in sedimentary depositional environments is the presence of organic matter, like dead leaves, animals, plants, etc, which collects where currents are weak. This of course occurs with mud but sometimes there is more organic matter than fine-grained clay minerals. The several-inches of organic matter in Fig. 7B (outlined by white lines) could have collected over a few hours or months. We cannot know. But these layers are common in clastic sediments where clay, silt and sand are simultaneously transported by streams and rivers. Note the lack of small-scale layering in the lower unit of Fig. 7B.
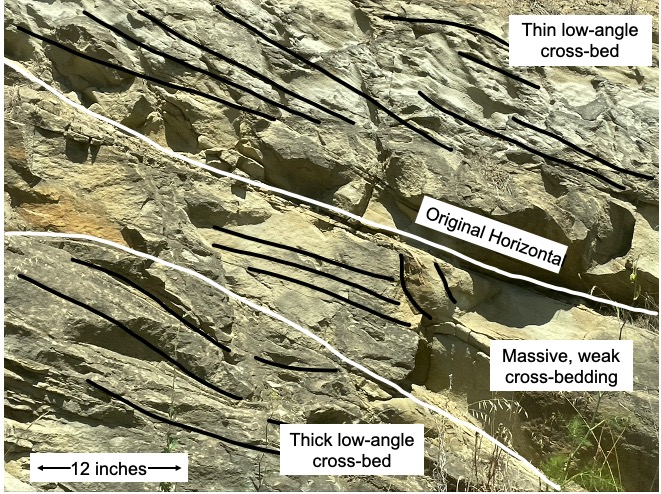 C
C
We know these sediments were deposited in a river because all of the cross-beds dip in generally the same direction (indicated by black lines in Fig. 7C). The white lines separate different sets of cross-beds. Changes in cross-bedding style indicate alterations in the flow or sediment or water depth, something like that. They don’t have to be significant. One of the sets highlighted in the figure could have been created in a few minutes and was miraculously (low probability) buried before a strong current destroyed it.
We can’t identify the slope-building rock below the sandstone in Fig. 6 without physically sampling it; however, we can have more confidence (not total, without a physical sample) when we see a dark, intrusive igneous rock like dolerite on top of a lighter rock (Fig. 8A).
Fig. 8
 A
A
 B
B
Figure 8B shows the location of the photo superimposed on a geological map of the area. The greenish map color to the left represents the distribution of Tasmanian Dolerite whereas the purplish area to the upper-right is the Parmeener Supergroup. The contact between them is (supposedly) covered by colluvium. It is very possible that some original geological data that contributed to the map was collected before modern GPS navigation; i.e., a contact could be exposed but mislocated or lost when the field data were used to create the contoured map available to me. This is always a problem with small exposures like Fig. 8A.
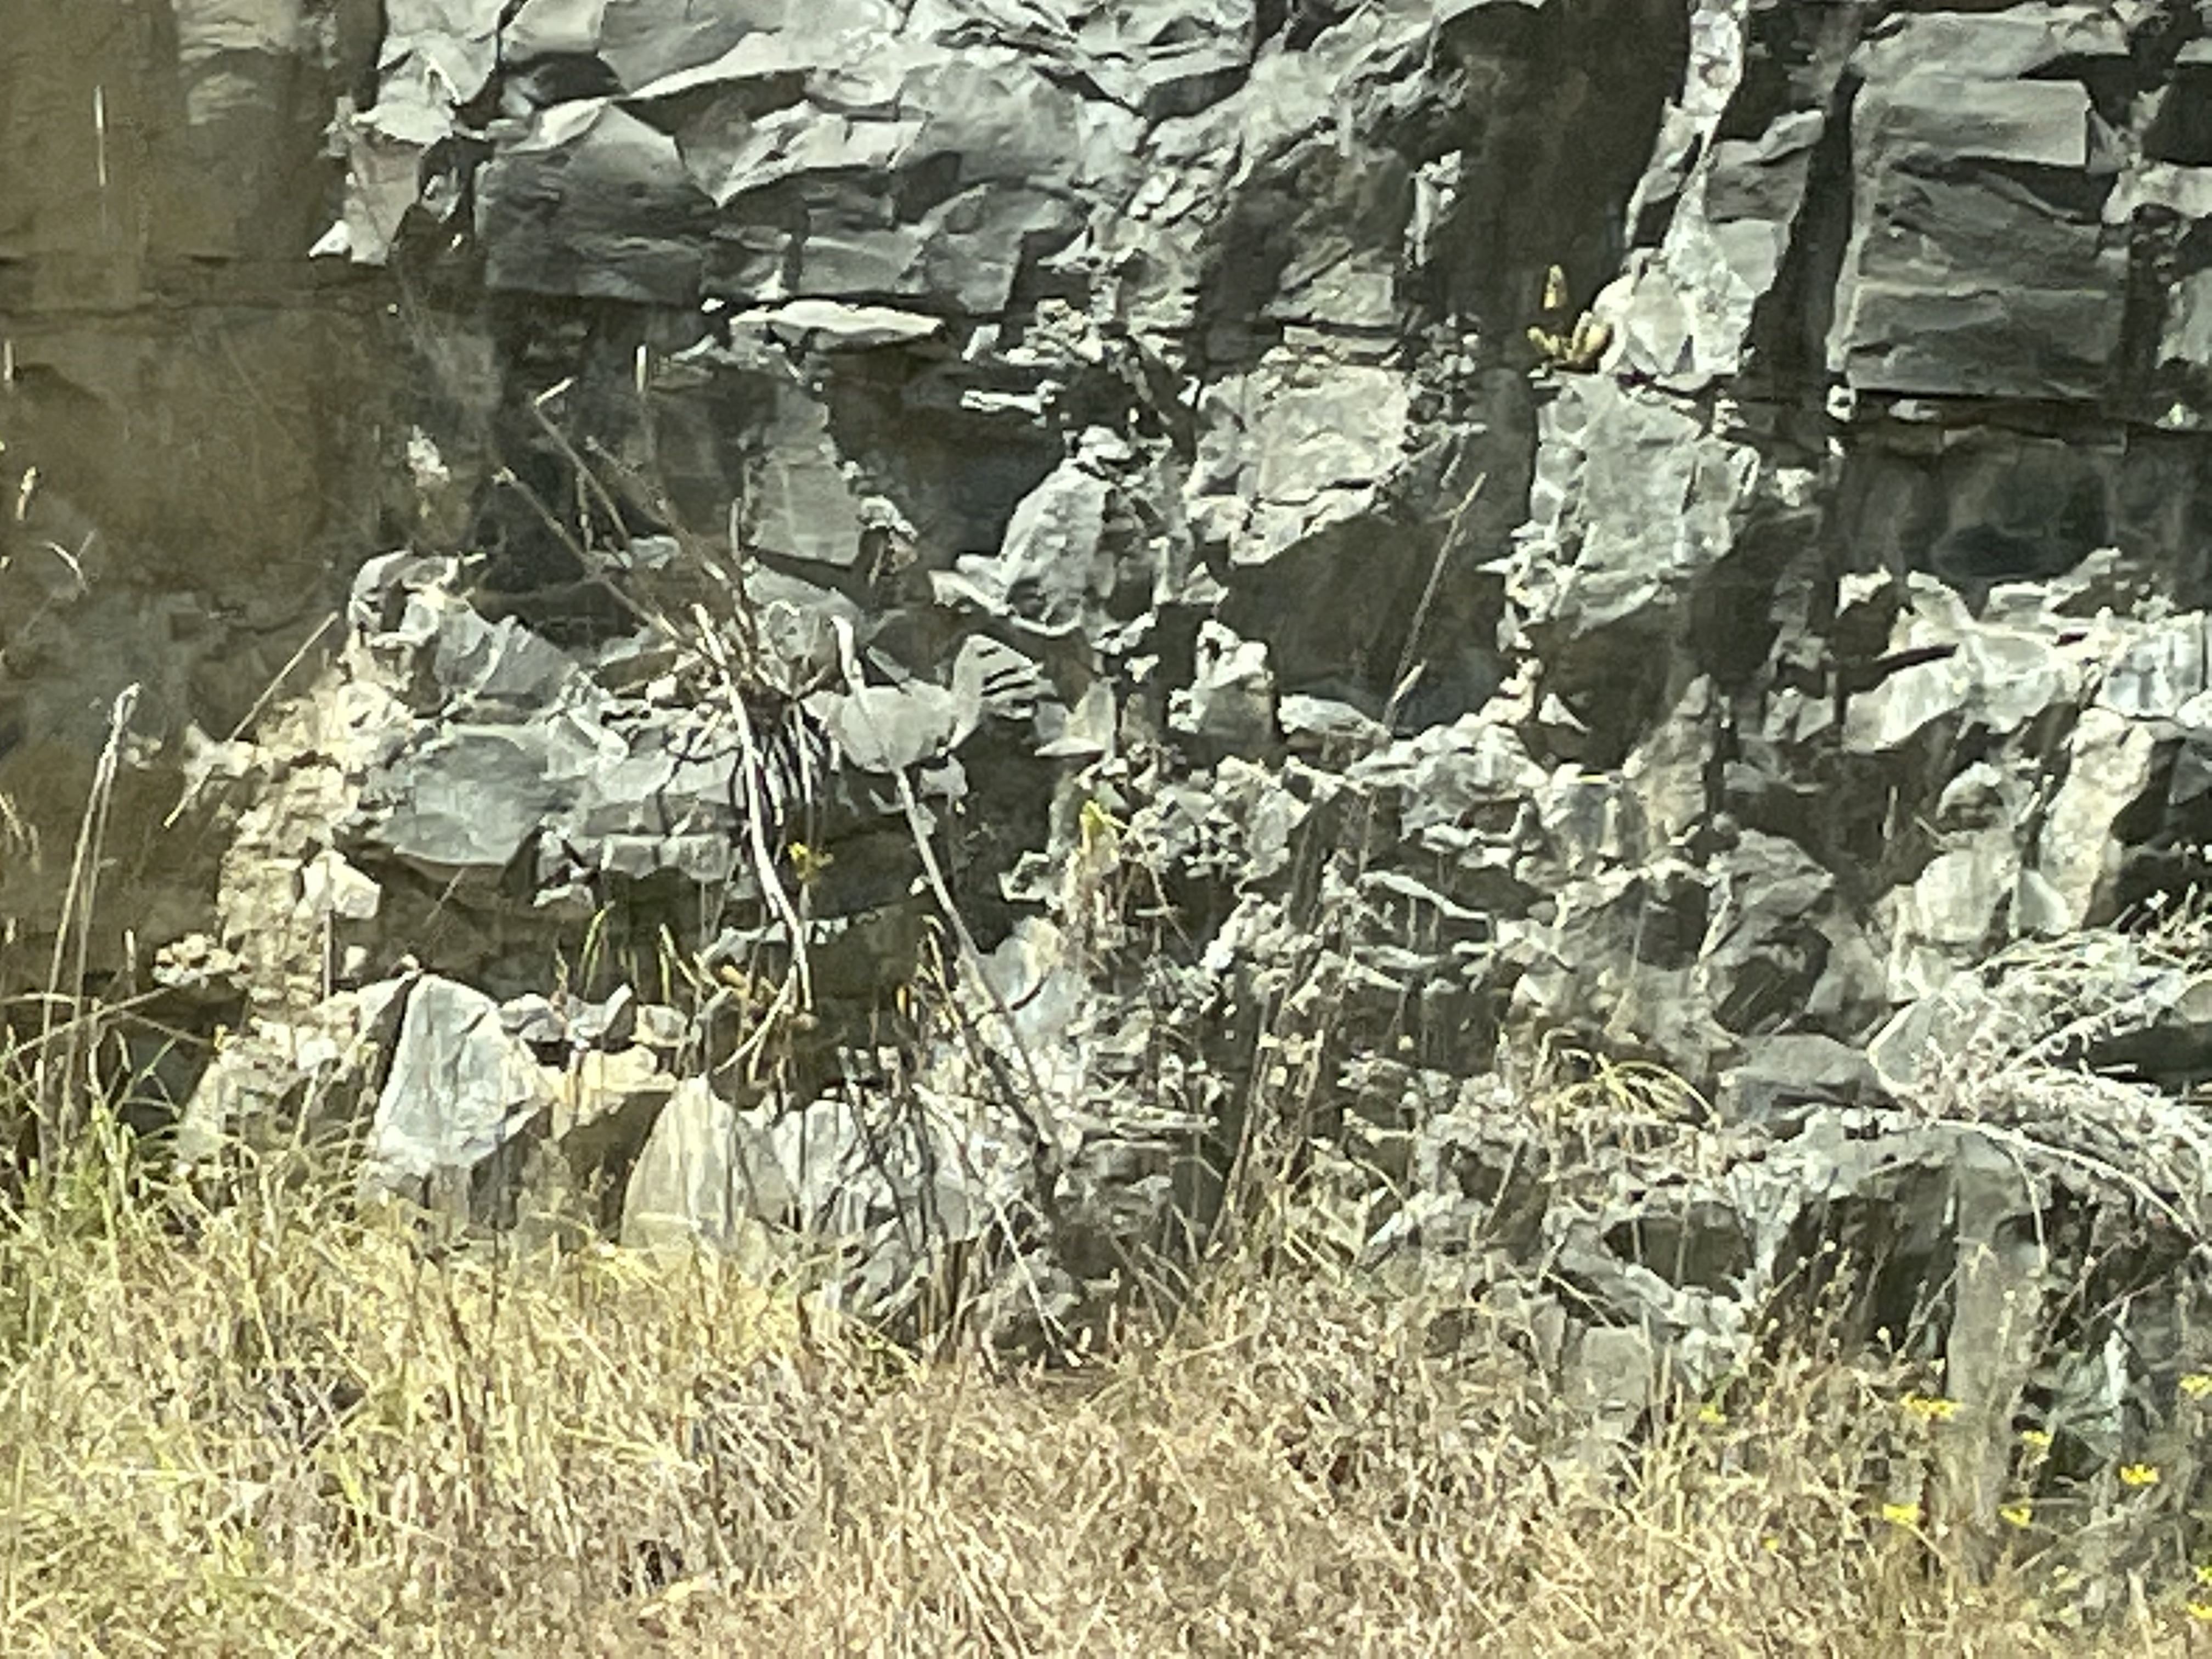 Fig. 9A
 Fig. 9B
The dolerite appears black and fractured in road cuts (Fig. 9A) with irregular weathering, but it sometimes must be reinforced as it physically weathers in place (Fig. 9B). We will see this ubiquitous rock again and again as we continue our field trip.
As we approached the coast, and Hobart, there were more road cuts that exposed poorly consolidated clastic sediments laying unconformably over the dolerite (Fig. 10).
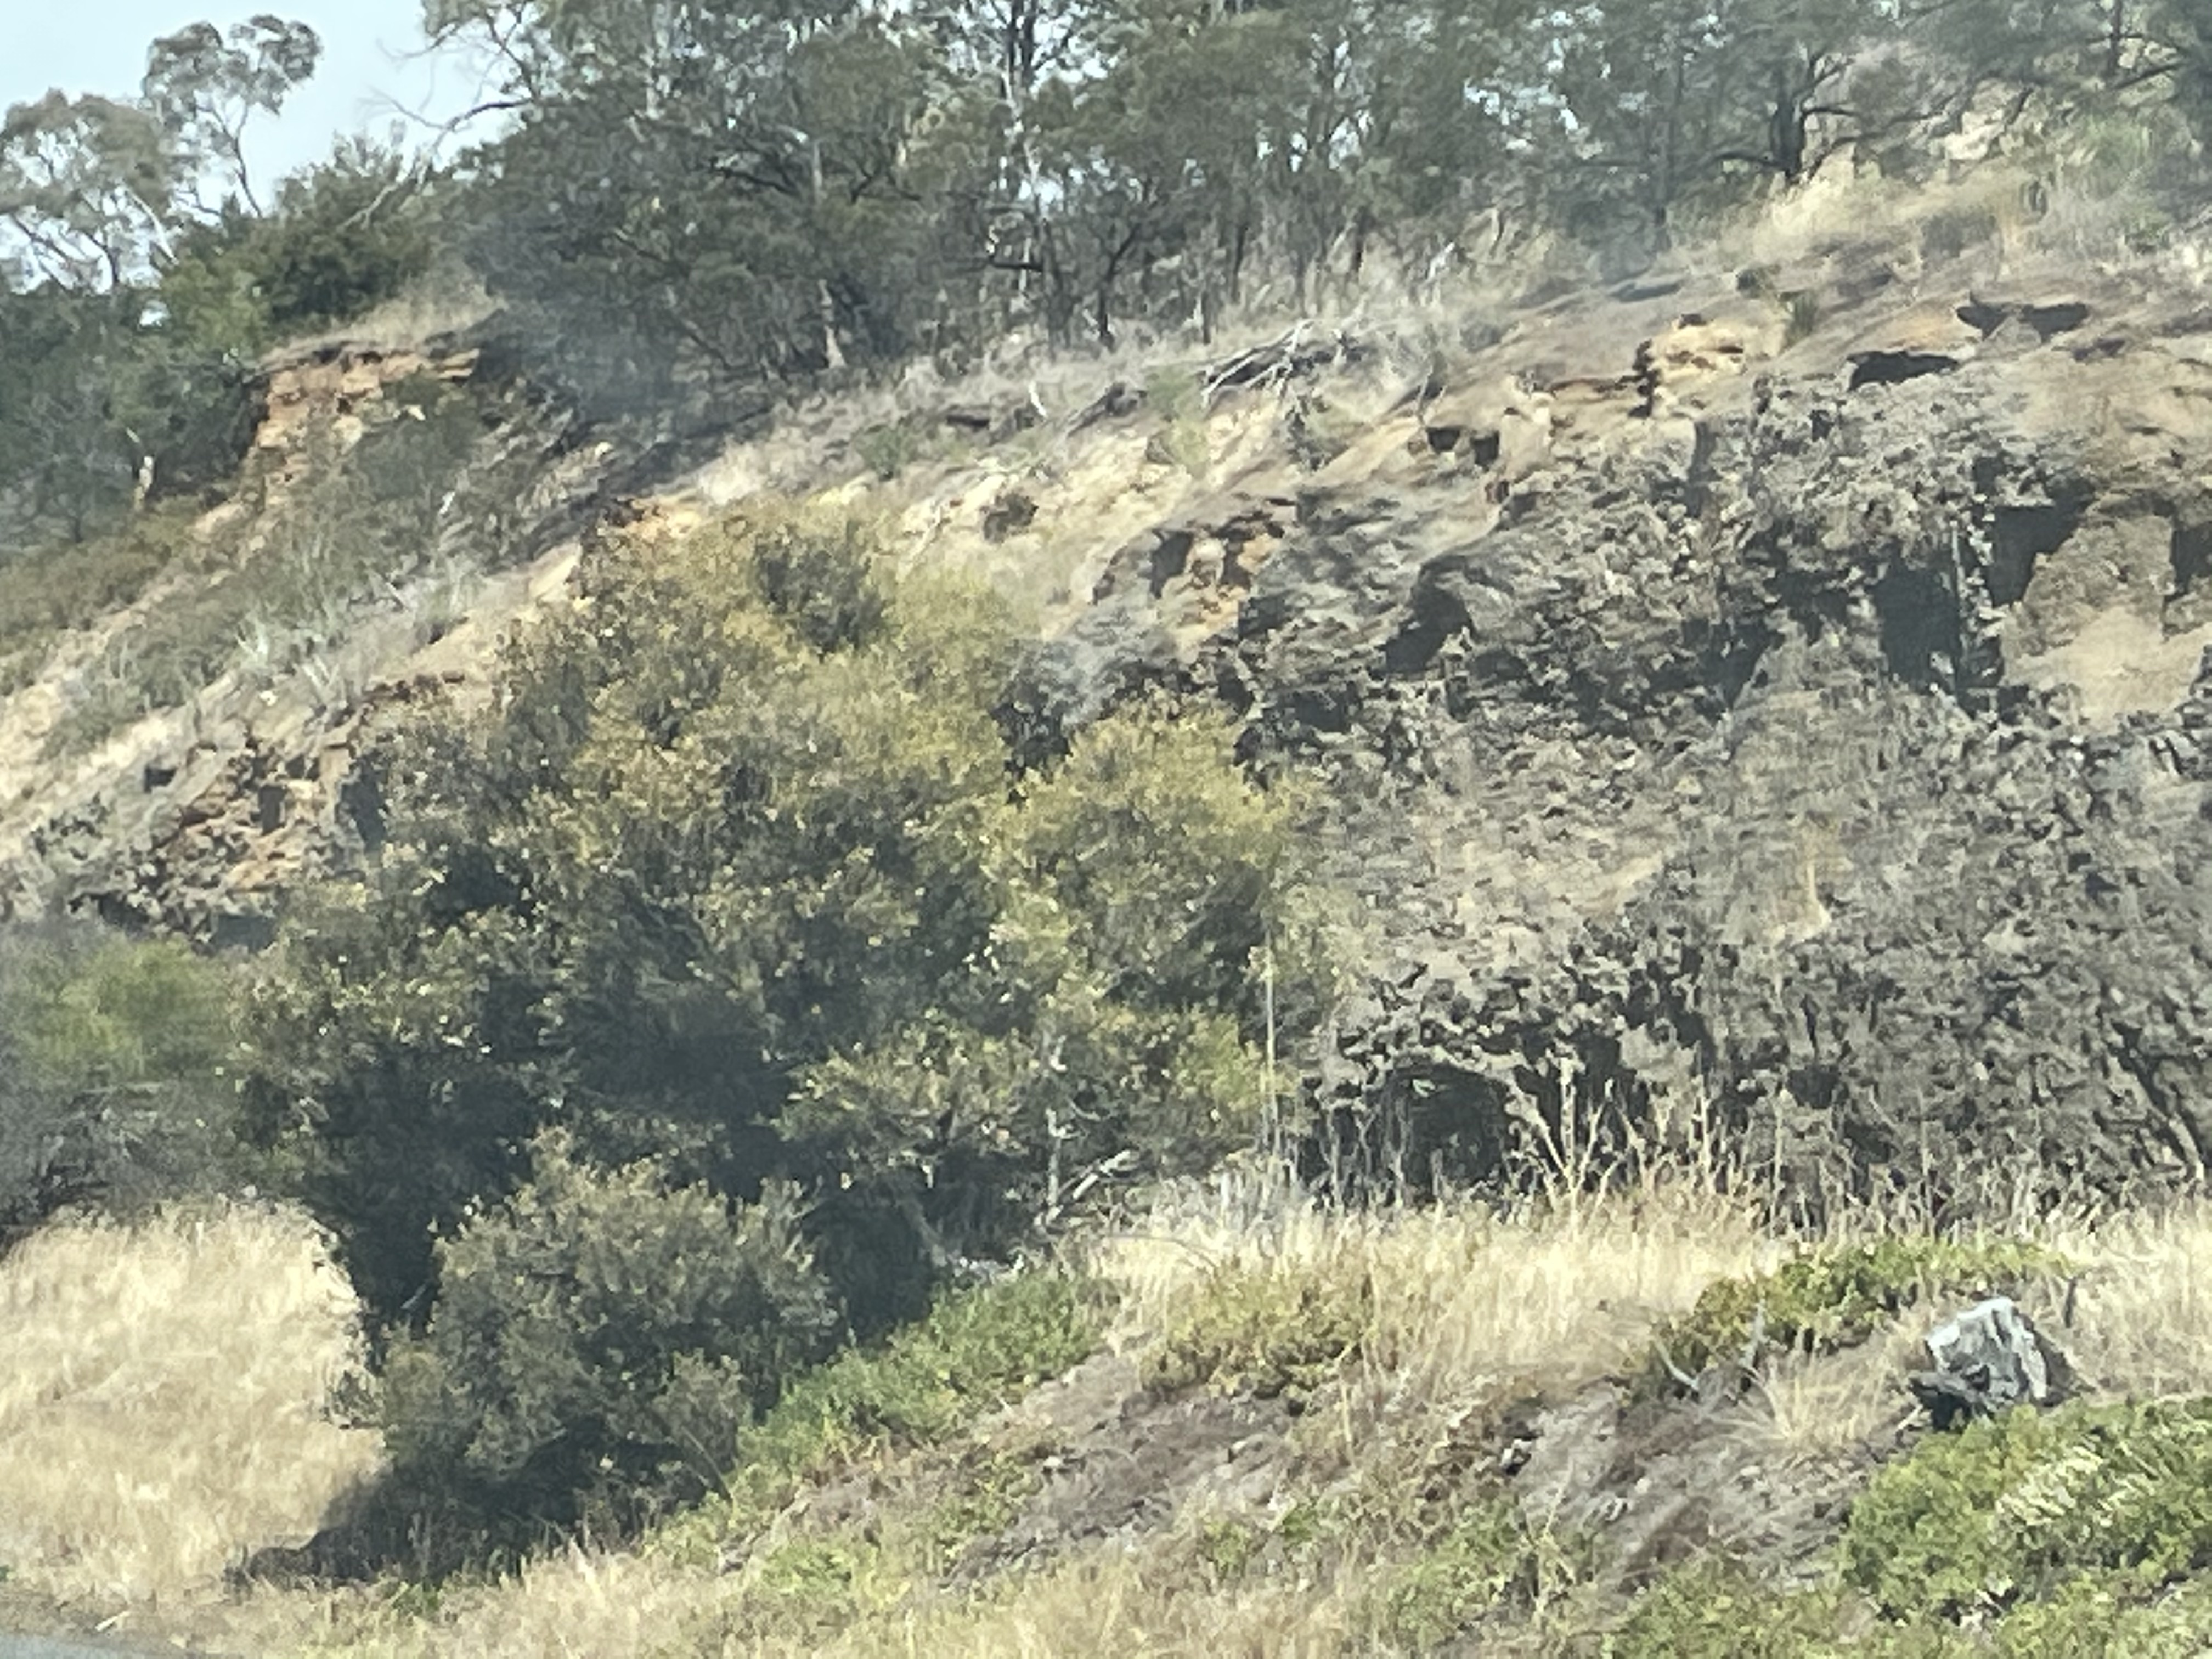 Fig. 10
This light-colored sediment is Quaternary (< 2.5 MY), eroded from all of the older rocks as the surface of Tasmania continued rising in isostatic uplift after deep burial of the rocks (and subsequent erosion of overburden), as well as the recent removal of ice. From exposures elsewhere, there is a soil profile of ~2 feet at the exposed ground surface of the dolerite, which consists of clays, sand, and boulders that haven’t broken down.
I’ll leave you with a photo of a mountain that remains stubbornly upright, reminding us that erosion is slow in Tasmania and 300 MY old rocks are relatively young…
Queenstown to the Continental Divide: Proterozoic Sedimentary Rocks
The second day of our field excursion covered quite a bit of the geological history of Tasmania, so we’re going to continue discussing this very long day (from Cradle Mountain to Hobart) in this post. To summarize, we saw exposures of Proterozoic (1600-540 MY) and Cambrian (509-485 MY) sedimentary and volcanic rocks between the coast and Cradle Mountain (see Fig. 1 for final location). These were metamorphosed and indicative of hydrothermal activity in the region, as discussed in a previous post.
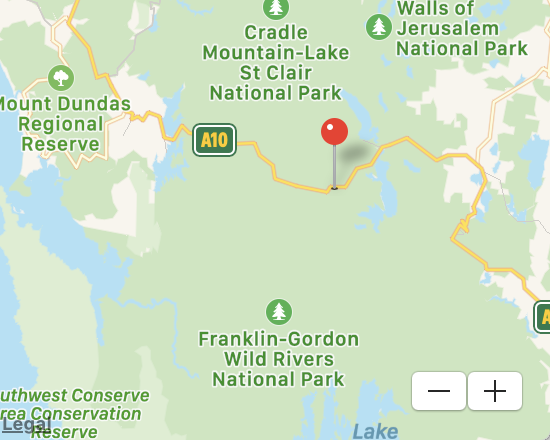 Fig. 1
The last post discussed remineralization and granitic intrusion into these rocks, especially Paleozoic rocks, culminating in the extensive mining activity centered on Queenstown, the “top of the world” so to speak, because these are some of the highest elevations in Tasmania.
Today’s post is going to take us from Queenstown to Tasmania’s official continental divide. Most of the included photos were taken about 30 miles east of Queenstown, where the pin in Fig. 1 is located. We will be examining rocks primarily from the Tyennan Group, but not as strongly deformed and metamorphosed. We are moving east of the Paleozoic trough where most ore bodies were emplaced. The sediments consist of fine-grained (pelitic) schist and quartzite (sand-sized particles), and some conglomerate deposited between 1600 and 541 MY ago.
The road cuts exposed rocks that are tilted but relatively undeformed (Fig. 2), such as this sequence of fine-grained sediments, with thin sandstone layers interbedded.
 Fig. 2
Examined up close, the sandy layers have lost their original bedding but have not developed the strong visible layering (foliation) commonly associated with what are called schists (Fig. 3).

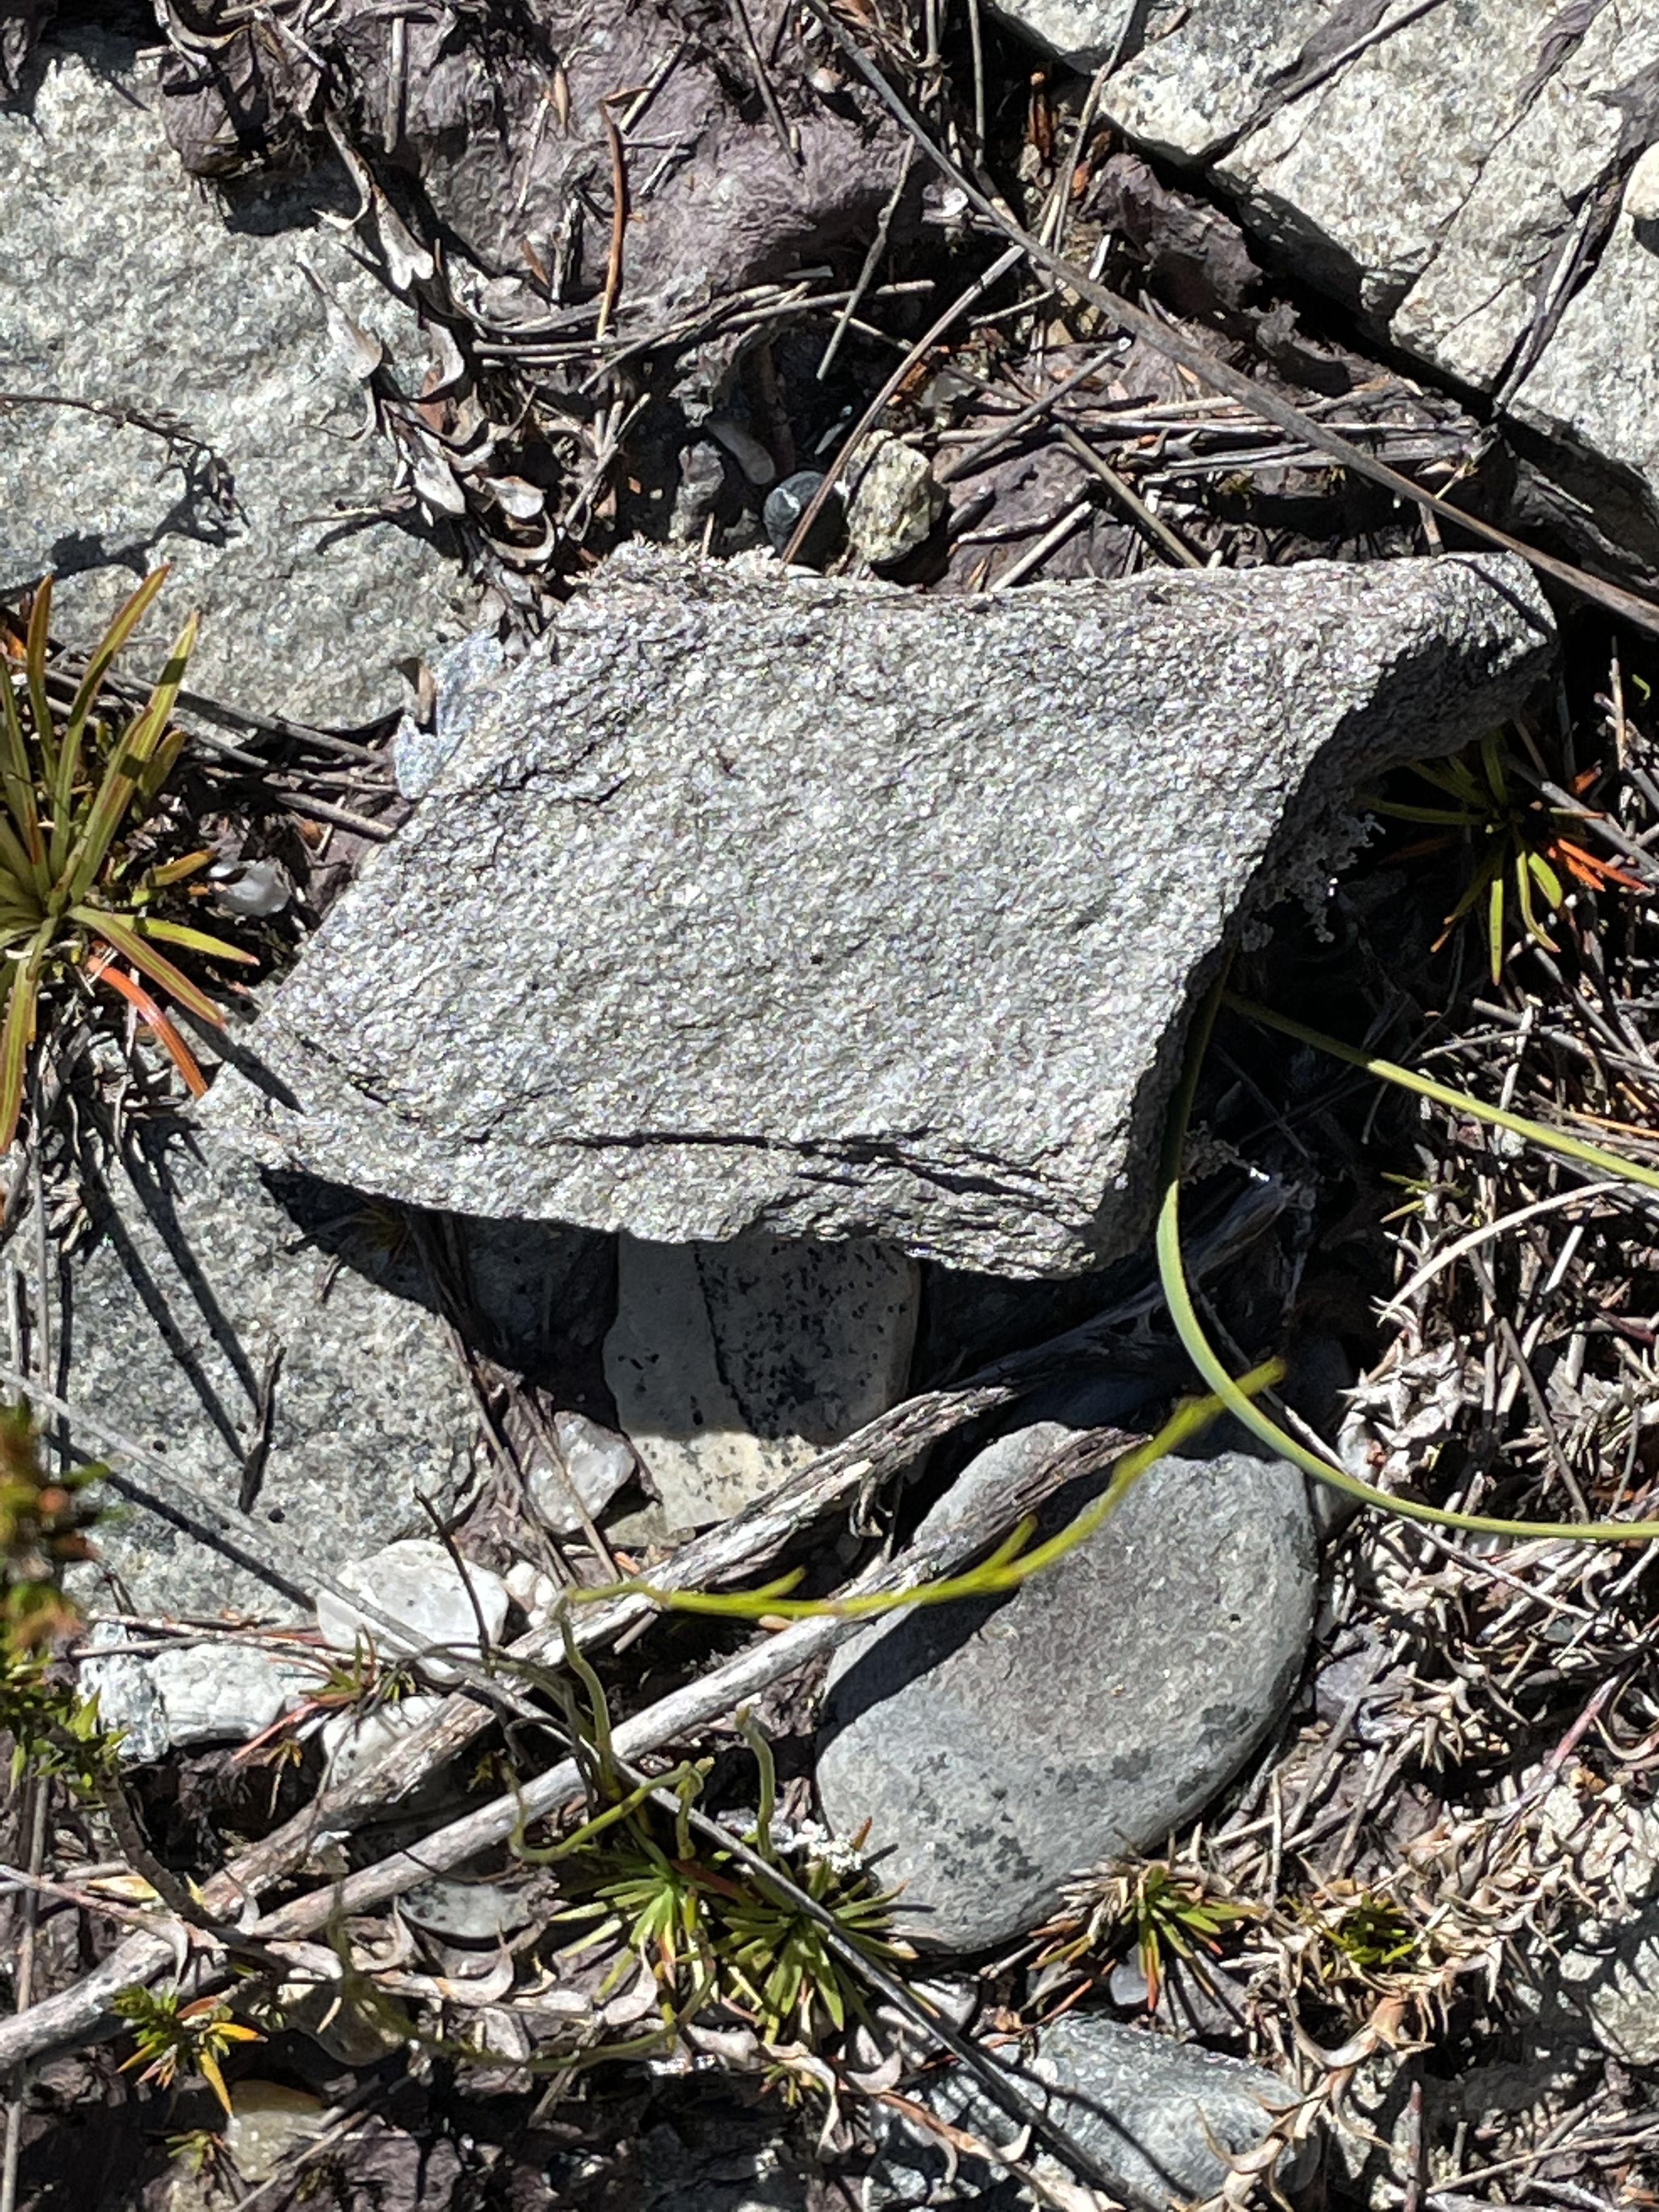 Fig. 3
These sediments varied substantially, as seen in Fig. 4, which shows more sandy layers and a reduced volume of fine-grained sediments.
 Fig. 4
The area in Fig. 1 contains many faults associated with volcanism and intrusion during the late Proterozoic and early Paleozoic (~1600-500 MY). In some places the rock layers of this area are vertical (Fig. 5).
Fig. 5
 A
A 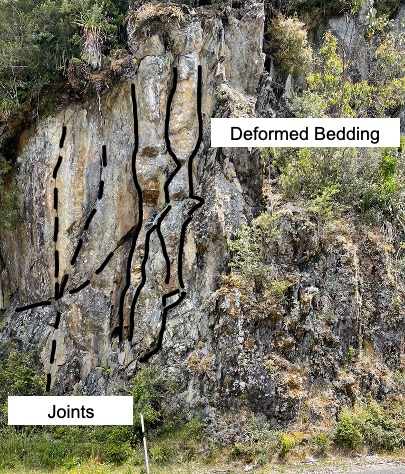 B
B
Figure 5B has been annotated to better show some features of deformation without strong remineralization. The irregular lines showing deformed bedding are more-or-less original variations in particle size and/composition (i.e., sedimentary layering) that has been squeezed and had the grain size of crystals increase in response to heat and pressure. The joint pattern has nothing to do with this but came later, as the rocks cracked from cooling and reduced pressure (similar to mud cracks).
A closer look reveals how far this process can go without leading to remineralization and the replacement of original minerals by new ones (e.g., pyritization or chloritization) as new elements are introduced by hydrothermal circulation.
 Fig. 6
The lighter areas in Fig. 6 are probably quartz recrystallized from sand grains whereas the darker zones are very likely quartz and muscovite that result when water is removed from clays. The heat and pressure weren’t sufficient to form new mineral crystals with larger size, however, so the mixed mud-sand assemblage remains identifiable.
These rocks were folded during compression, when some of the faults certainly occurred. We saw an outstanding example in a road cut (Fig. 7).
Fig. 7
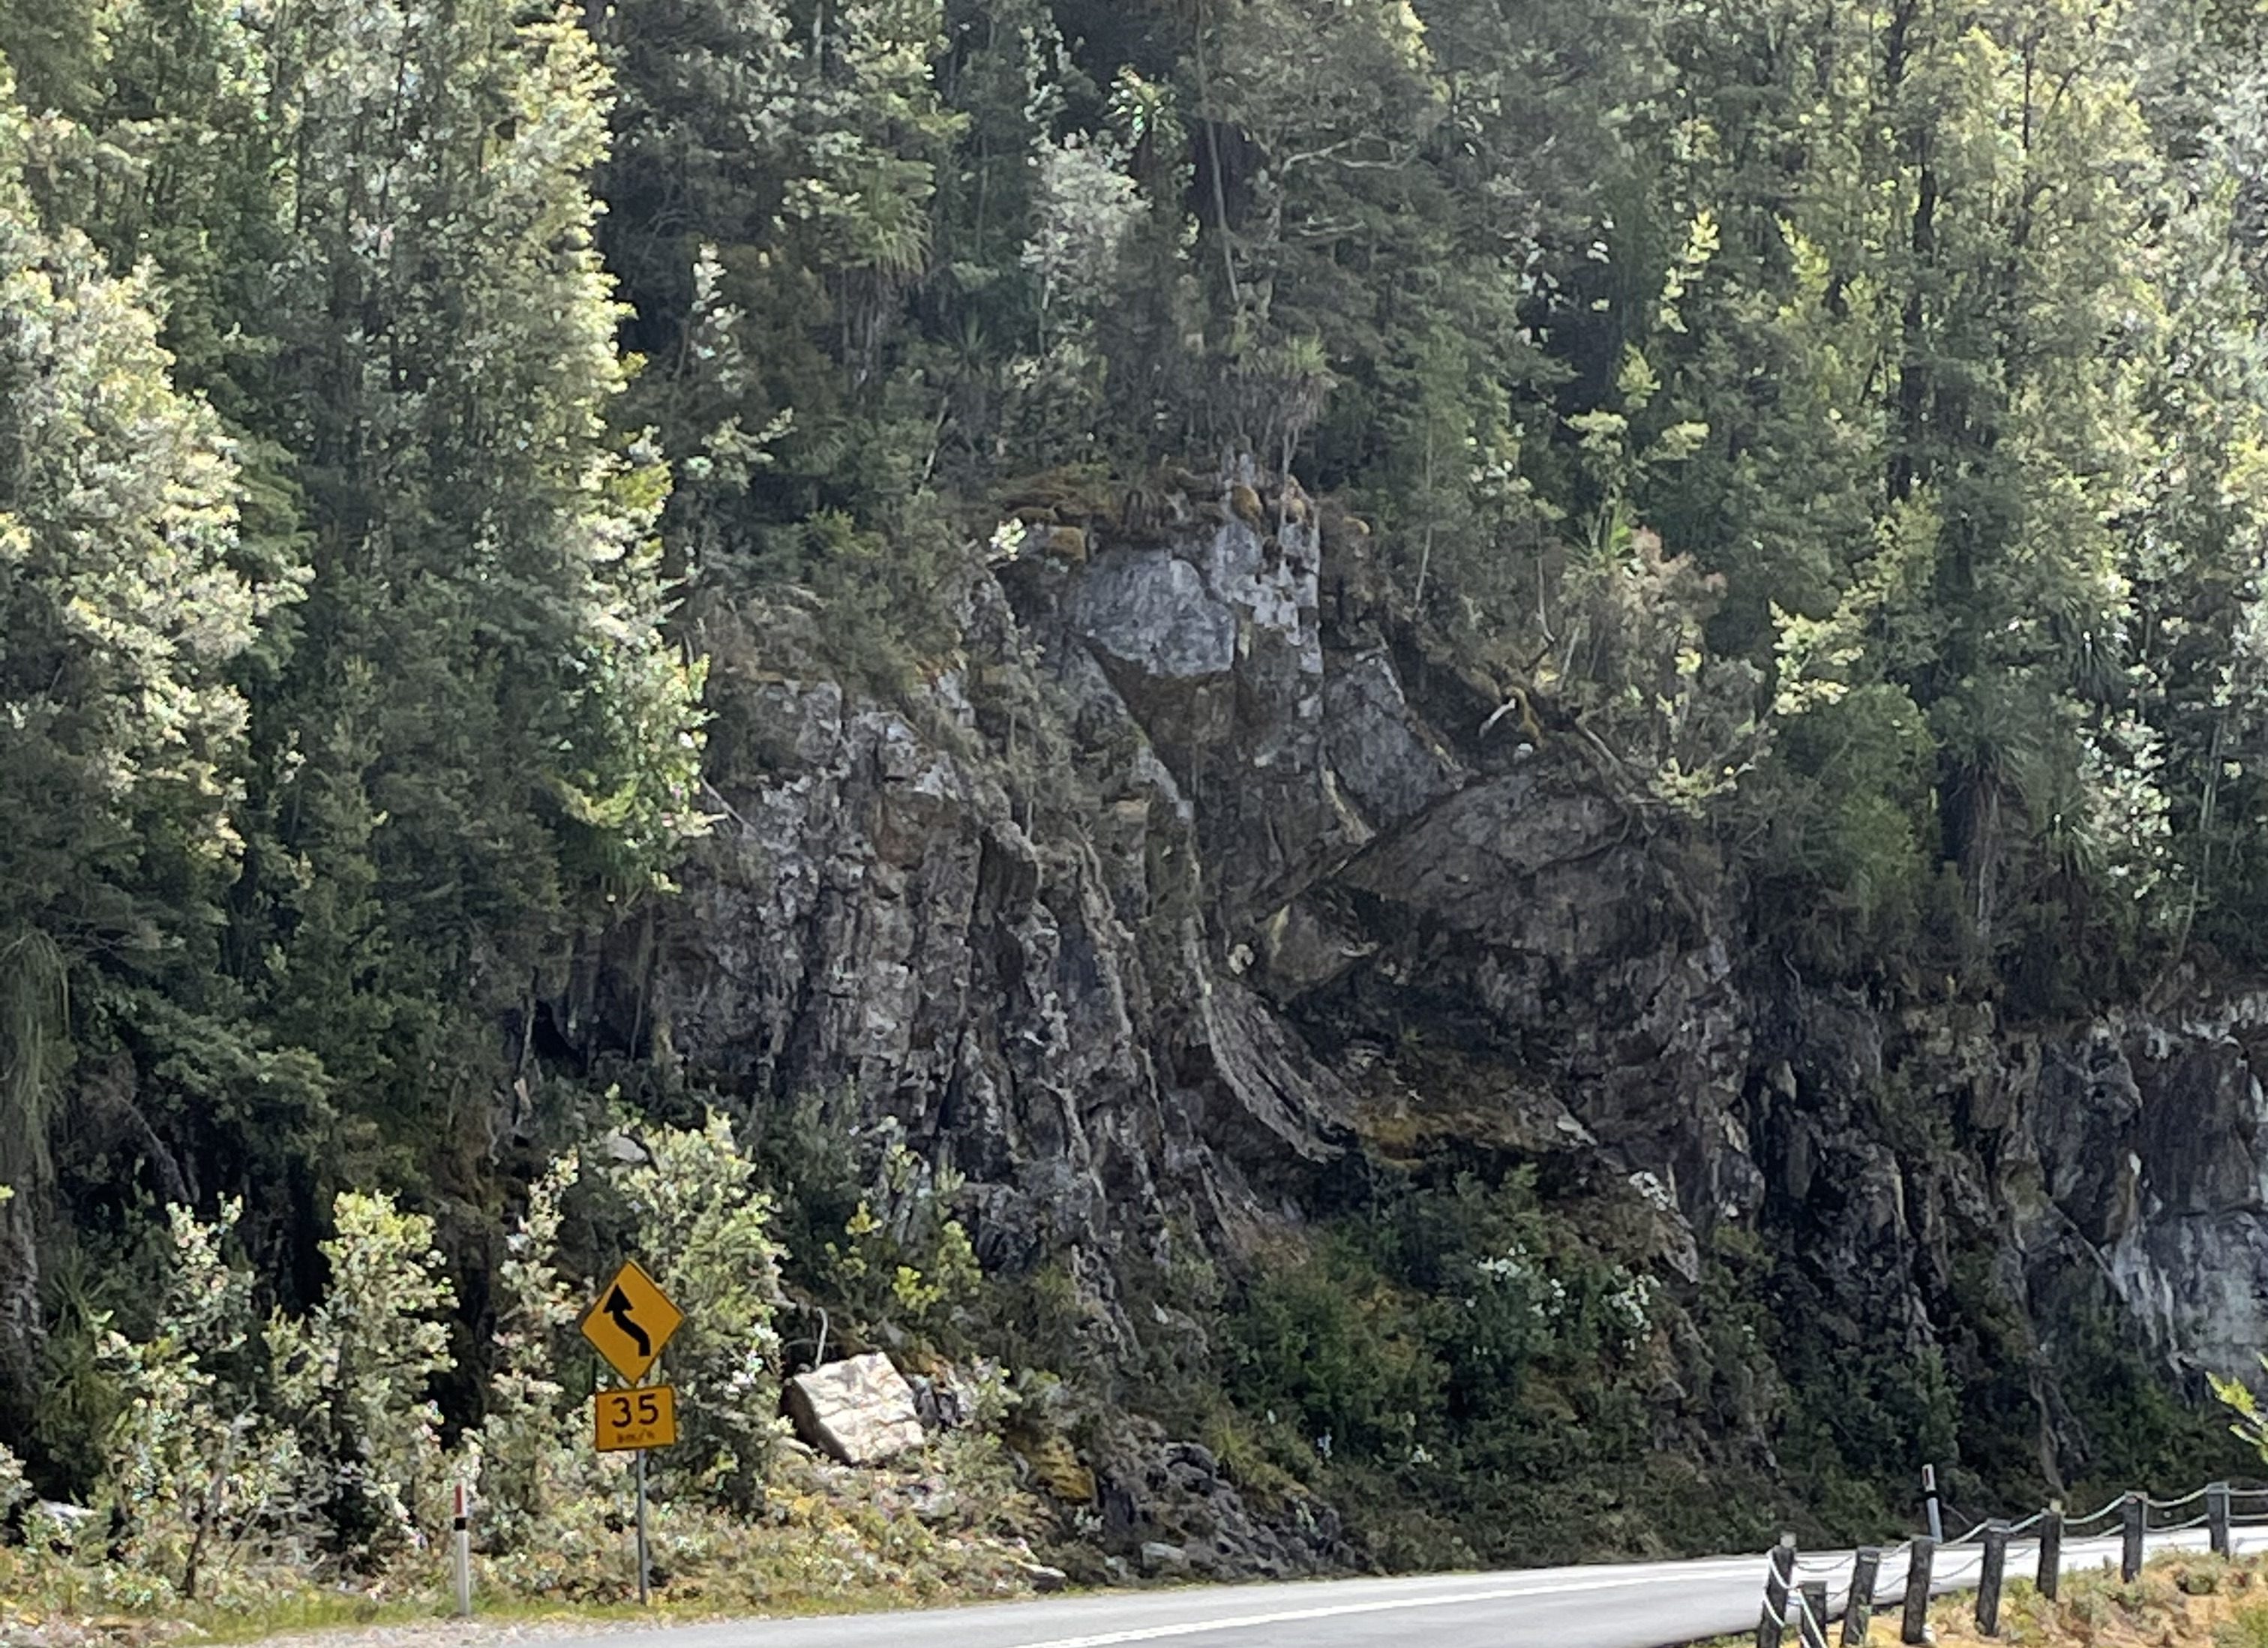 A
A 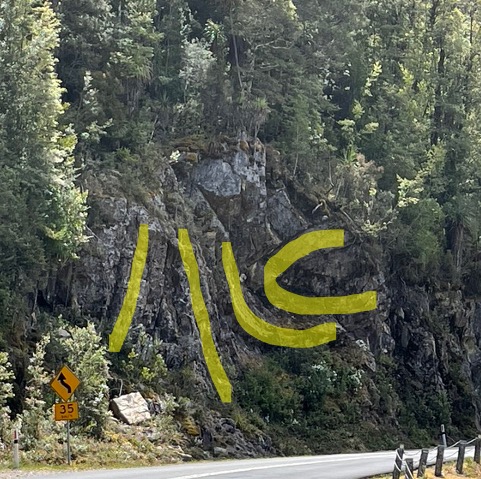 B
B
Figure 7B has original bedding highlighted. This shows a tight fold on its side (recumbent) and juxtaposed against vertical bedding. There are certainly some faults present between these layers. The rocks were brittle enough (i.e. shallow burial) to break and slide against one another. Zooming in closer on the “C” in Fig. 7C, we see that there was no remineralization in these tightly folded rocks (Fig. 8).
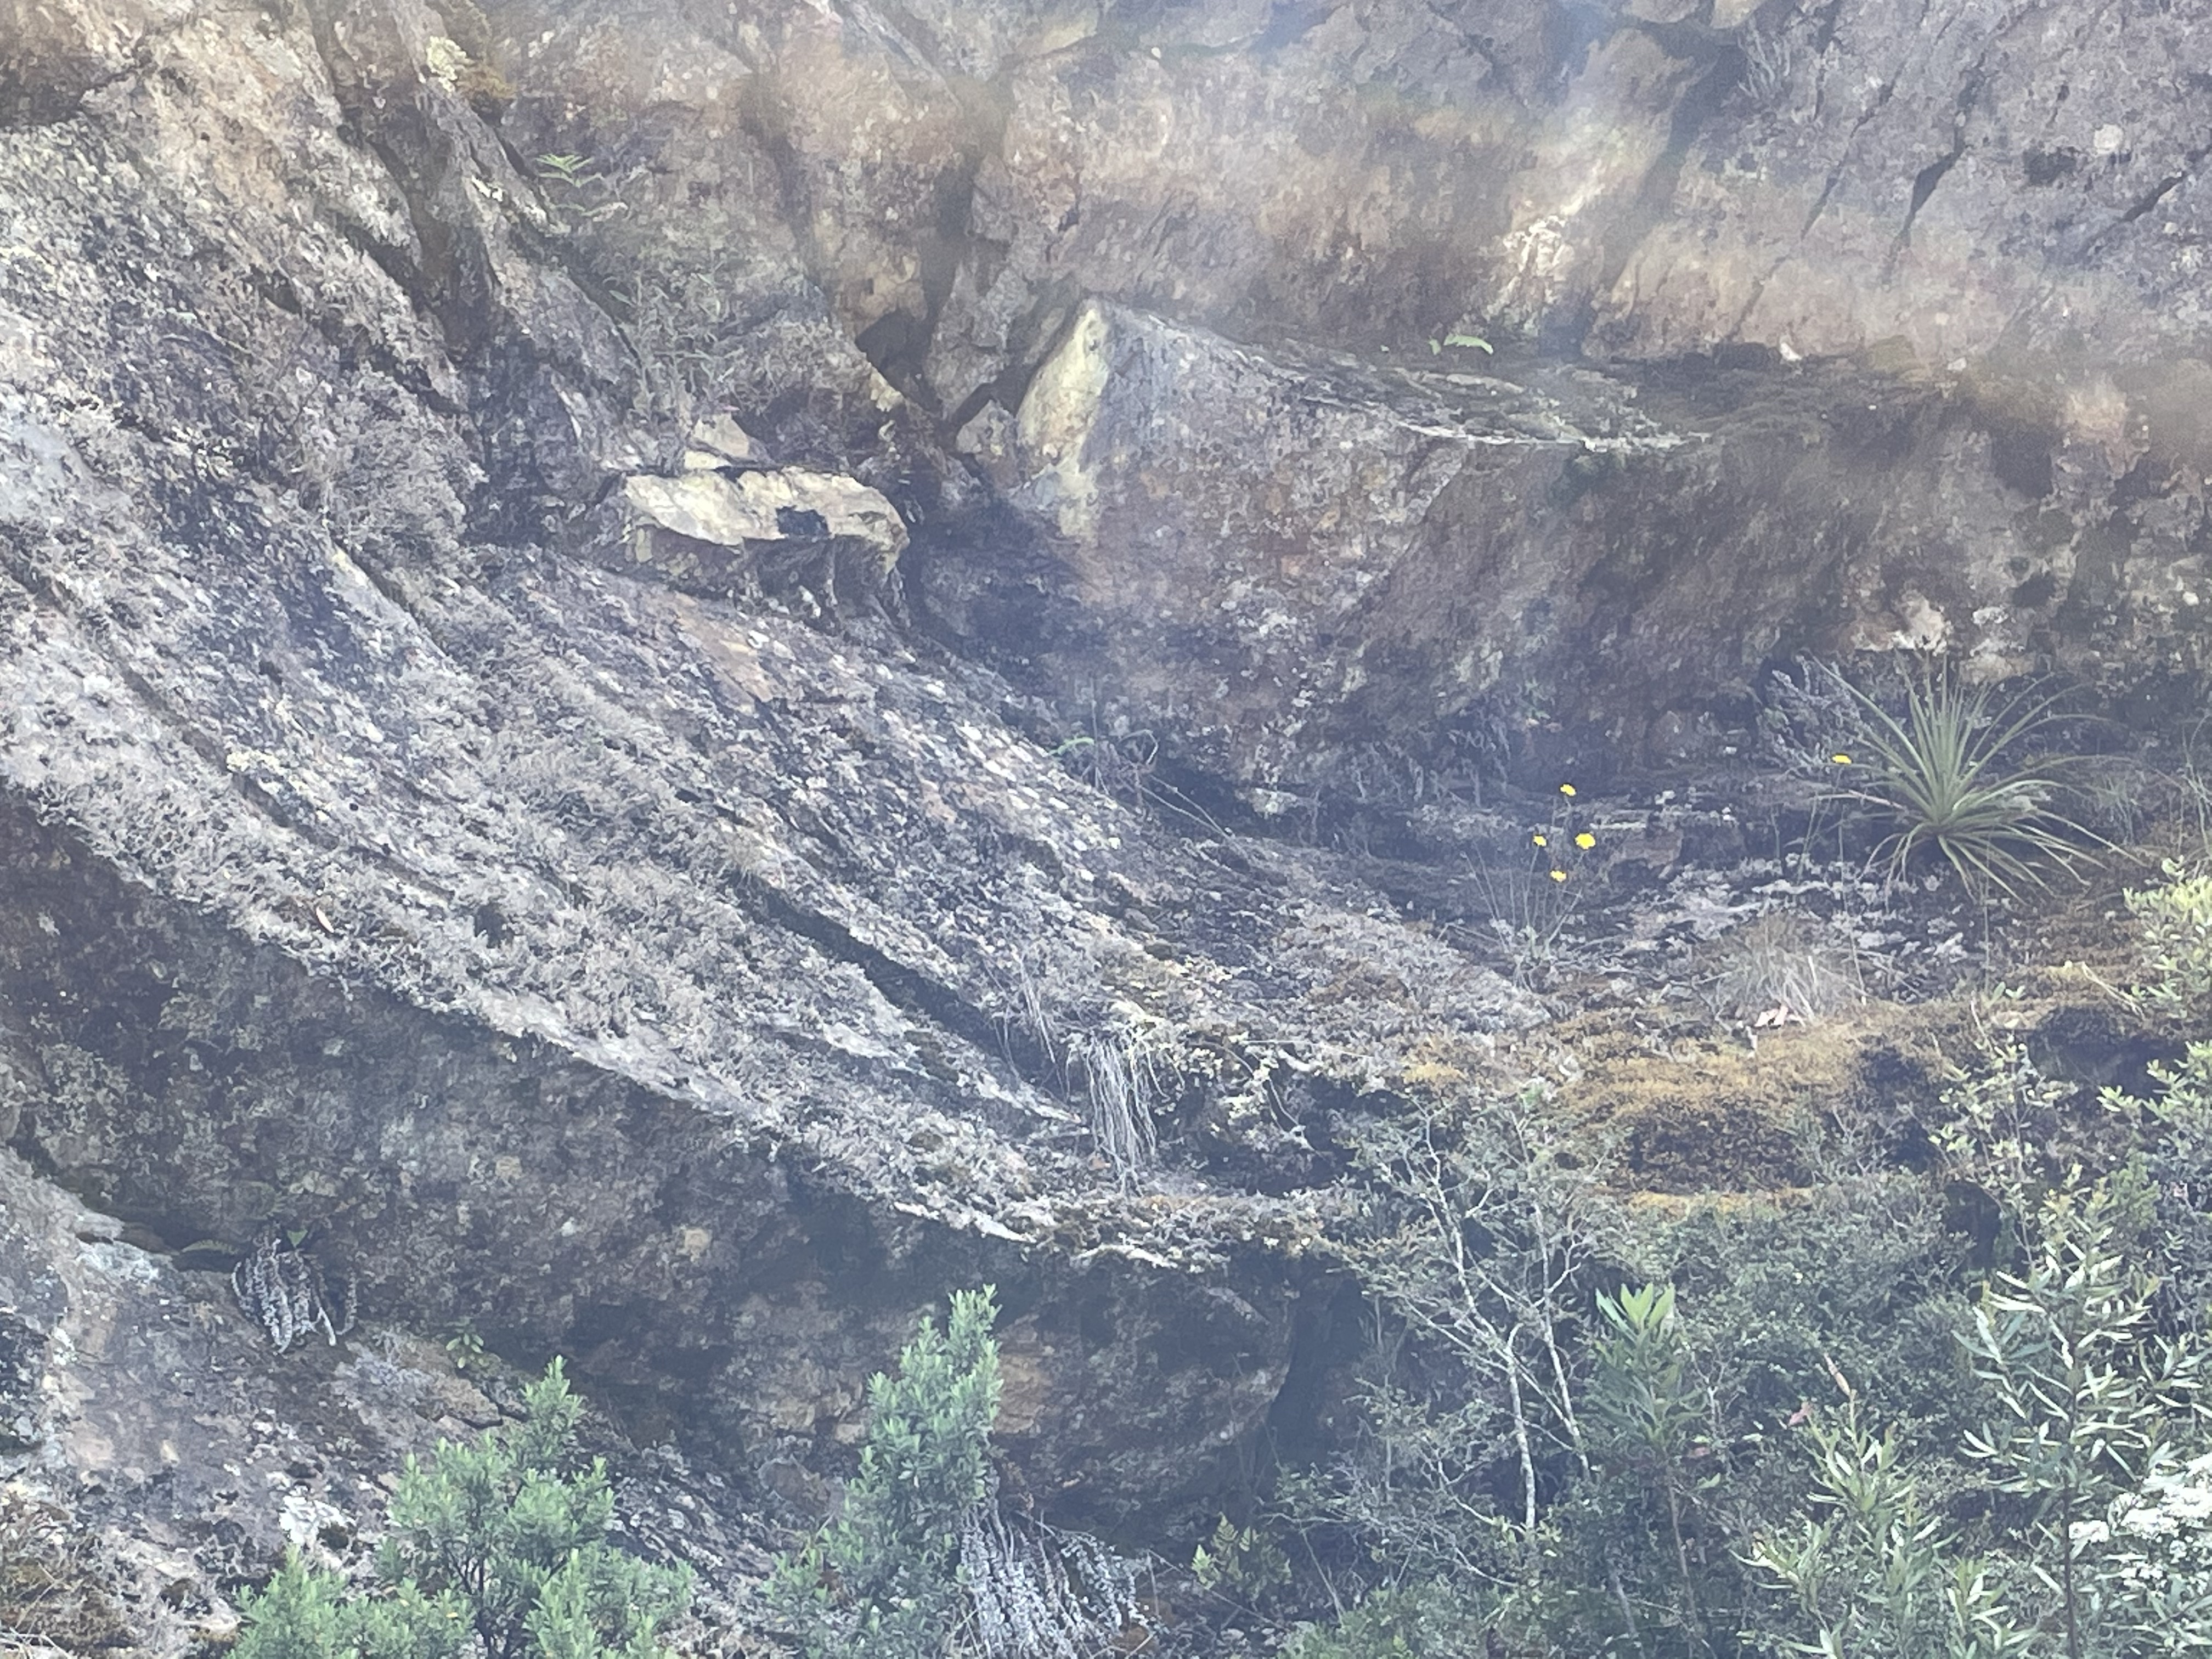 Fig. 8
But if we look at the more outward layers surrounding this structure, we see signs of substantial brittle fracture (Fig. 9) and remineralization. The former is shown by the small size of (much less than 1 foot) of individual blocks of stone (Fig. 9A) and the latter by the weathered appearance and lack of structure in some areas (Fig. 9B).
Fig. 9
 A
A  B
B
Soon after this we left the central mining district and the rocks deposited and deformed during the collision of Tasmania with Gondwana (~500-370 MY). In the case of Tasmania, the Continental Divide is between the rainy western half and the dry eastern half. Another way to look at it is that the western half was created when Gondwana was formed and the eastern half when it was pulled apart.

And finally, the King William Range, comprising peaks of fault blocks pointing to the east and a different geologic regime…
From the Cradle to the Top of the World
We headed west on C-132. The locations of photos will be indicated on a map using pins (red circle with a line extending downward).
 Fig. 1
We headed west in Cenozoic volcanics into Early Ordovician (500-470 MY) marine-to-nonmarine quartzose conglomerate-sandstone-siltstone sequences visible in low exposures along the road as seen in Fig. 2.
 Fig. 2
These rocks represent a smooth transition from nearshore to river and lake environments. Note the red color in outcrop (Fig. 3A). Note that the image is about 6 feet across.
Fig. 3
 A
A  B
B  C
C
Figure 3B shows the rock closer up, at which point irregular light-colored particles can be seen along with darker grains. The red color comes from oxidized iron in the cement. Figure 3C is as close as I can get with the iPhone camera. At this resolution, quartz and feldspar crystals can be seen. Most of them are rounded.
We drove a while across constantly changing Cenozoic volcanics and ~500 MY volcanics and volcaniclastic rocks, past several poorly visible volcanic craters that have become lakes. We eventually climbed out of the volcanic field into some felsic-to-intermediate volcanics (Fig. 4).
 Fig. 4
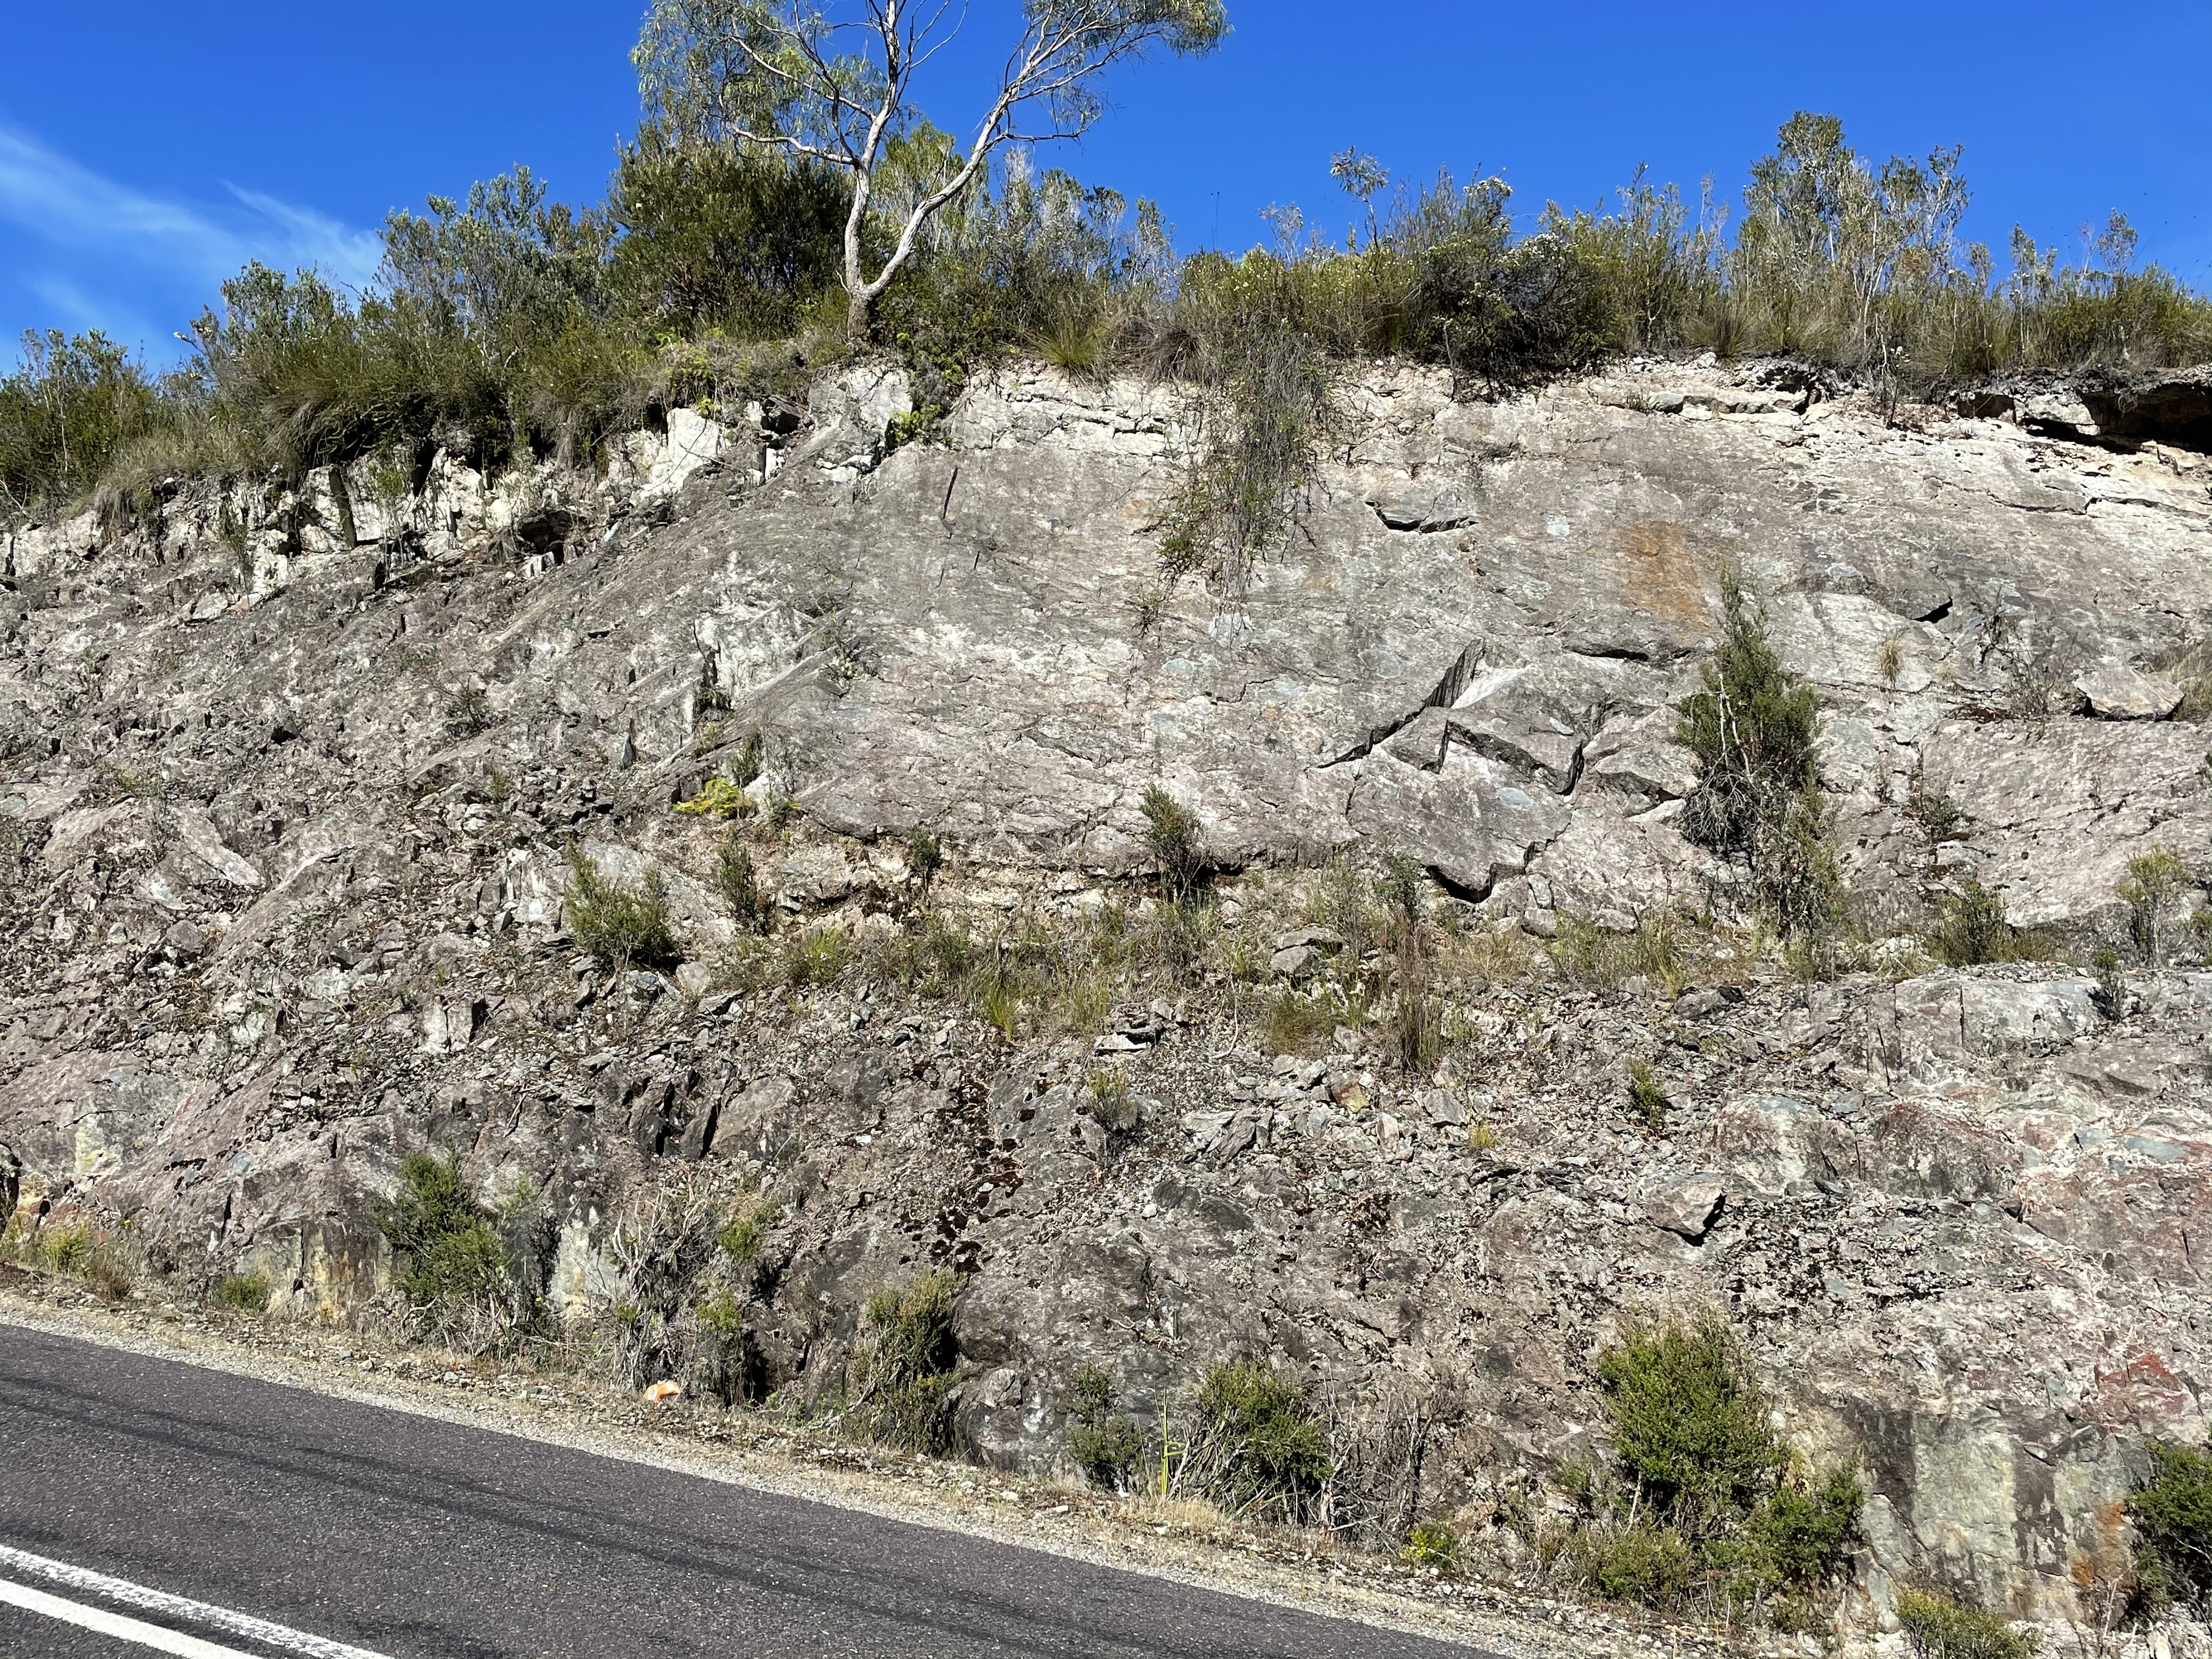
There were high ridges (Fig. 5A) supported by these rocks.
Fig. 5
 A
A 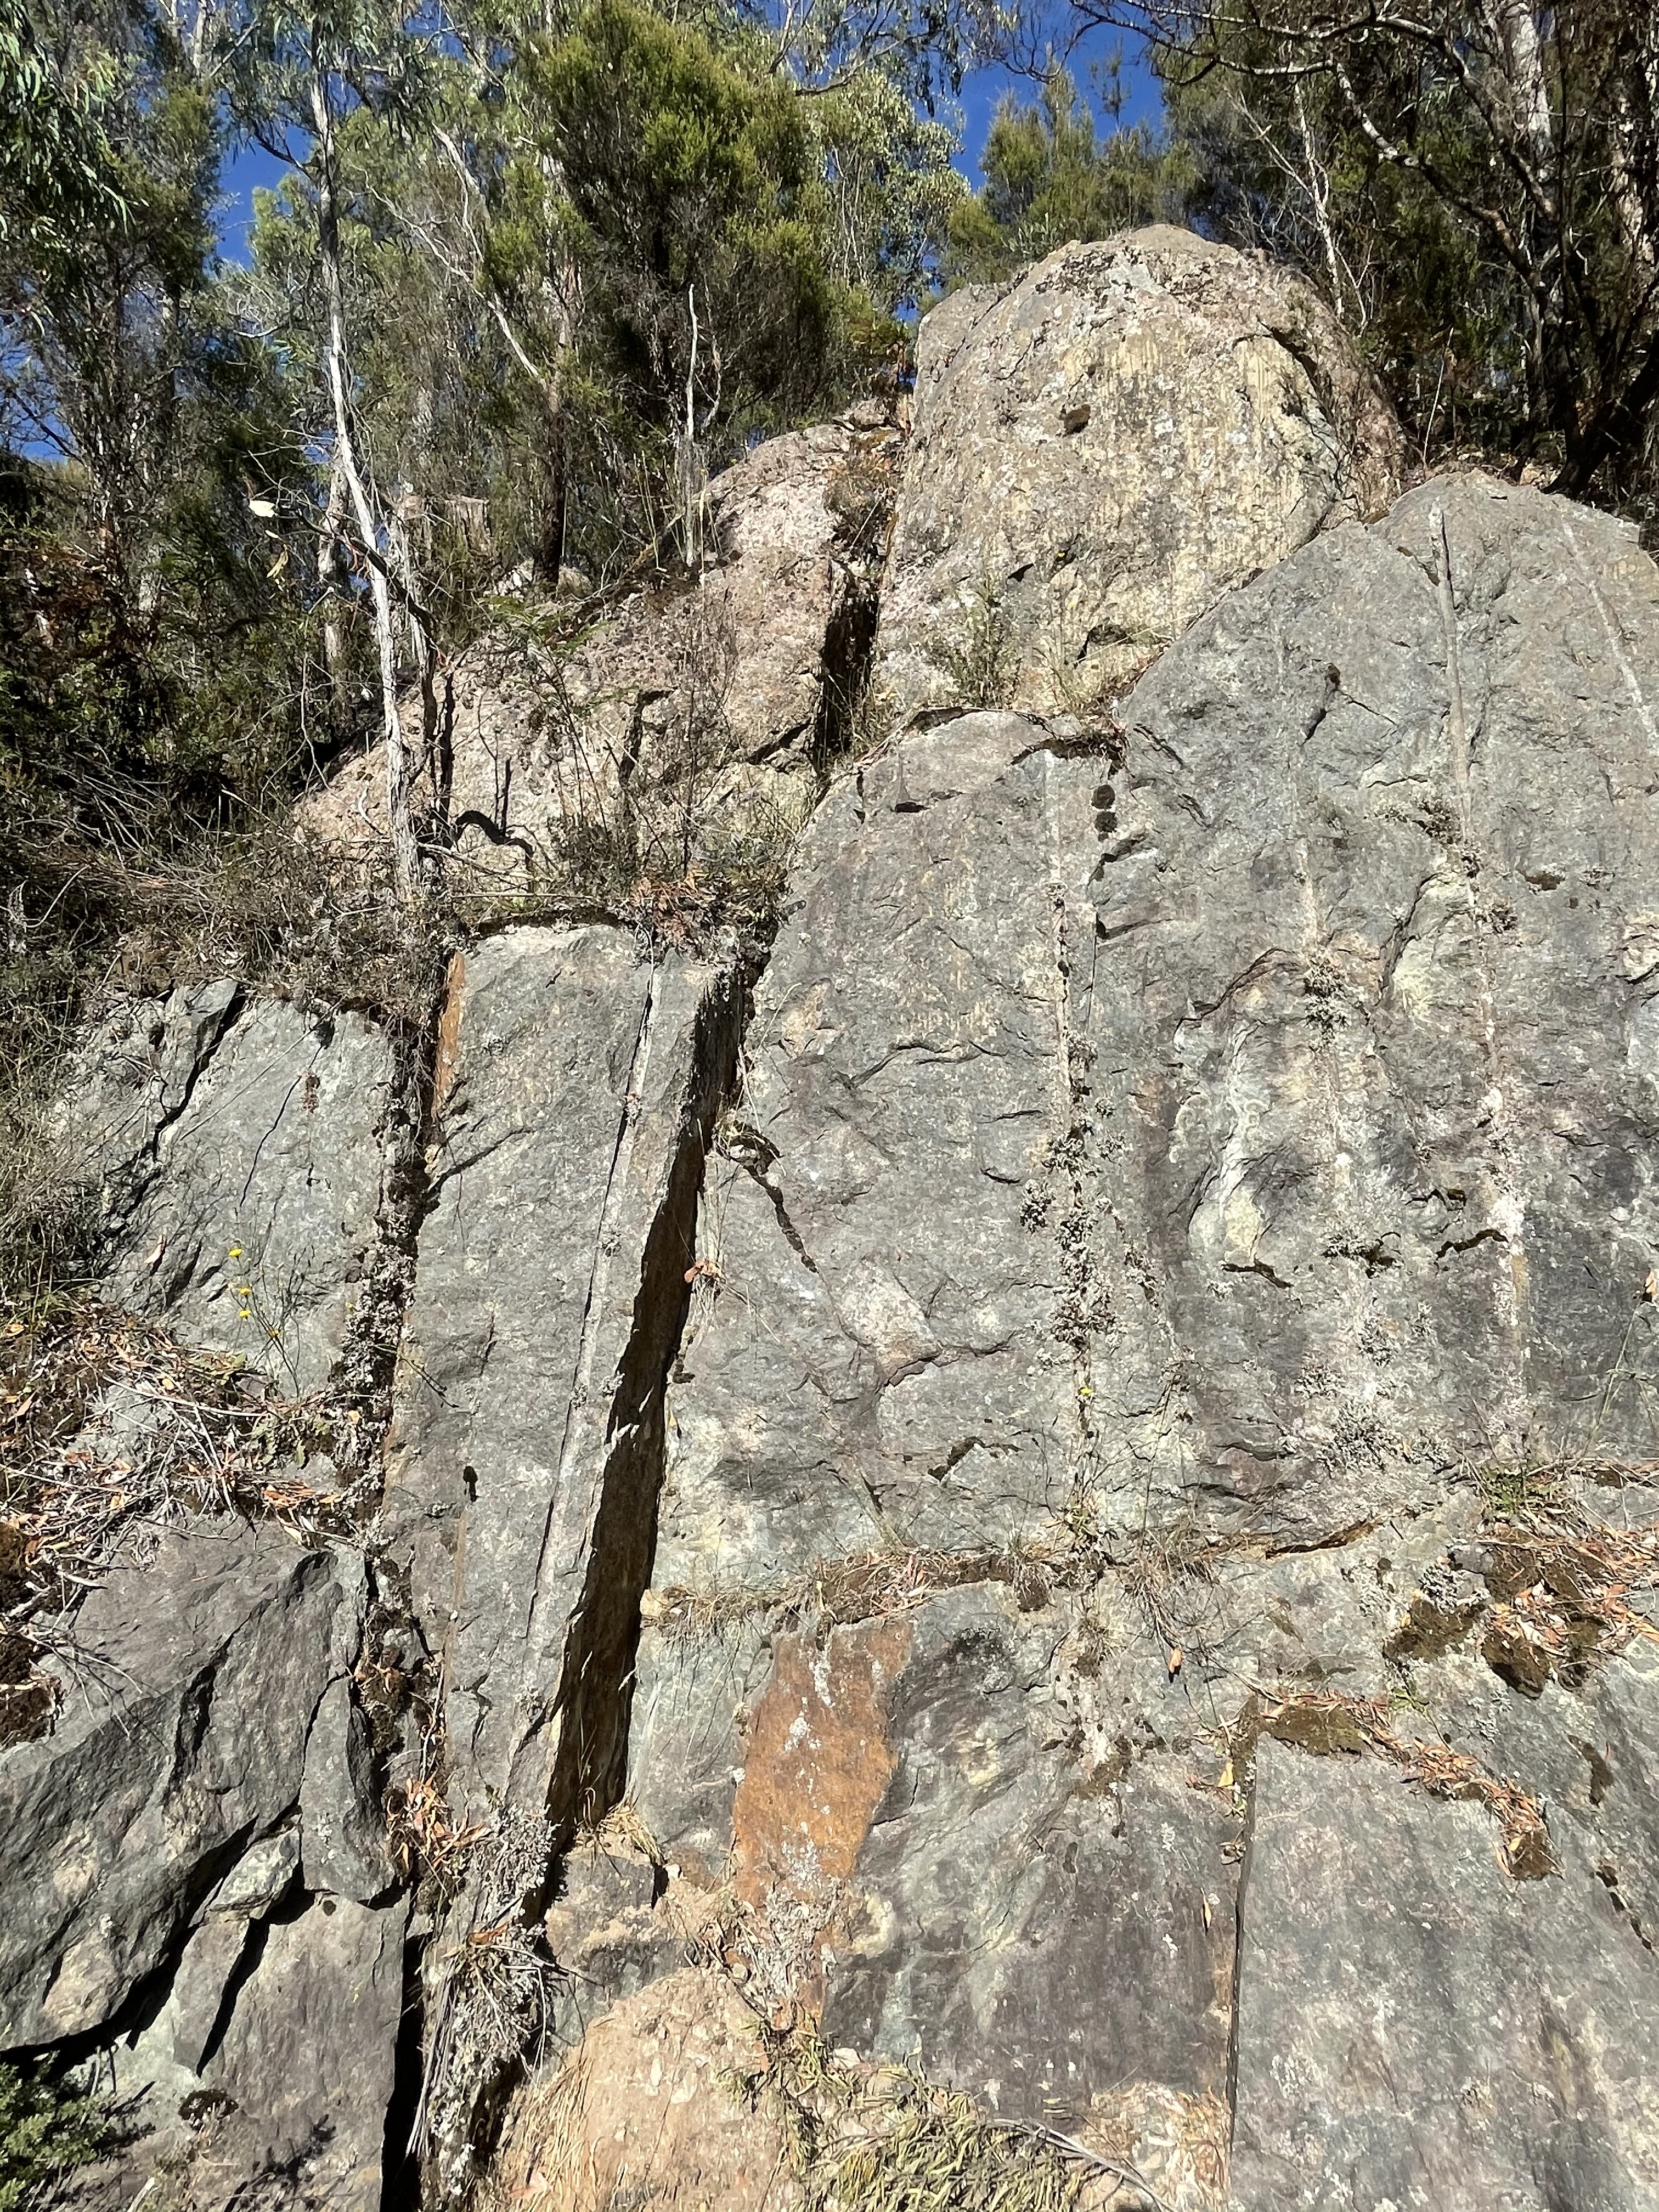 B
B 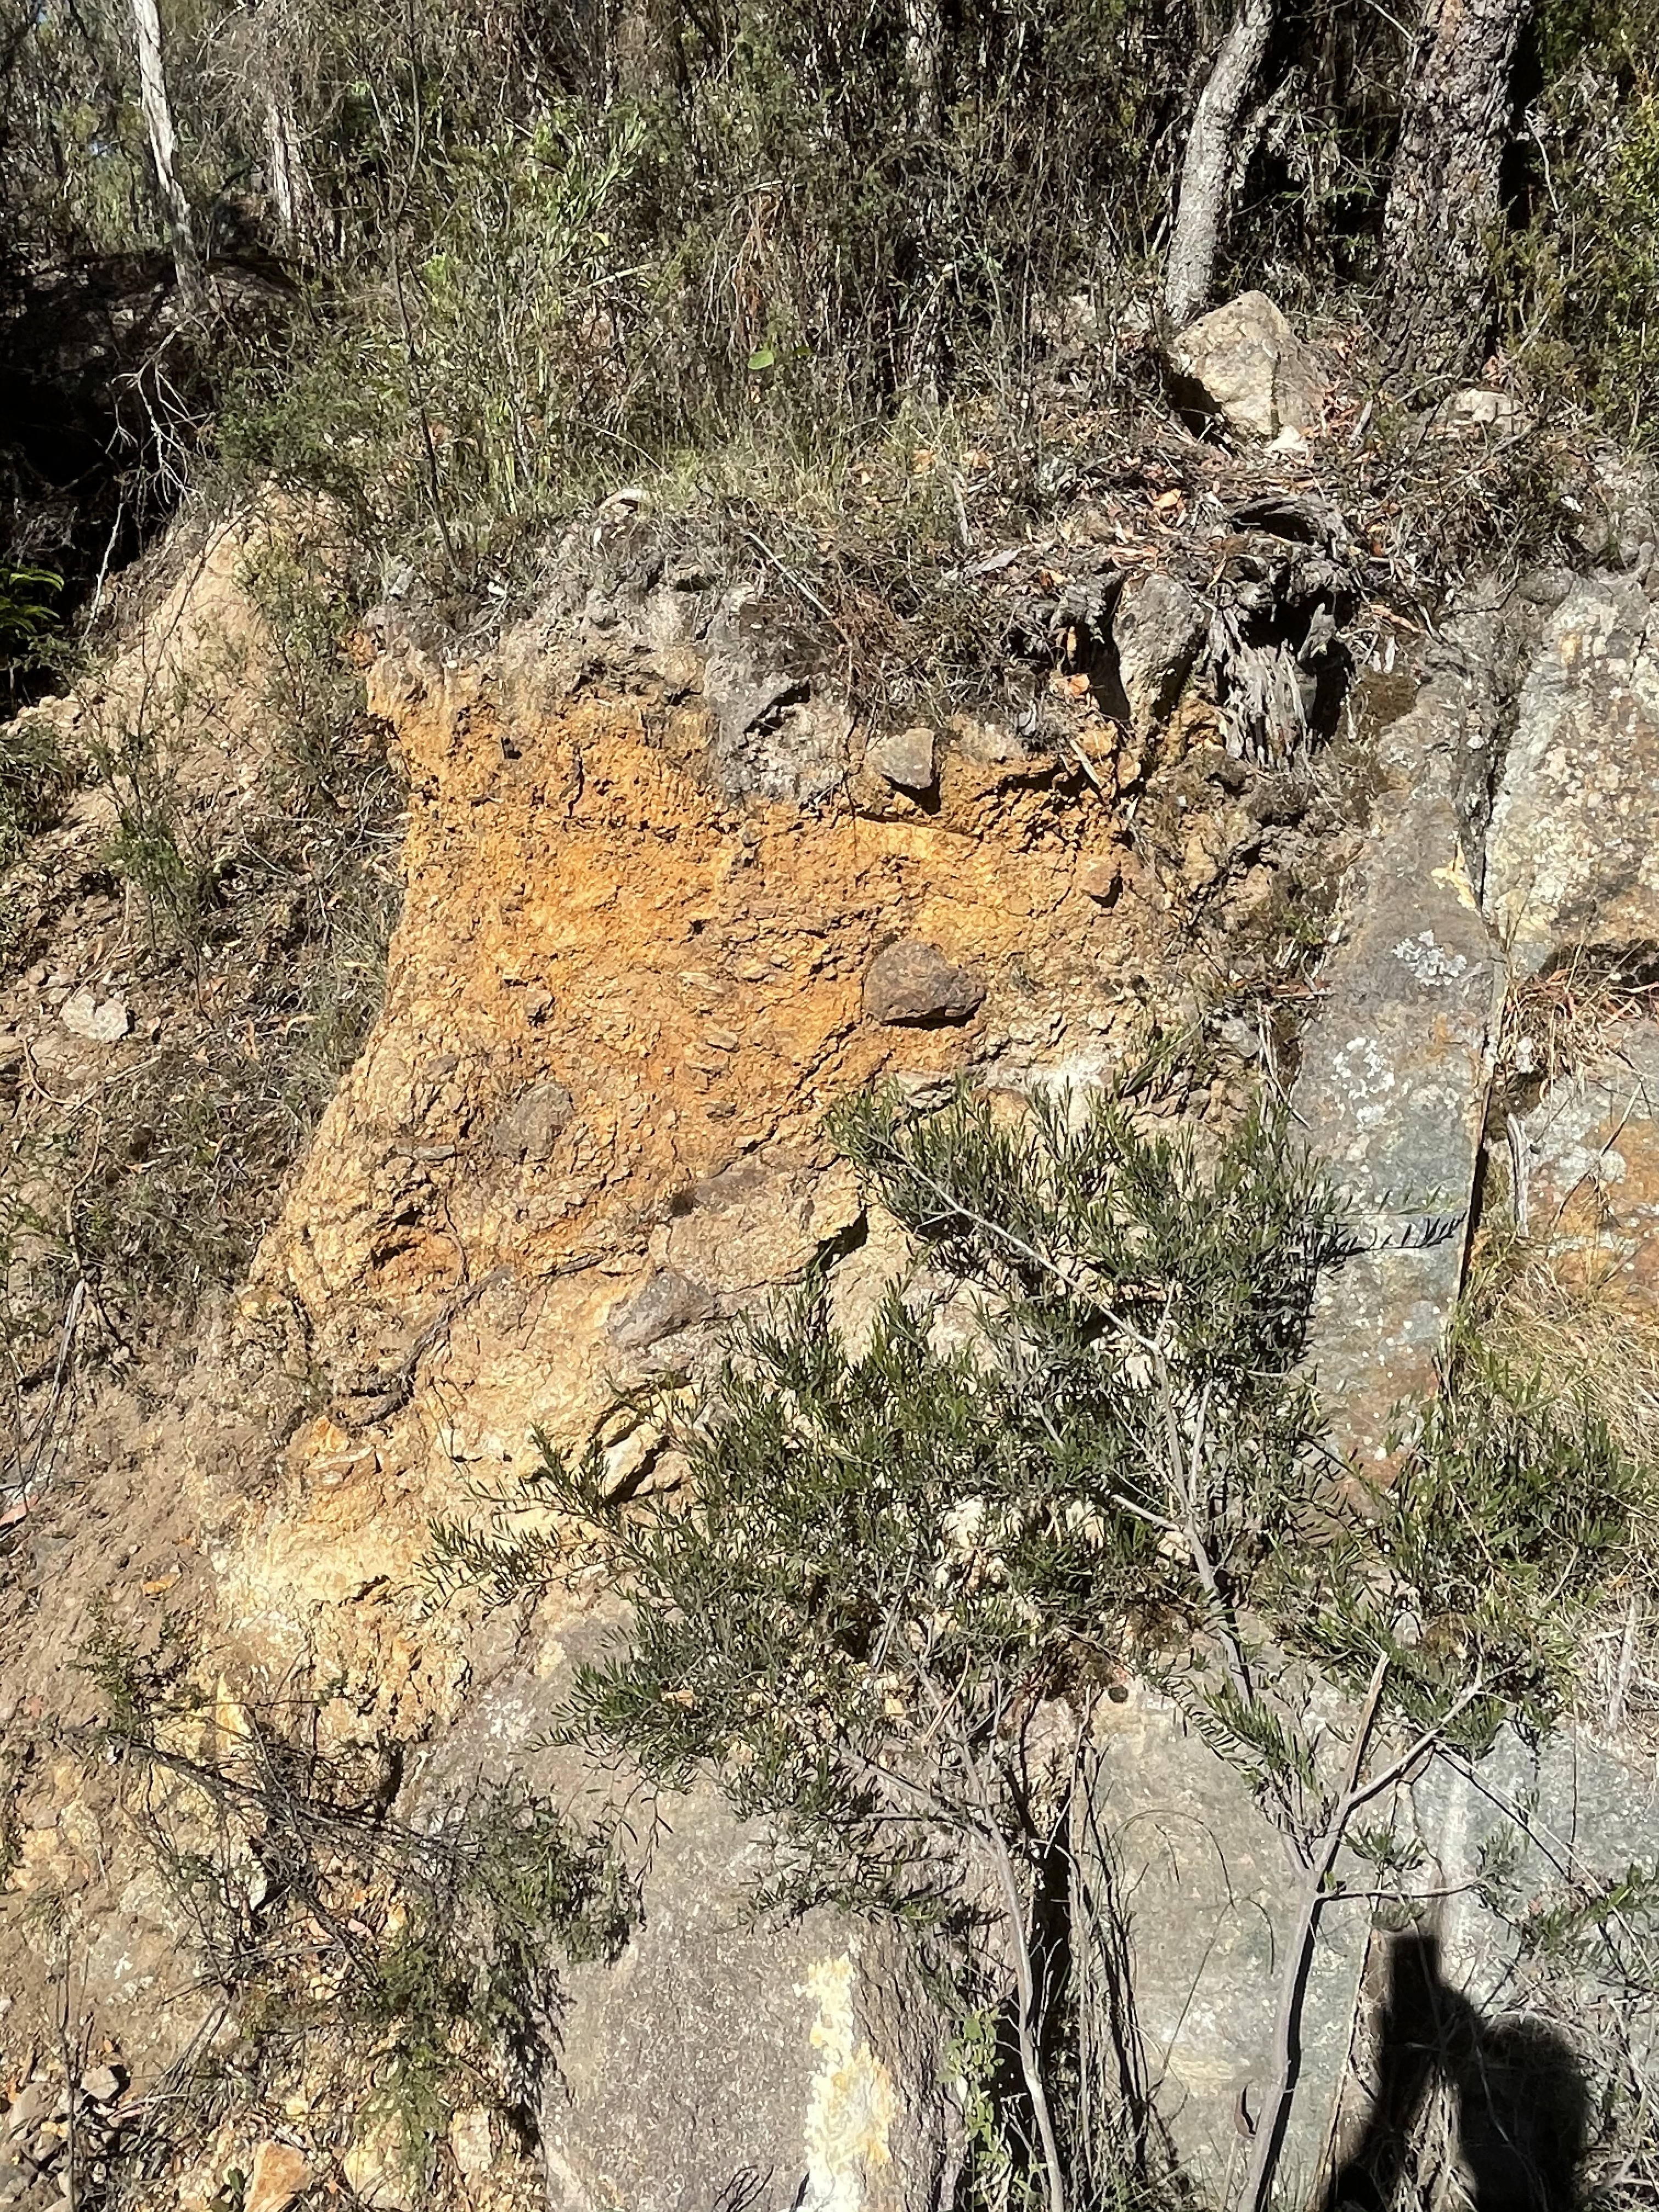 C
C
The outcrop in Fig. 5B is about 12 feet high. It shows fracturing and a solid appearance. However, near areas of probably hydrothermal alteration, this same rock weathers quickly to form an iron-rich soil (Fig. 5C). A major fault runs through the area where Fig. 5 was taken, as seen in Fig. 6.
 Fig. 6
The fault runs N-S next to Tullah. Note the numerous N-S faults running through Fig. 6. The photos in Fig. 5 were taken on A10 where it crosses a river south of Lake Mackintosh. The fault is expressed in cliffs on both sides of the river (Fig. 7).
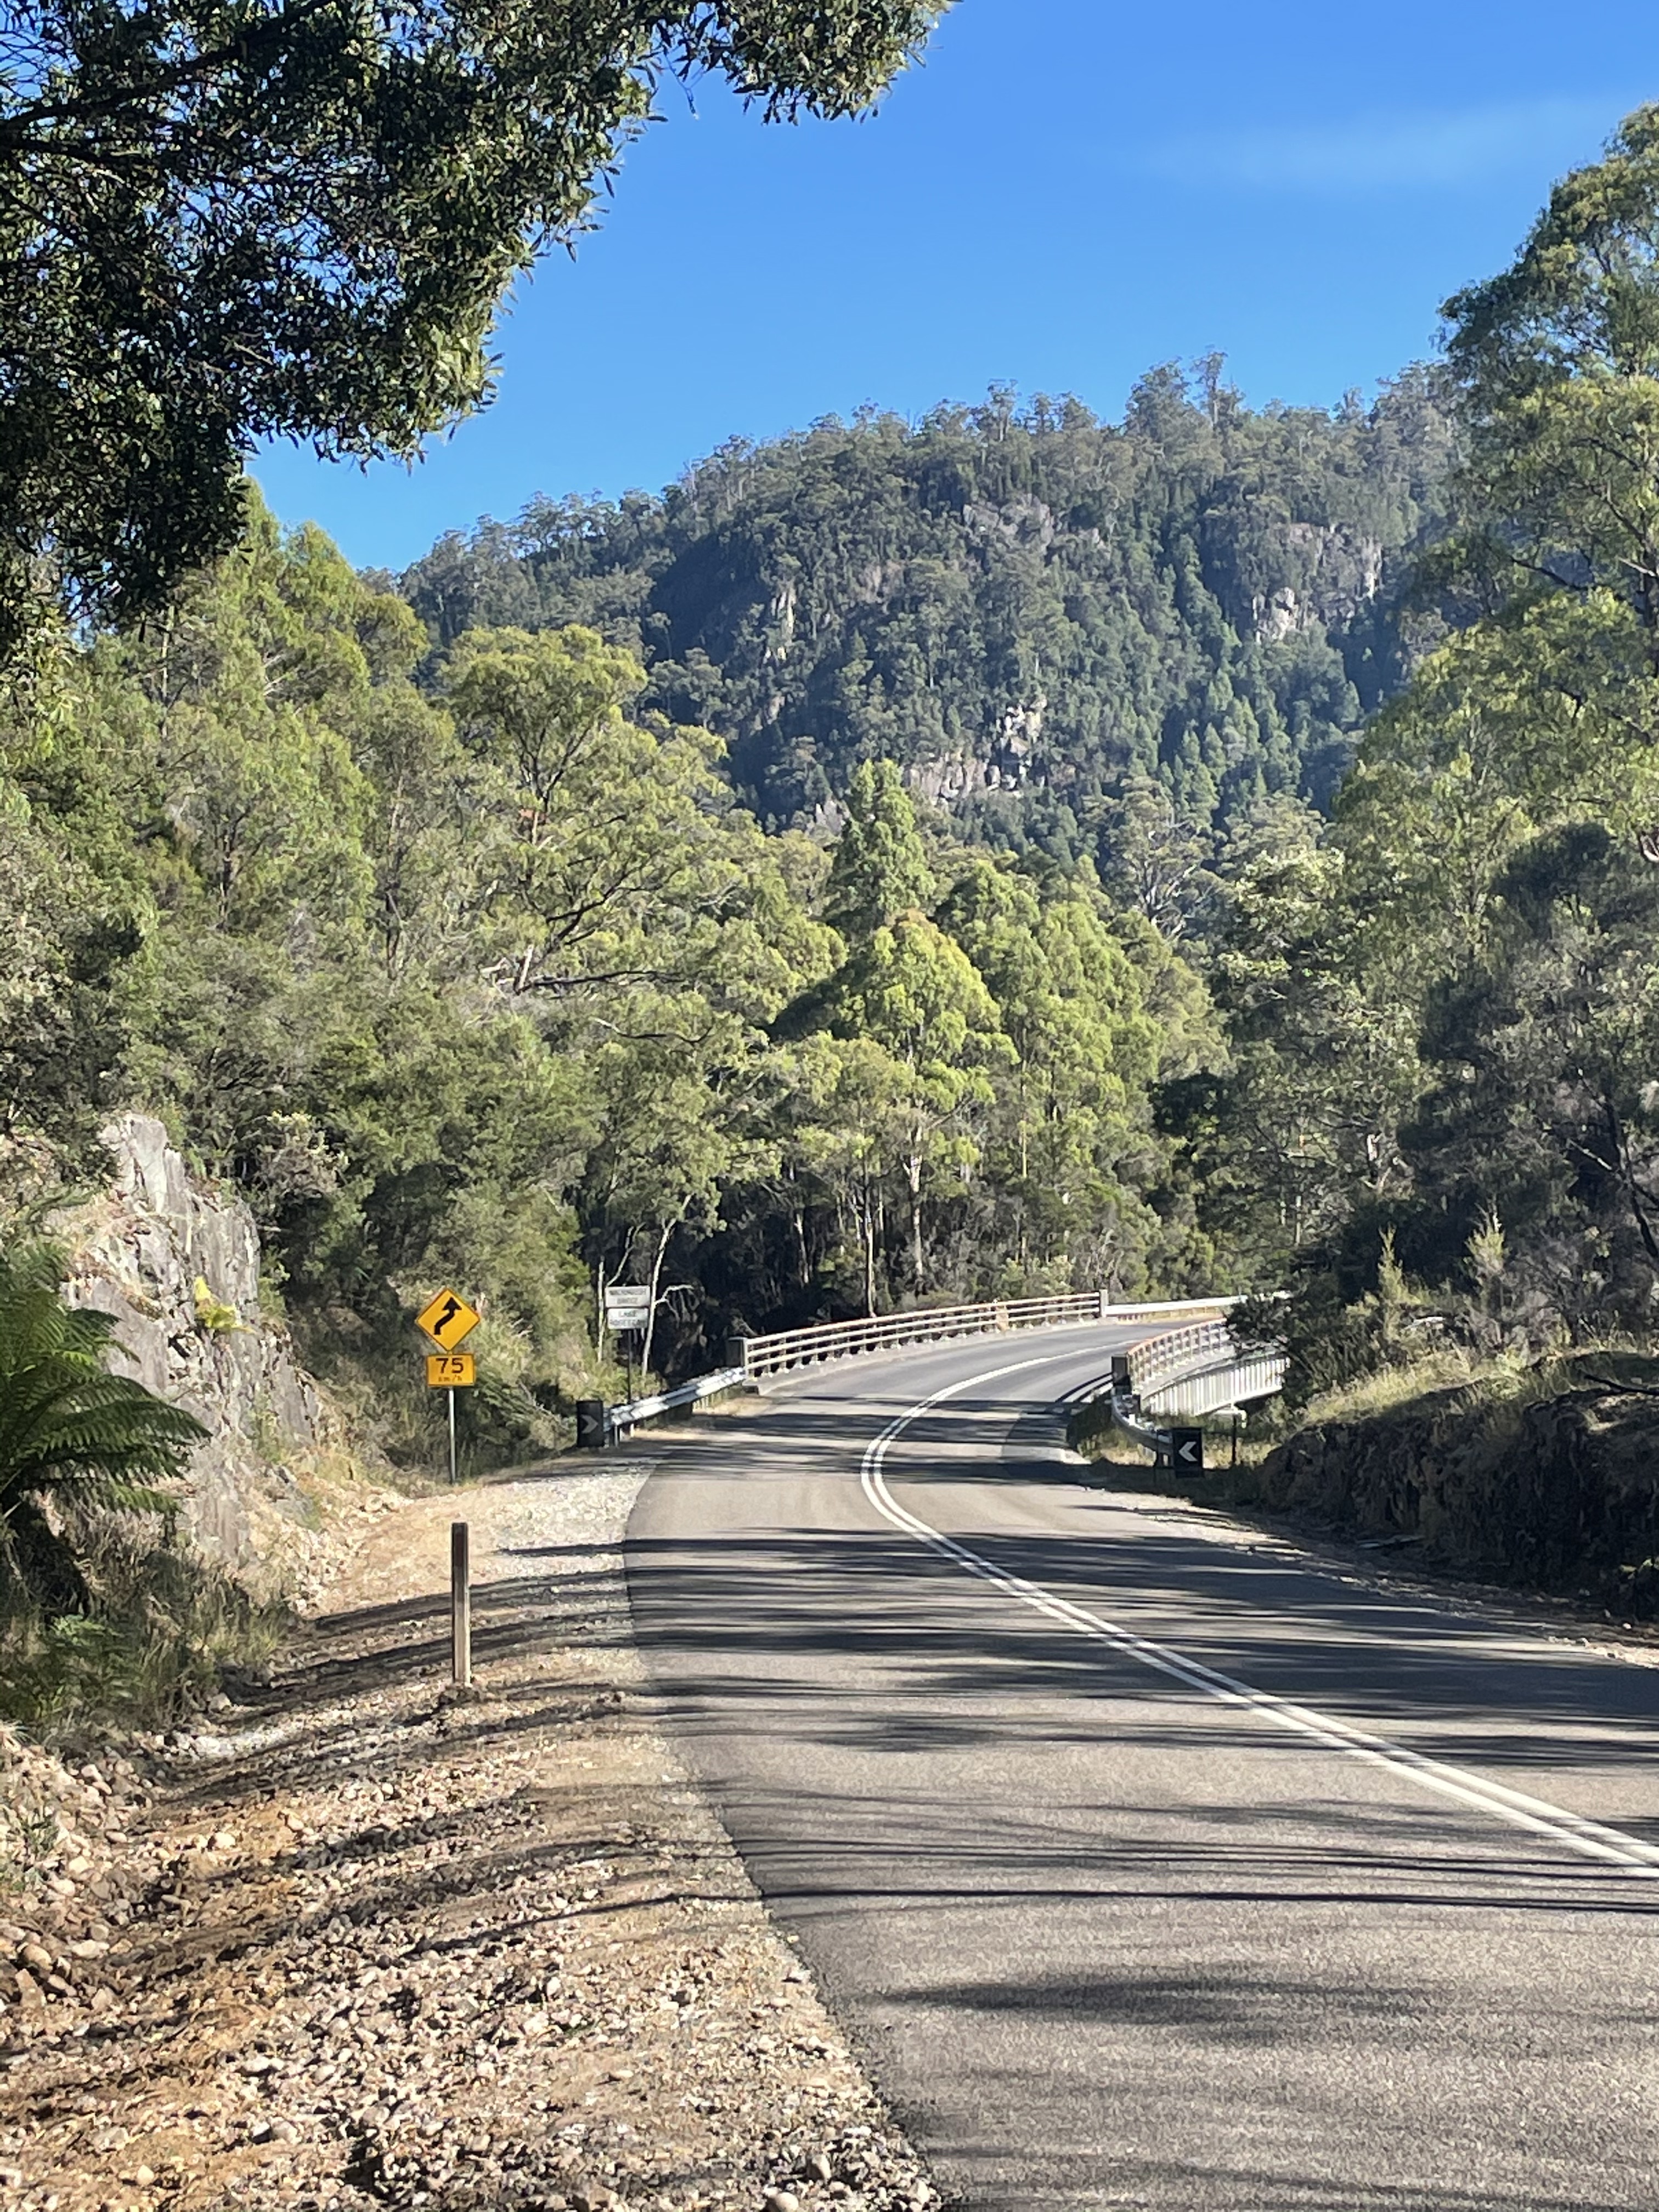
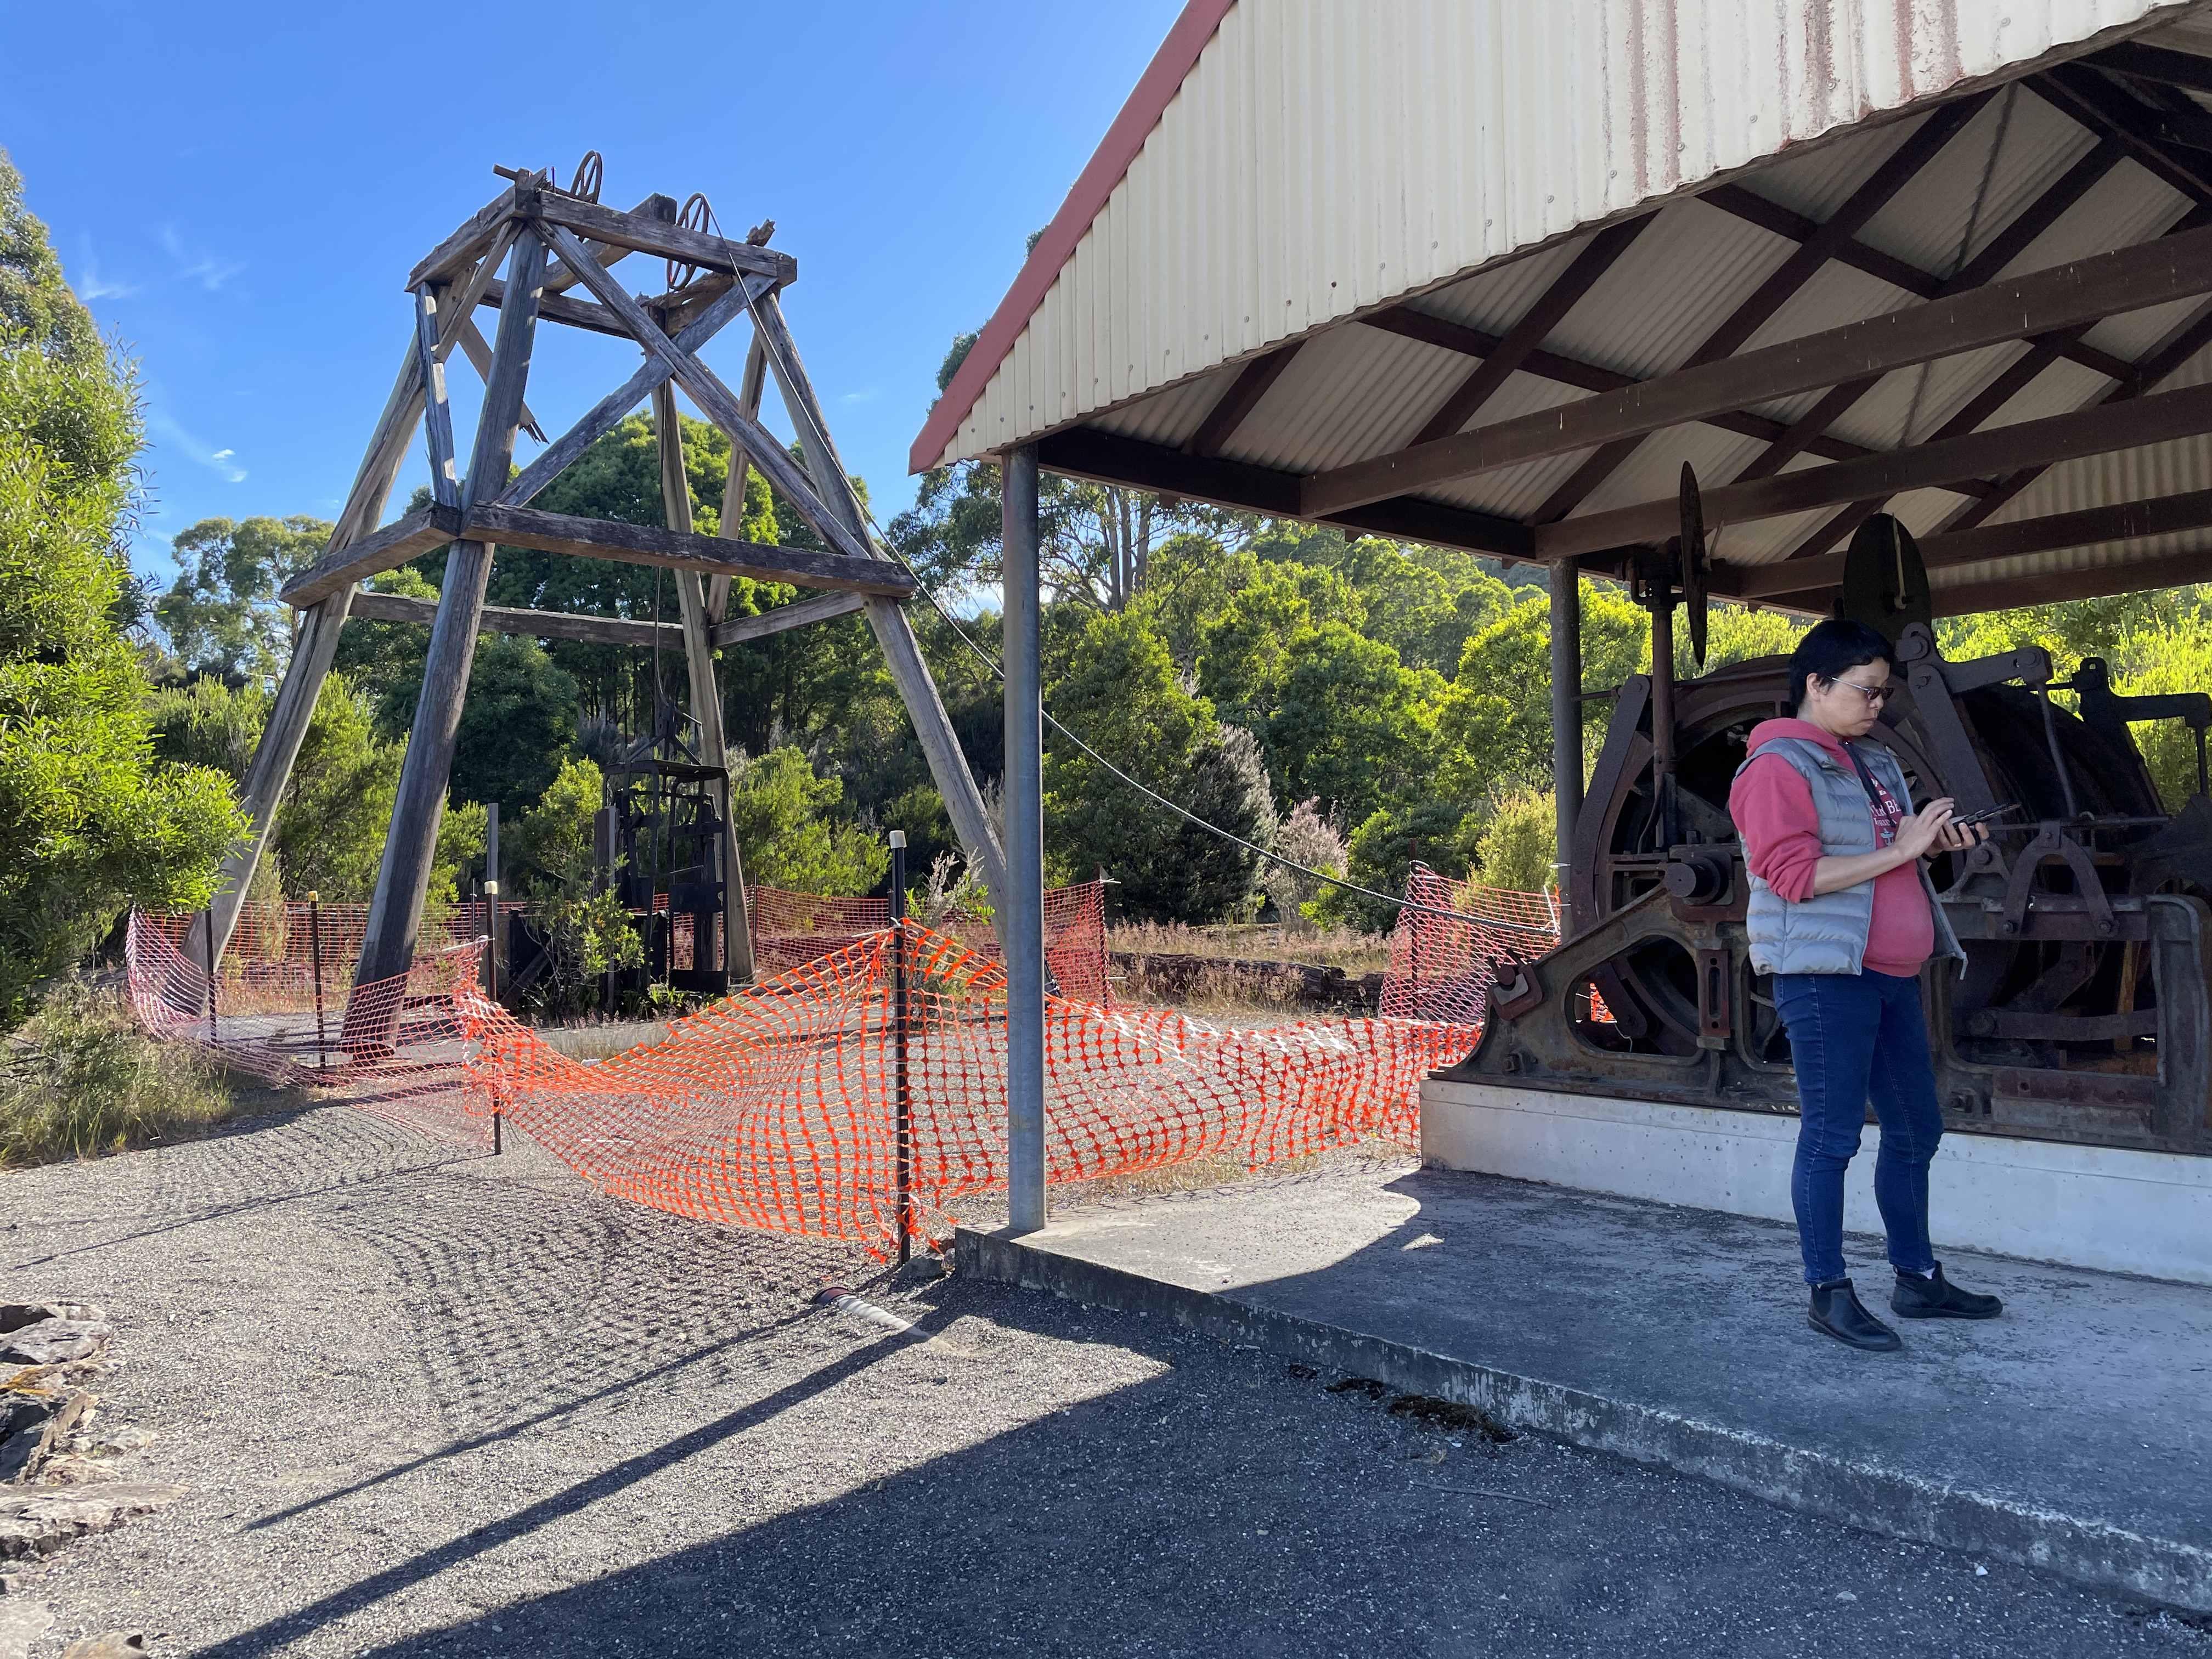 Fig. 7
This is mining country, as evidenced by the vertical mine lift shown in Fig. 7. There was no mine shaft under the original equipment on display however. The rock has changed significantly only a few miles further south (Fig. 8), even though it is still probably the Ordovician (~500 MY) volcaniclastic rocks we’ve been seeing before. Correlation is always a problem with field geology.
Fig. 8
 A
A 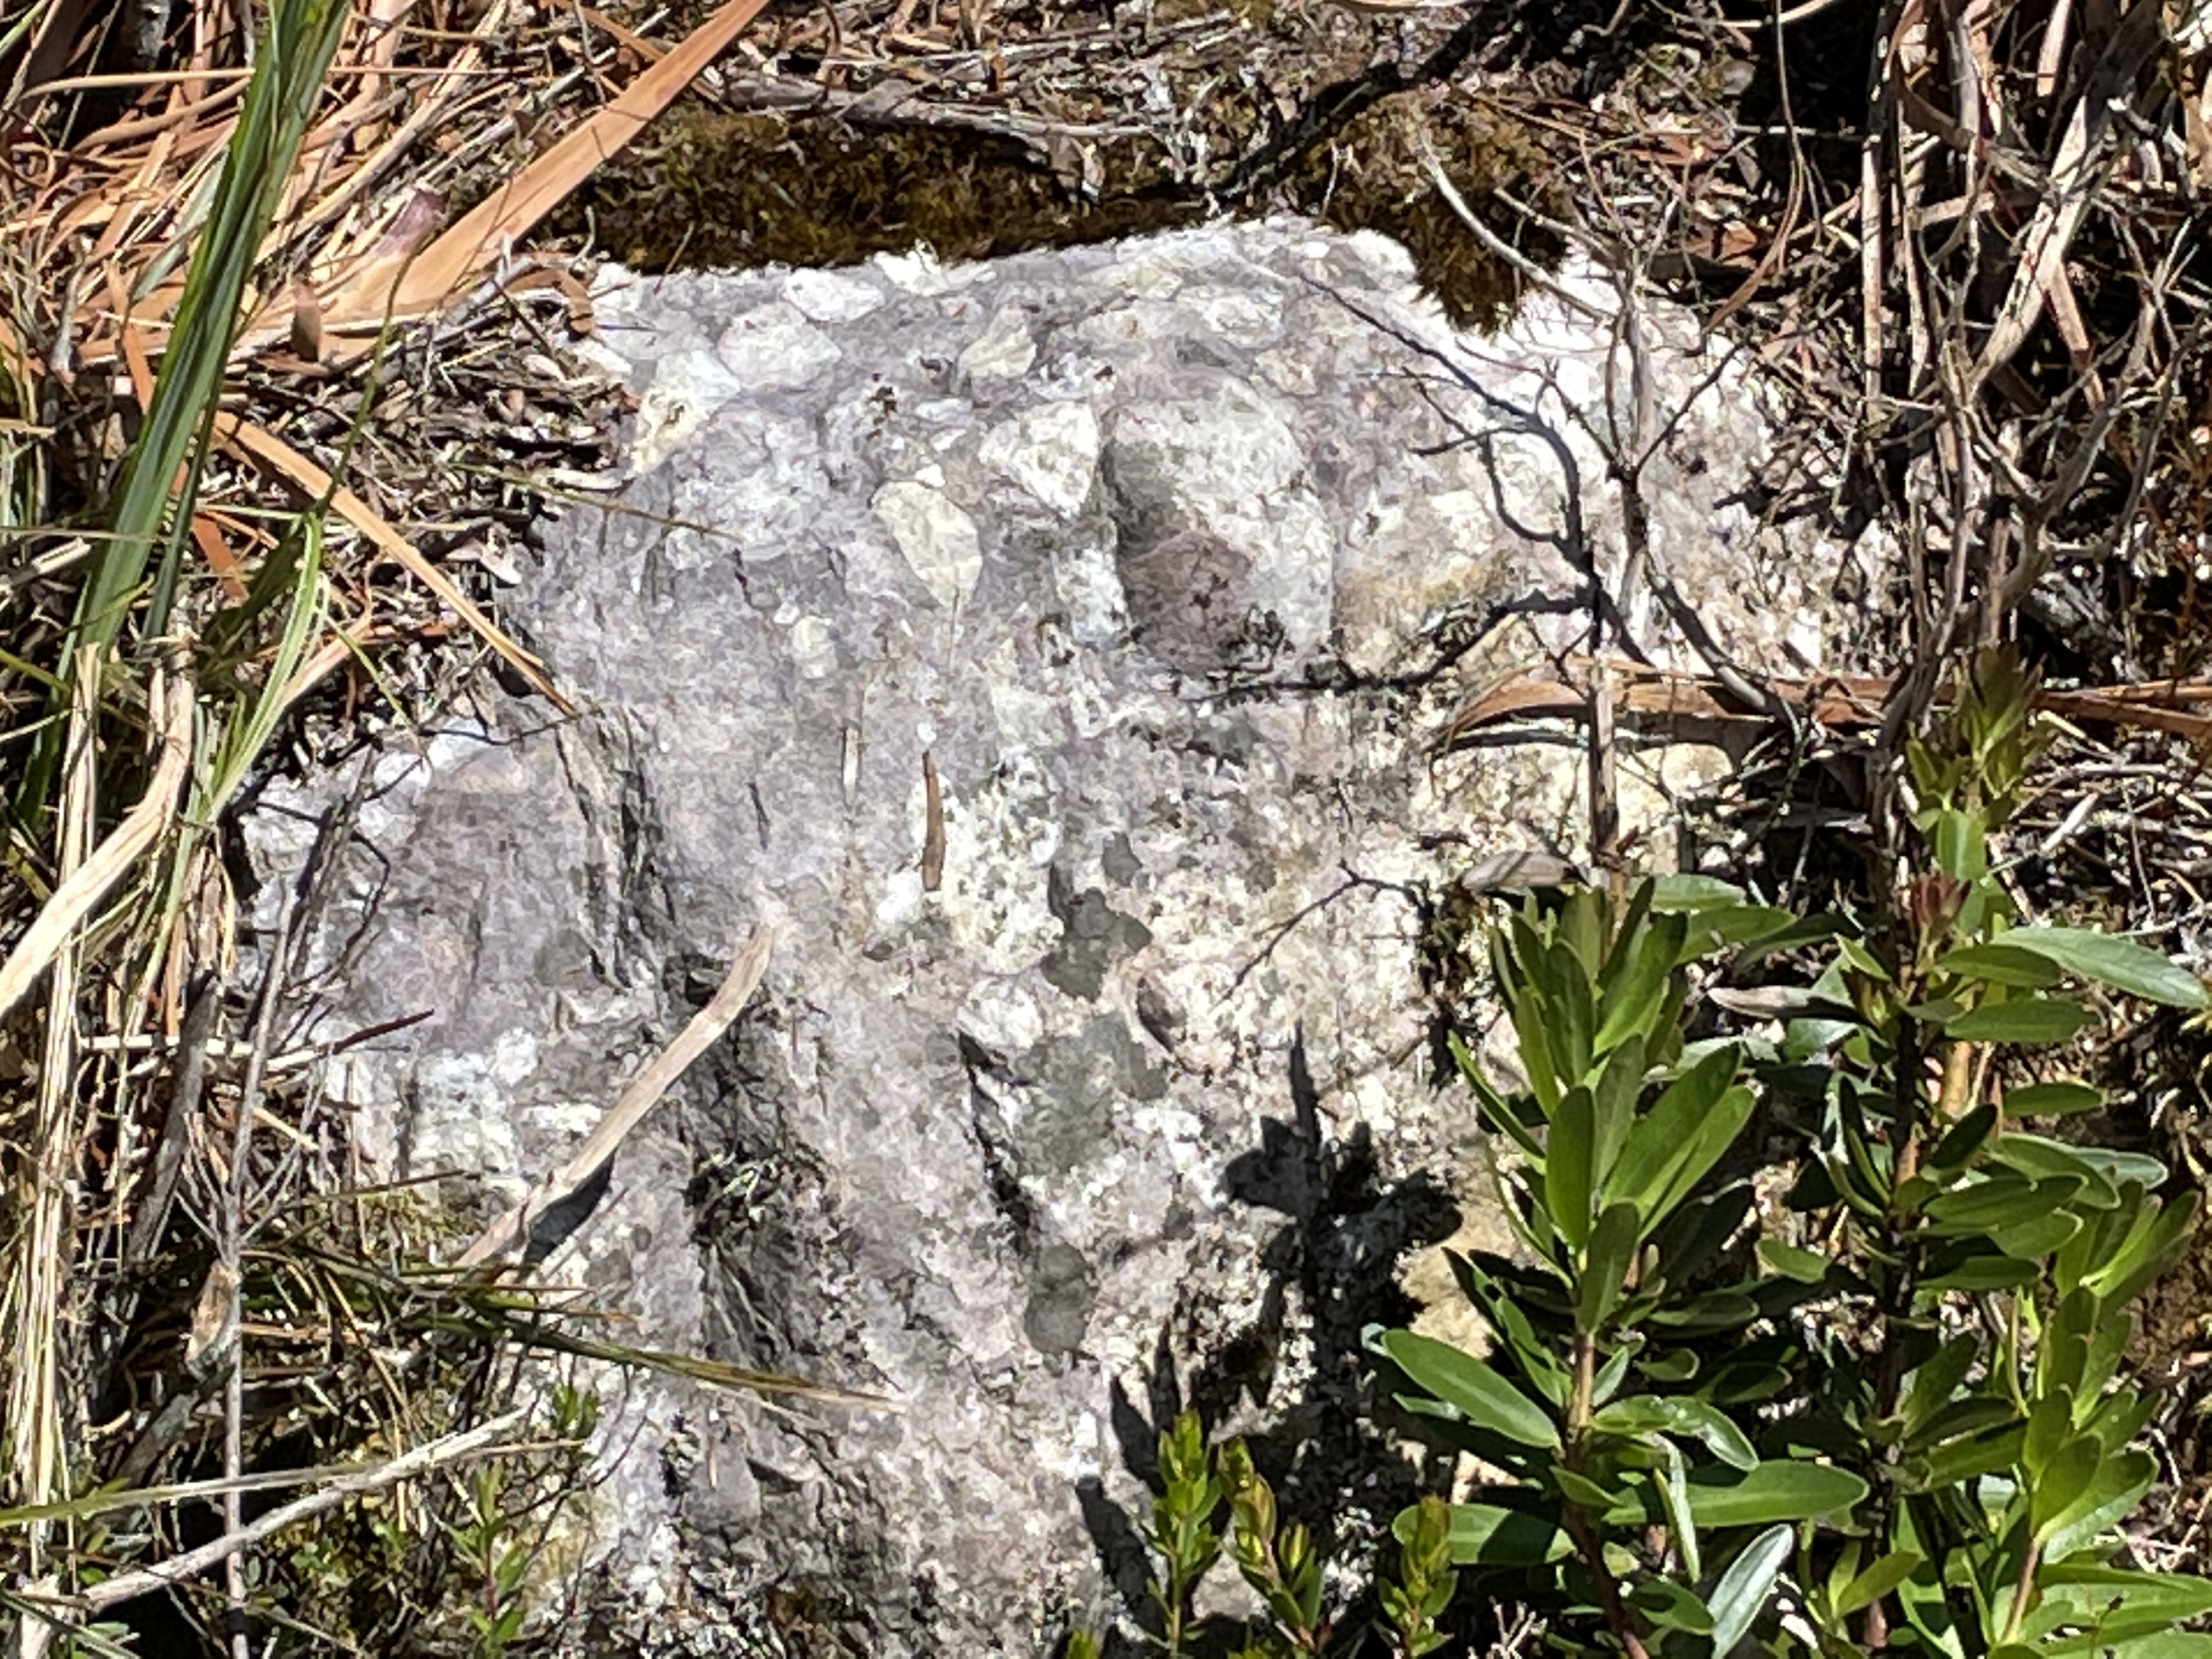 B
B
I can only speculate about Fig. 8A and say that this is either a contact, or near the contact of country rock (i.e. older sedimentary rock) with a granite (~500 MY) with porphyritic texture (Fig. 8). This is consistent with our path along the thin line of granite associated with the granite and quartz porphyry shown in the high-resolution 3D geologic model of this area (Fig. 9). You will have to zoom in to see the red areas. Also note the red squares that indicate mining areas. Granitic rocks are the primary source of hydrothermal fluids saturated with valuable elements like Cu, Au, and Ag, as well as a myriad of rare elements like niobium and titanium.
 Fig. 9
Another twenty miles through some very difficult terrane, finally following a twisting road through a break in the granite back of Tasmania, brought us to the other side of the mountain where there were no trees, but peaks that promised ore bodies, and wealth, ahead (Fig. 10).
 Fig. 10
The rock becomes even more saturated with the white color as we approach Queenstown (See Fig. 6), which was a major copper mine in the 19th and 20th centuries. Here, a thin-bedded sand/siltstone is permeated and a discontinuity (diagonal contact, possibly a fault, with the irregular and fractured rock to lower right) may have been the route for transport of hydrothermal fluids (Fig. 10).
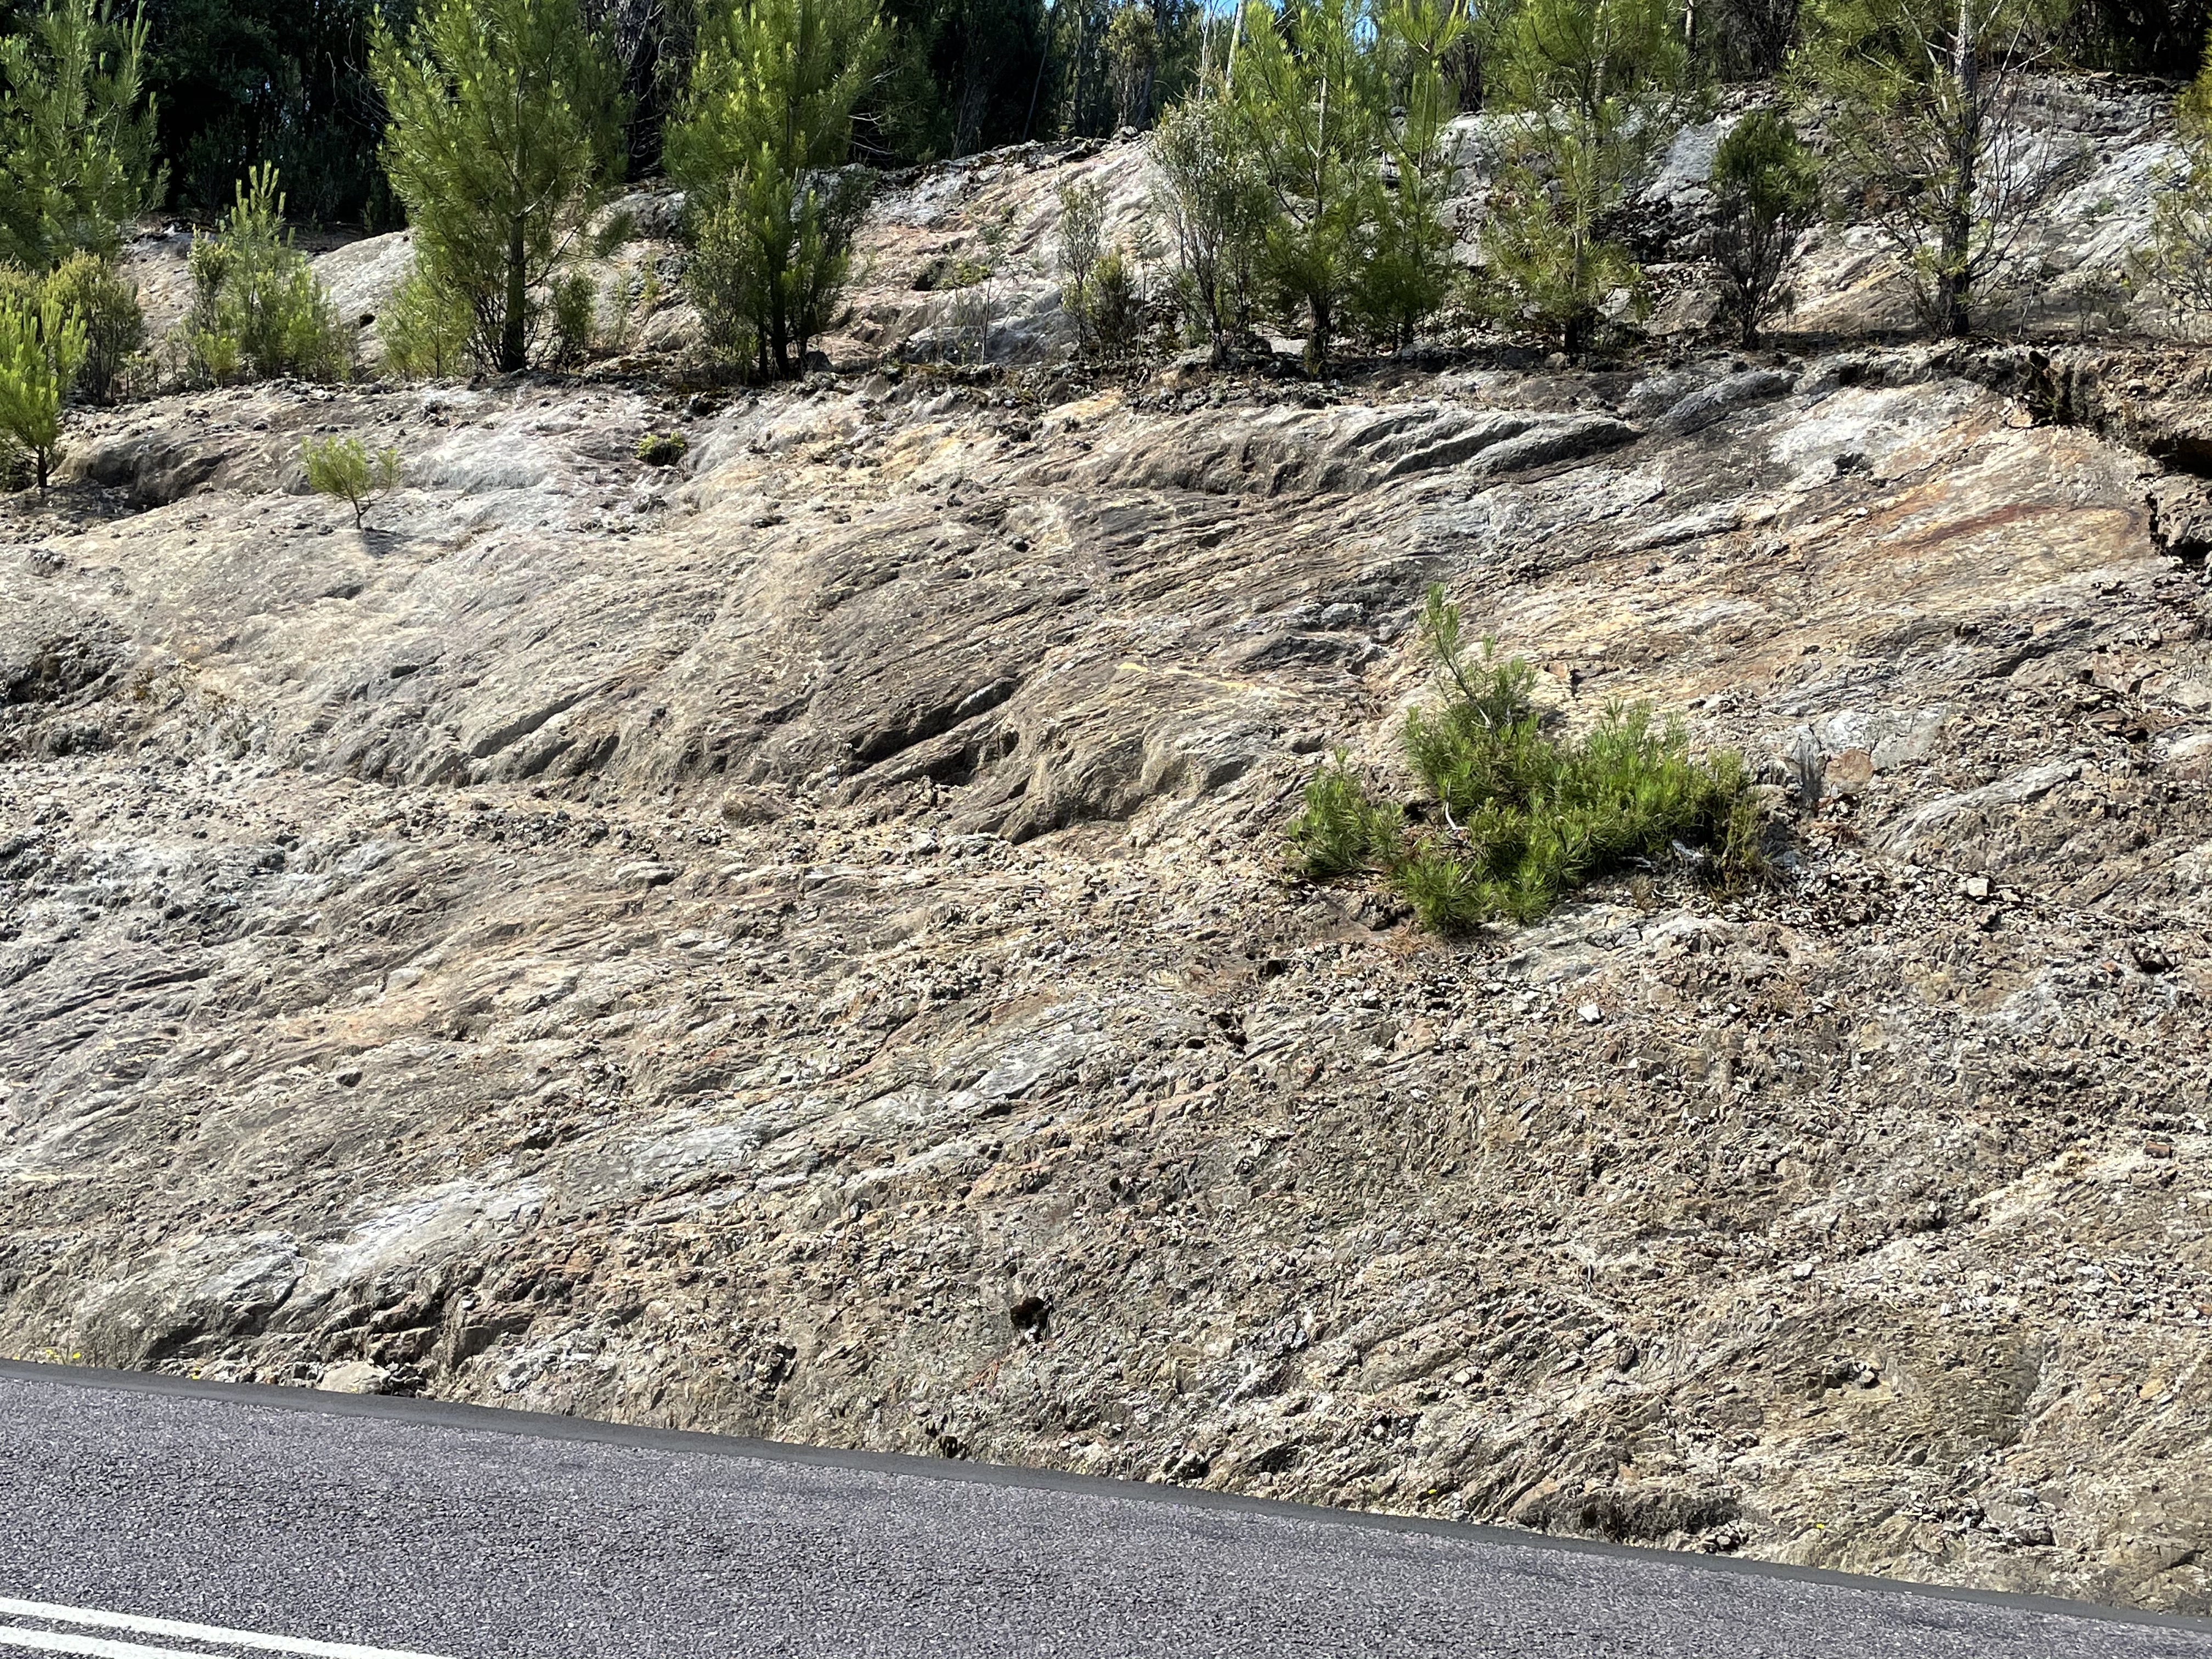 Fig. 10
I’m not certain about the time of hydrothermal activity (ore emplacement) because the granite porphyry is identified as ~500 My (during collision with Gondwana) and could have produced many of the necessary fluids to saturate surrounding rocks. However, the granite to the east of the mineral belt is Devonian in age (420-360 MY), a difference of ~100 MY. The orogeny could easily have lasted that long, so we shouldn’t fret about it. There is no central clearing house for geological data and its interpretation.
We made it to Queenstown and climbed one of the steepest roads you’ll find anywhere; we climbed to the copper mines that had put Queenstown, Tasmania on the map (Fig. 11).
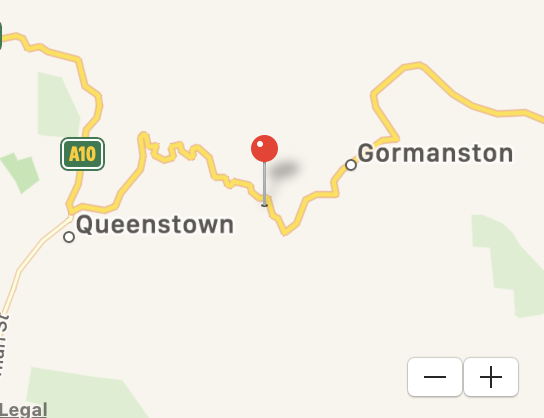
 Fig. 11
A lot of copper ore was removed from the area over a century but now it looked pretty dead, probably played out. These were mostly underground mines, which require high-grade ore to be cost effective.
We followed the long and winding road to the pass that allowed us to turn eastward. Along the way we saw mining tailings piles (Fig. 12A) across the valley. We also noticed some quartz-rich hydrothermal activity (Fig. 12B), but very limited in extent. This wasn’t like the copper porphyry mines of the Americas with low-grade deposits renowned for huge open-pits.We passed near a number of old mines with no signs of activity as we headed east from the ridge. We failed to take any photos, however.
Fig. 12
 A
A  B
B
 C
C 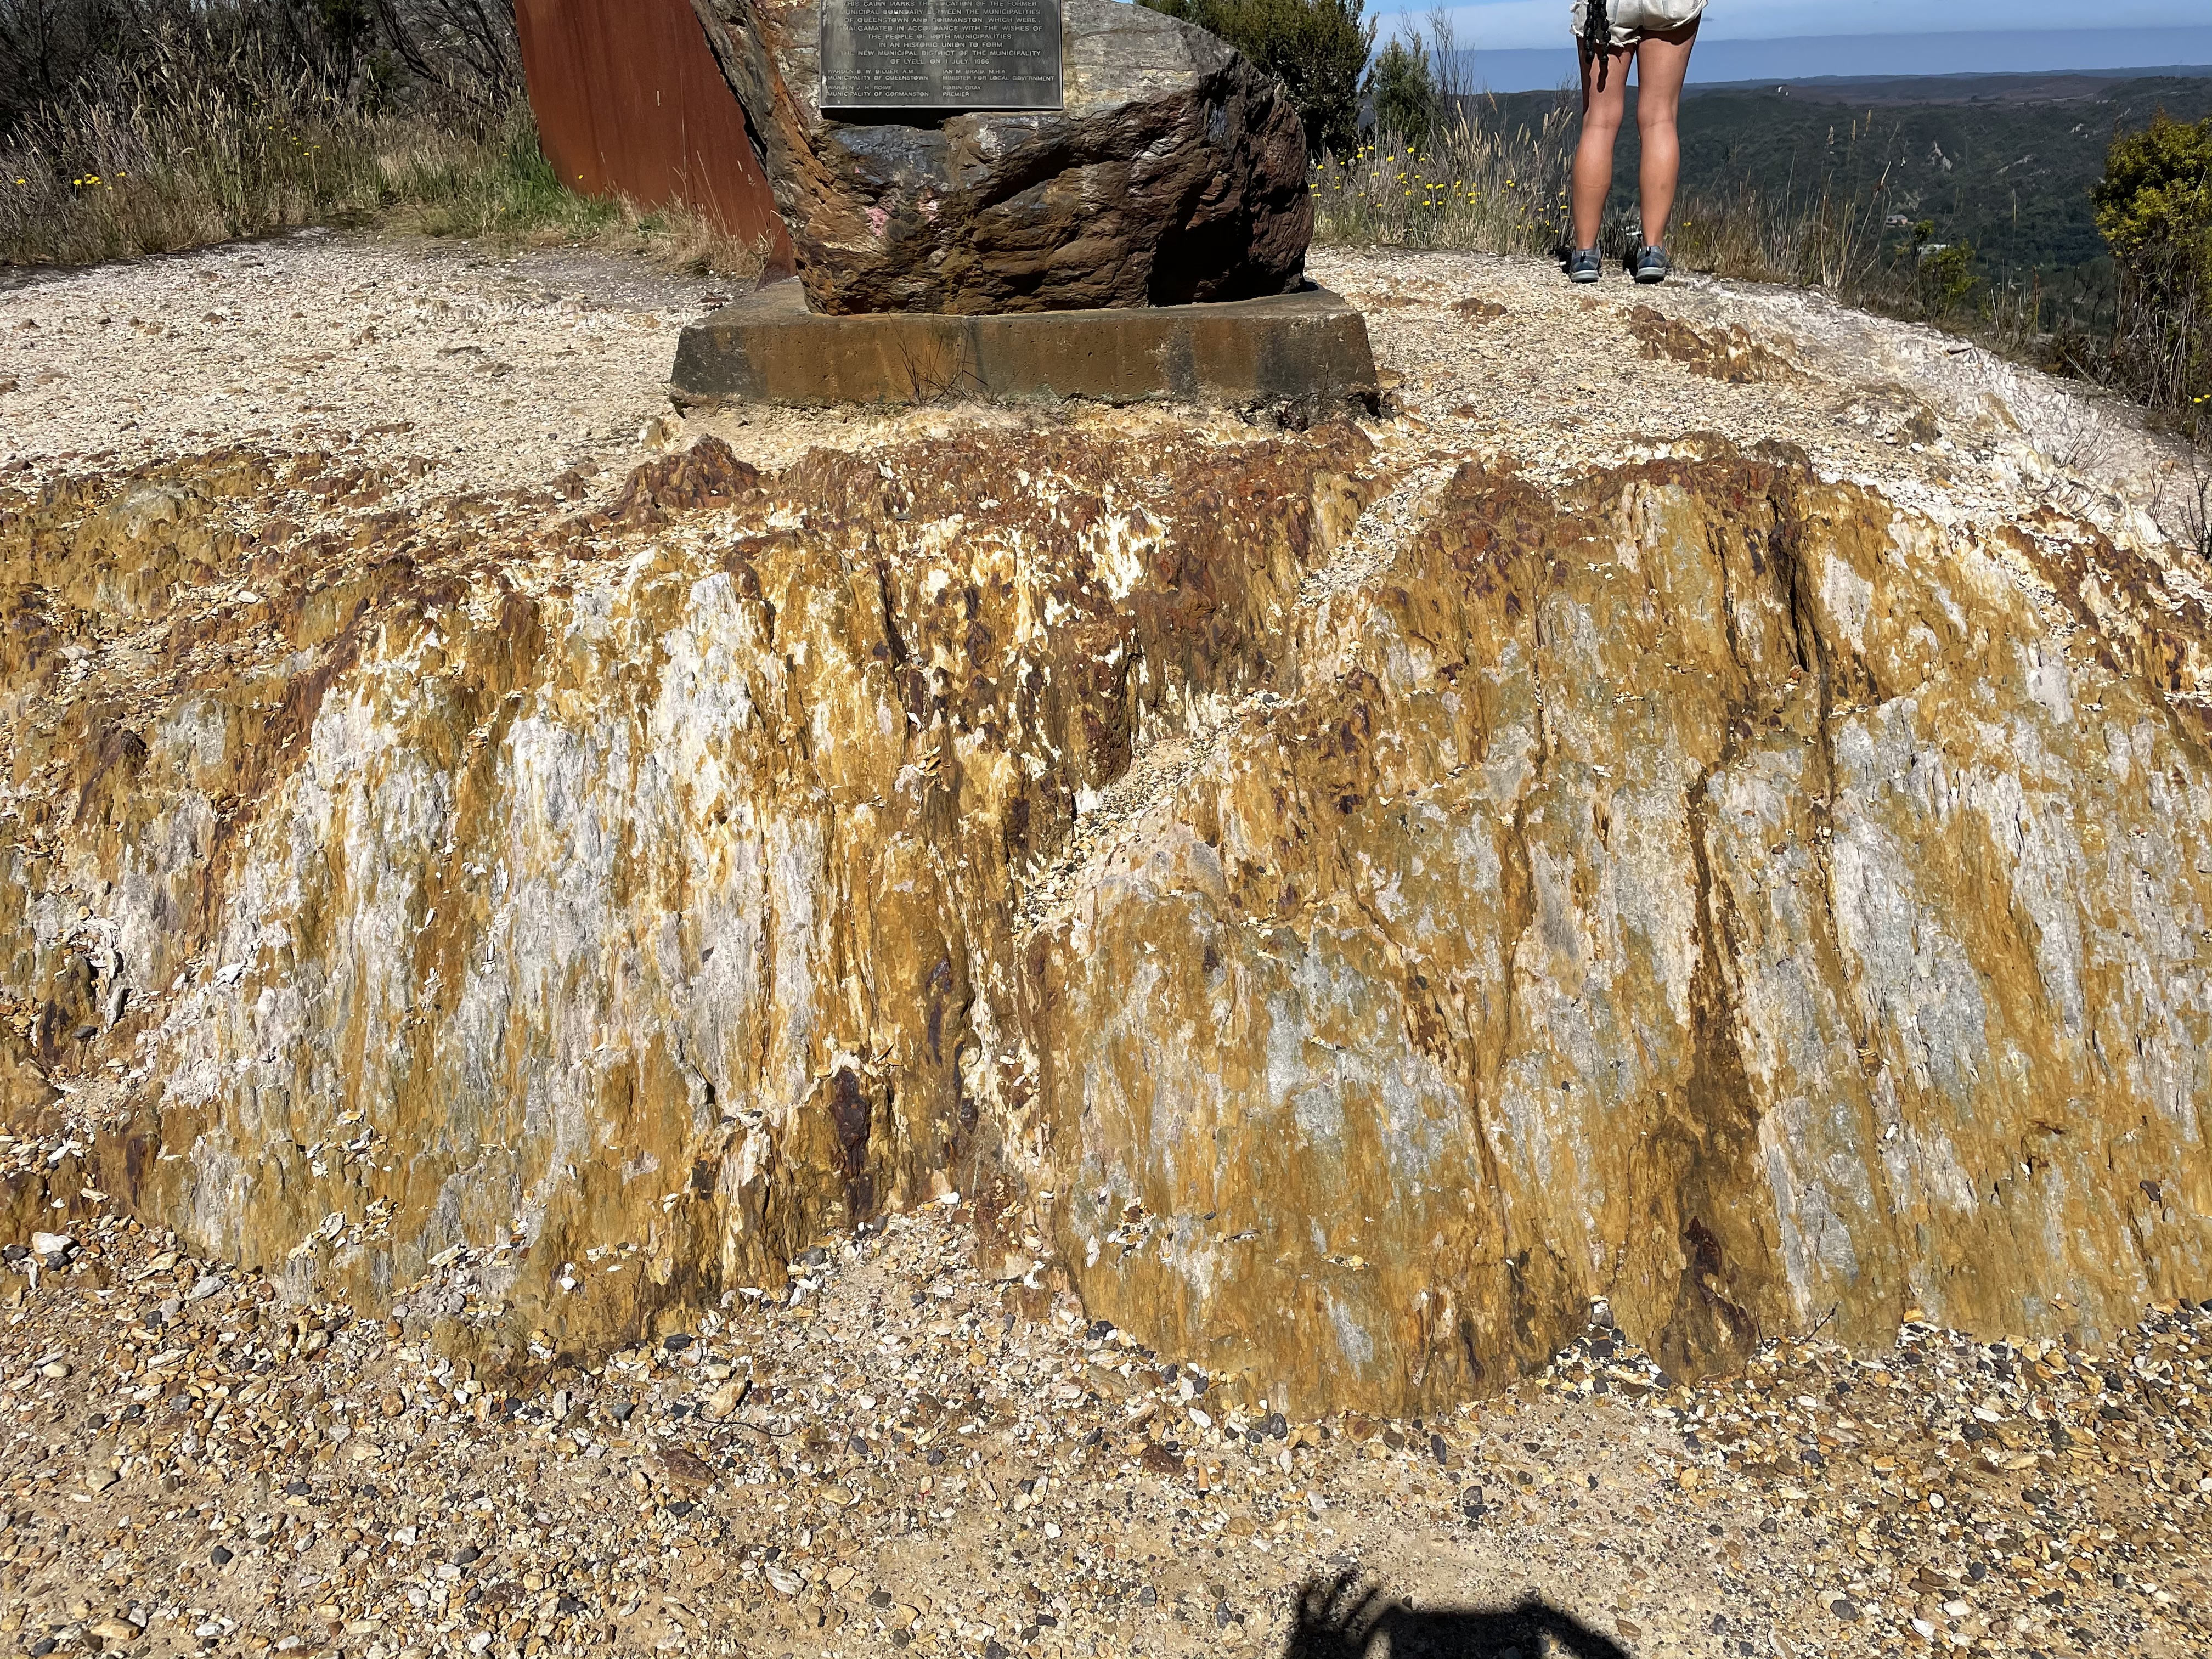 D
D
The road cut shown in Fig. 12C reveals the rich variety of color displayed by these remineralized rocks, as well as the beckoning omnipotence of the mountain tops, where the apparent bedding (from a distance) suggests a granitic magmatic body overlain by Paleozoic rocks infused with gold and silver. Alas, that wasn’t the case because there is no evidence of mines higher up the mountain than where these photos were taken.
Figure 12 D shows vertical lineations which suggest that this rock was subjected to a lot of shear after it had become relatively brittle. There are a lot of faults in the Queenstown region, as one would expect with the emplacement and later uplift of a massive granitic batholith (Fig. 13).
 Fig. 13
I would add that the striations seen in Fig. 12D are consistent with vertical shear along a fault running through the town of Queenstown.
Next time, we’ll go from the top of the world to the continental divide and (maybe) back to the sea…
What a Bunch of Schist
This post is a continuation of the our first day in Tasmania. After looking at some glacial features, we headed south to our destination labeled DAY 1 in Fig. 1B. Note that the outline of Tasmania is indicated by a heavy black line in Fig. 1B. As before, the reader is recommended to examine Fig. 1A for any details of the geology because it is a high-resolution image.
Fig. 1
 A
A 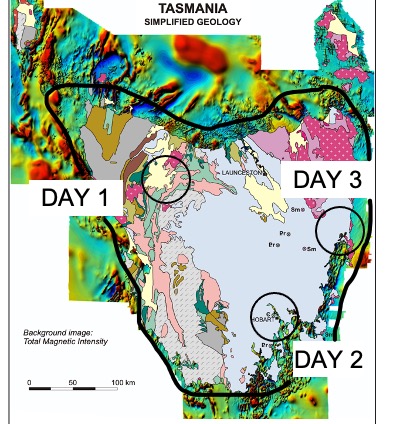 B
B
We will be driving southward, starting from the north coast (to the left in Fig. 2) to Cradle Mountain, about half-way to the right, in the Central Volcanic Complex (orange in Fig. 2).
Fig. 2
Once we entered the hills seen as we approached the coast, there were lots of low road cuts, which exposed intermediate volcanic and volcaniclastic rocks (Fig. 3).
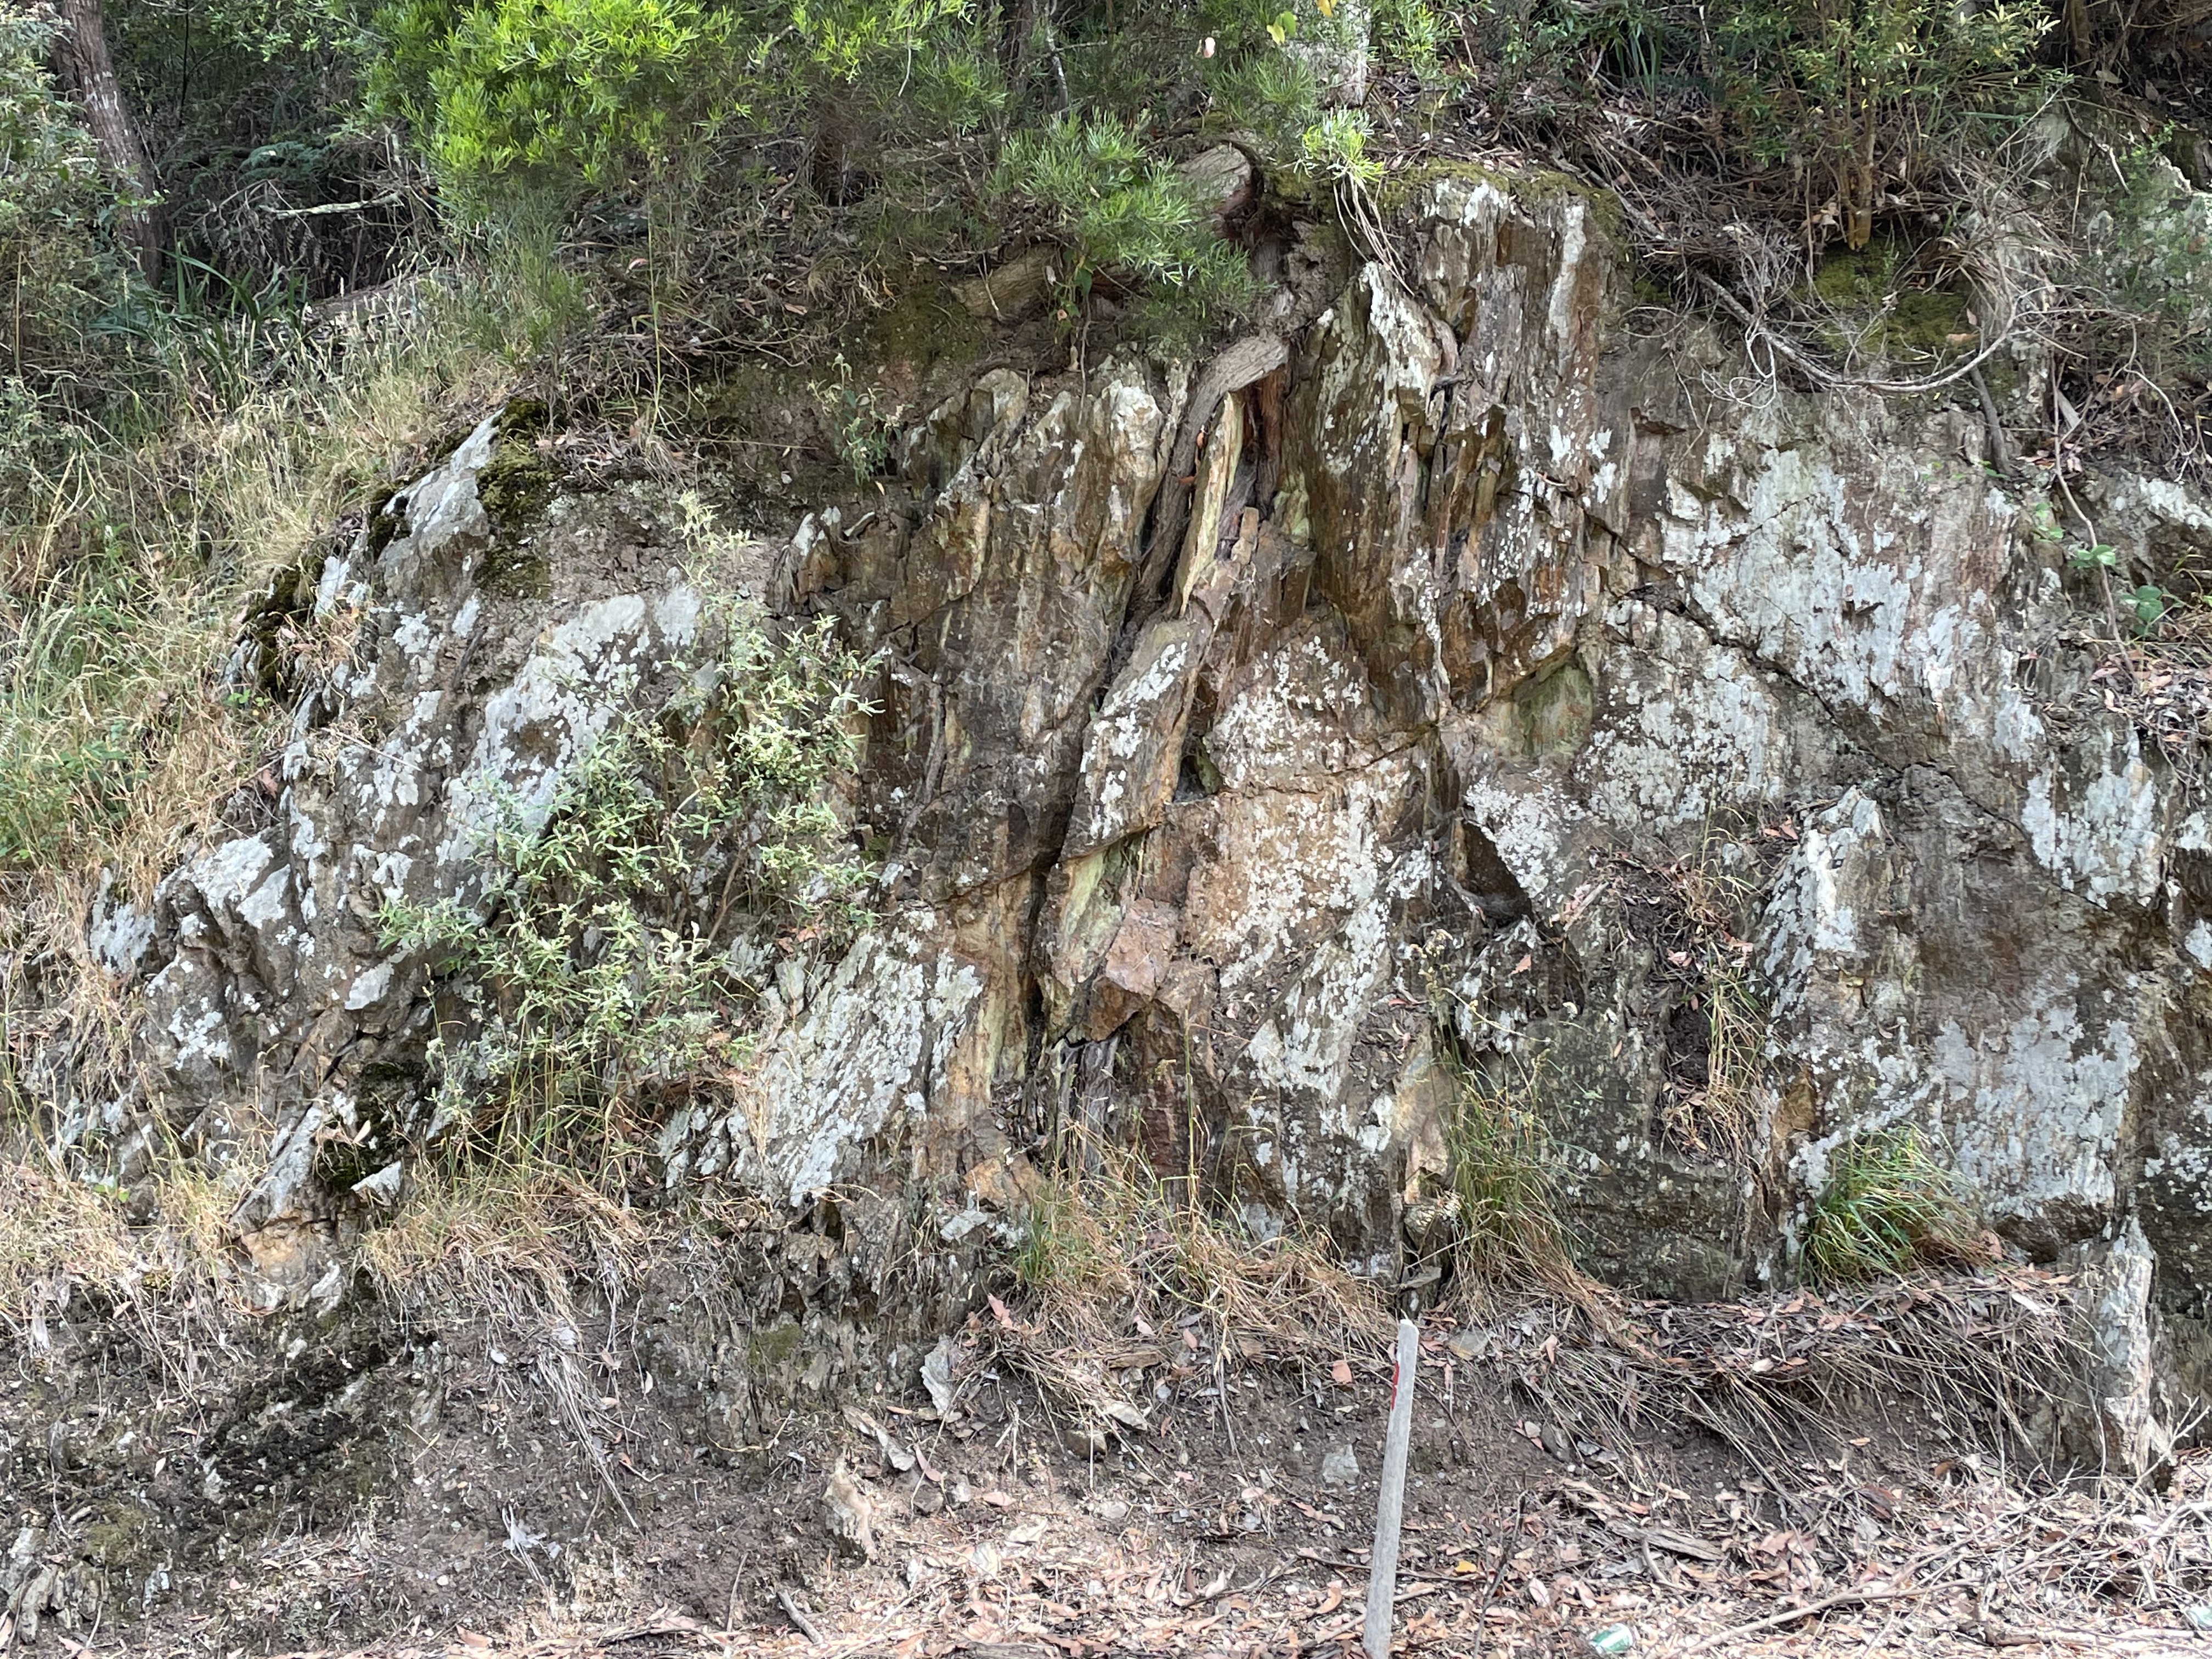
 Fig. 3
The left image is a road cut about 10 feet high. The original bedding can be seen to be almost vertical, as indicated by the platy appearance. These rocks (whether volcanic or sedimentary) were originally laid down horizontal. It is difficult to date them because of subsequent burial and heating but they are thought to have been deposited (from radiometric dating) to between 1600 and 540 MY. This was when Tasmania was approaching a land mass to the (current) NE, the future Gondwana. Ocean crust was colliding with the land here at that time and creating volcanic rocks of a specific type.
The right photo of Fig. 3 shows a close up (the coin is 1/2 inch in diameter). Normally, a fresh break would be made on the rock to see the minerals and structures, but I didn’t do that. The photo does show fine structure, which could be either shallow or deeper water. There are a variety of coastal environments that would have collected fine sediment, including mud and silt. The location of Fig. 3 in the area is shown in Fig. 4A (below).
Fig. 4
 A
A  B
B  C
C
The background is from a phone app that shows an interactive geological map. The color labeled Fig. 3 and 5 has been identified from a lot of field work.

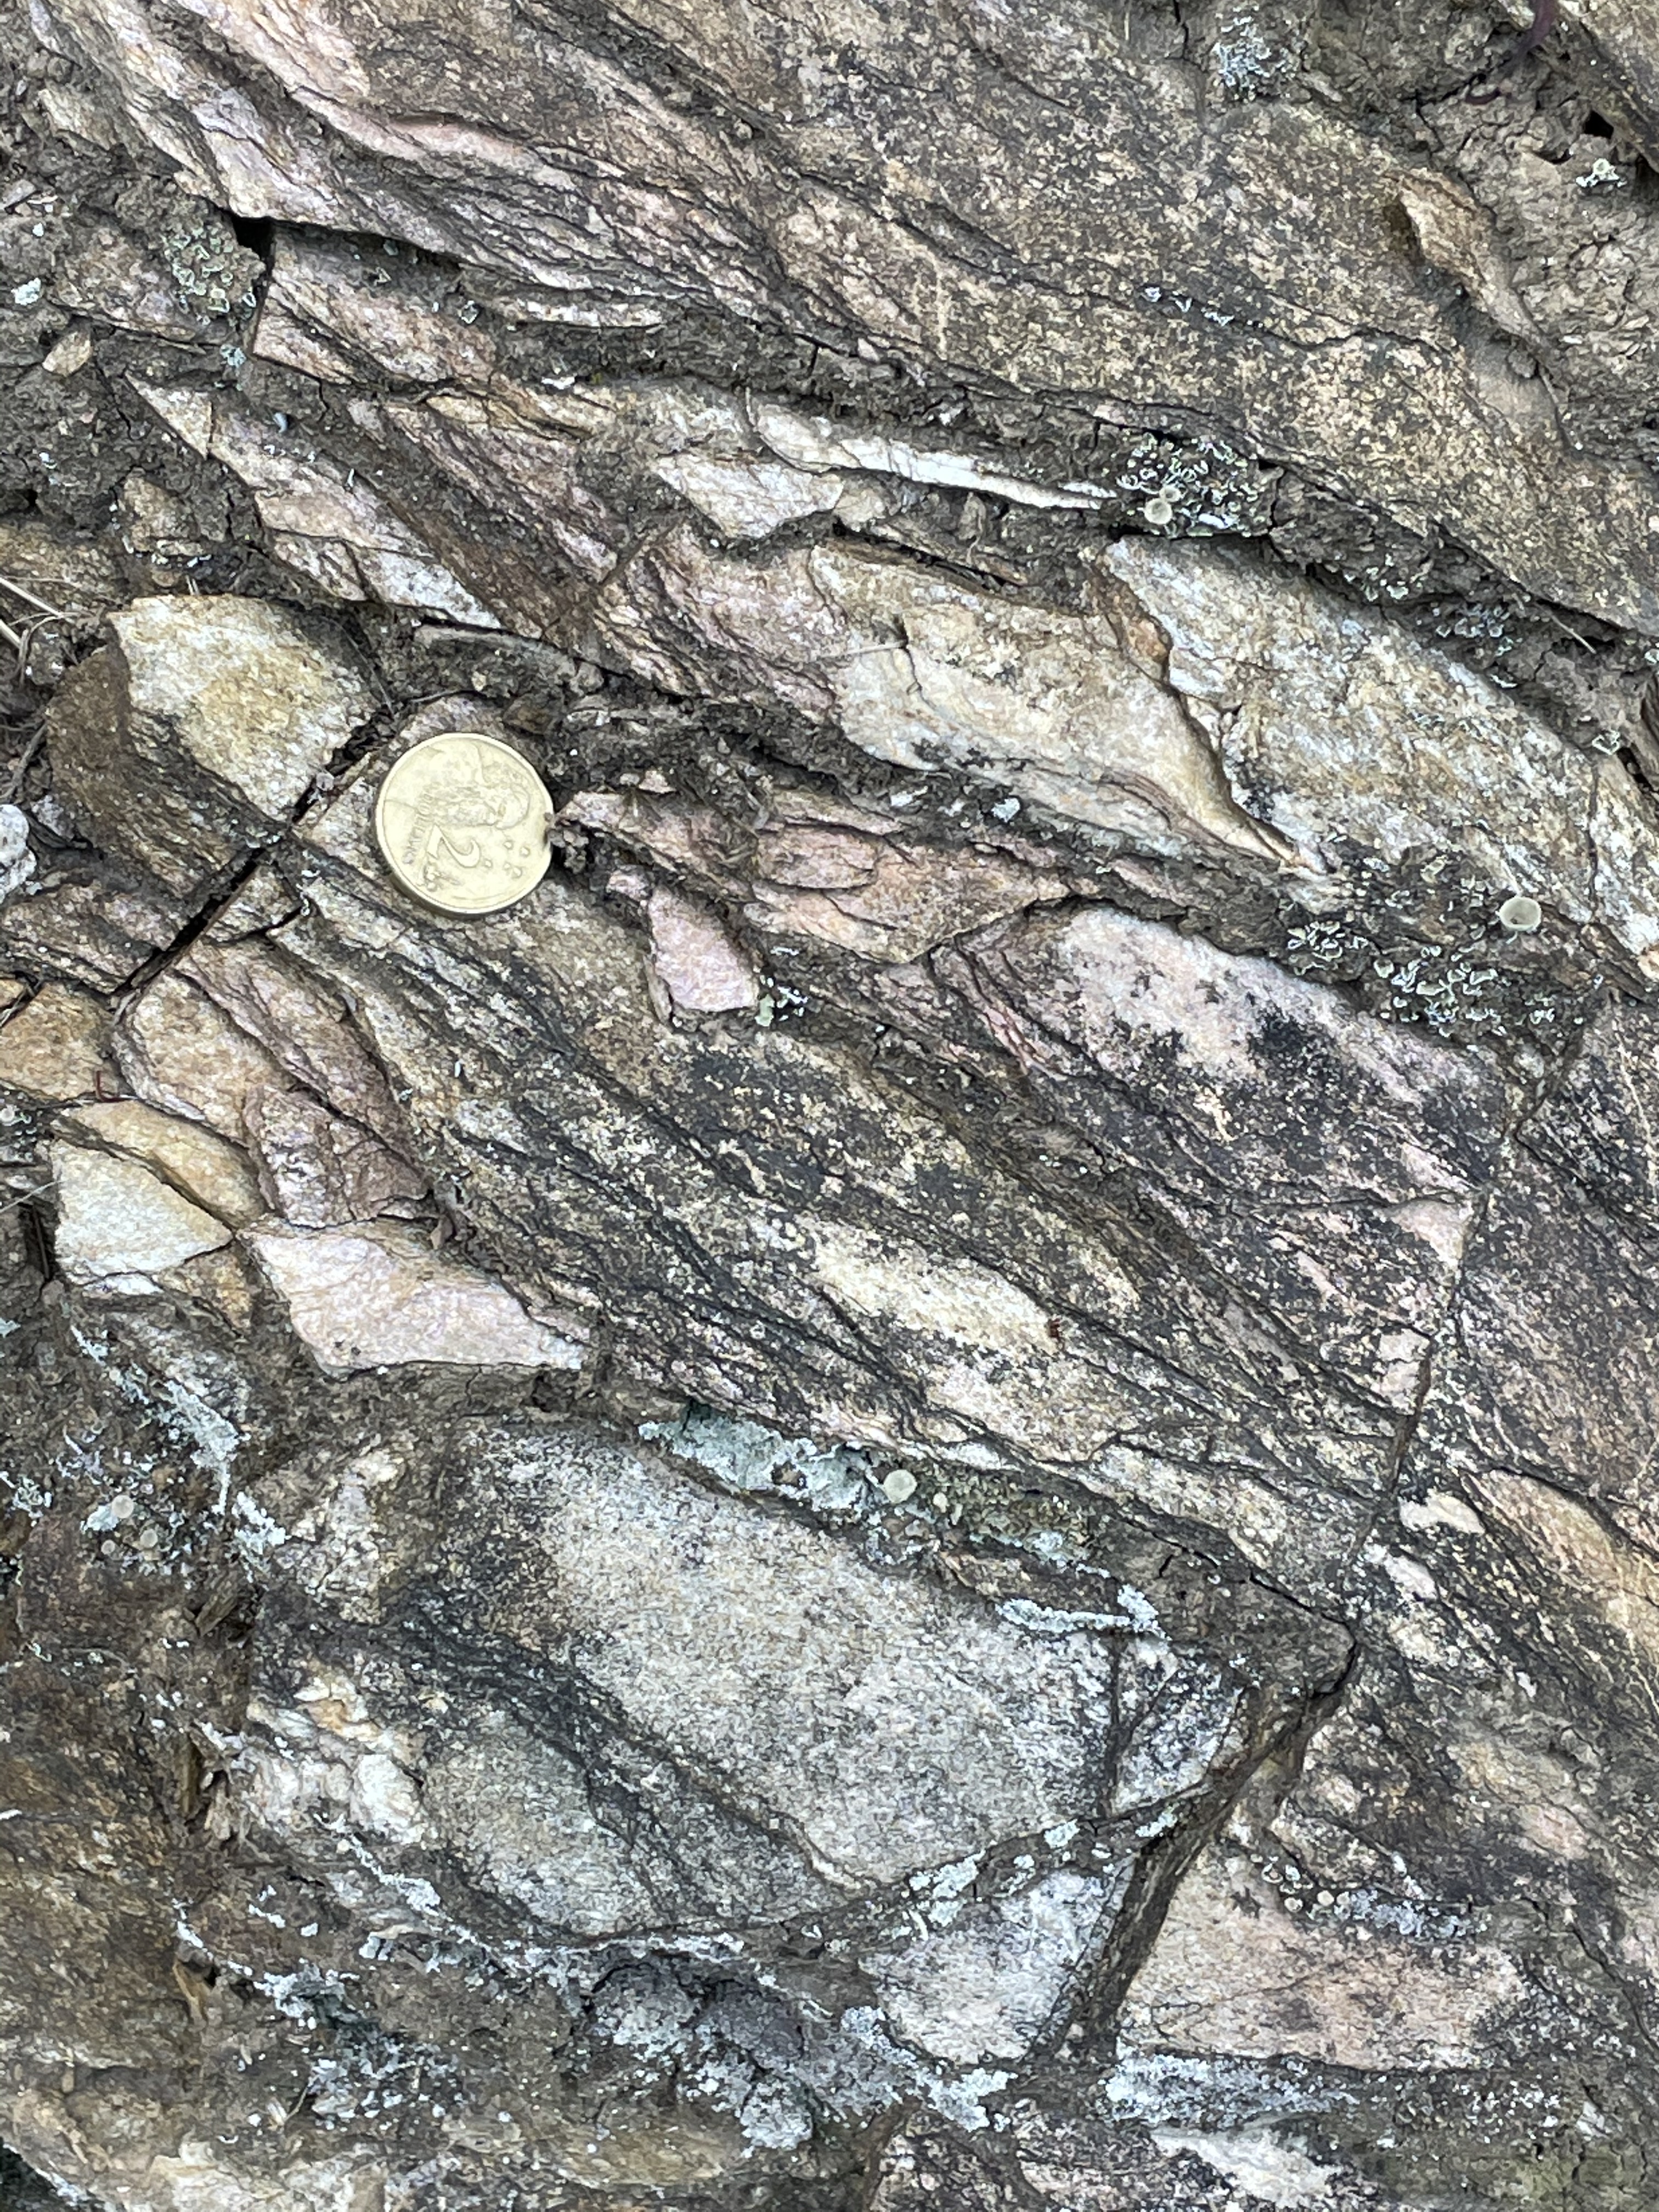 Fig. 5
The rock is not as weathered in this location. The left image is an outcrop scale (~8 feet in height). It reveals more lighter colored sandy rock, presumably from a quartz-rich sediment. The darker color is from surface staining. The right image of Fig. 5 shows the coarser grain size compared to Fig. 3. We now have a reasonable answer to the question of where the dark and light cobbles we saw at Turners Beach in our last post (Fig. 7) originated. They were eroded by glacial action and transported along rivers to what was certainly not the coast at that time. The coastline would have been miles further offshore than today because of a much lower sealevel.
We crossed some volcanic rocks less than 60 MY old (yellow area in Fig. 4A), which tended to fill in lower areas, and entered another region of metamorphic rocks, these showing evidence of remineralization (Fig. 6). Here the rocks showed signs of chemical alteration and differential weathering.
 Fig. 6
The bedding plane surface shown in Fig. 6 reflects either muscovite or pyrite mineralization. Muscovite is a common metamorphic mineral that results from the burial and heating of mud whereas pyrite is injected by igneous rocks into the buried sedimentary rock. We drove a few miles further and discovered some vertical beds and an example of pyritization.
 Fig. 7
Figure 7 shows the original rock, tilted almost vertical (the heavy lines are bedding planes), with a sharp contact with a remineralized and weathered zone, which extends to the top of the exposure where soil is forming. This was probably a fault or plane of flow for hydrothermal liquids, which caused the deposition of pyrite on the left of the remineralized zone (Fig. 8).
 Fig. 8
The silvery (in the image) area is actually “fools gold,” or pyrite. The camera didn’t do a good job. This part of the exposure was covered with it. This is an indication of potential valuable minerals (e.g., gold, silver, copper) in the vicinity.
From Fig. 4A, we used our geologic map app to determine that these are Early Cambrian (509-485 MY) volcanic and volcaniclastic rocks, deposited when the collision with Gondwana beginning and metamorphosed and intruded when the collision was nearing completion, and granite-like rocks were being intruded. Mineral deposits are associate with these kinds of intrusions because they are more developed within the earth’s crust than basaltic rocks.
We continued until we came to Leven Canyon (Fig. 9), where more than 1000 feet of metamorphic rocks are exposed (see Fig. 4B for location). These are rocks originally deposited as more volcanic and sedimentary deposits at the same time (Early Cambrian) as the rocks from Figs. 6-8 (above).
 Fig. 9
Figure 9 extends more than 1000 feet from the top to below the image. It is looking obliquely into the canyon, showing the opposing wall. The black lines indicate approximate bedding planes, which are folded and tilted. These rocks are from the Tyndall Group (the same a Figs. 6-8).
We completed our day’s journey near Cradle Mountain (Fig. 4C), where we found Cenozoic (<60 MY) lava forming a flat surface with low falls in creeks (Fig. 10).
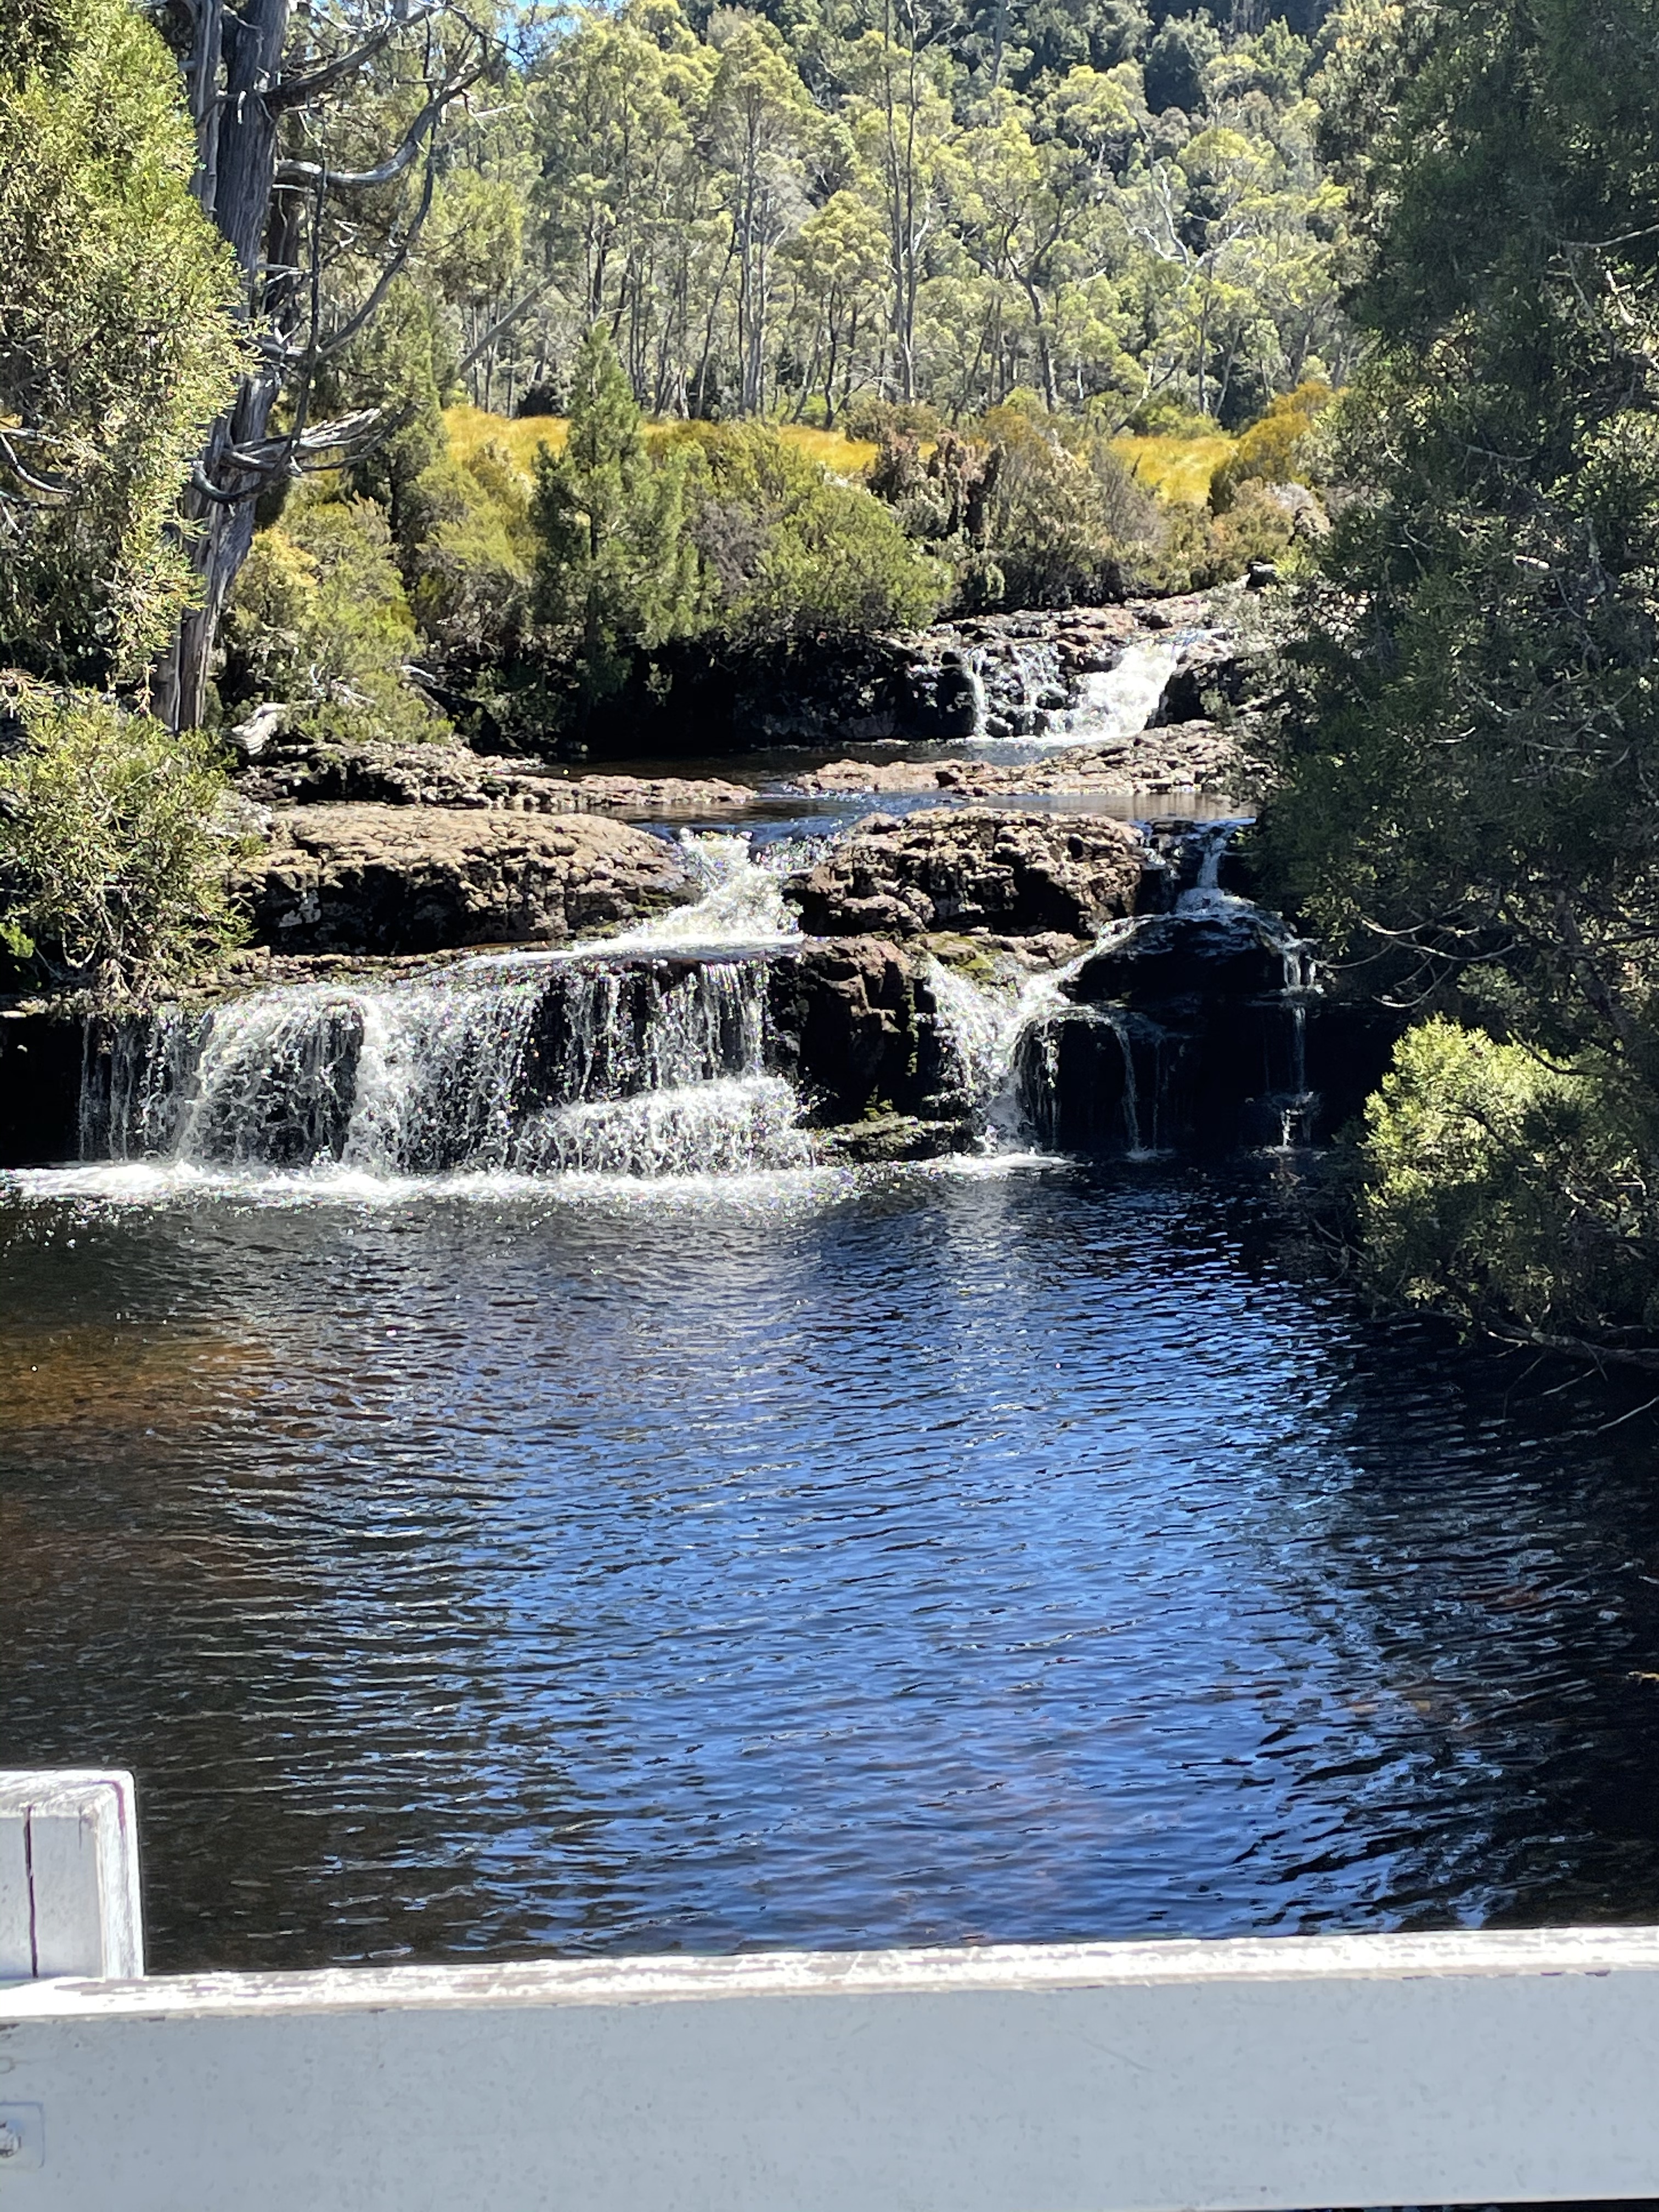 Fig. 10
A short walk up the creek, which formed the contact between the younger basalts and older (509-485 MY) sedimentary rocks, revealed the older rocks. Note the location in Fig. 4C, which shows the location of Fig. 11, where Fig. 10 was taken as well.
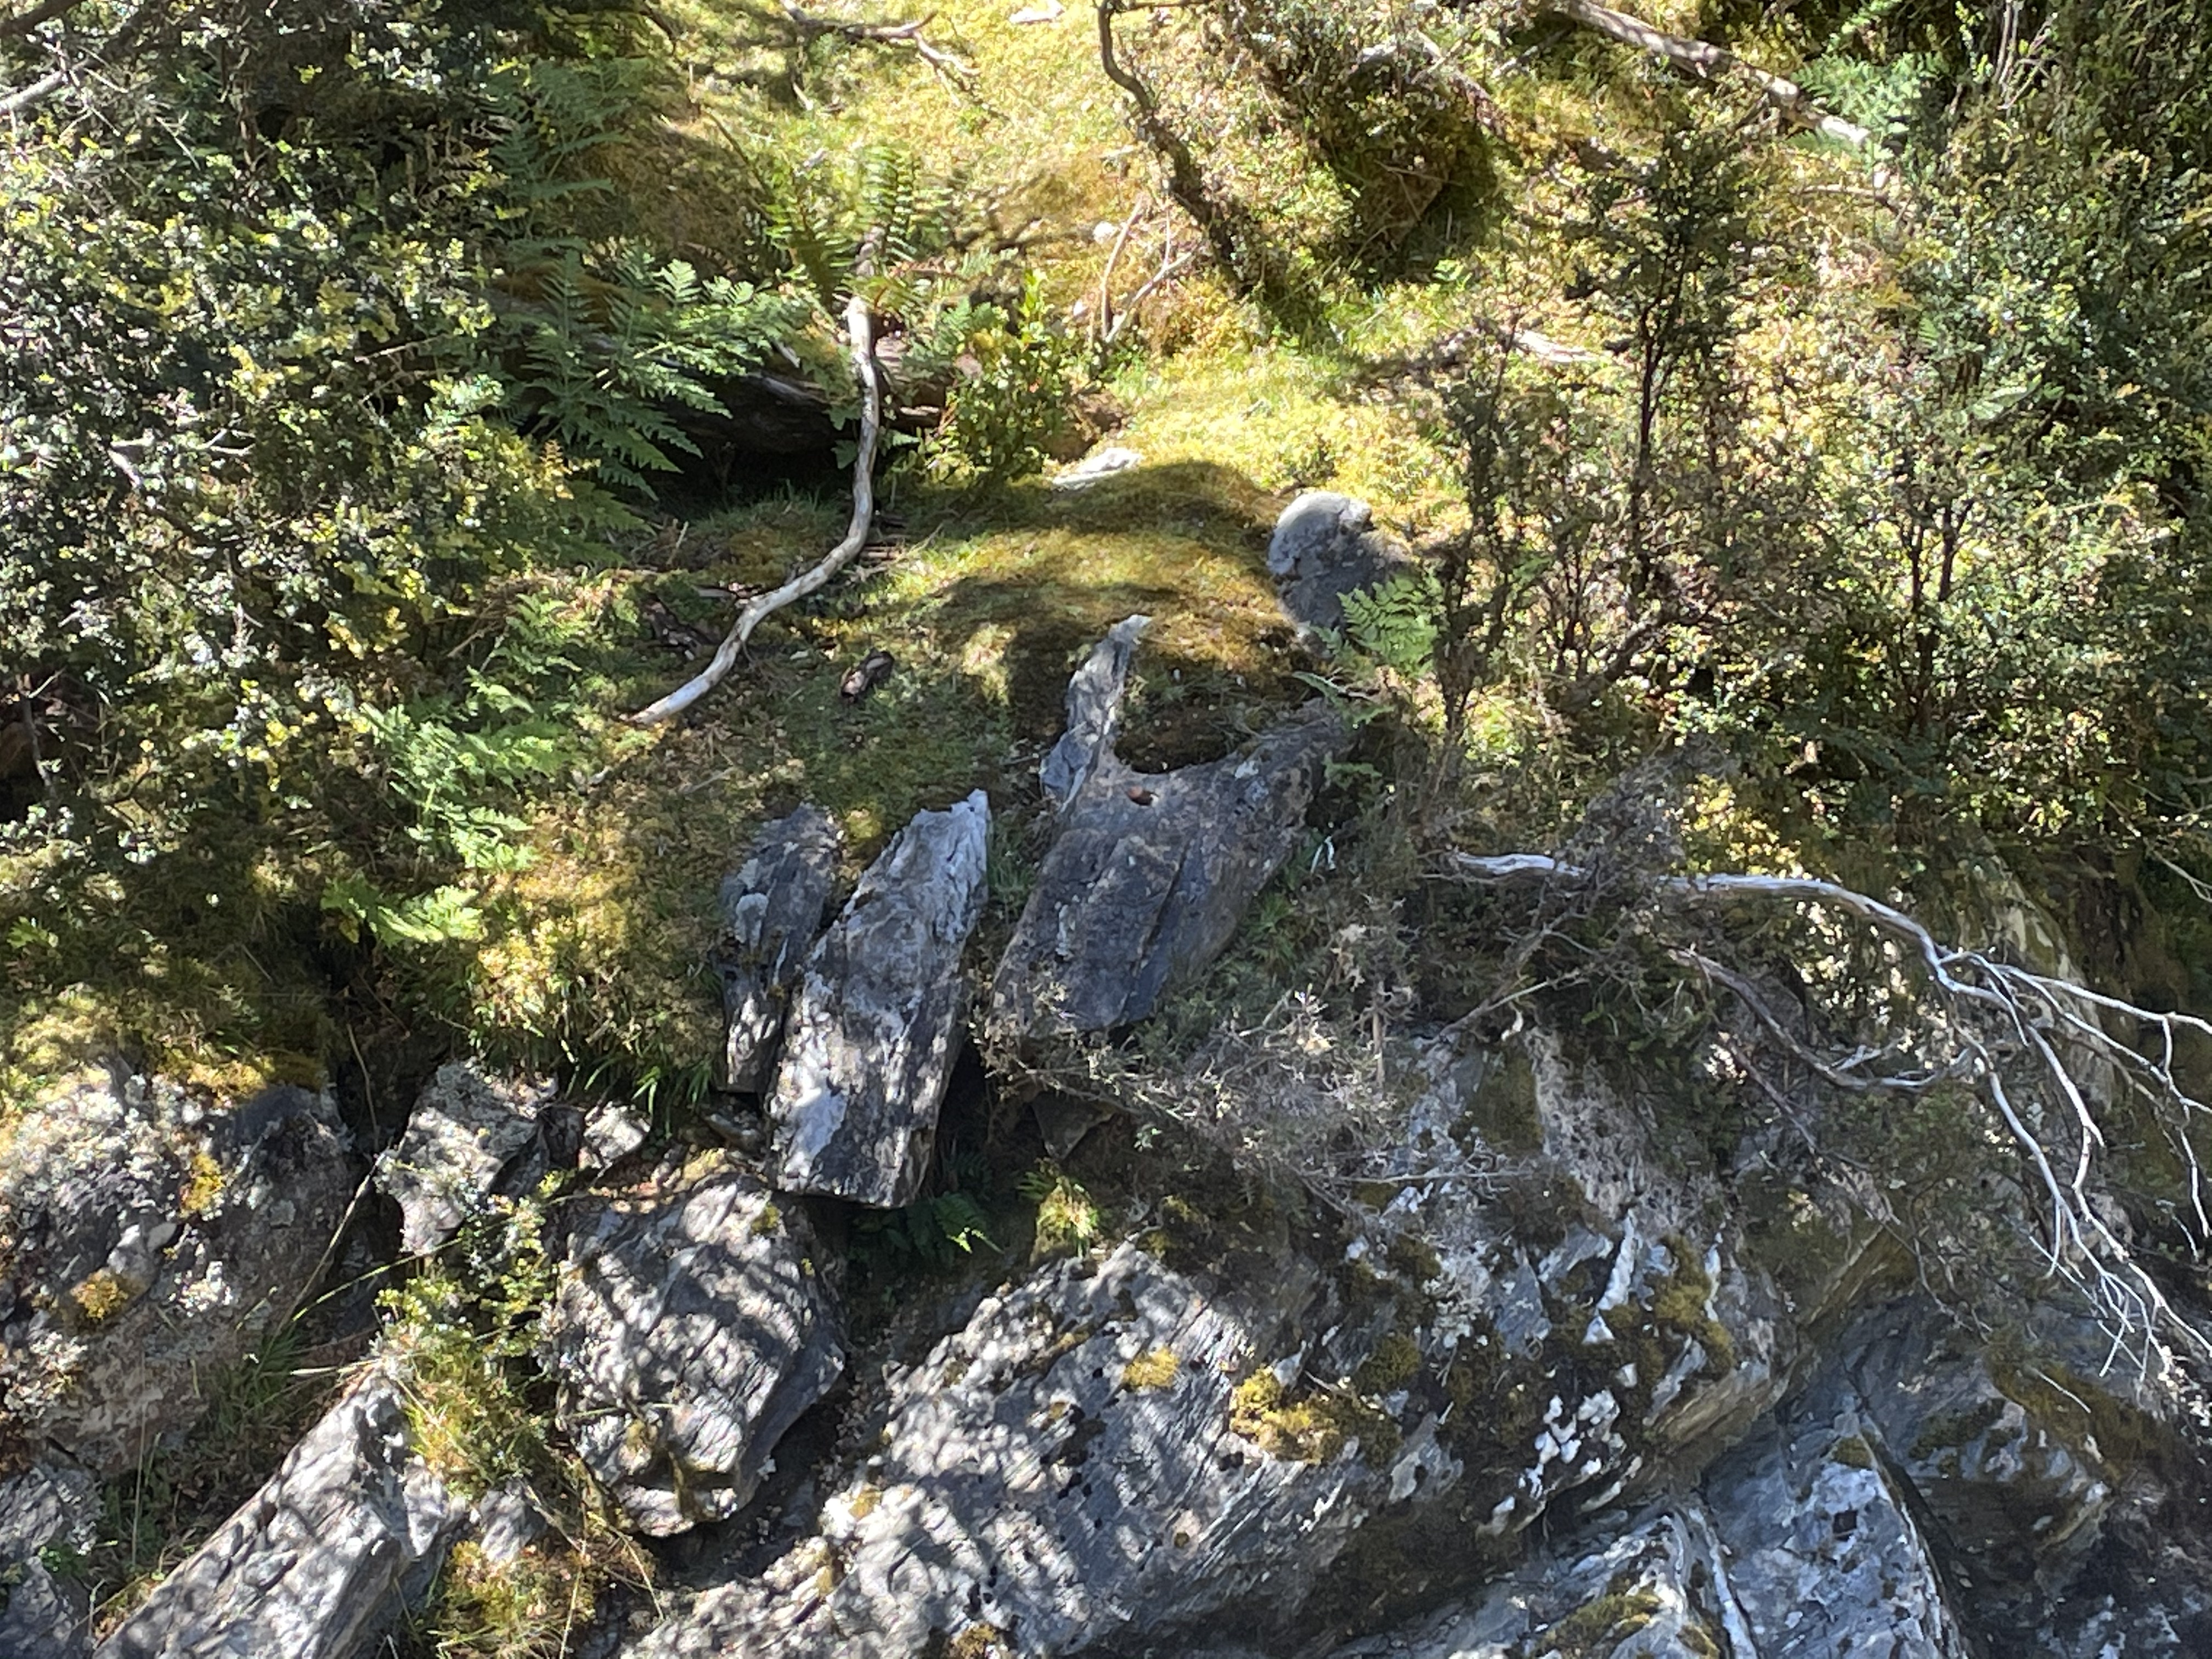 Fig. 11
That was the end of Day One. There’s a lot more to come…
Coming Ashore
The low hills of the north Tasman coast loom in the distance beyond a calm sea as we approach Devonport (Fig. 1).
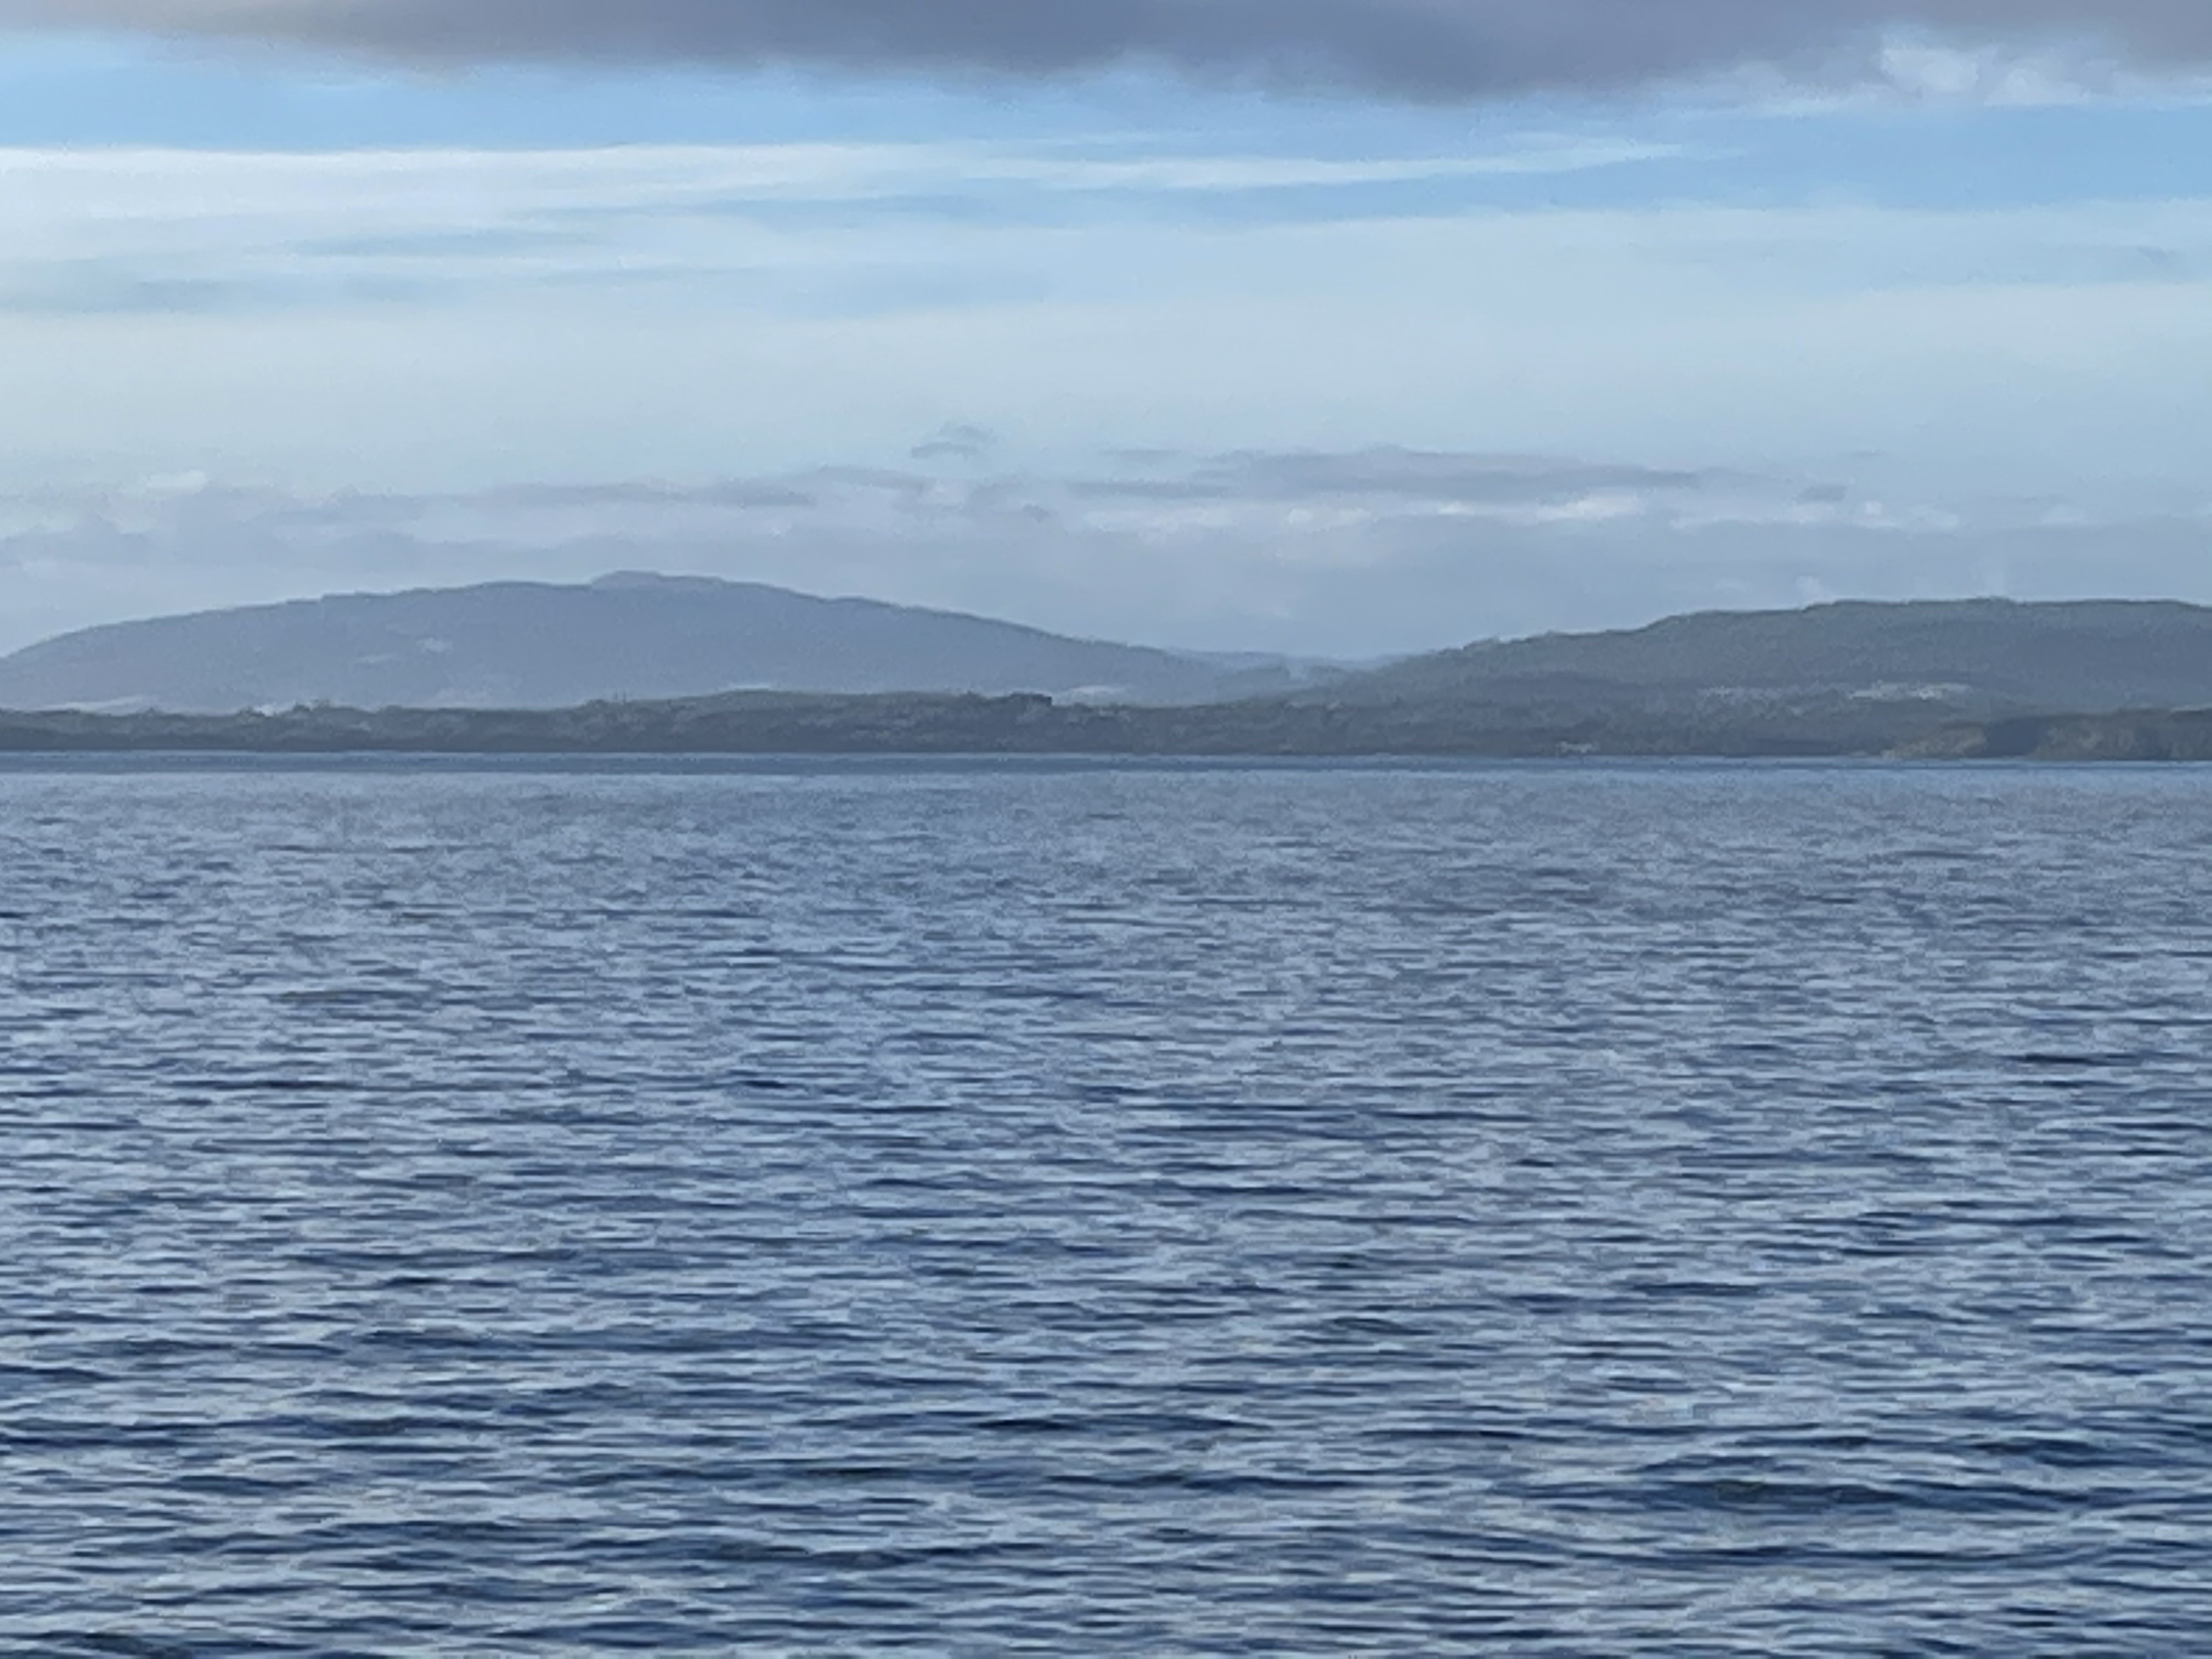 Fig. 1
Figure 1 is looking toward the left side of Fig. 2, just to the right of the word “coast.” Thus, chances are that the hills are associated with the volcanic sequences in Fig. 2.
Fig. 2
We disembarked and headed west along the coast, passing a series of low hills (actually knolls) like those seen in Fig. 3.

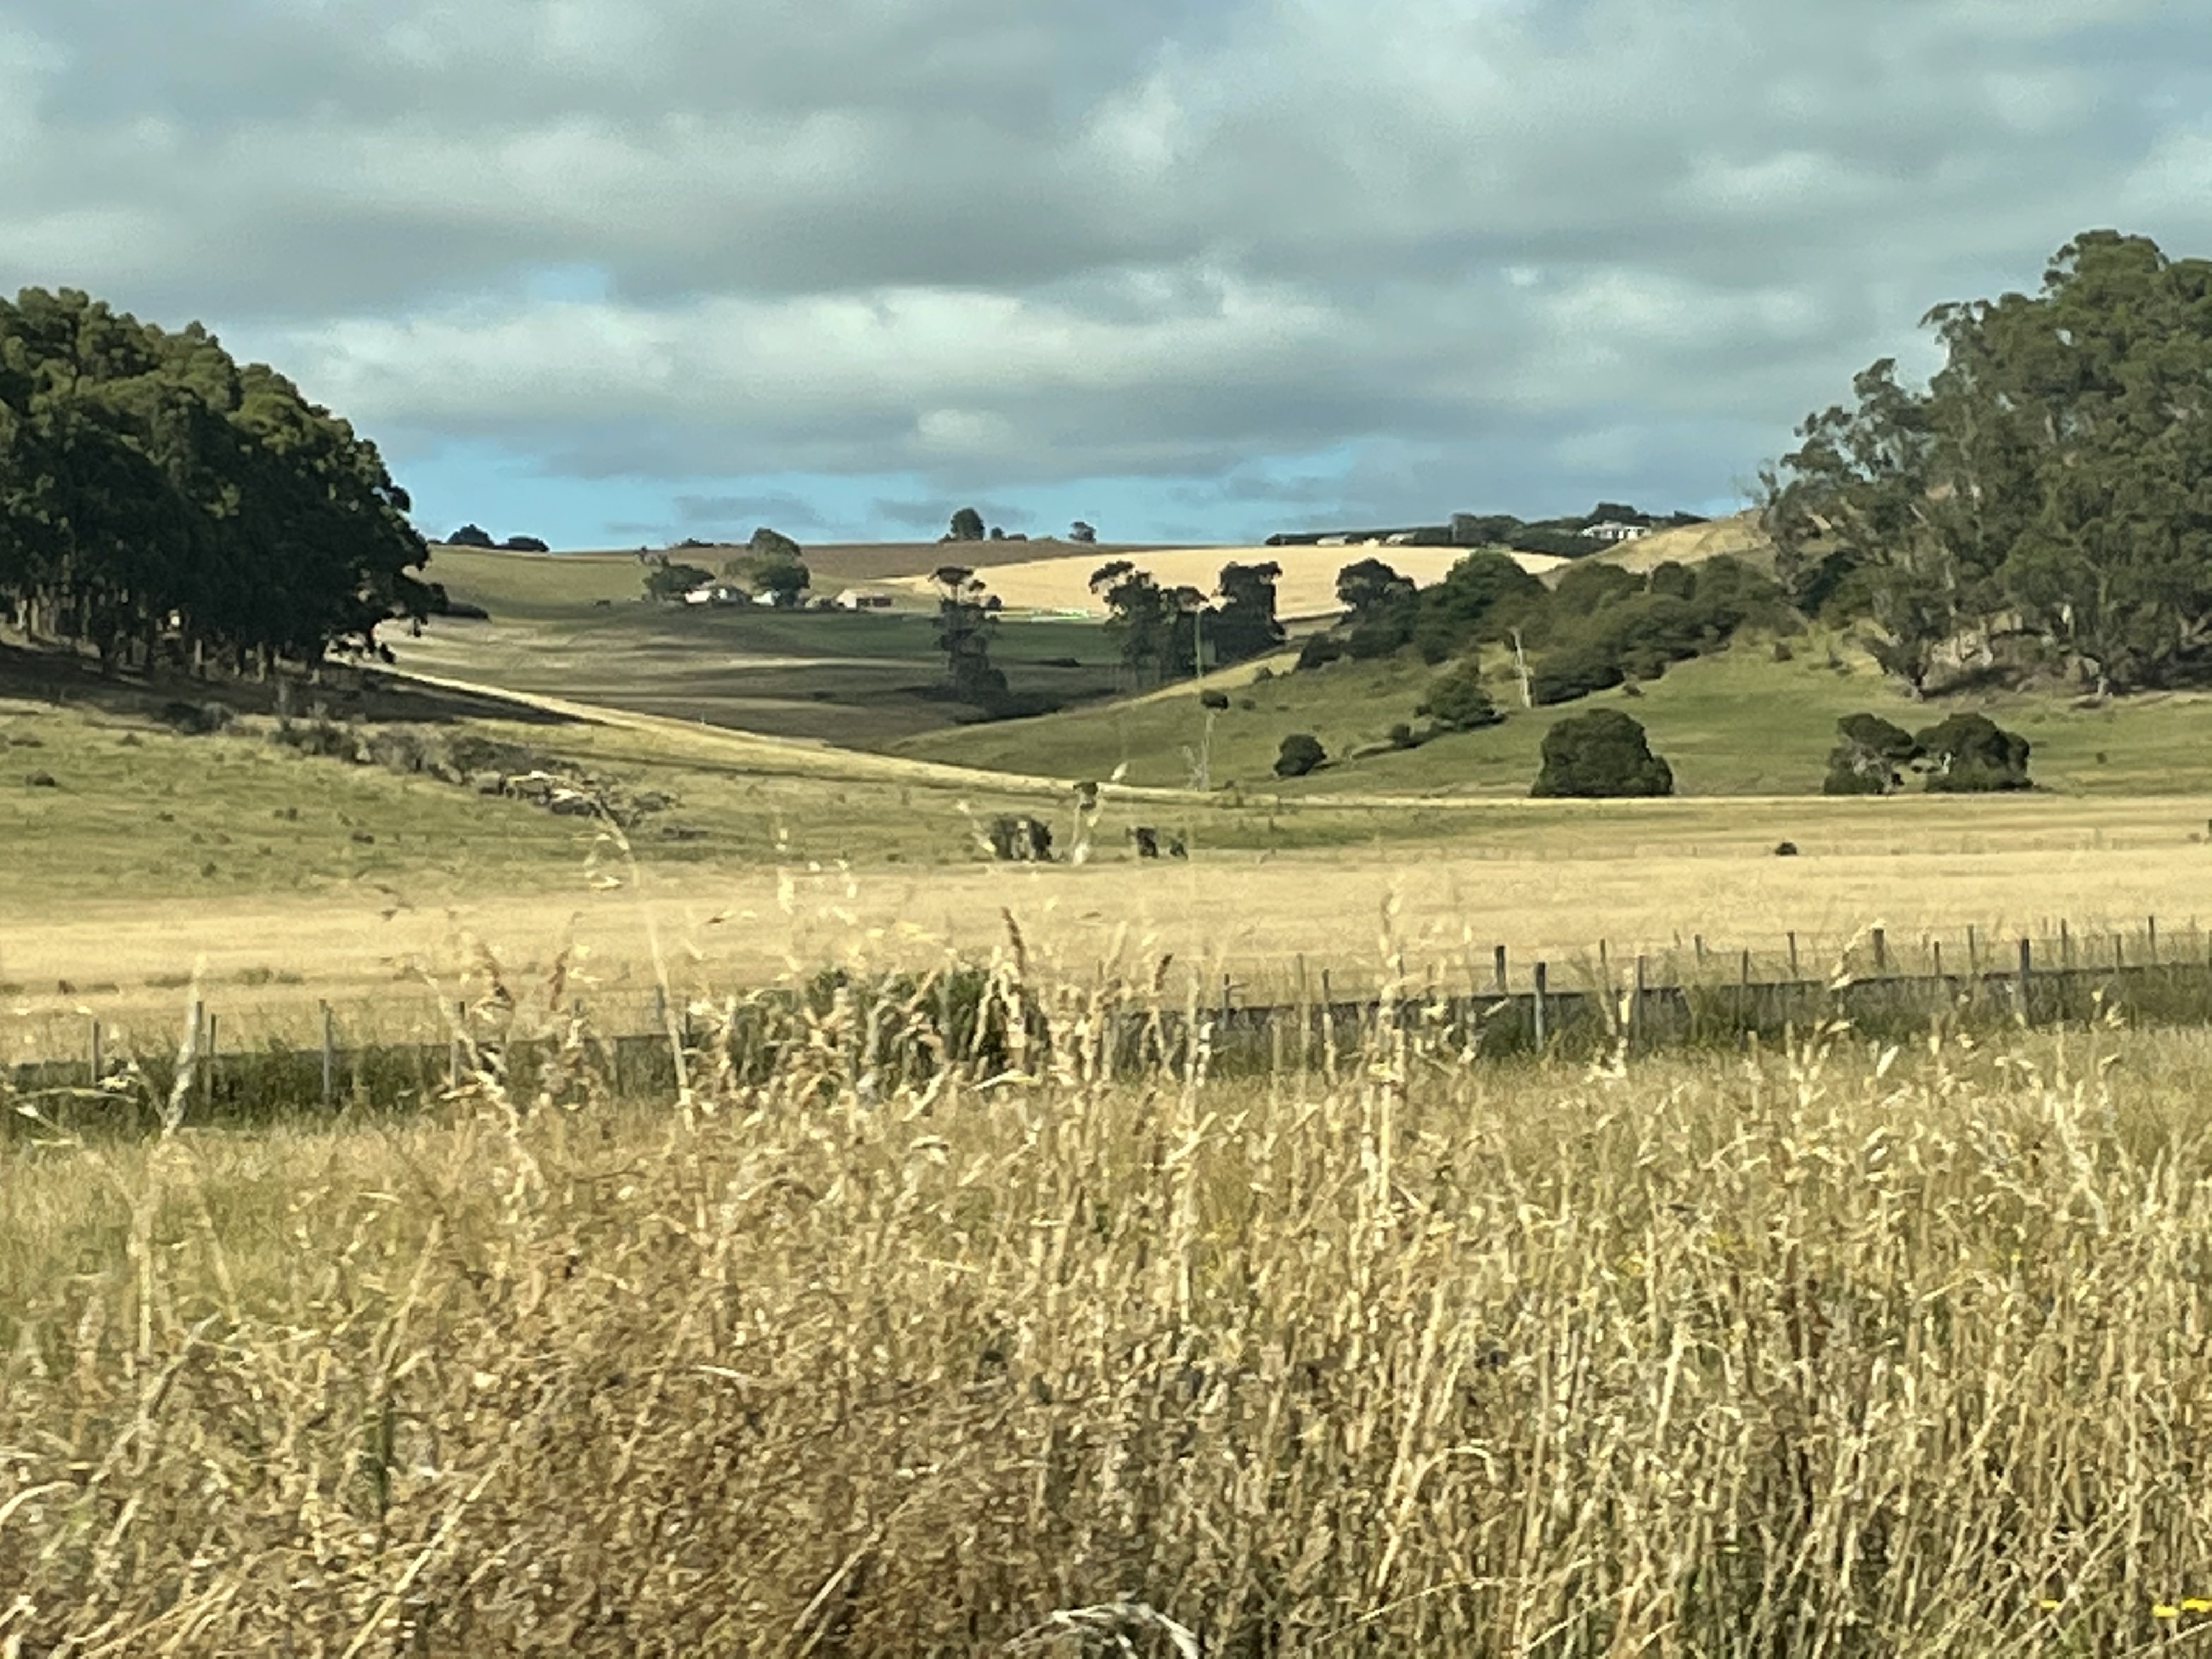 Fig. 3
The left image shows the abruptness of these knolls and the right photo shows how closely they were spaced. There are going to be different causes for any landform like this, but it is very likely that glacial erosion was significant in Tasmania. Figure 4 shows just how extensive ice was during the last glacial maximum; the entire island was buried under ice.
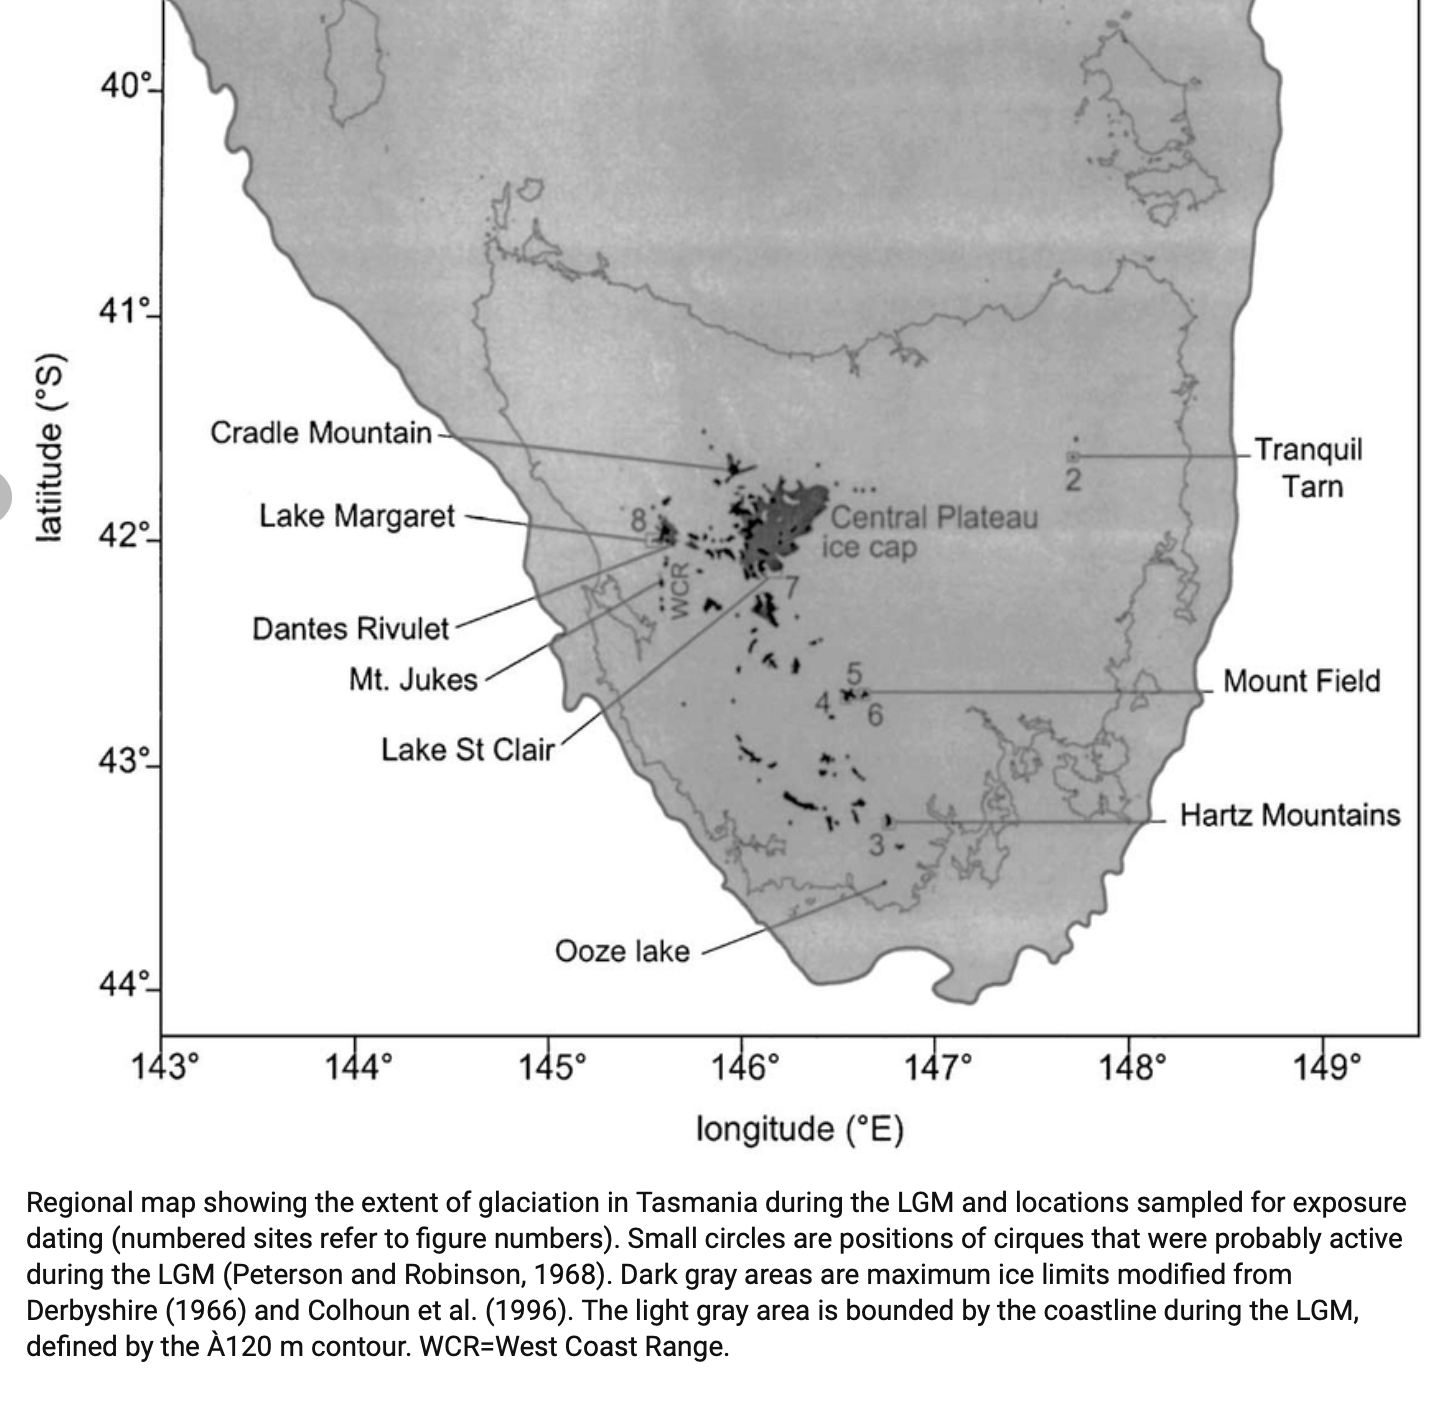 Fig. 4
Shading indicates ice extent. The coast of Tasmania is shown by a thin line and several locations we will be referring to later are labeled, such as Cradle Mountain (Our destination for Day 1). I am not suggesting that the hilly features in Fig. 3 are moraines. We’ll see those features later. But they were probably partly created by the removal of weaker rock by ice action.
When rock is worn down by pieces of rock carried by the ice (rock is much harder than ice, but not rock embedded in ice), and then the ice sheet melts, a variety of materials are left behind. Rocks deposited in this way, which don’t fit into the region’s general geology are called erratics.
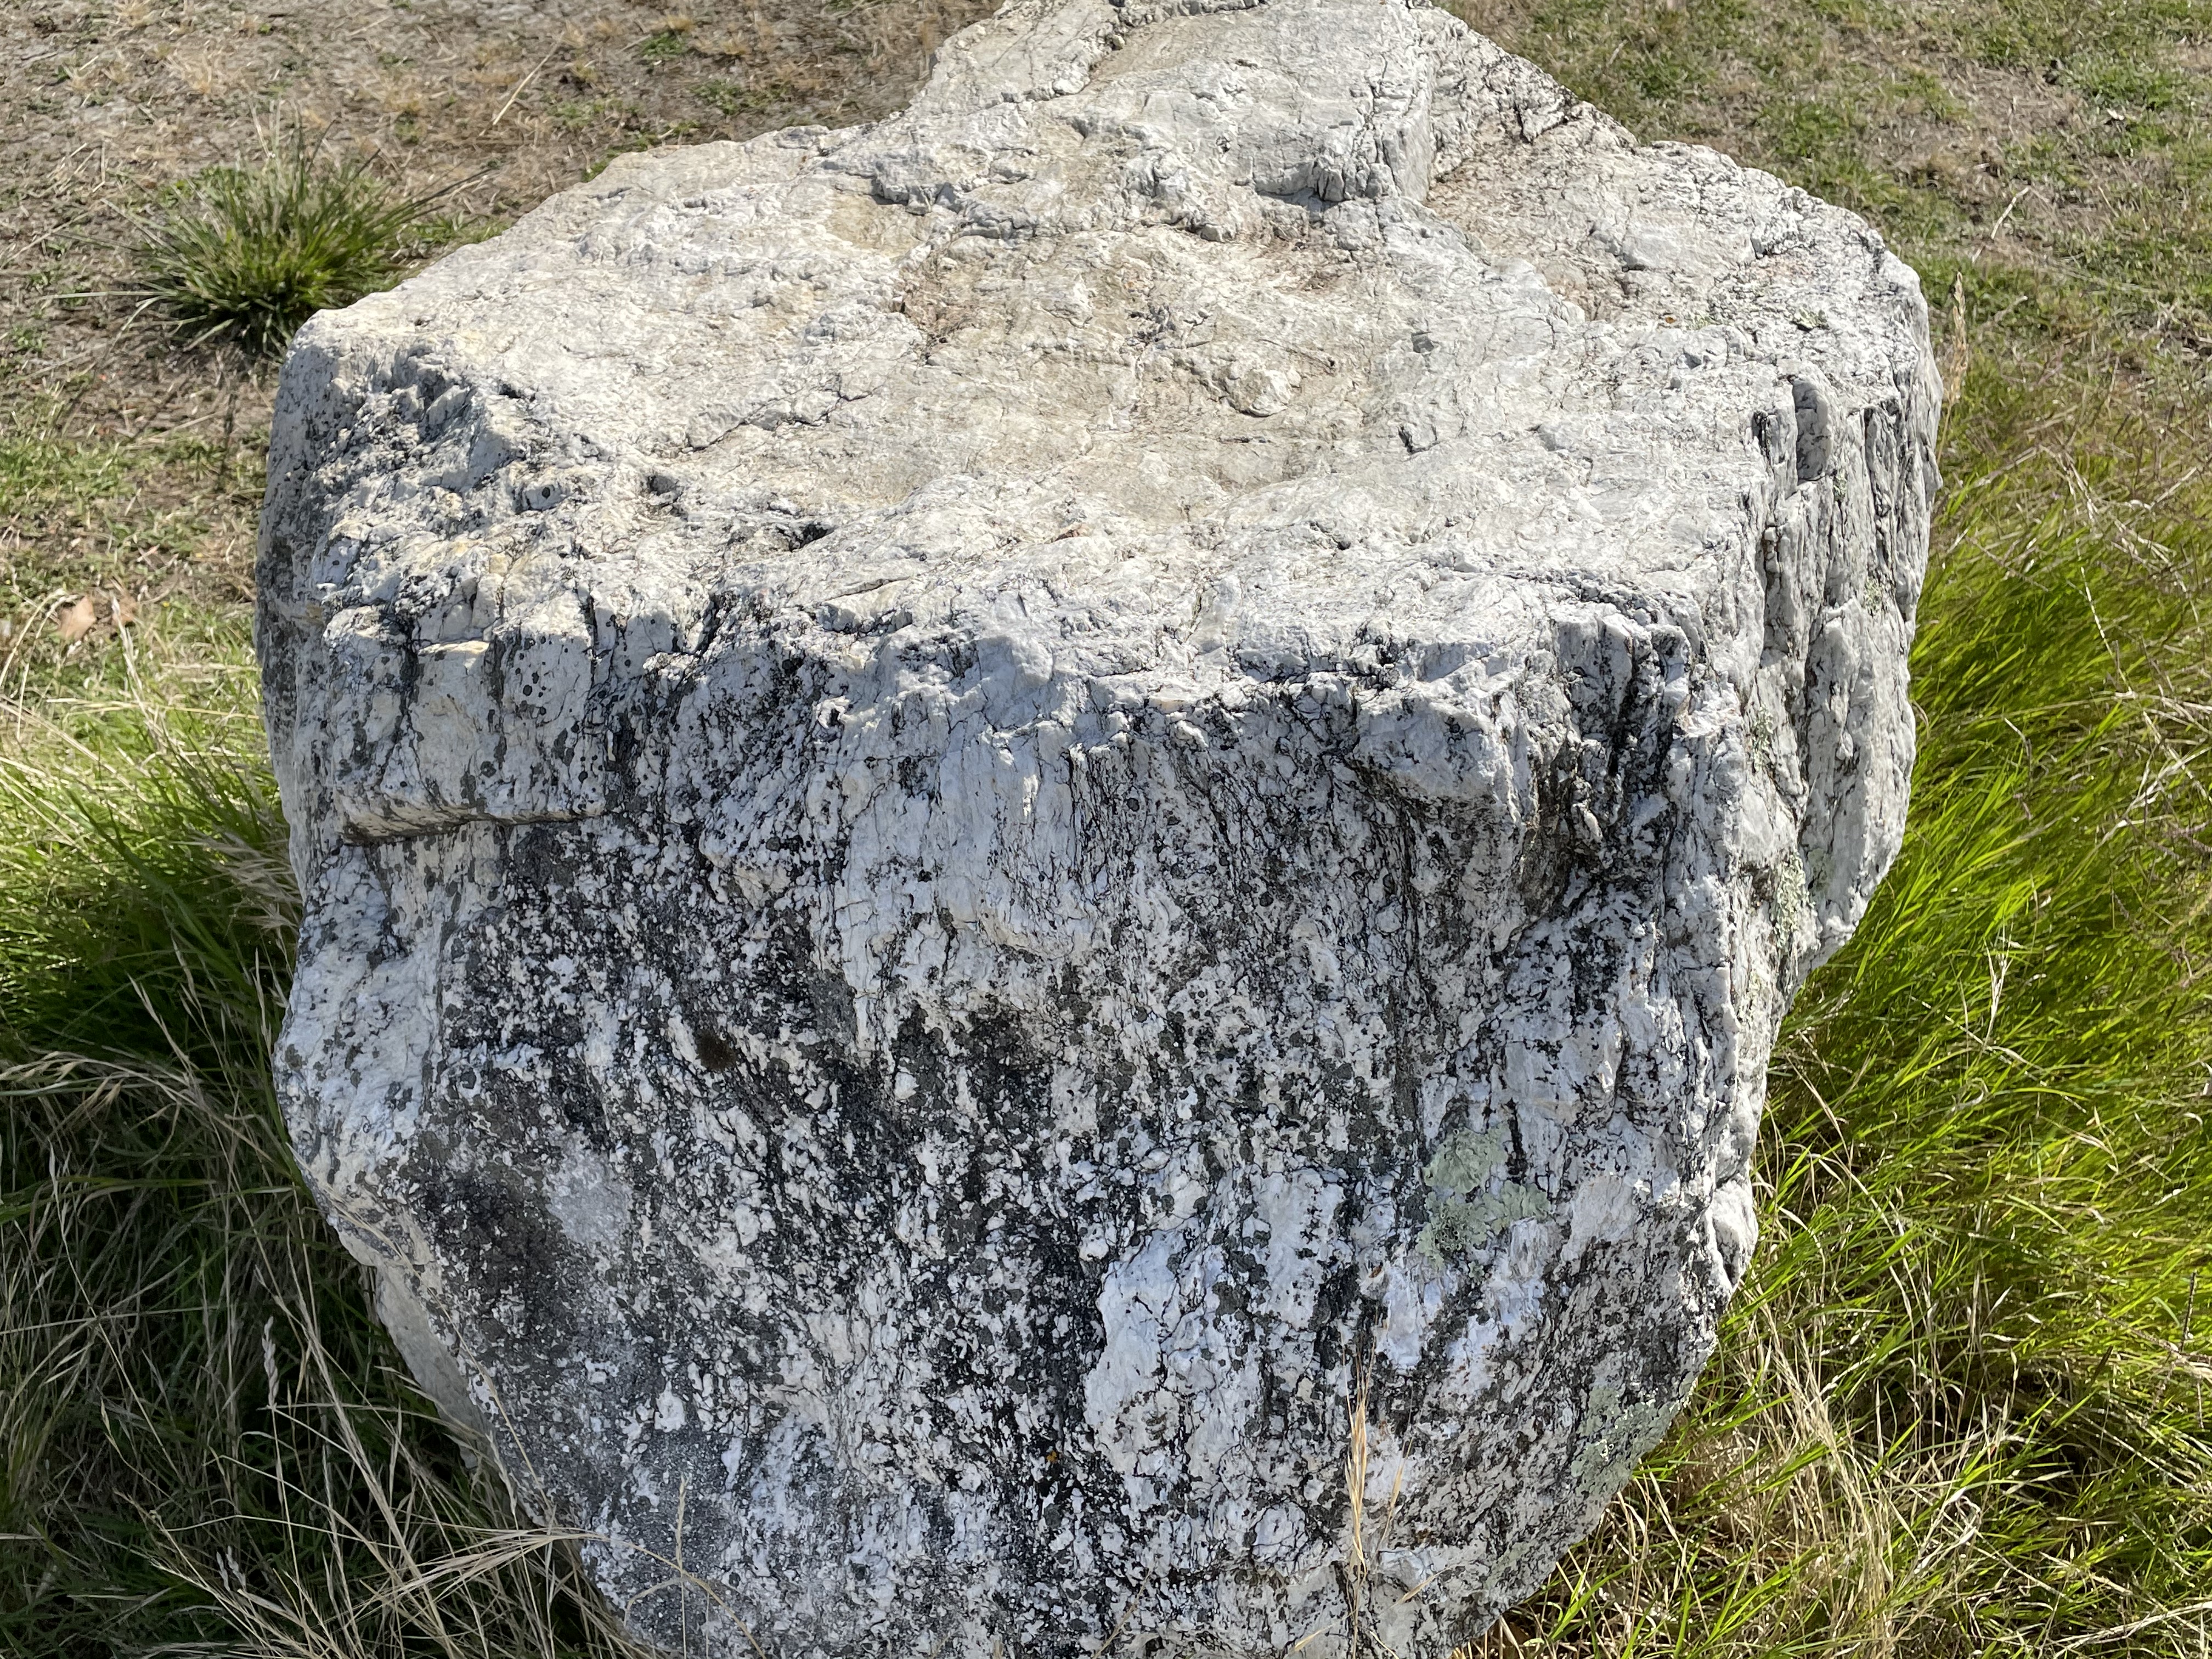 Fig. 5
Figure 5 shows a block of quartzite about 3 feet in diameter. This was a very smooth, hard rock that was sitting next to the parking lot of a public beach called Turners Beach (Fig. 6).

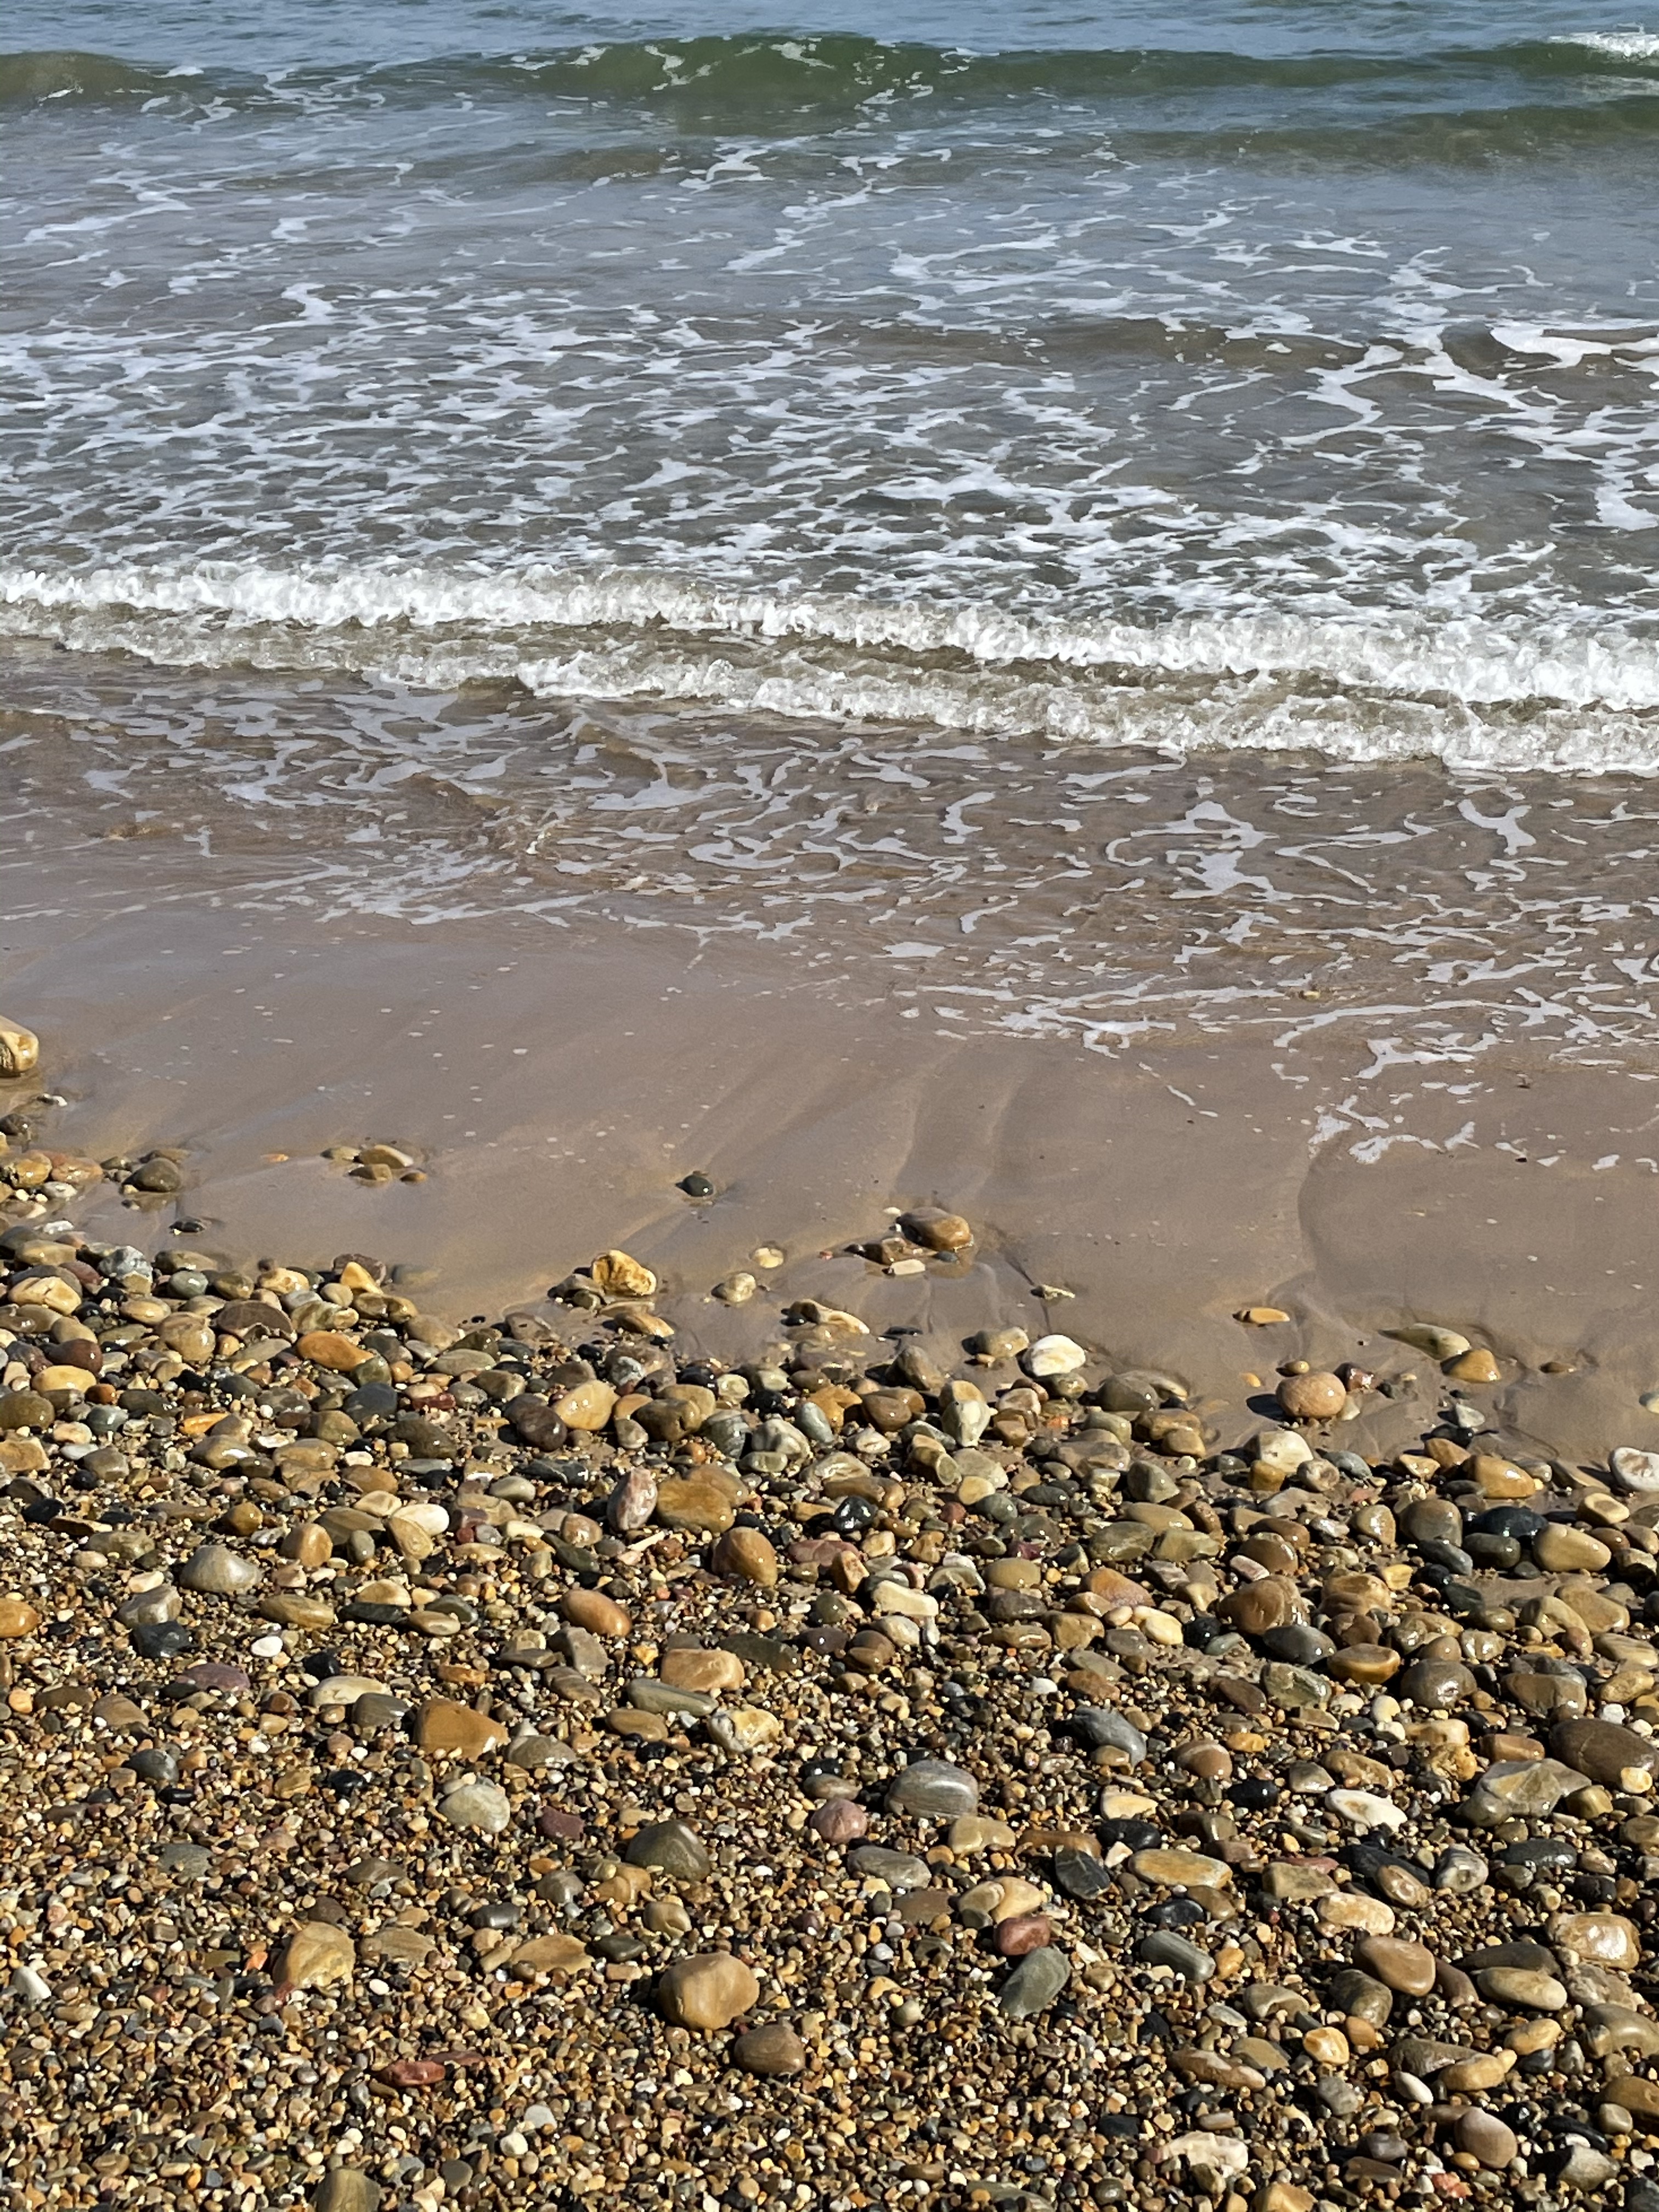 Fig. 6
Turners Beach is a cobblestone beach but it has an interesting feature seen in the right photo of Fig. 6; the swash zone (where the waves lap on the shore) is sandy. The cobbles are covered by sand in the wave-dominated zone. This suggests that the cobbles are being reworked and there is no current source, which of course there isn’t. There are no bluffs of conglomerate being eroded. There is no fast flowing river, fed by seasonal ice melt at the front of a glacier. There is no active source of sediment along this stretch of coast and everything is relict (leftover), so the fine-grained material is being winnowed on the shoreface as the cobbles look on with disinterest, piled into an armored berm by occasional storm waves.
Let’s take a closer look at the cobbles, to see what they tell us about the source of these sediments (Fig. 7).
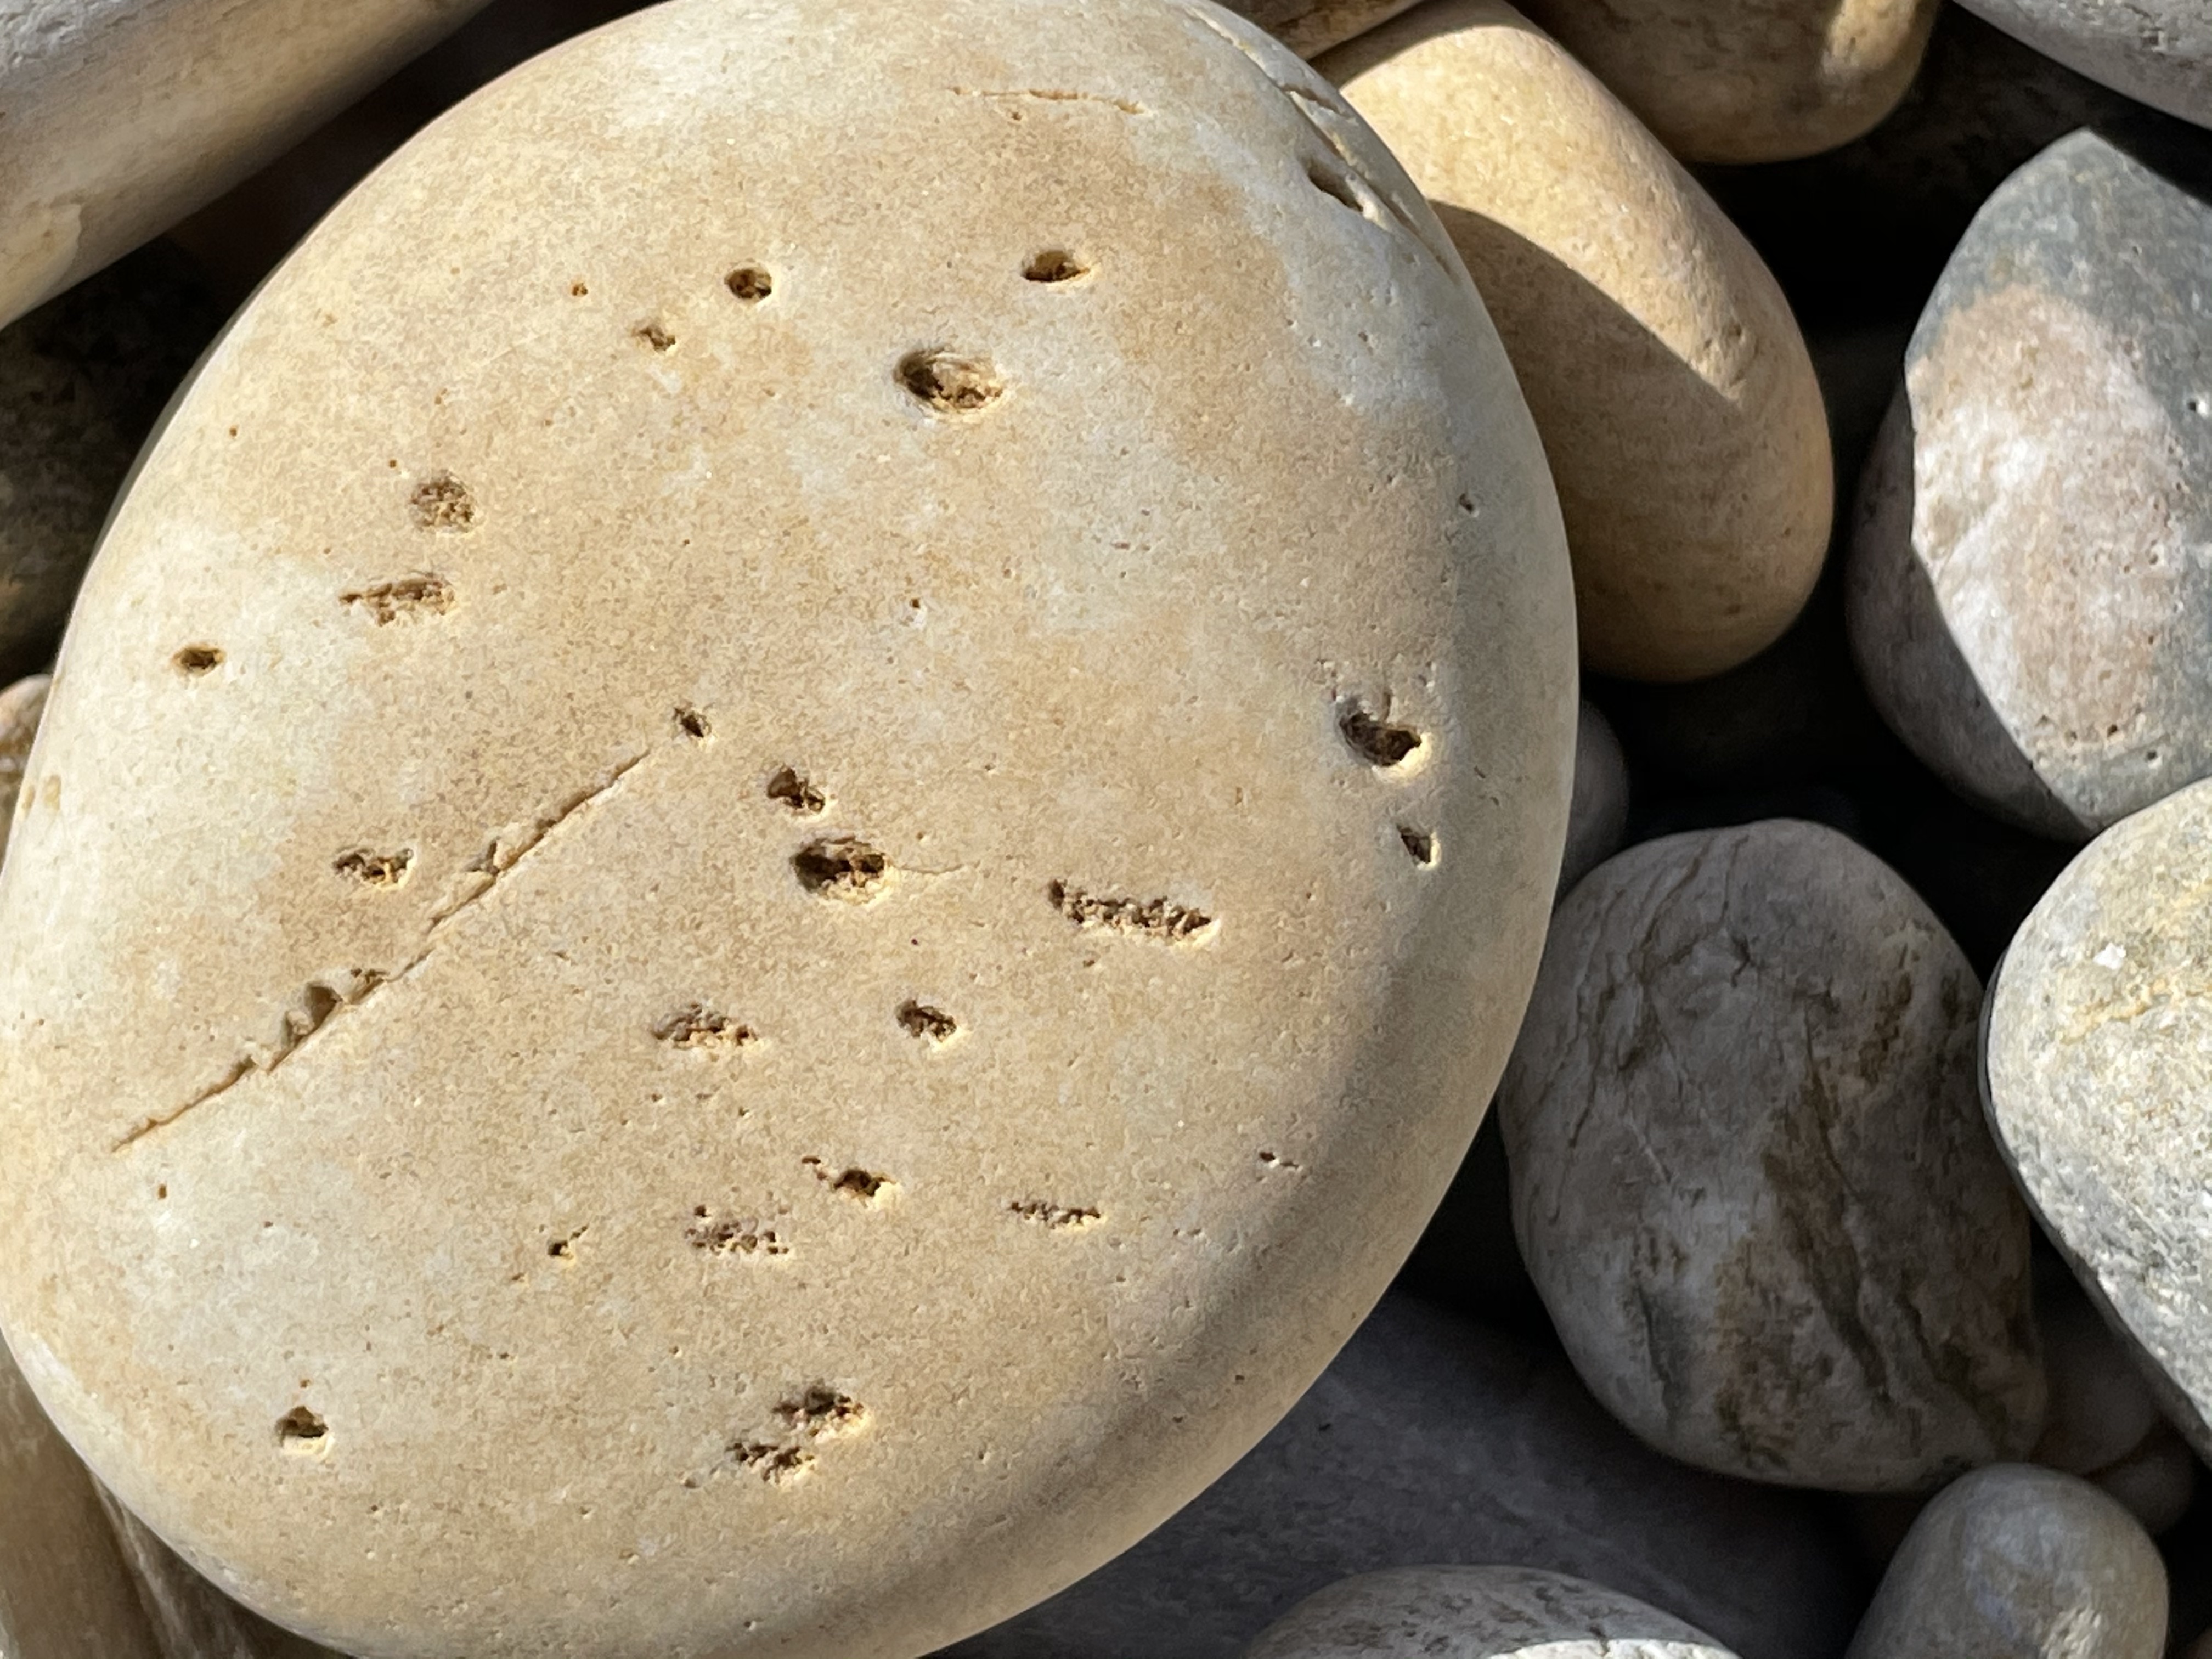
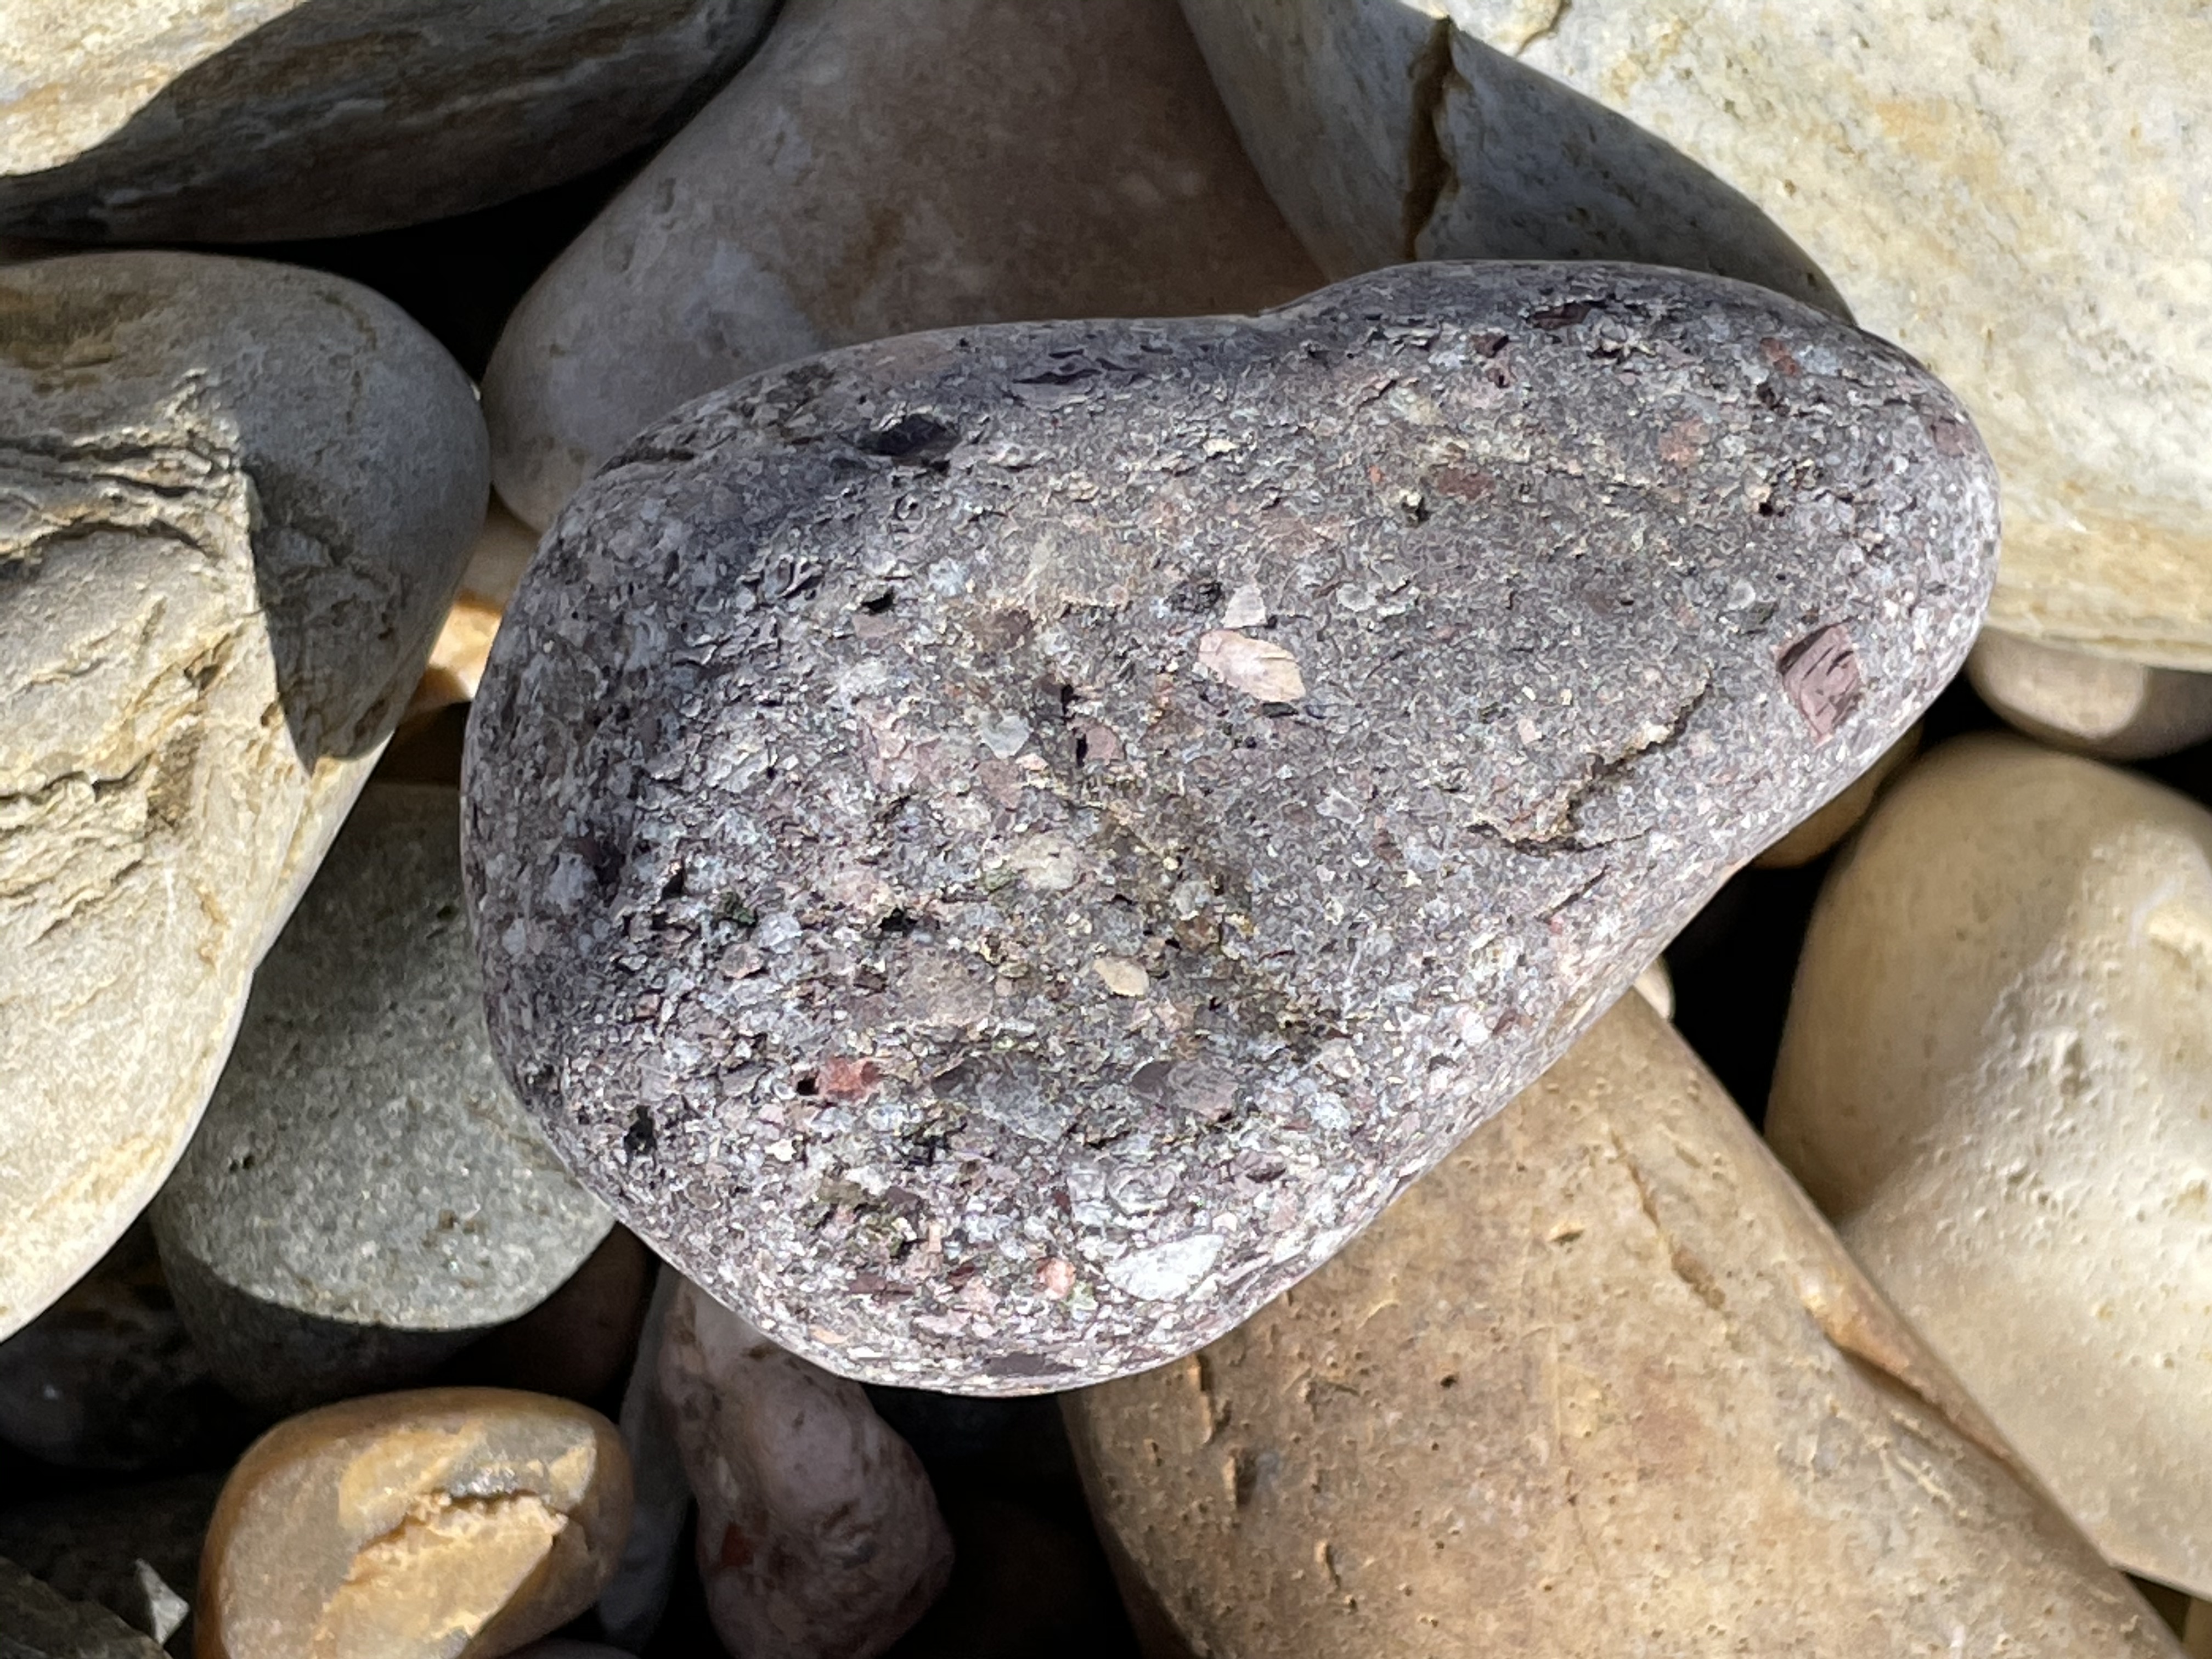 Fig. 7
Without thin-sections or a fresh hand sample, broken with a hammer and examined with at least 10x magnification, I can only speculate, but I’ll cheat a little. The left image is probably derived from a source like the boulder shown in Fig. 5. To go from a block to a rounded cobble about 4 inches in diameter requires ~10 miles of transport in a rocky, high-flow stream (I’m trusting my memory so this is an estimate). The second image shows a dark rock that is more irregular in shape. This is probably a metamorphosed volcanic rock.
Not all of the cobbles were sub-round, however; Fig. 8 shows elongate rocks, both light and dark colored, and a range of sizes. This suggests multiple sources, with respect to transport path, and different residence times in the transport system of steep creeks and rivers.
 Fig. 8
Keep in mind when looking at Figs. 5 through 8, that the world in which they were broken away from older rocks was exposed to thick ice that was spreading from the central part of the island (at higher elevation) and sliding towards the coast. Even during an ice age, there would have been catastrophic melting at the edge as the ice moved northward (see Fig. 4). This movement would have continued for millennia, with transport beneath the ice sheet in buried streams.
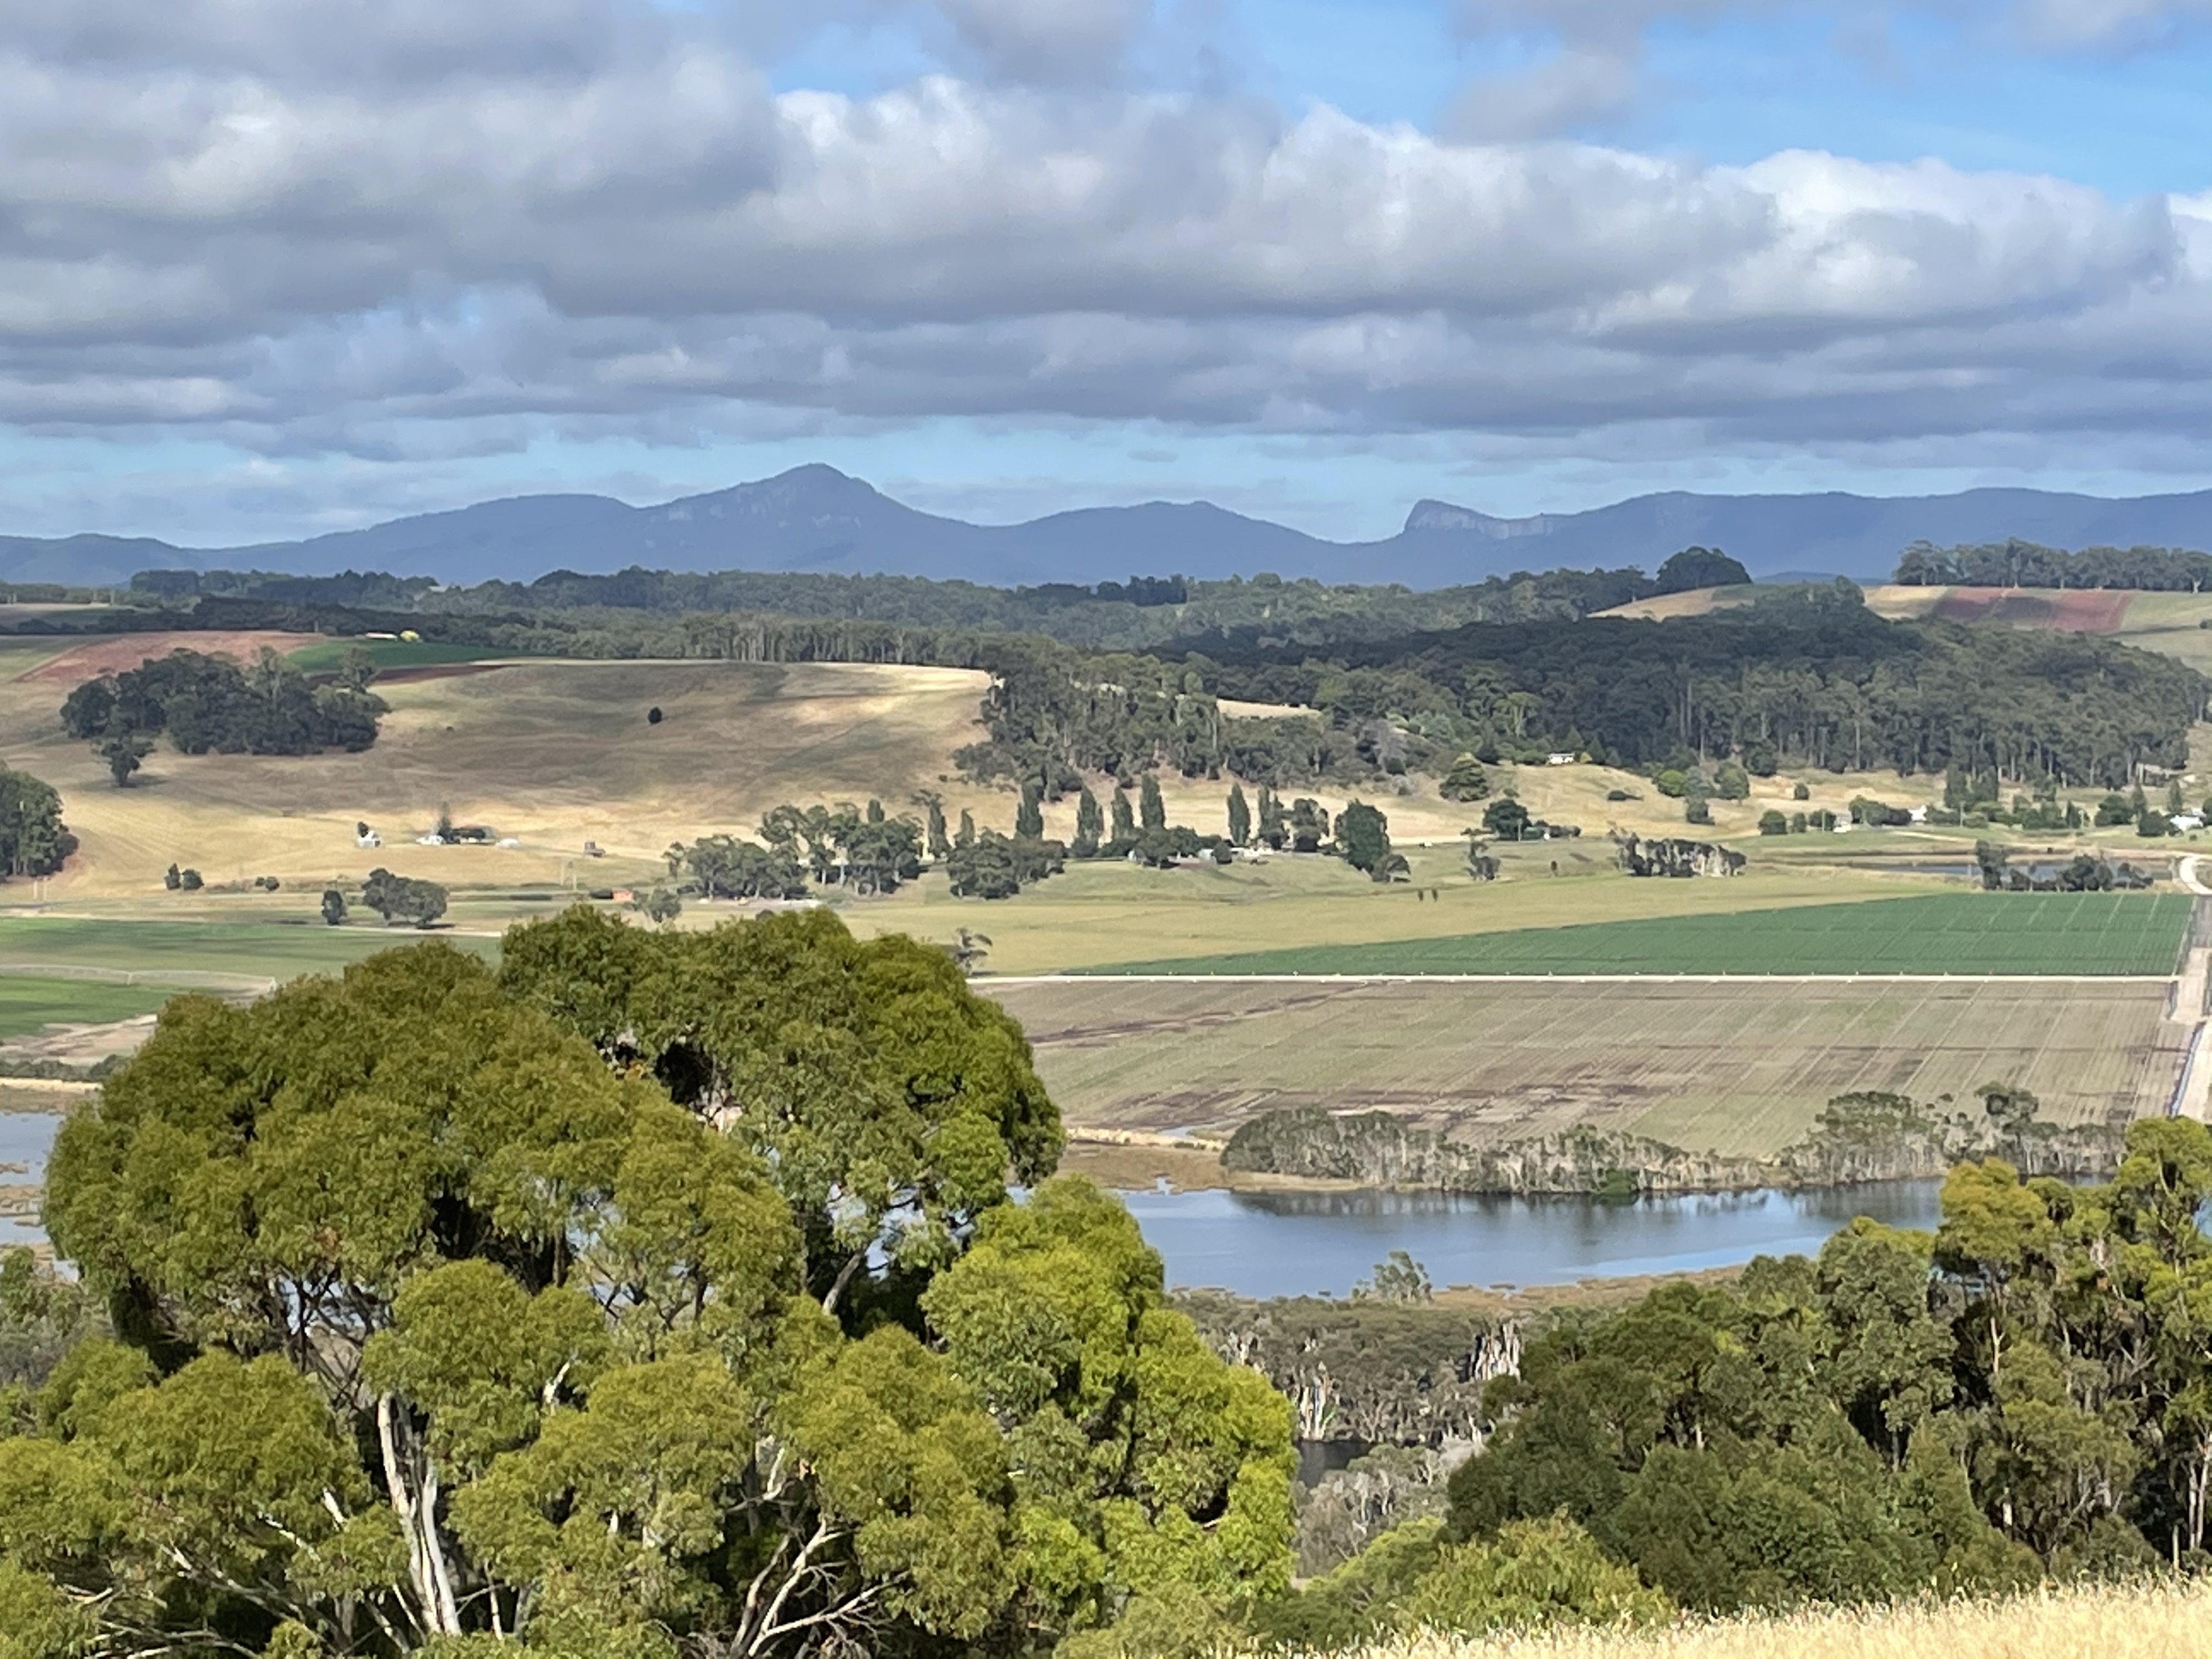 Fig. 9
Figure 9 shows the resulting topography from thick ice flowing (glacially, excuse the pun) over rocks as old as 1.2 BY, which had already been metamorphosed and damaged by brittle deformation during several orogenies. There were weak points, which gave way to the relentless advance of the ice.
I’ll stop here before we get into the source of the cobbles we saw at Turners Beach.

Recent Comments