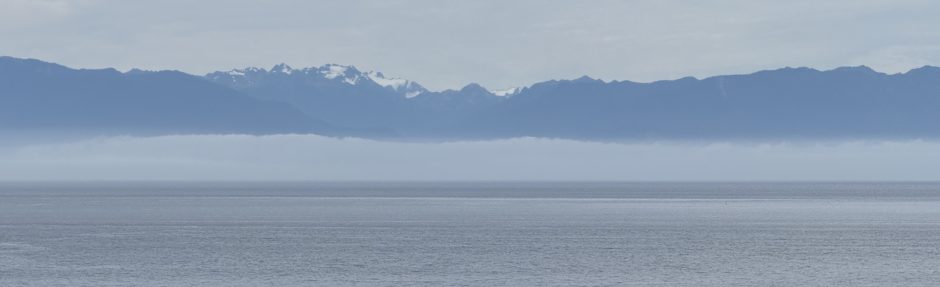
Cloistered in Washington Heights
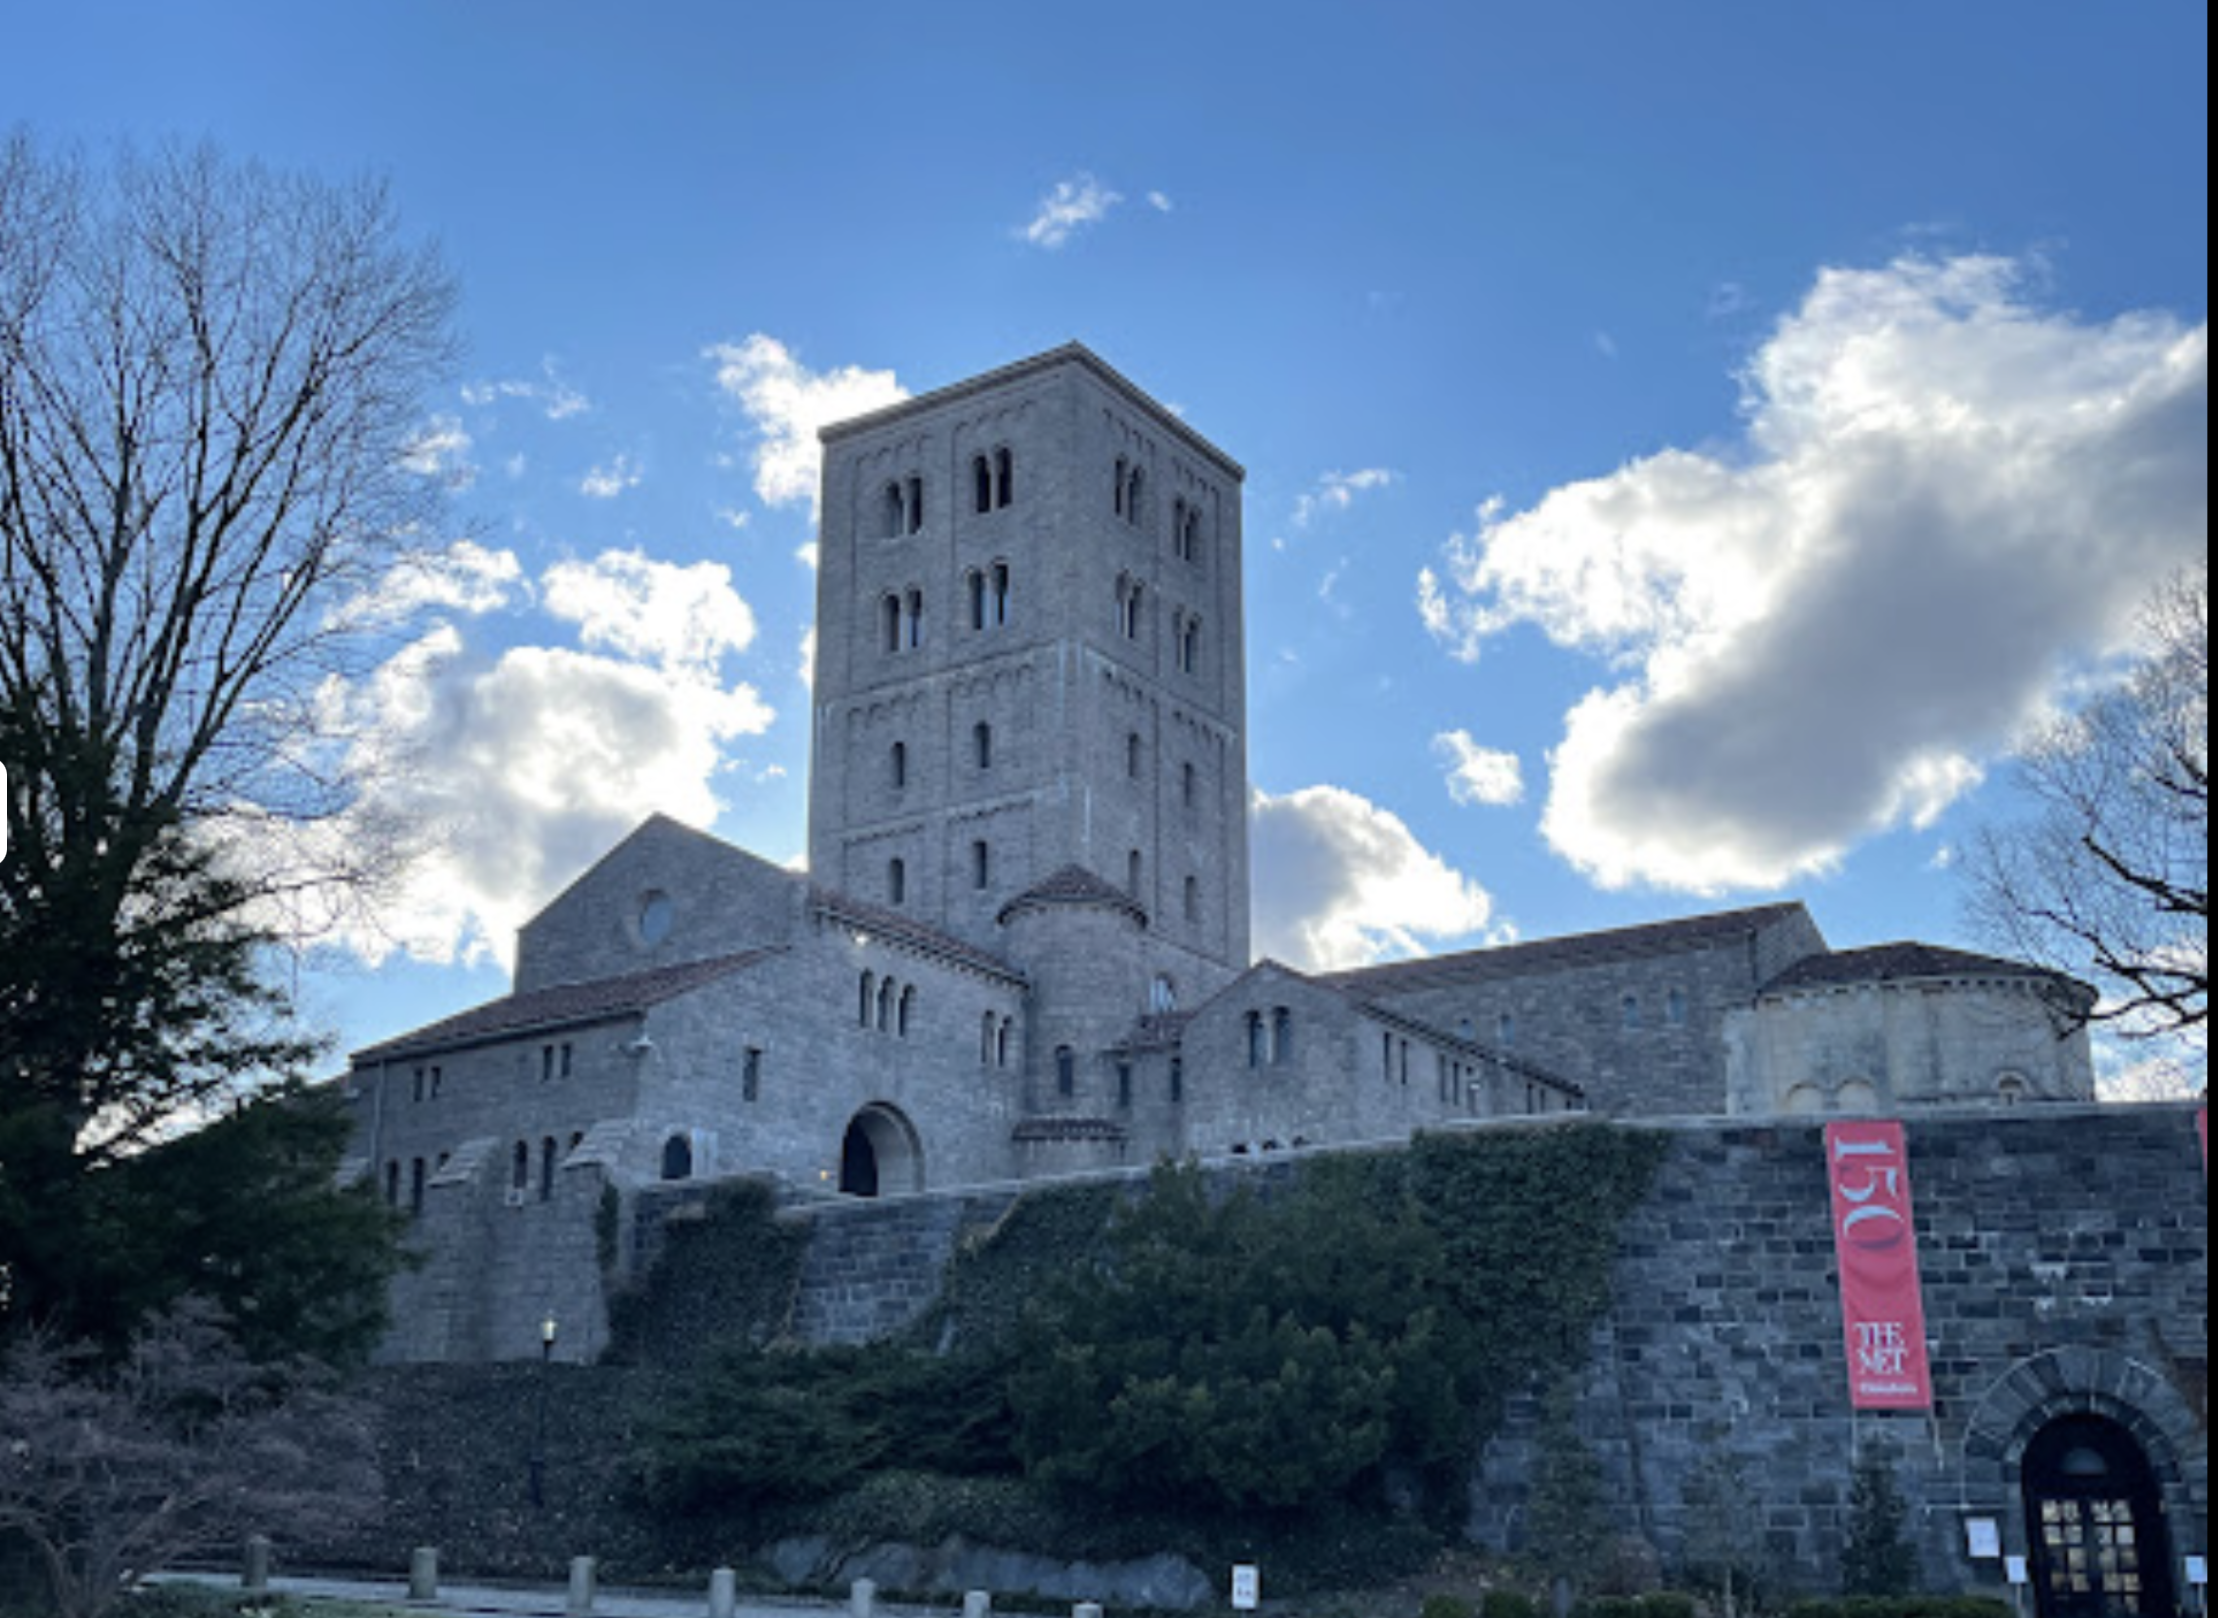
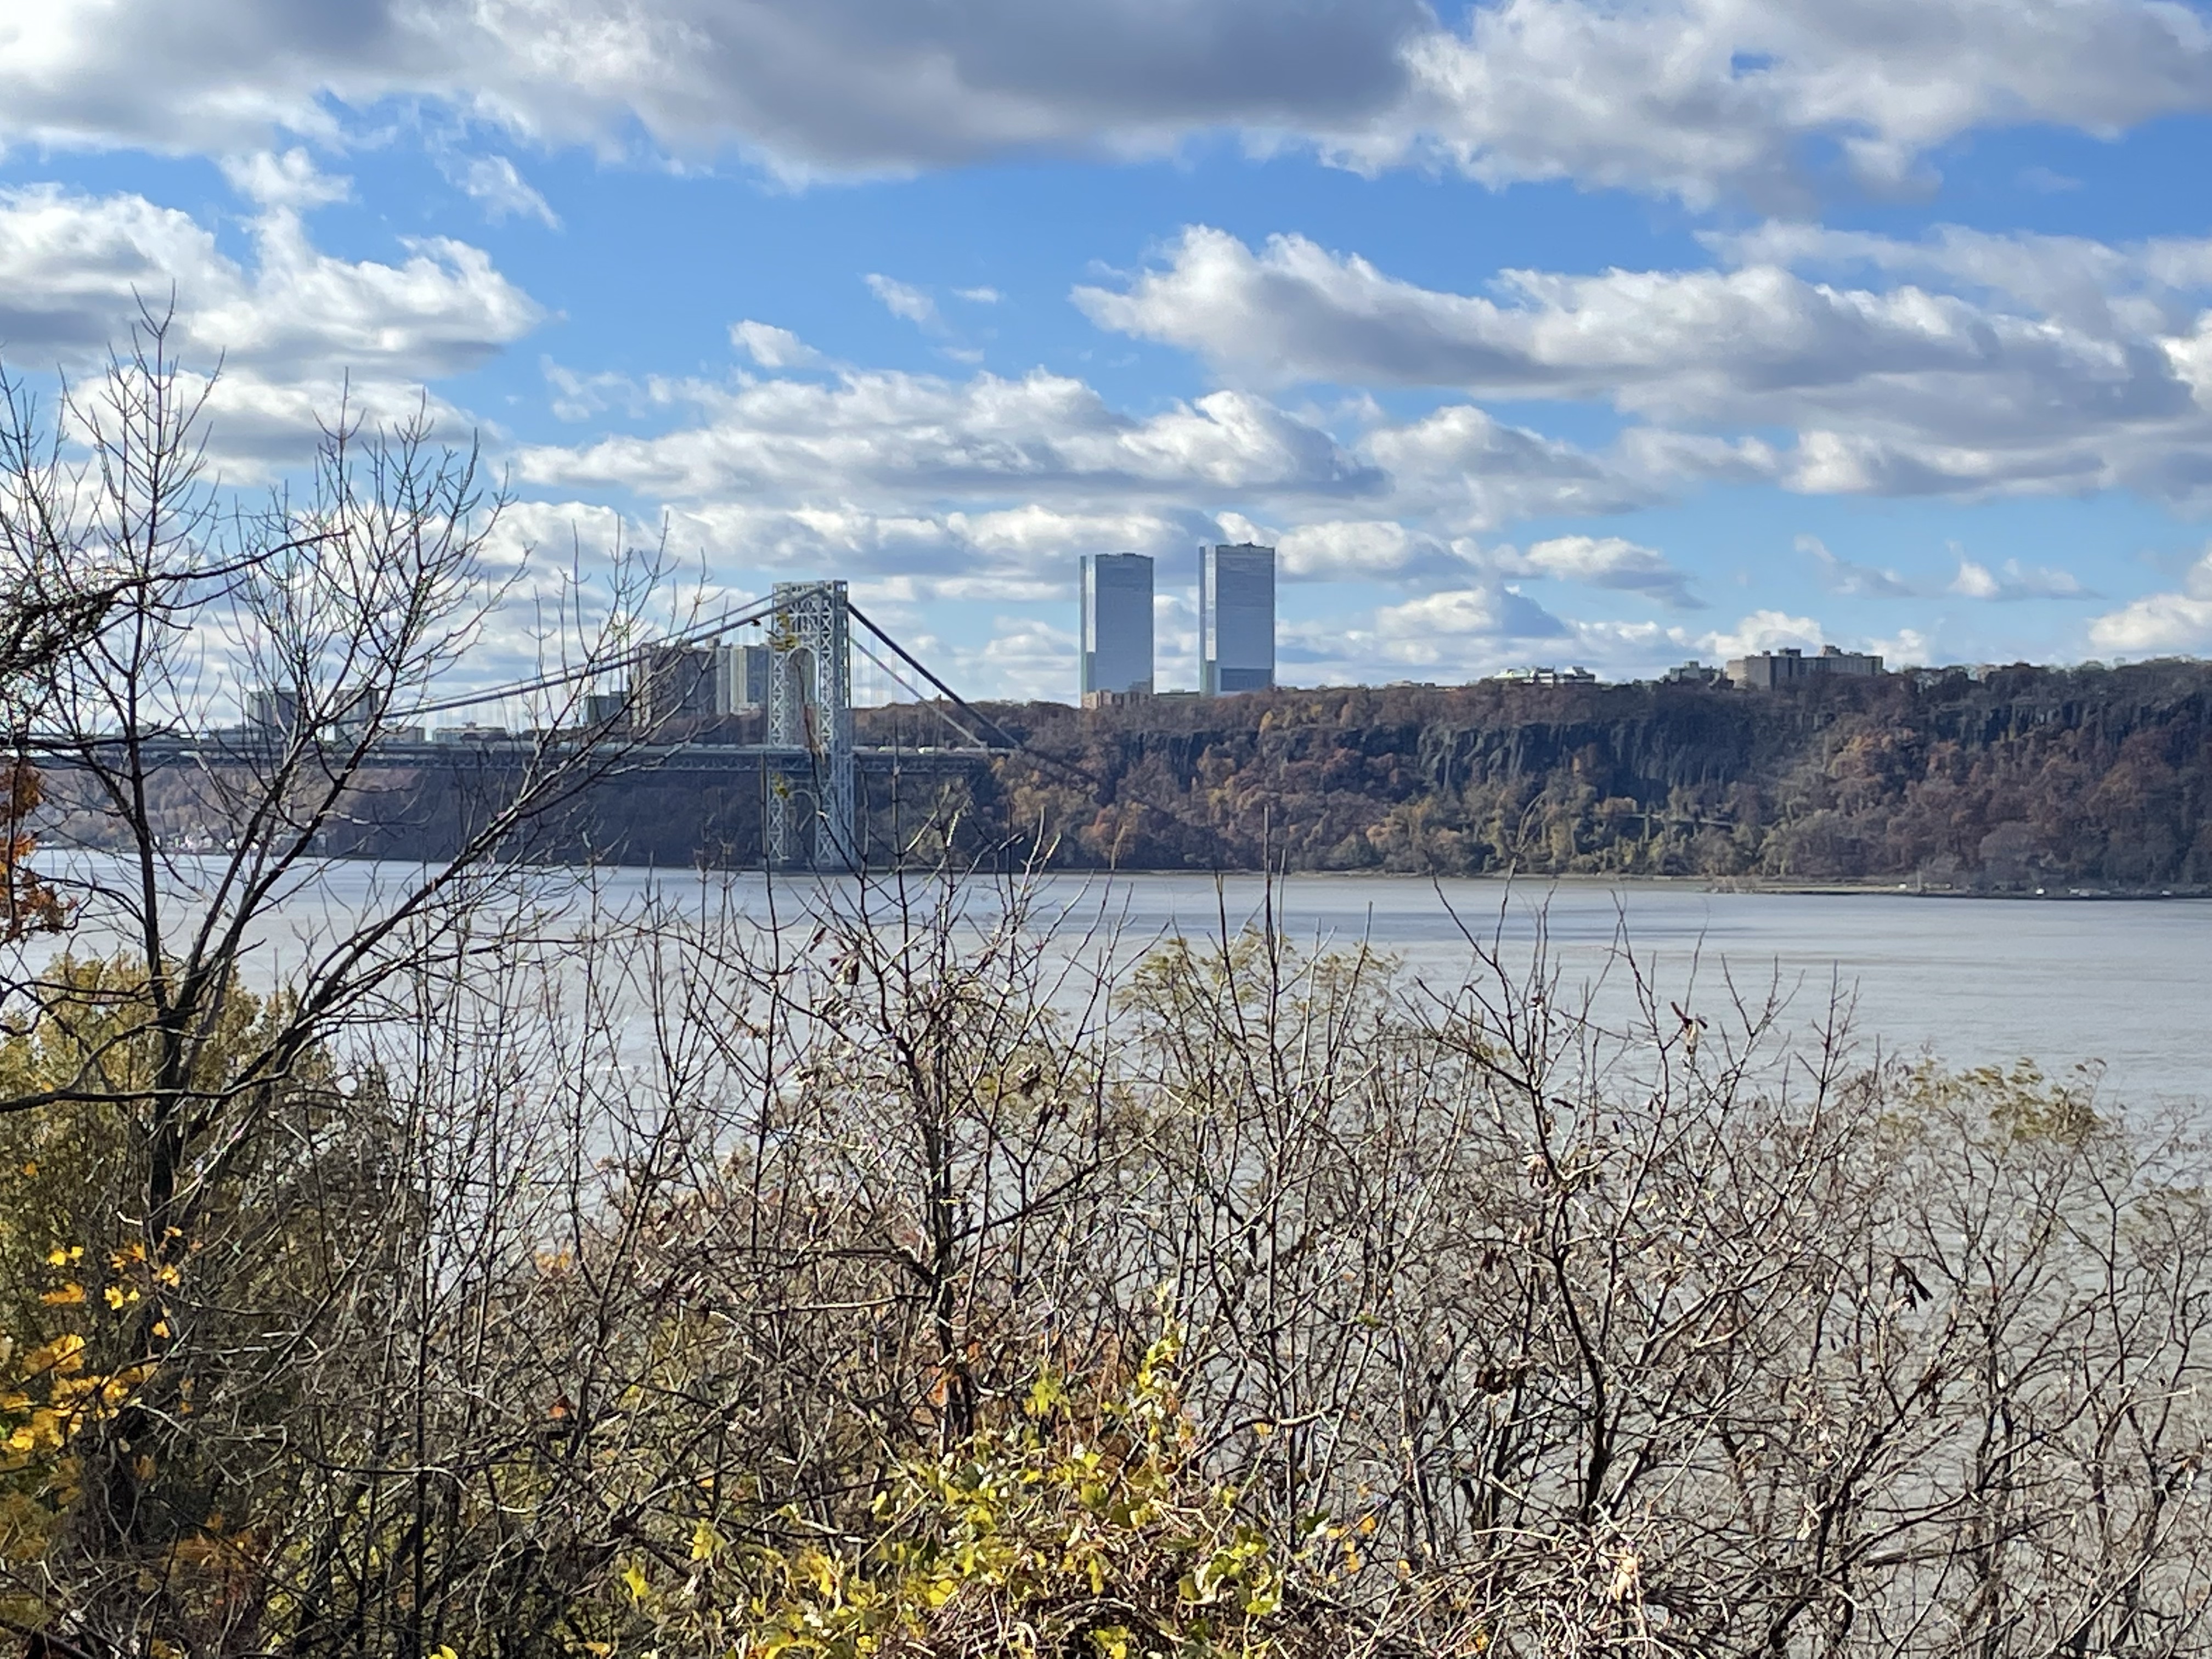
We were spending Thanksgiving week in NYC, visiting our daughter, and went to see a unique collection of European artifacts from the Middle Ages (~1100 to 1500 CE) in an annex operated by the Metropolitan Museum of Art. They call the castle built in 1935 (this was common during that era) The Cloister. To our surprise and delight, this modern fortress was constructed on a ridge of metamorphic rock call Washington Heights, standing out high above the Hudson River.
Thick sequences of eugeosyncline sediments were deposited as the Iapetus Ocean was closing about 600 Ma (million years ago), weathered from rapidly eroding volcanoes (e.g. Japan today). Between 541 and 459 Ma, these sediments were buried deeply enough to be heated and semi-melted as the island arc collided with the mainland during the Taconic Orogeny. Figure 2 shows a schematic of the result of this process, which created the Manhattan Formation, the topic of today’s post.
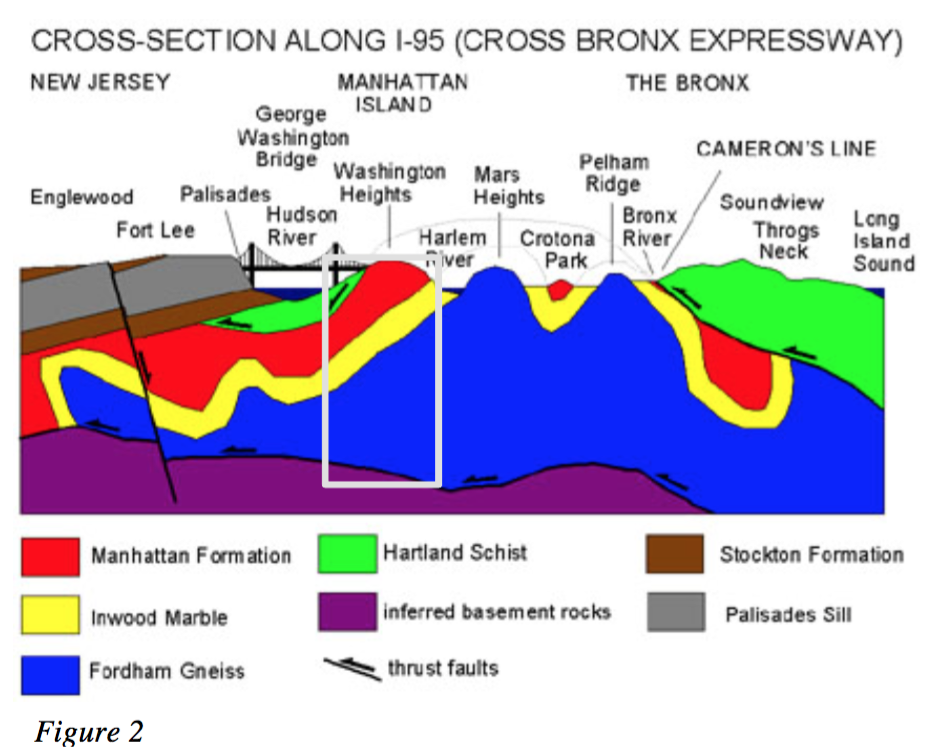
Figure 2. Schematic of subsurface geology alongInterstate 95, from New Jersey to Long Island.
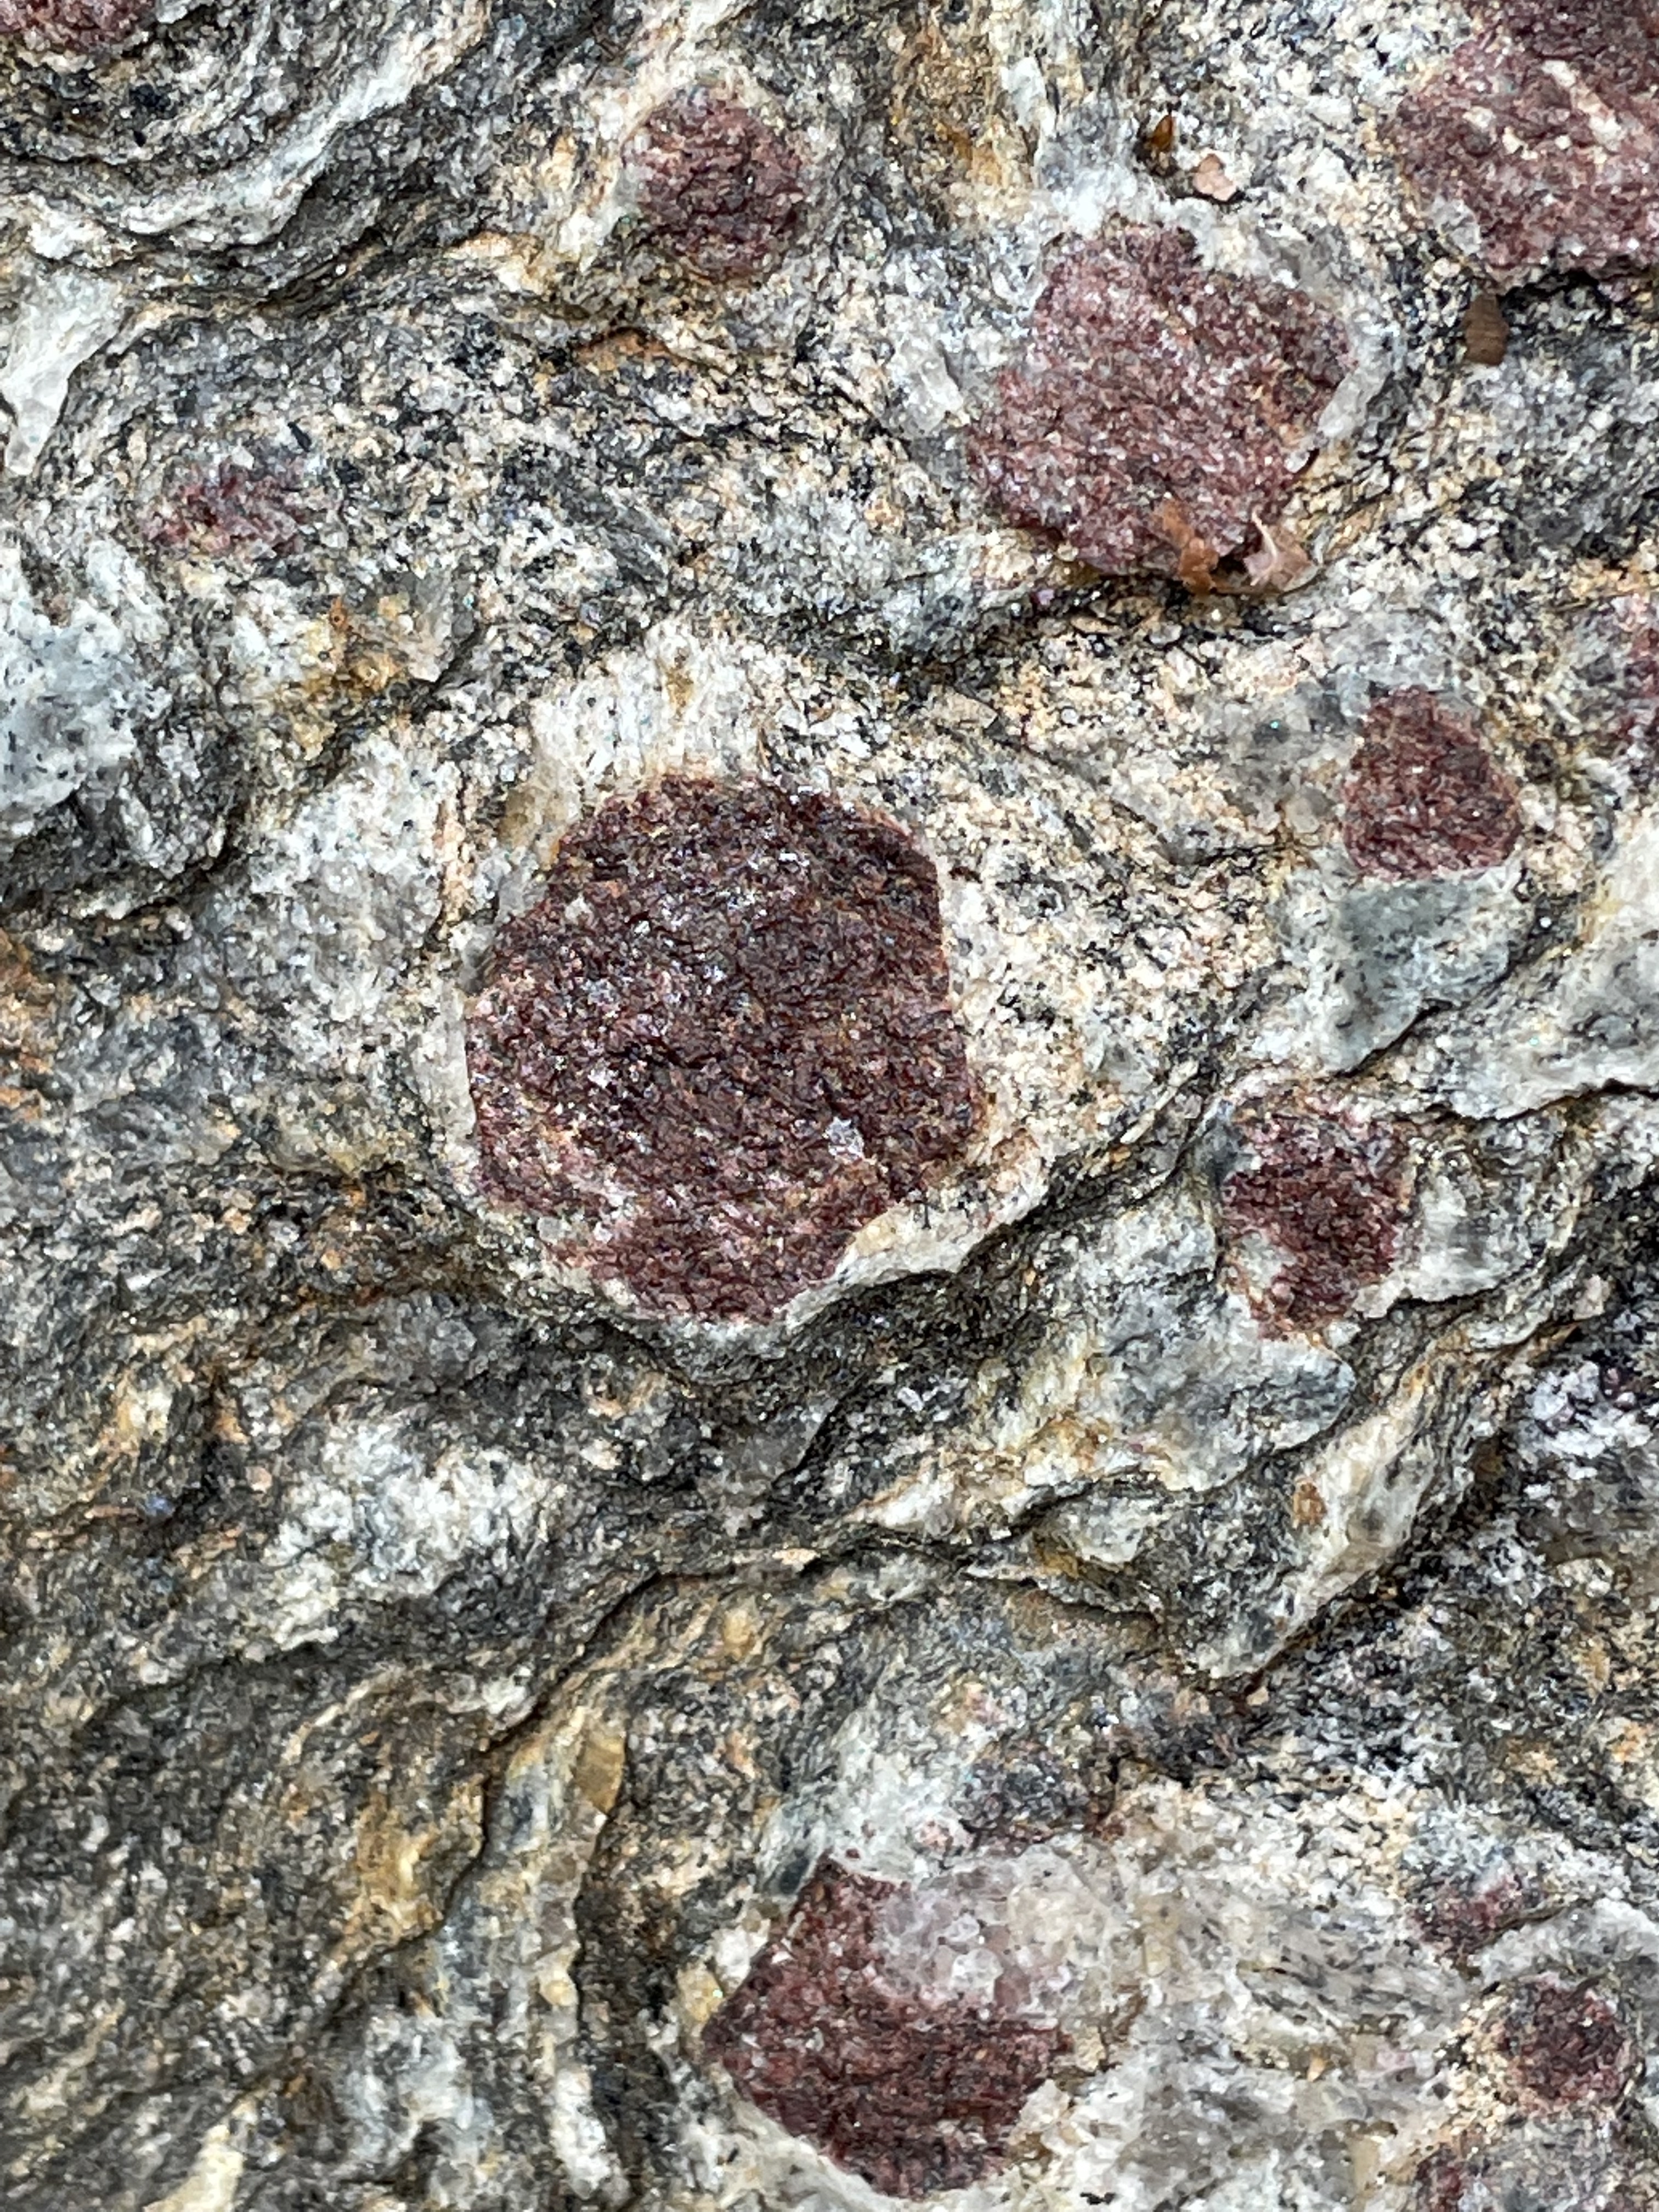
It was a cold November morning when we hiked over the Manhattan Formation (red layer outlined by the rectangle in Fig. 2. The castle is right under the arrow for Washington Heights. When metamorphosed at several miles depth (a guess) under extreme pressure and heat, these immature sediments formed schist containing large garnet phenocrysts.

The overall dry gray schist has irregular layers of quartz showing rotation of inclusions (Fig. 4).

Hexagonal phenocrysts occur in widely separated areas (Fig. 5).
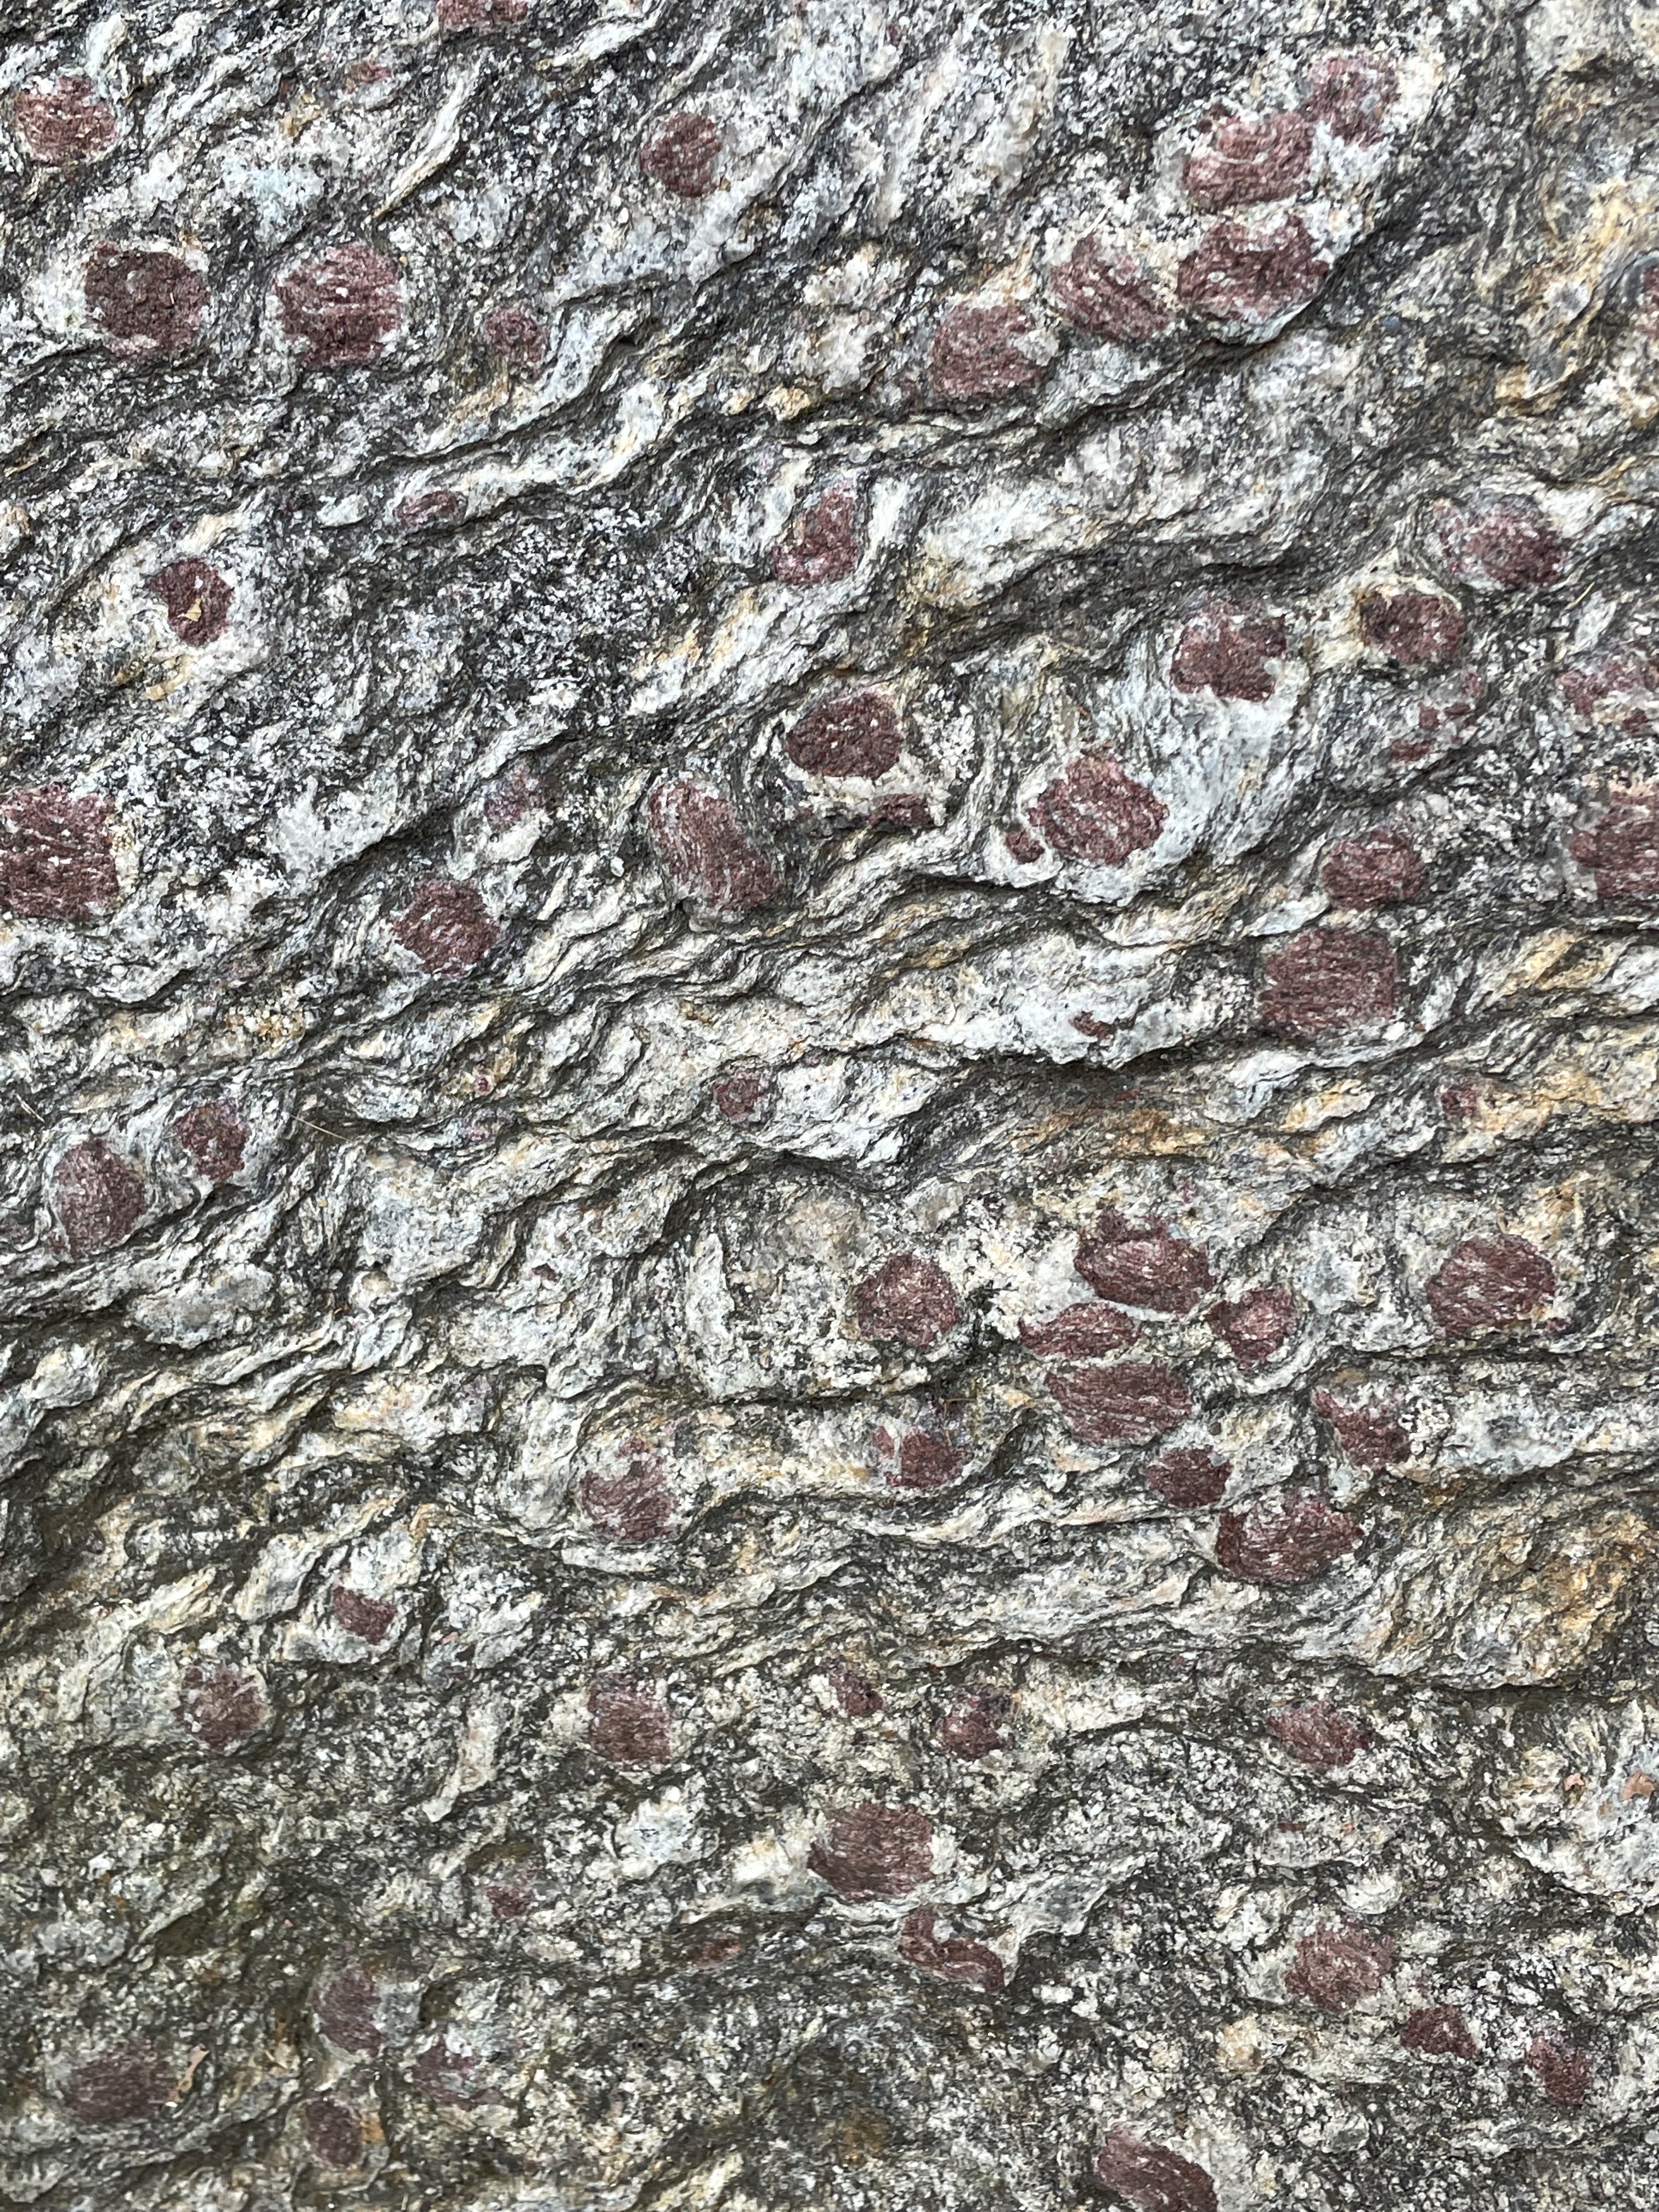
The garnet crystals (Figs. 4 and 5) were very large and well formed. The brownish surface indicates they are rich in iron, which is literally rusting (oxidizing).
The Manhattan Formation is a hard rock even though it has a preferred plane of inherent weakness as to all schists. For example the plane of weakness in this outcrop (Fig. 3) is approximately vertical, being aligned with original bedding as suggested in Fig. 2 (red layer).
As we recall from previous posts, the closing of the Iapetus Ocean occurred in pulses that began with the Taconic Orogeny and the deformation of the Manhattan Formation. A series of island arcs were thrust onto photo-North America until photo-Europe collided in the Alleghanian Orogeny about 250 Ma.
It All Started Here
You don’t have to go far to find some rocks here in Fairfax County, Northern Virginia, and the rocks tell a fascinating story of earth-shaking scale; continents colliding and splitting asunder, right beneath our feet. Today’s post goes straight to the middle of it all, not far from our apartment.
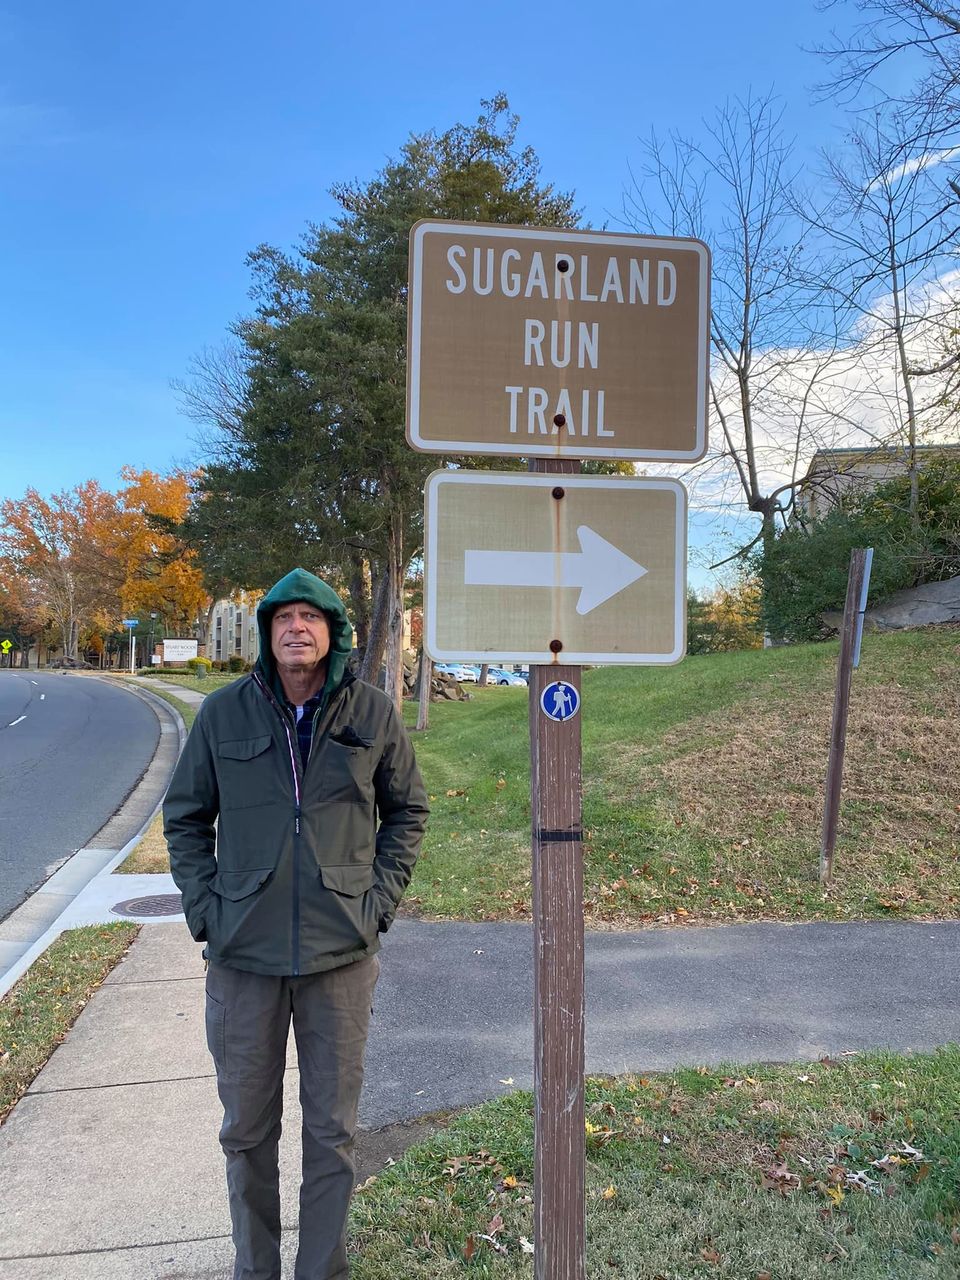
It was a few degrees above freezing, but that doesn’t matter to the rocks or to me and my stalwart field companion. Figure 2 shows the field area and our approximate path along Sugarland Run, a meandering creek that passed through a narrow, rocky channel before entering a wide, boggy area as it flowed north (towards the Potomac I presume).

Towards the southern end of our trail (dashed red line in Fig. 2), we encountered very-large boulders adjacent to the creek (Fig. 3), which had a bed composed of angular gray casts showing little evidence of transport (Fig. 4).
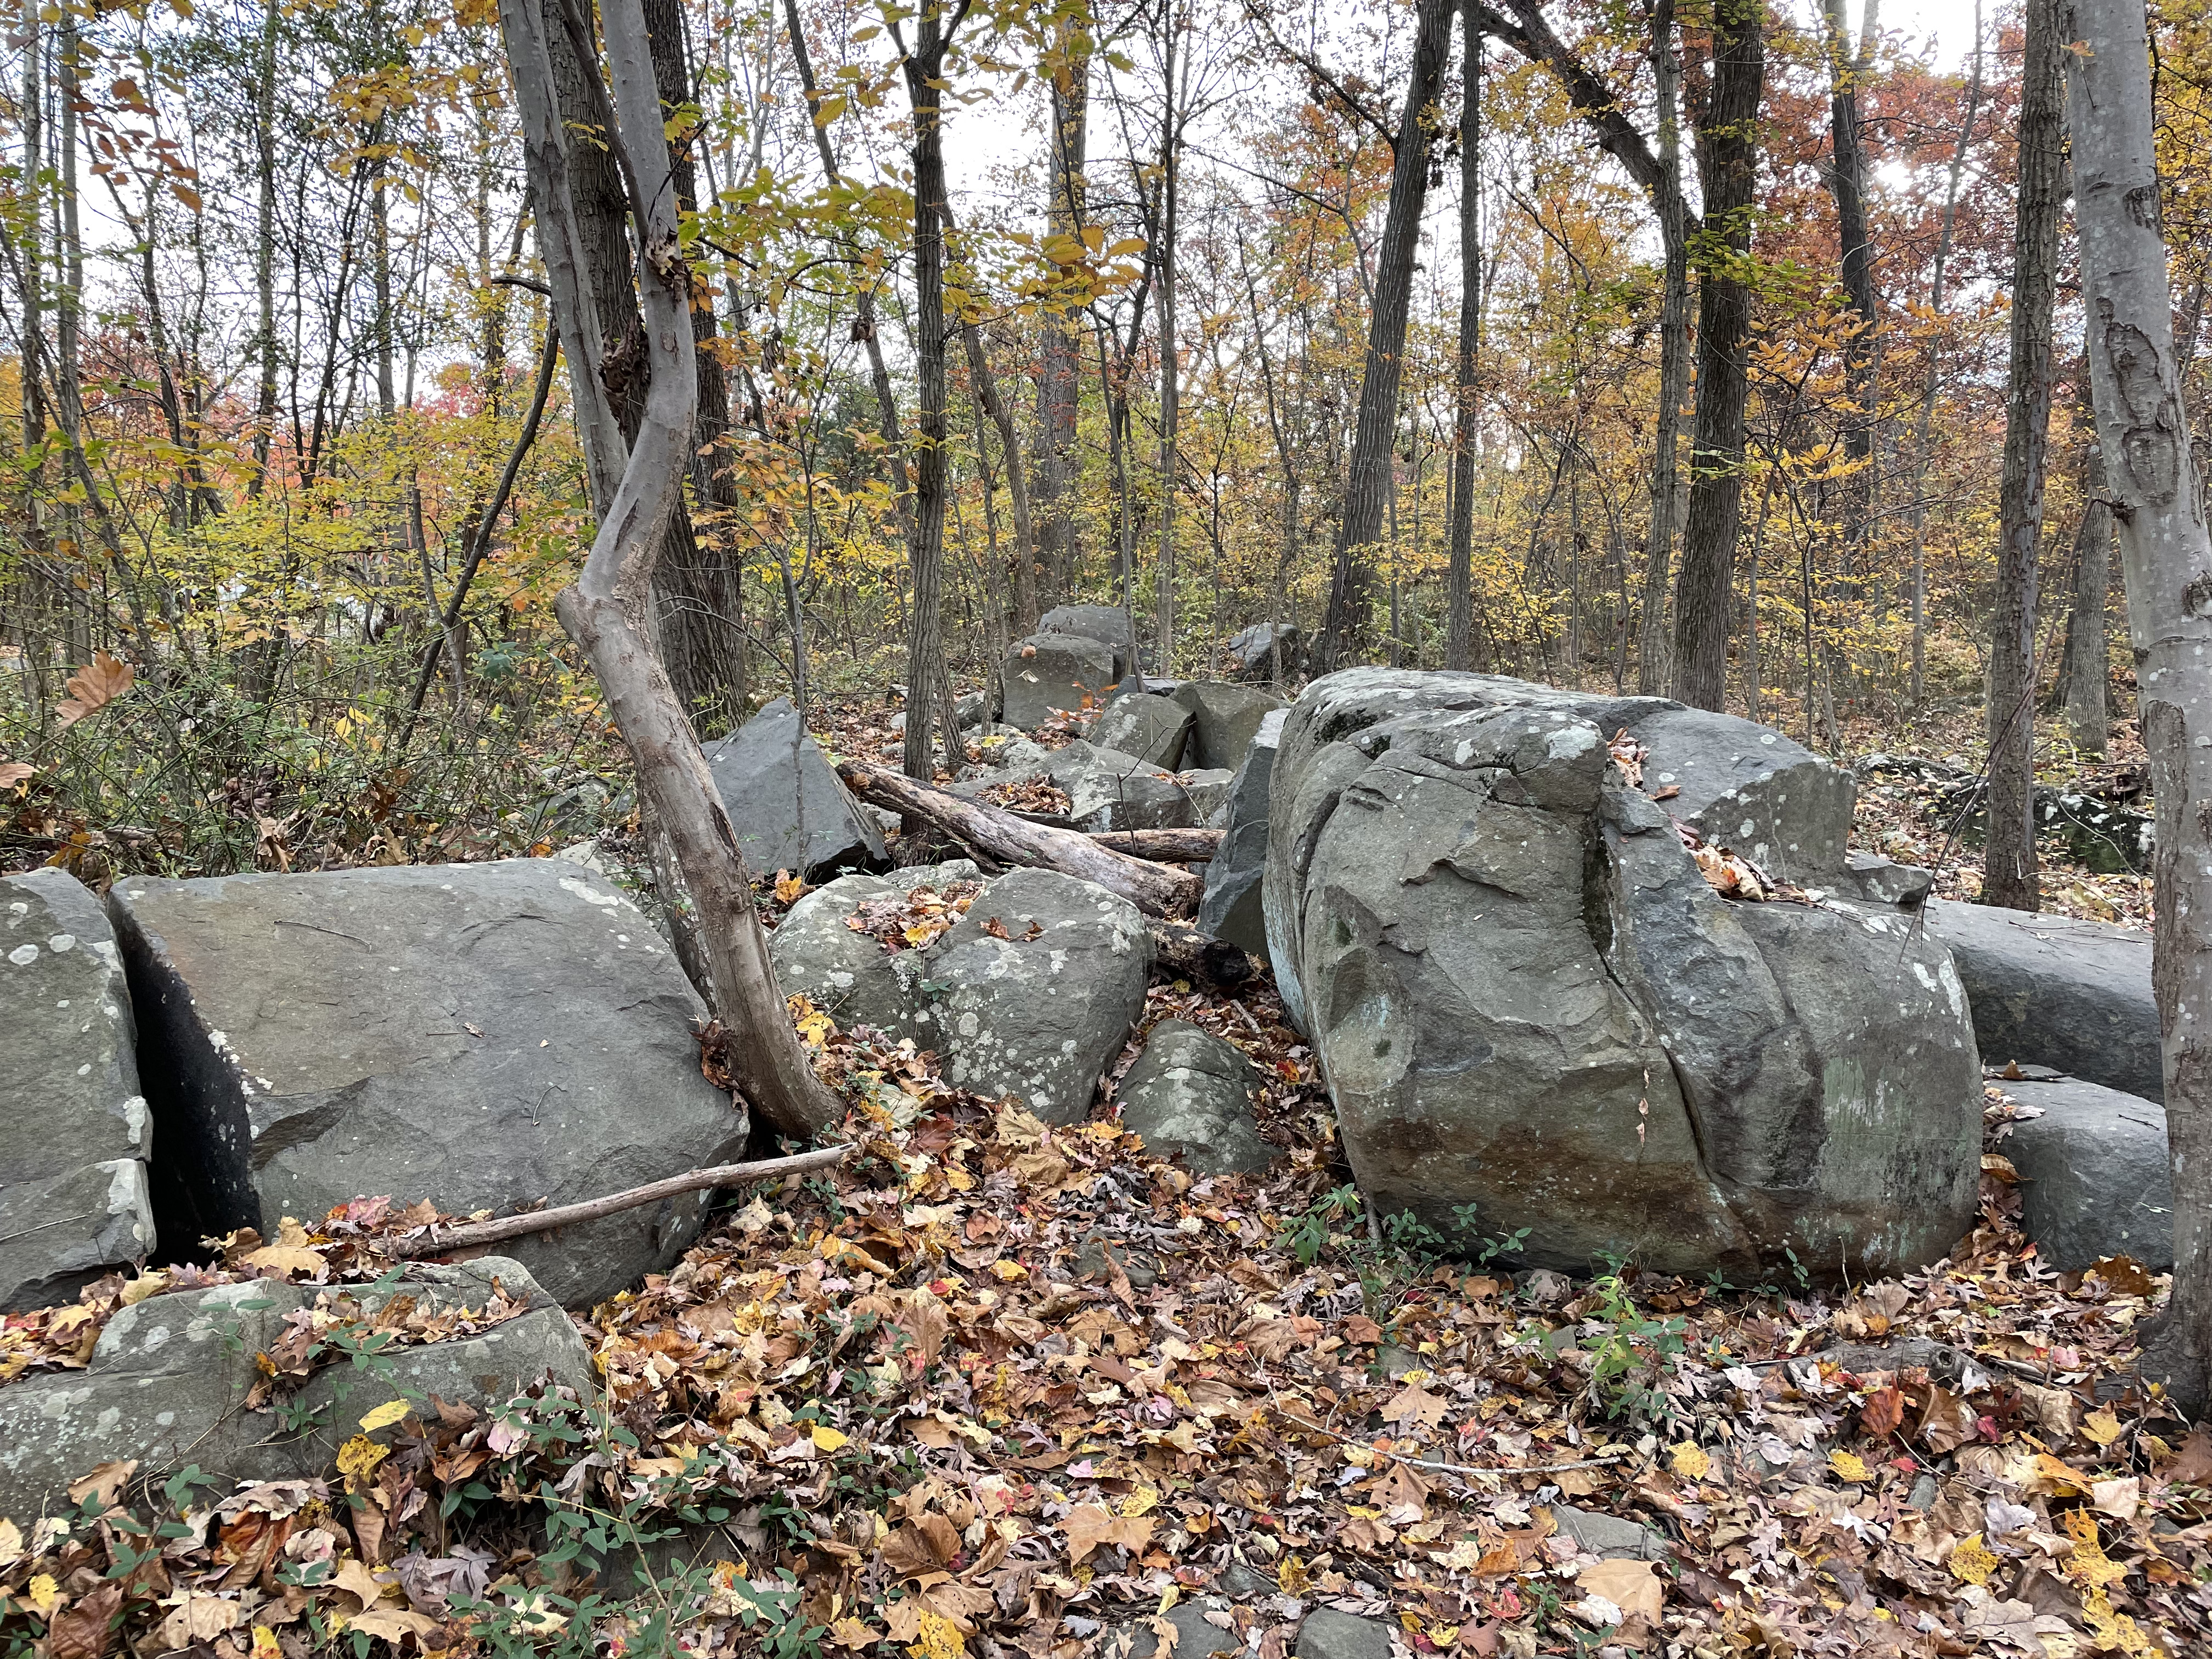
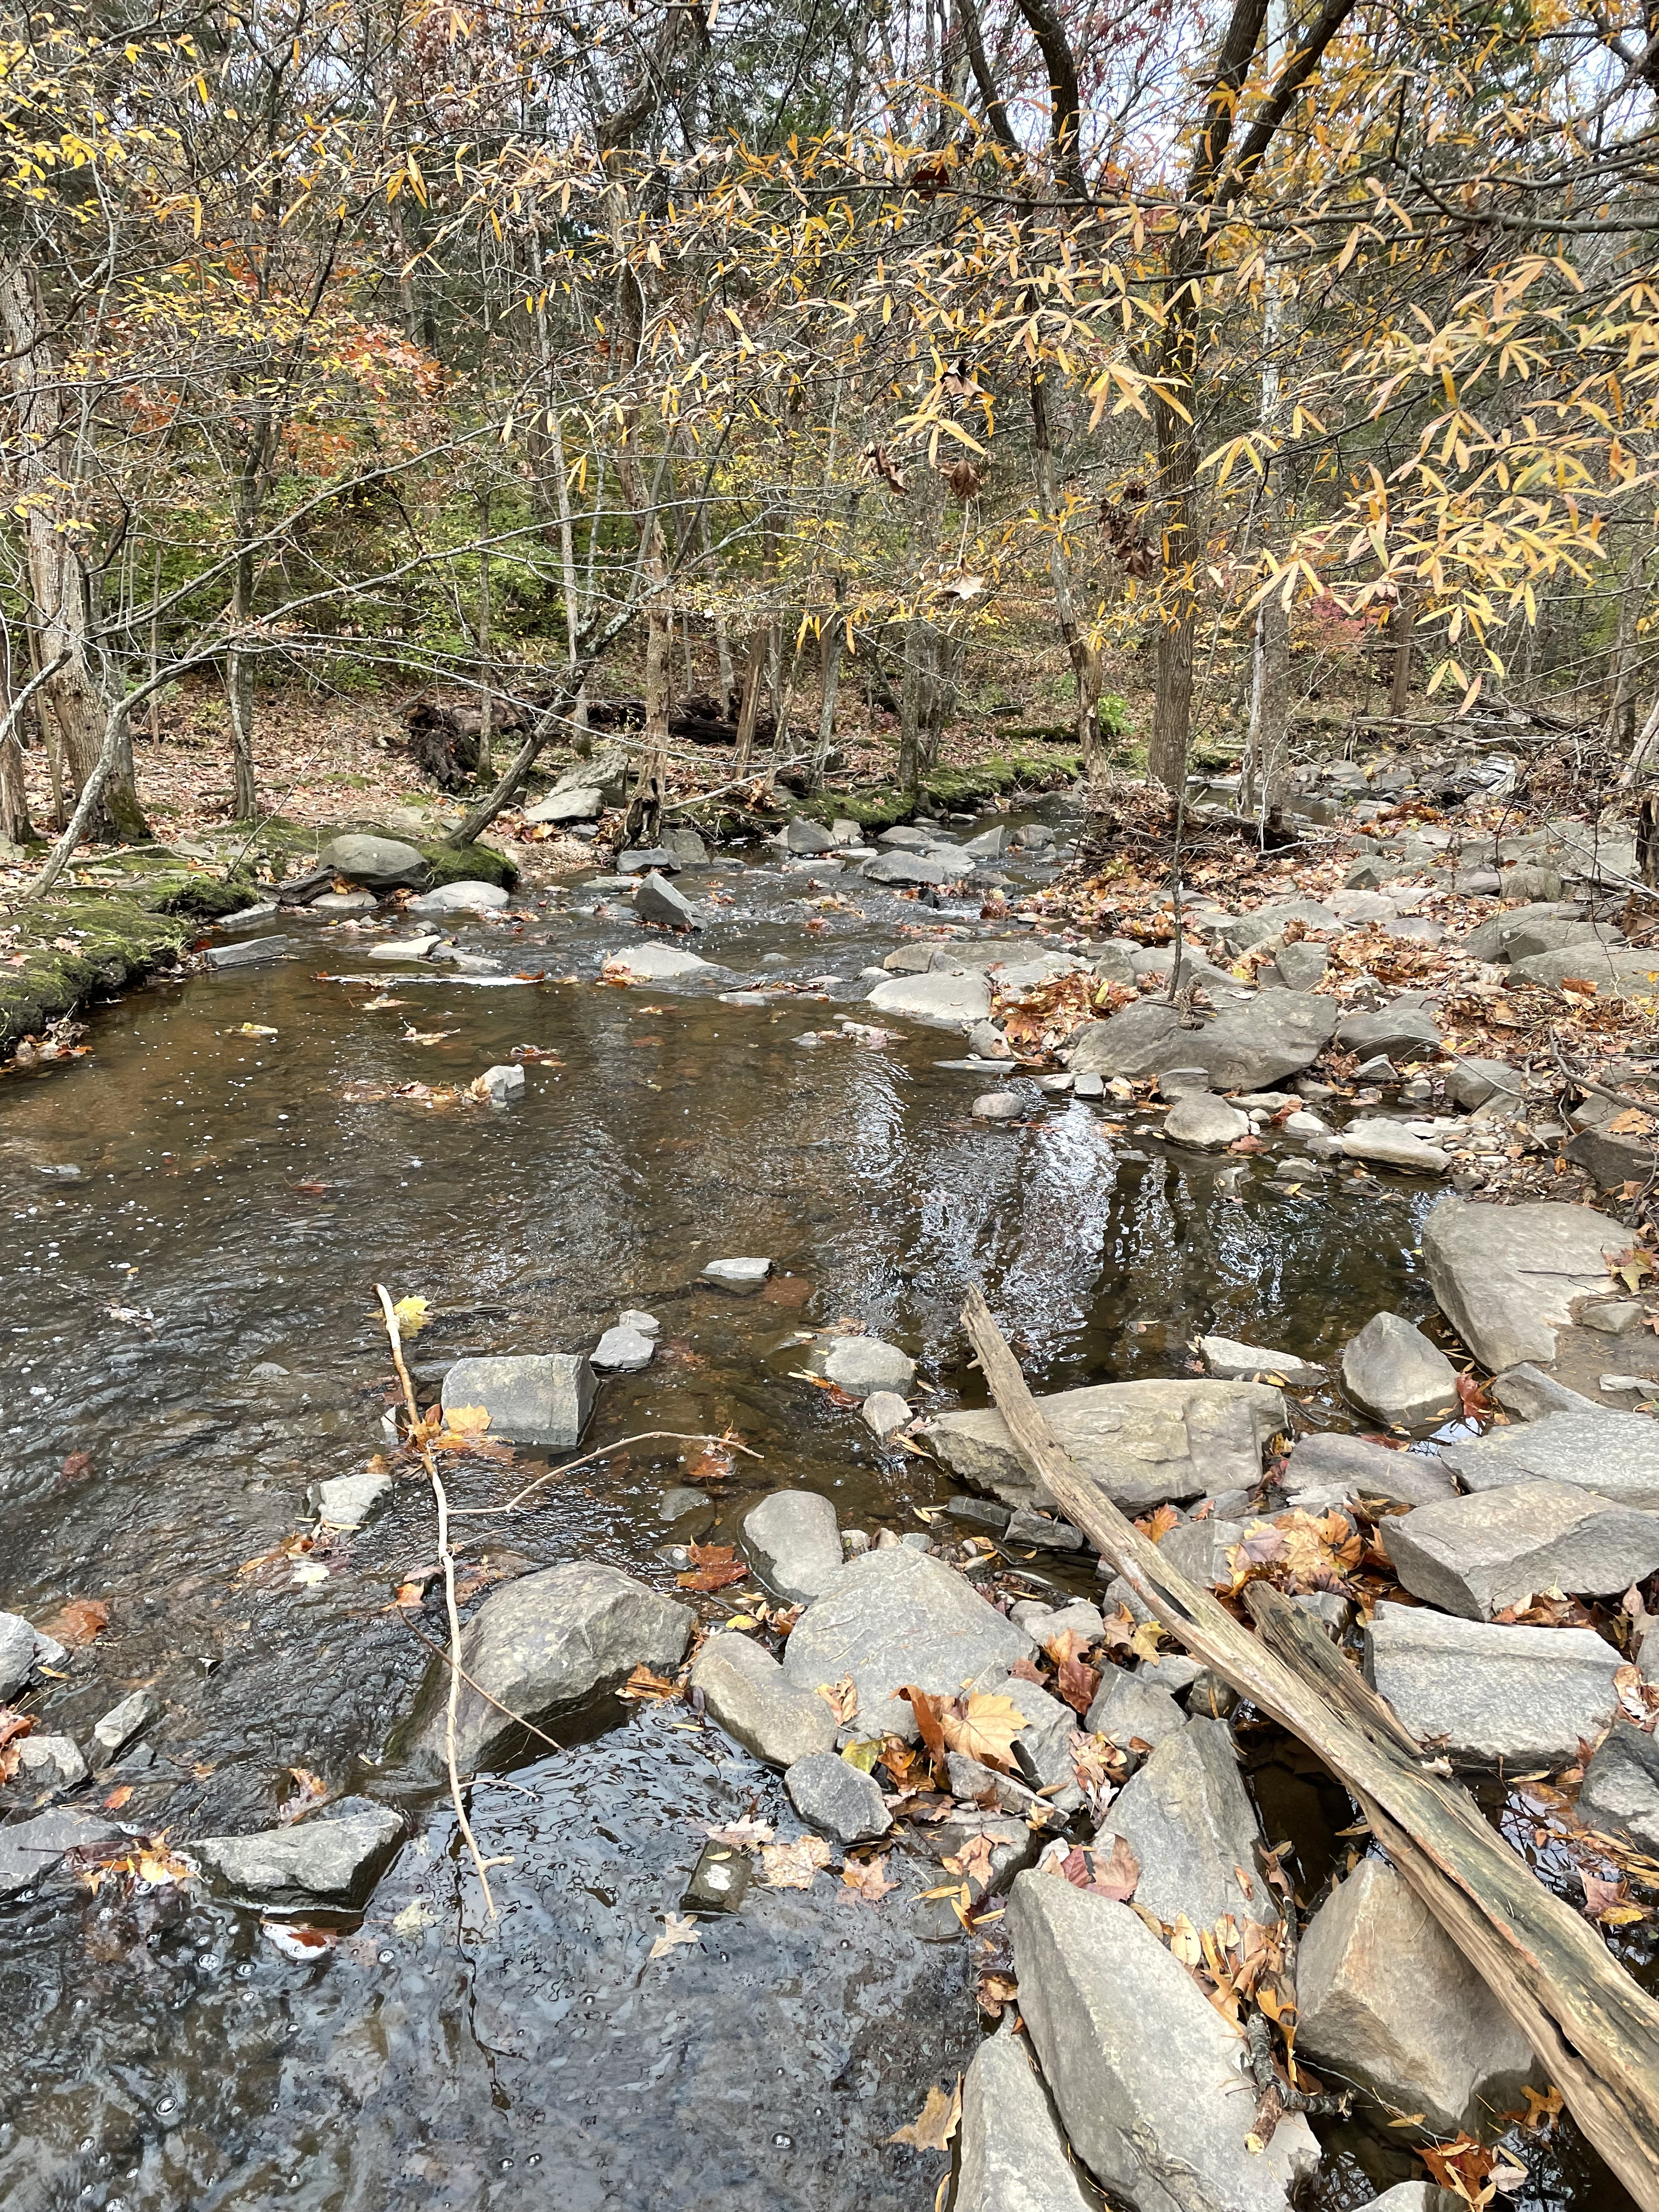
We didn’t find any large boulders (some were as large as automobiles) that were definitively in place (i.e., visibly attached to subjacent basement rock), but these huge stones weren’t moved far at least not all of them. In several places, they were obviously pushed aside by bulldozers to make way for apartment buildings. Nevertheless, there is no obvious reason for some of them to have been displaced (e.g., Fig. 3), so it is reasonable to assume that the boulder fields represent the outer layer of unexposed rocks supporting the area, fractured and eroded but too resistant to have been weathered since exhumation, probably during the last ice age.
The drainage has been disrupted by construction, resulting in previous stream beds that have been cut off.

In keeping with the Rocks and (no) Roads principle of studying the earth as we see it, I couldn’t find any freshly broken rocks, but we can say for certain that this is a relatively uniform exposure of homogeneous, fine-grained, gray rocks with no obvious phenocrysts.

A couple of interesting characteristics of this rock are visible in Fig. 6: first, it weathers to a reddish color from an original gray tone (compare to Fig. 5, which shows boulders not exposed to constant water); secondly, the texture is fairly uniform. This last observation requires clarification. The hand sample in Fig. 6 was covered with whitish biological material of unknown composition, but if you stare at Fig. 6 long enough (or enlarge the image) you will notice that it does not consist of identifiable “grains” of sand. As I learned from my travels around Australia, when you can’t see sedimentary particles, and there is no apparent structure, you are looking at an igneous rock of some kind.
The lighter, bluish gray area in Fig. 2 indicates the extent of a rather special but widely distributed rock along the east coast of North America. According to several field reports, summarized in the Rock-D app, this is a high-titanium quartz-normative diabase. A traditional classification places it in the tholeiitic magma series. It has been reliably dated to have been emplaced between 200 and 174 Ma. Yet another unique rock type found within the Newark Supergroup.
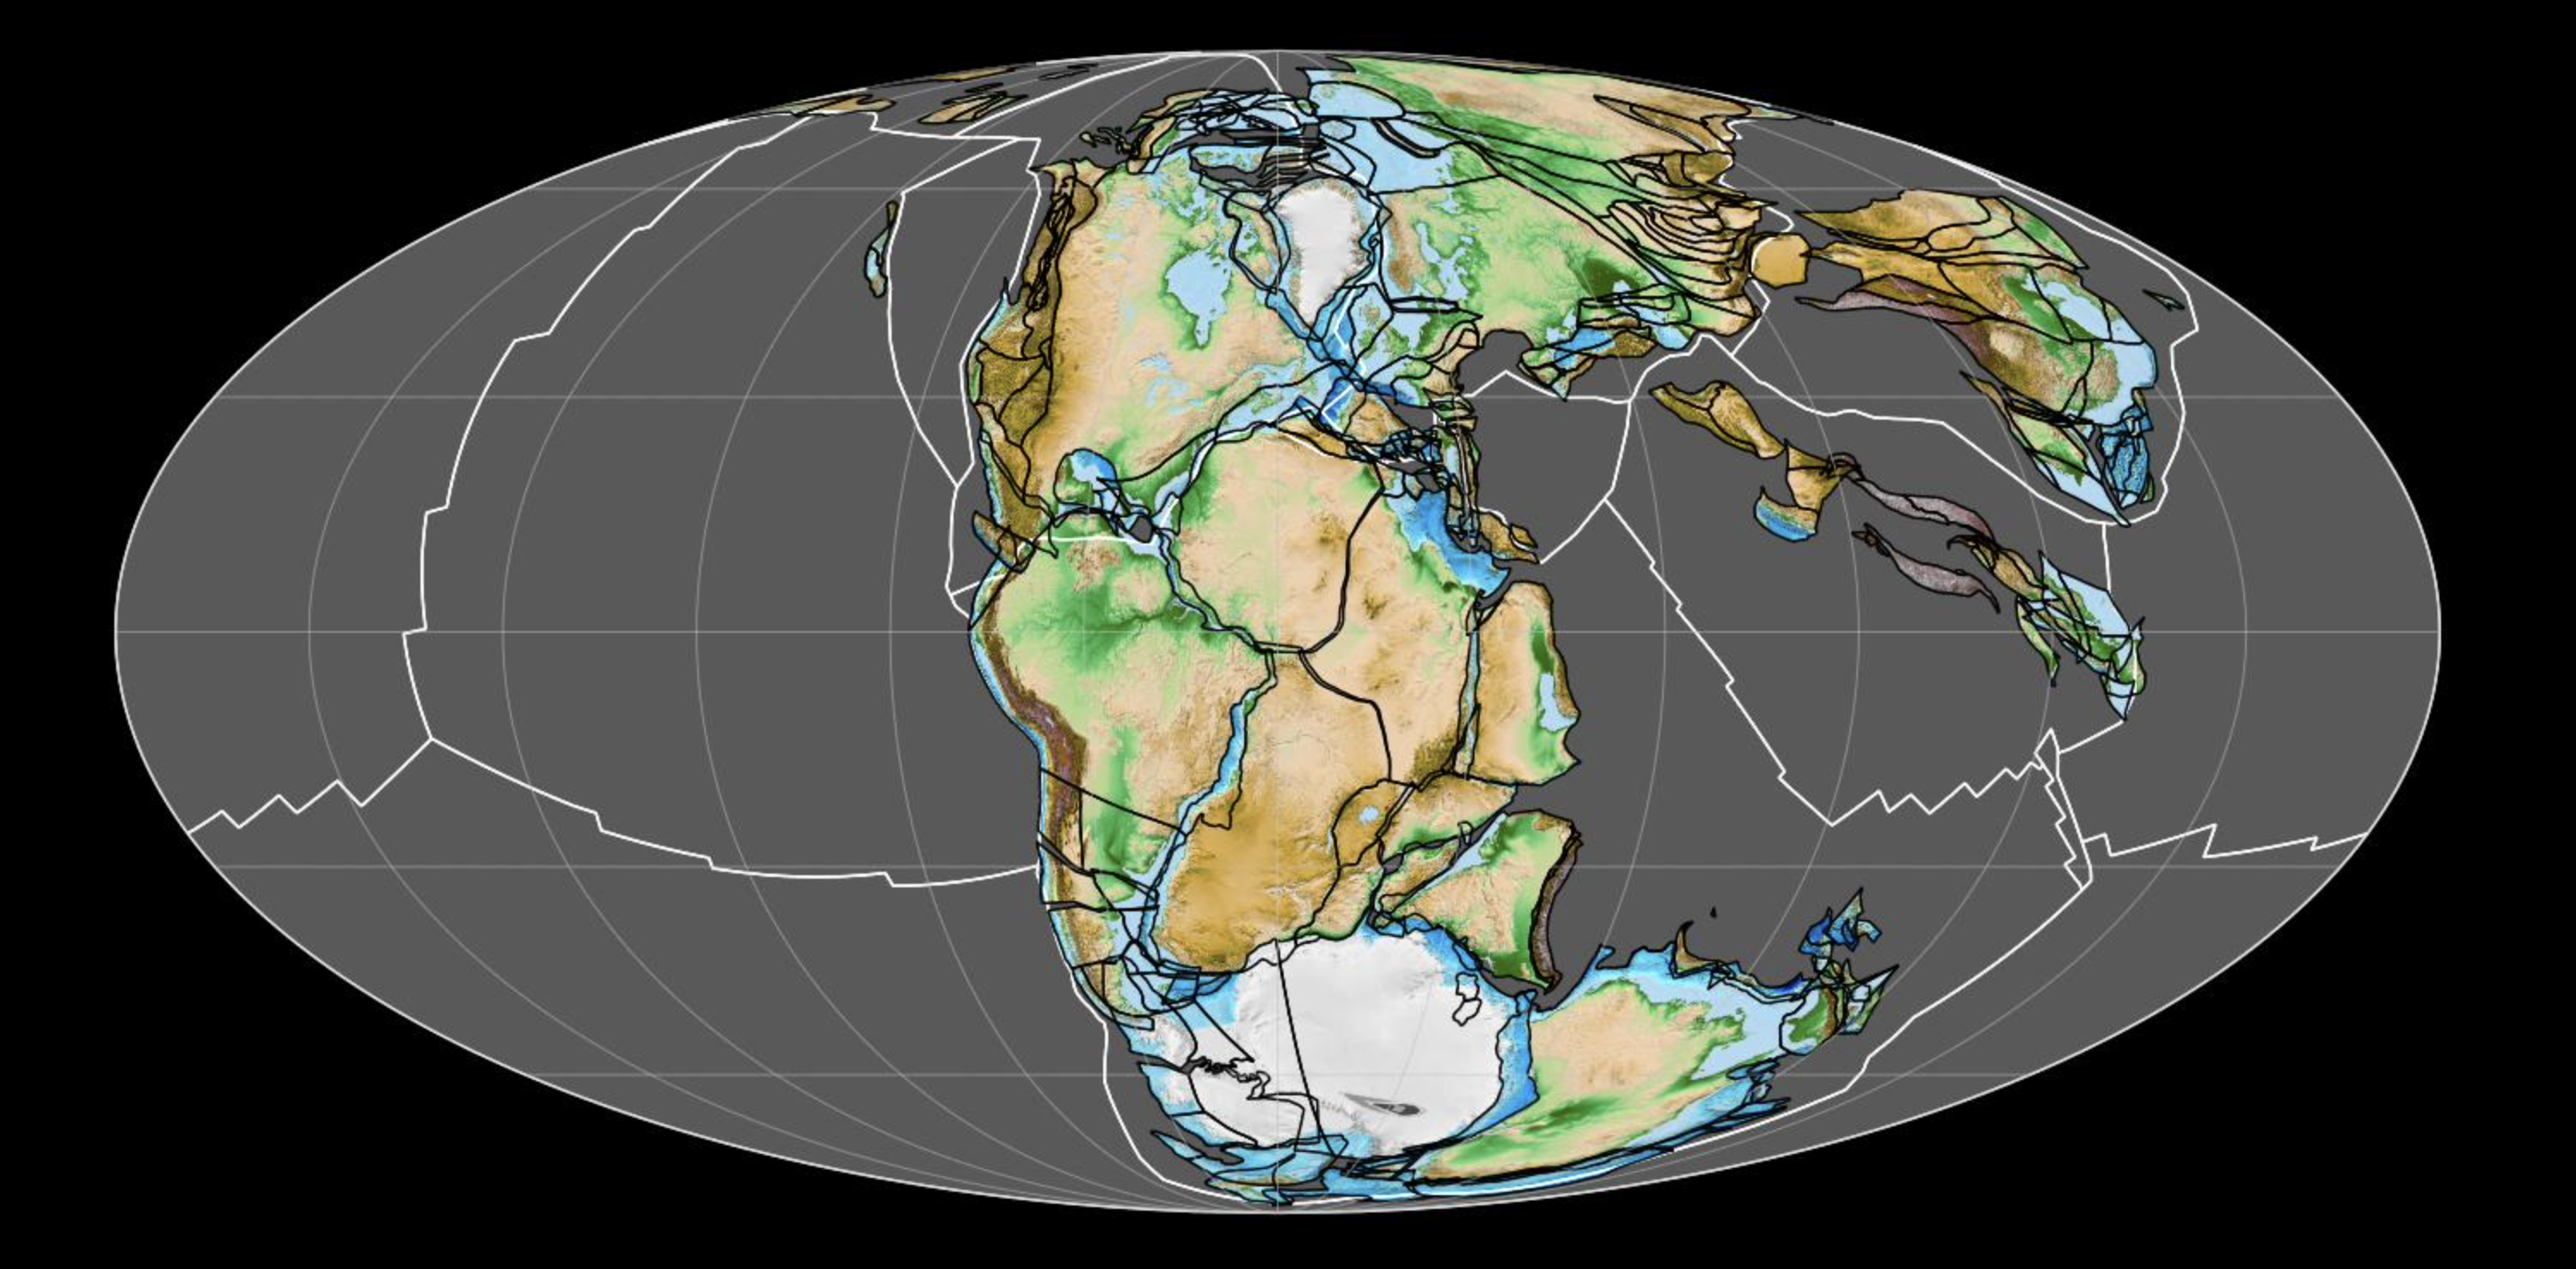
In a previous post, we examined some of the sedimentary rocks deposited in subsiding basins during this time period. Meanwhile deep beneath the surface, magma squeezed into fractures in the weakened crust as Pangea began to split apart. Another piece of the puzzle falls into place. A single continent containing all of the earth’s land (look at a globe to imagine what that must have been like), was torn apart by slowly convecting rocks within the mantle (like a pan of water boiling), heated by the primordial molten iron of the earth’s core.
To help you visualize it, here’s a plate construction from just before all hell broke loose (geologically speaking) created by Fama Clamosa (I couldn’t find a solid reference but this is about what I’ve seen elsewhere).
Jump ahead 200 million years.
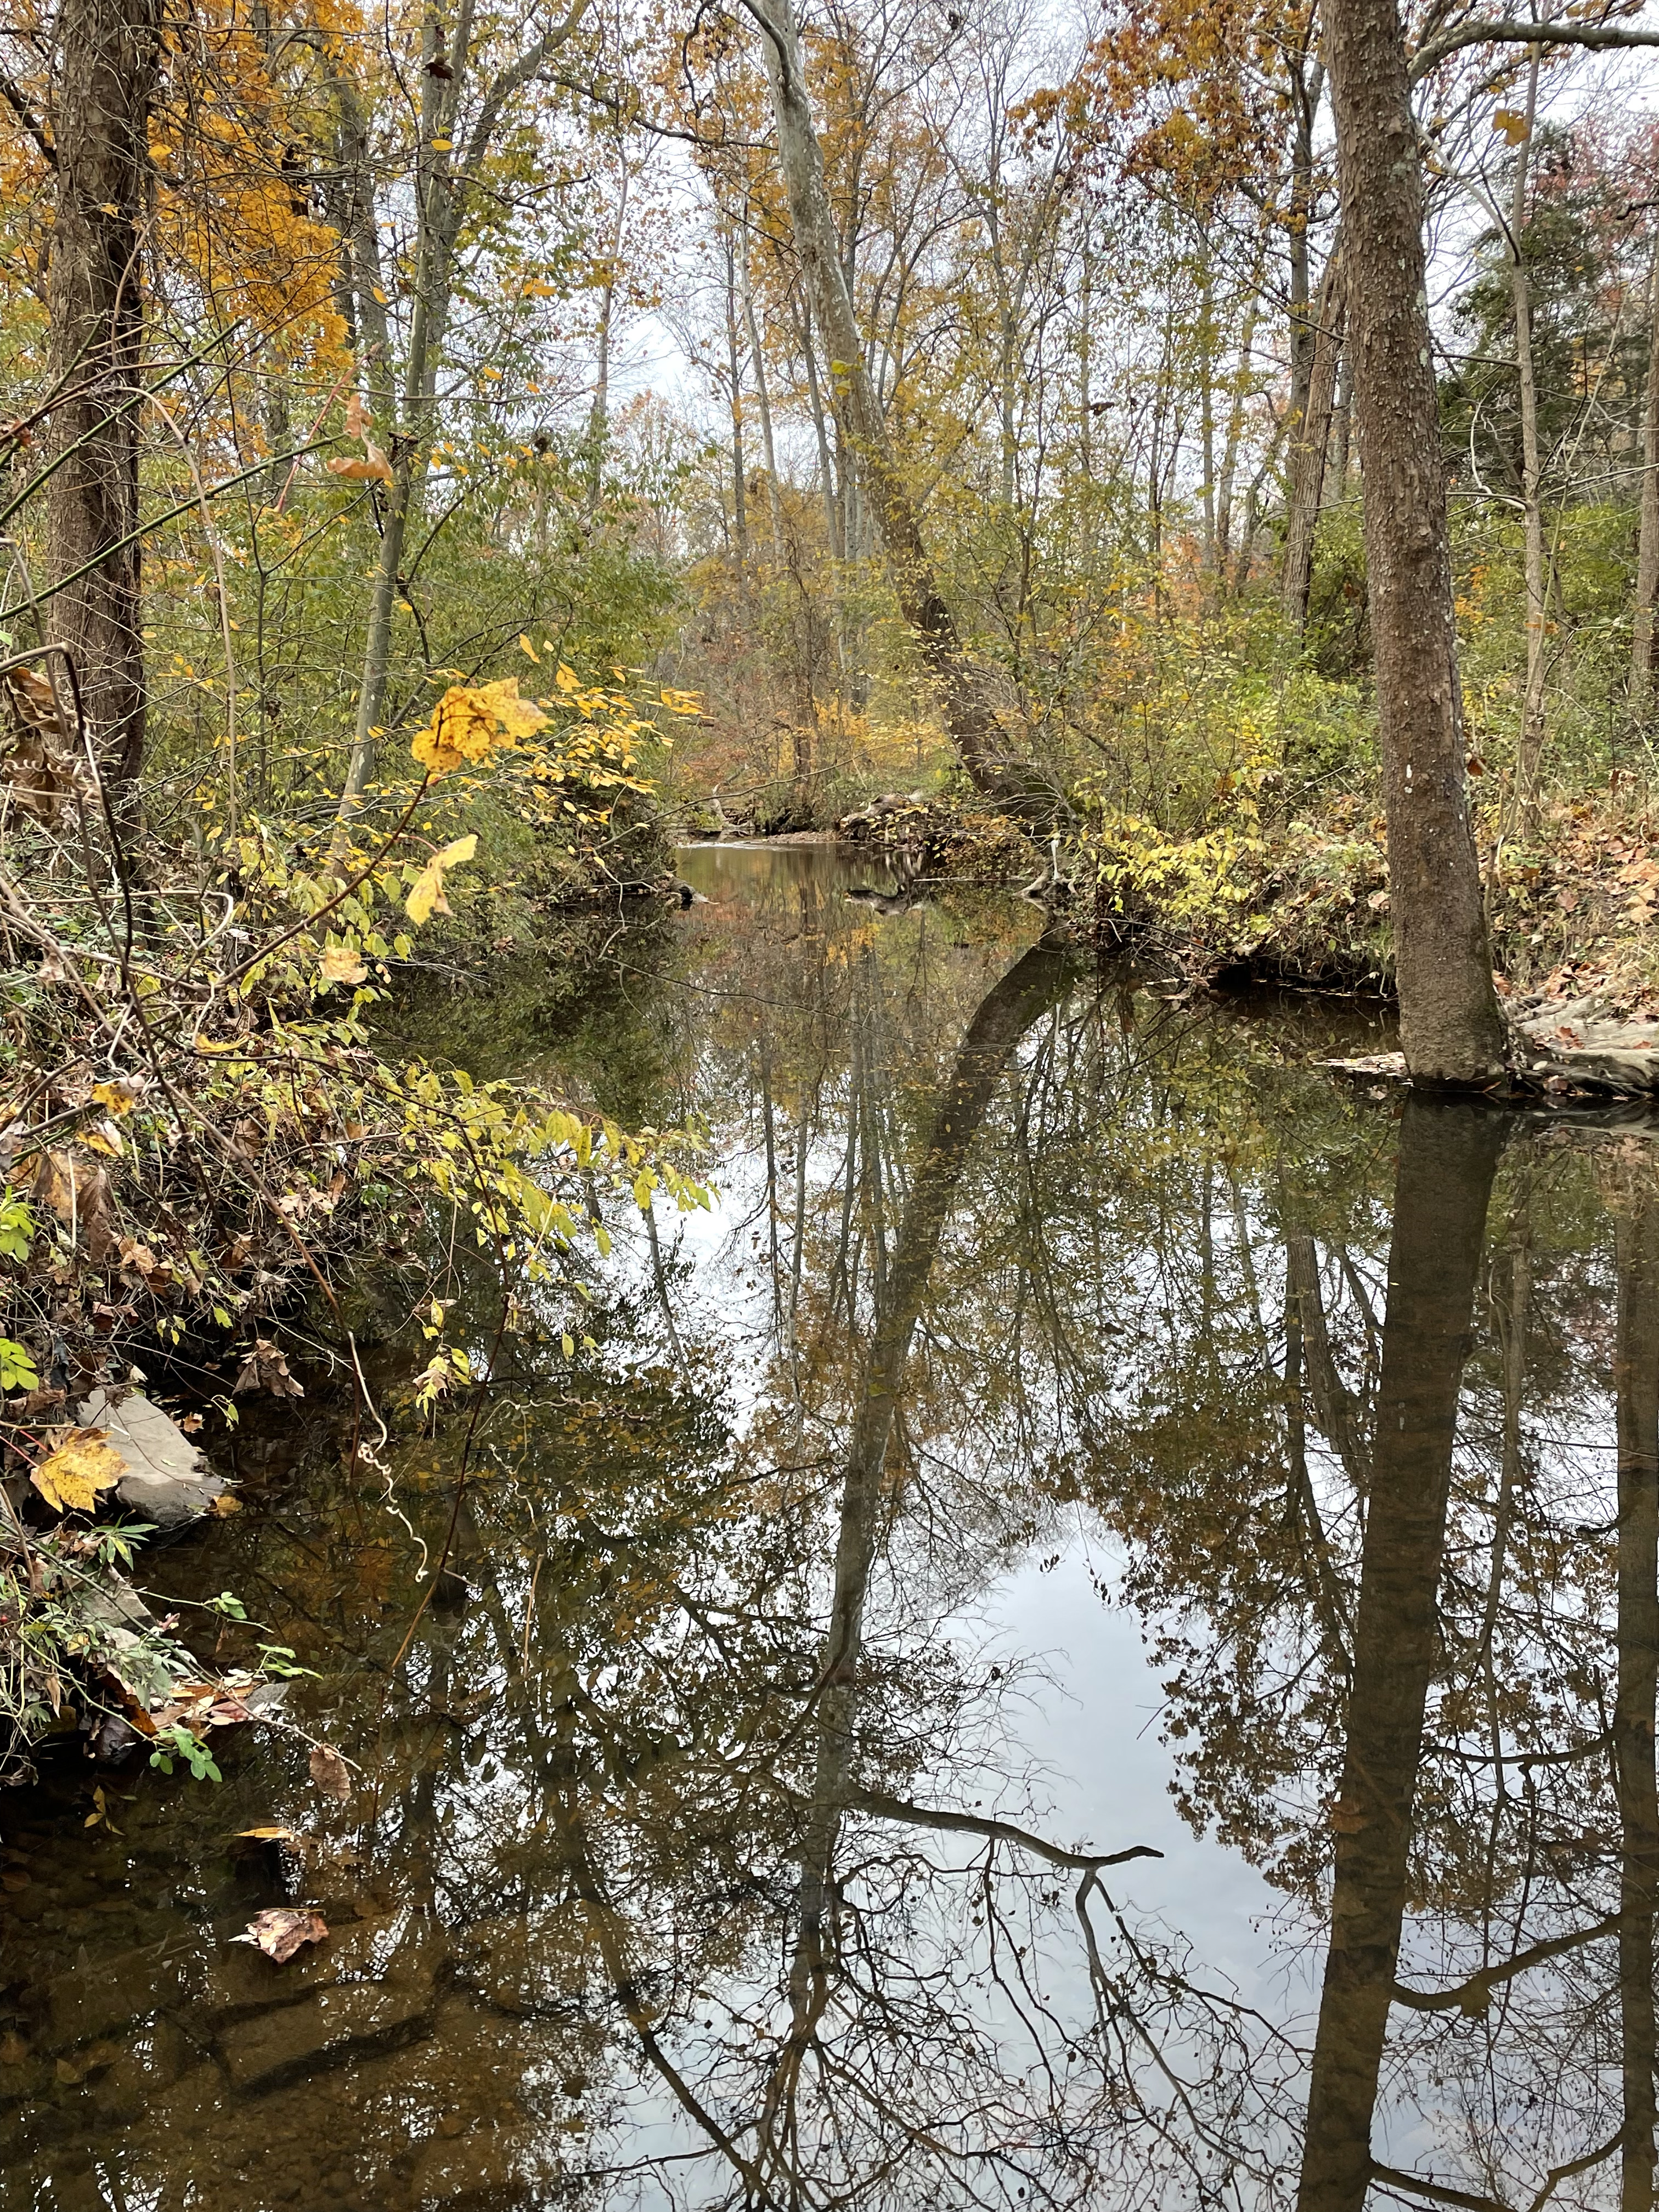

That completes our journey back in time. One last point I’d like to make, and explain the title of this post, is that Northern Virginia was ground zero (see Fig. 7) and every time I go for a walk or short ride, I’m reliving more than a billion years of the earth’s history. It is a humbling experience.
One last thought: our planet transformed from the Paleozoic Era (Fig. 7) to the modern world in 200 million years; at a spreading rate of about 1 inch per year (total widening of the basin) and a little math (200 million inches equals ~3200 miles), I see that Herndon, Virginia is about 1700 miles from the mid-Atlantic ridge, the point where it all began in the early Jurassic Period.
I’m feeling dizzy…
The Closing of Iapetus: Island Arcs and Metamorphism in Rock Creek Park, Washington D.C.
I’ve spoken before about the Iapetus Ocean that separated North America from Europe. It is more than conjecture because there are pieces of the sediments and volcanic rocks underlying it to be found along the east coast of N. America. These ophiolites are proof of the existence of ocean crust and upper mantle pushed onto what later became Maryland (albeit at great depths beneath the surface) during the closing of an ocean basin between approximately 500 and 300 Ma.

The green area in the inset map of Fig. 1 has been classified as the Sykesville Formation. These are sedimentary rocks, formed from a melange that collected behind an island arc. They contain a crazy mixture of sediments eroded from volcanic islands and exhumed rocks when these islands were smeared onto a continent at geological time scales (e.g. Japan and the Philippines today). This is a very slow process. However, this entire episode was nothing more than the prelude to closing of the Iapetus Ocean when two continental land masses collided, neither of which could be subducted beneath the other. Thus, these marine sediments were buried and subjected to incredible pressure and heat, producing the metasedimentary rocks of the Sykesville Formation.

The original sedimentary texture (layers of sediments deposited horizontally) has been overprinted by foliation, a metamorphic texture caused by compression deep beneath the surface, usually at high temperature. The nearly vertical, yellow line in Fig. 2 indicates this metamorphic foliation, which is probably close to the orientation of original bedding. The circled areas show striations on a foliation surface (lower right) and perpendicular (upper left).
After being metamorphosed at great depth these rocks were folded and faulted, so that nearly horizontal bedding and foliation were tilted to nearly vertical. Figure 2 is looking towards the NW (field estimate) and is consistent with similar deformed rocks observed at Great Falls. In other words, these metasedimentary rocks have been folded and faulted (there are several faults within the area) when two continental land masses collided.
A closer look reveals a hint at what occurred more than 300 million years ago.
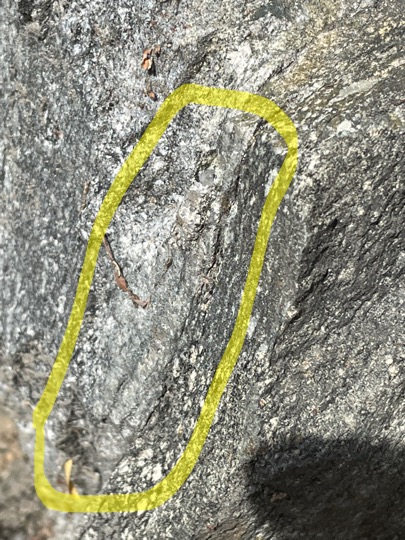
The highlighter in Fig. 3 indicates a bleb of quartz (the gray mineral) with a distinctive pinching (note the lower and upper parts of the circled area). Although this does indicate very high temperatures and pressure, the rock has not melted and there is no indication of veining or other evidence of contact metamorphism.

Textures like those seen in Figs. 3 and 4 are associated with depositional/tectonic environments where clumps of rock are either being eroded by surface processes (e.g. rain and erosion) or plucked from a thick layer of overlying rock as it slides over a given sequence (in this case the Sykesville Formation) when it is buried deeply enough for the rock to be ductile. This poorly understood process produces allochthons like ophiolites. The textures of these rocks have been interpreted (using radiometric and textural data) as resulting from the latter process.
Take a long look at Fig. 4 and imagine sediments deposited in the Sea of Japan being jammed into Korea, buried deeply and sliding over each other for millions of years.
The earth is relentless…
The Newark Supergroup: From Continental Rifting to Glaciation
We didn’t go very far from home today, just down the road to Frying Pan Park; the field area was the hill and a creek near a Baptist Church constructed in 1792 and still in original condition.
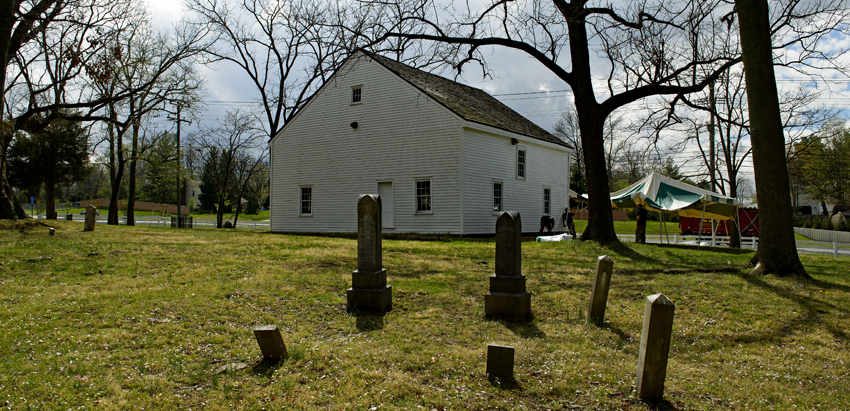
A small cemetery, with one gravestone as recent as 1938, marks the entrance to a series of trails wandering over the hilltop where Confederate soldiers bivouacked less than 20 miles from Washington DC. There were a few skirmishes but no battles.

The geologic map of the area identifies the rocks exposed on hilltops and along the creek (indicated in the center of Fig. 2) as being part of the Newark Supergroup. These rocks were originally deposited between 237 and 174 Ma in shallow basins defined by block-faulted mountains similar to the Basin and Range province of western North America. This was during the early stages of the breakup of the supercontinent Pangea. The sediments were thus immature, i.e., conglomerates, coarse sandstone, siltstone, etc, all mixed together in restricted basins and their deposition changing rapidly over time as the surrounding mountains eroded.
Not long after deposition in rapidly subsiding basins, magma from the upper mantle welled up and filled fractures within the crust. These diabase intrusions heated the sediments of the Newark Group and metamorphosed them by temperature. They were not deeply buried. Thus the rocks we found didn’t look that different from sandstones although they are technically metasedimentary rocks.

The beds are relatively flat here because the rocks were never subjected to compression, so they weren’t folded. Instead, as the crust split apart, they tilted slightly along normal faults to form grabens. In Frying Pan Park, they were horizontal. Zooming in on a bed we can see how sharp the edges are.

There are a couple of details to notice: First, the beds are about six inches thick; second, the rocks show a darkening that isn’t due to surface staining, seen in the block just right of center in the photo; third, the blocks have sharp edges. The darkening is caused by “cooking” of the original sediments when igneous rocks were injected into the pile of sediments. This process is called contact metamorphism. Another effect of coming in such close proximity to magma is that the mineral grains in the sediments become more tightly cemented, producing very hard rocks. Thus the sharp, knifelike edges.
In accordance with the “Rocks and (no) Roads” ethos, I don’t break open hand samples to examine the minerals. I accept what is available because this is about amateur geology, not data collection. There were no freshly broken samples so this is the best I could do.
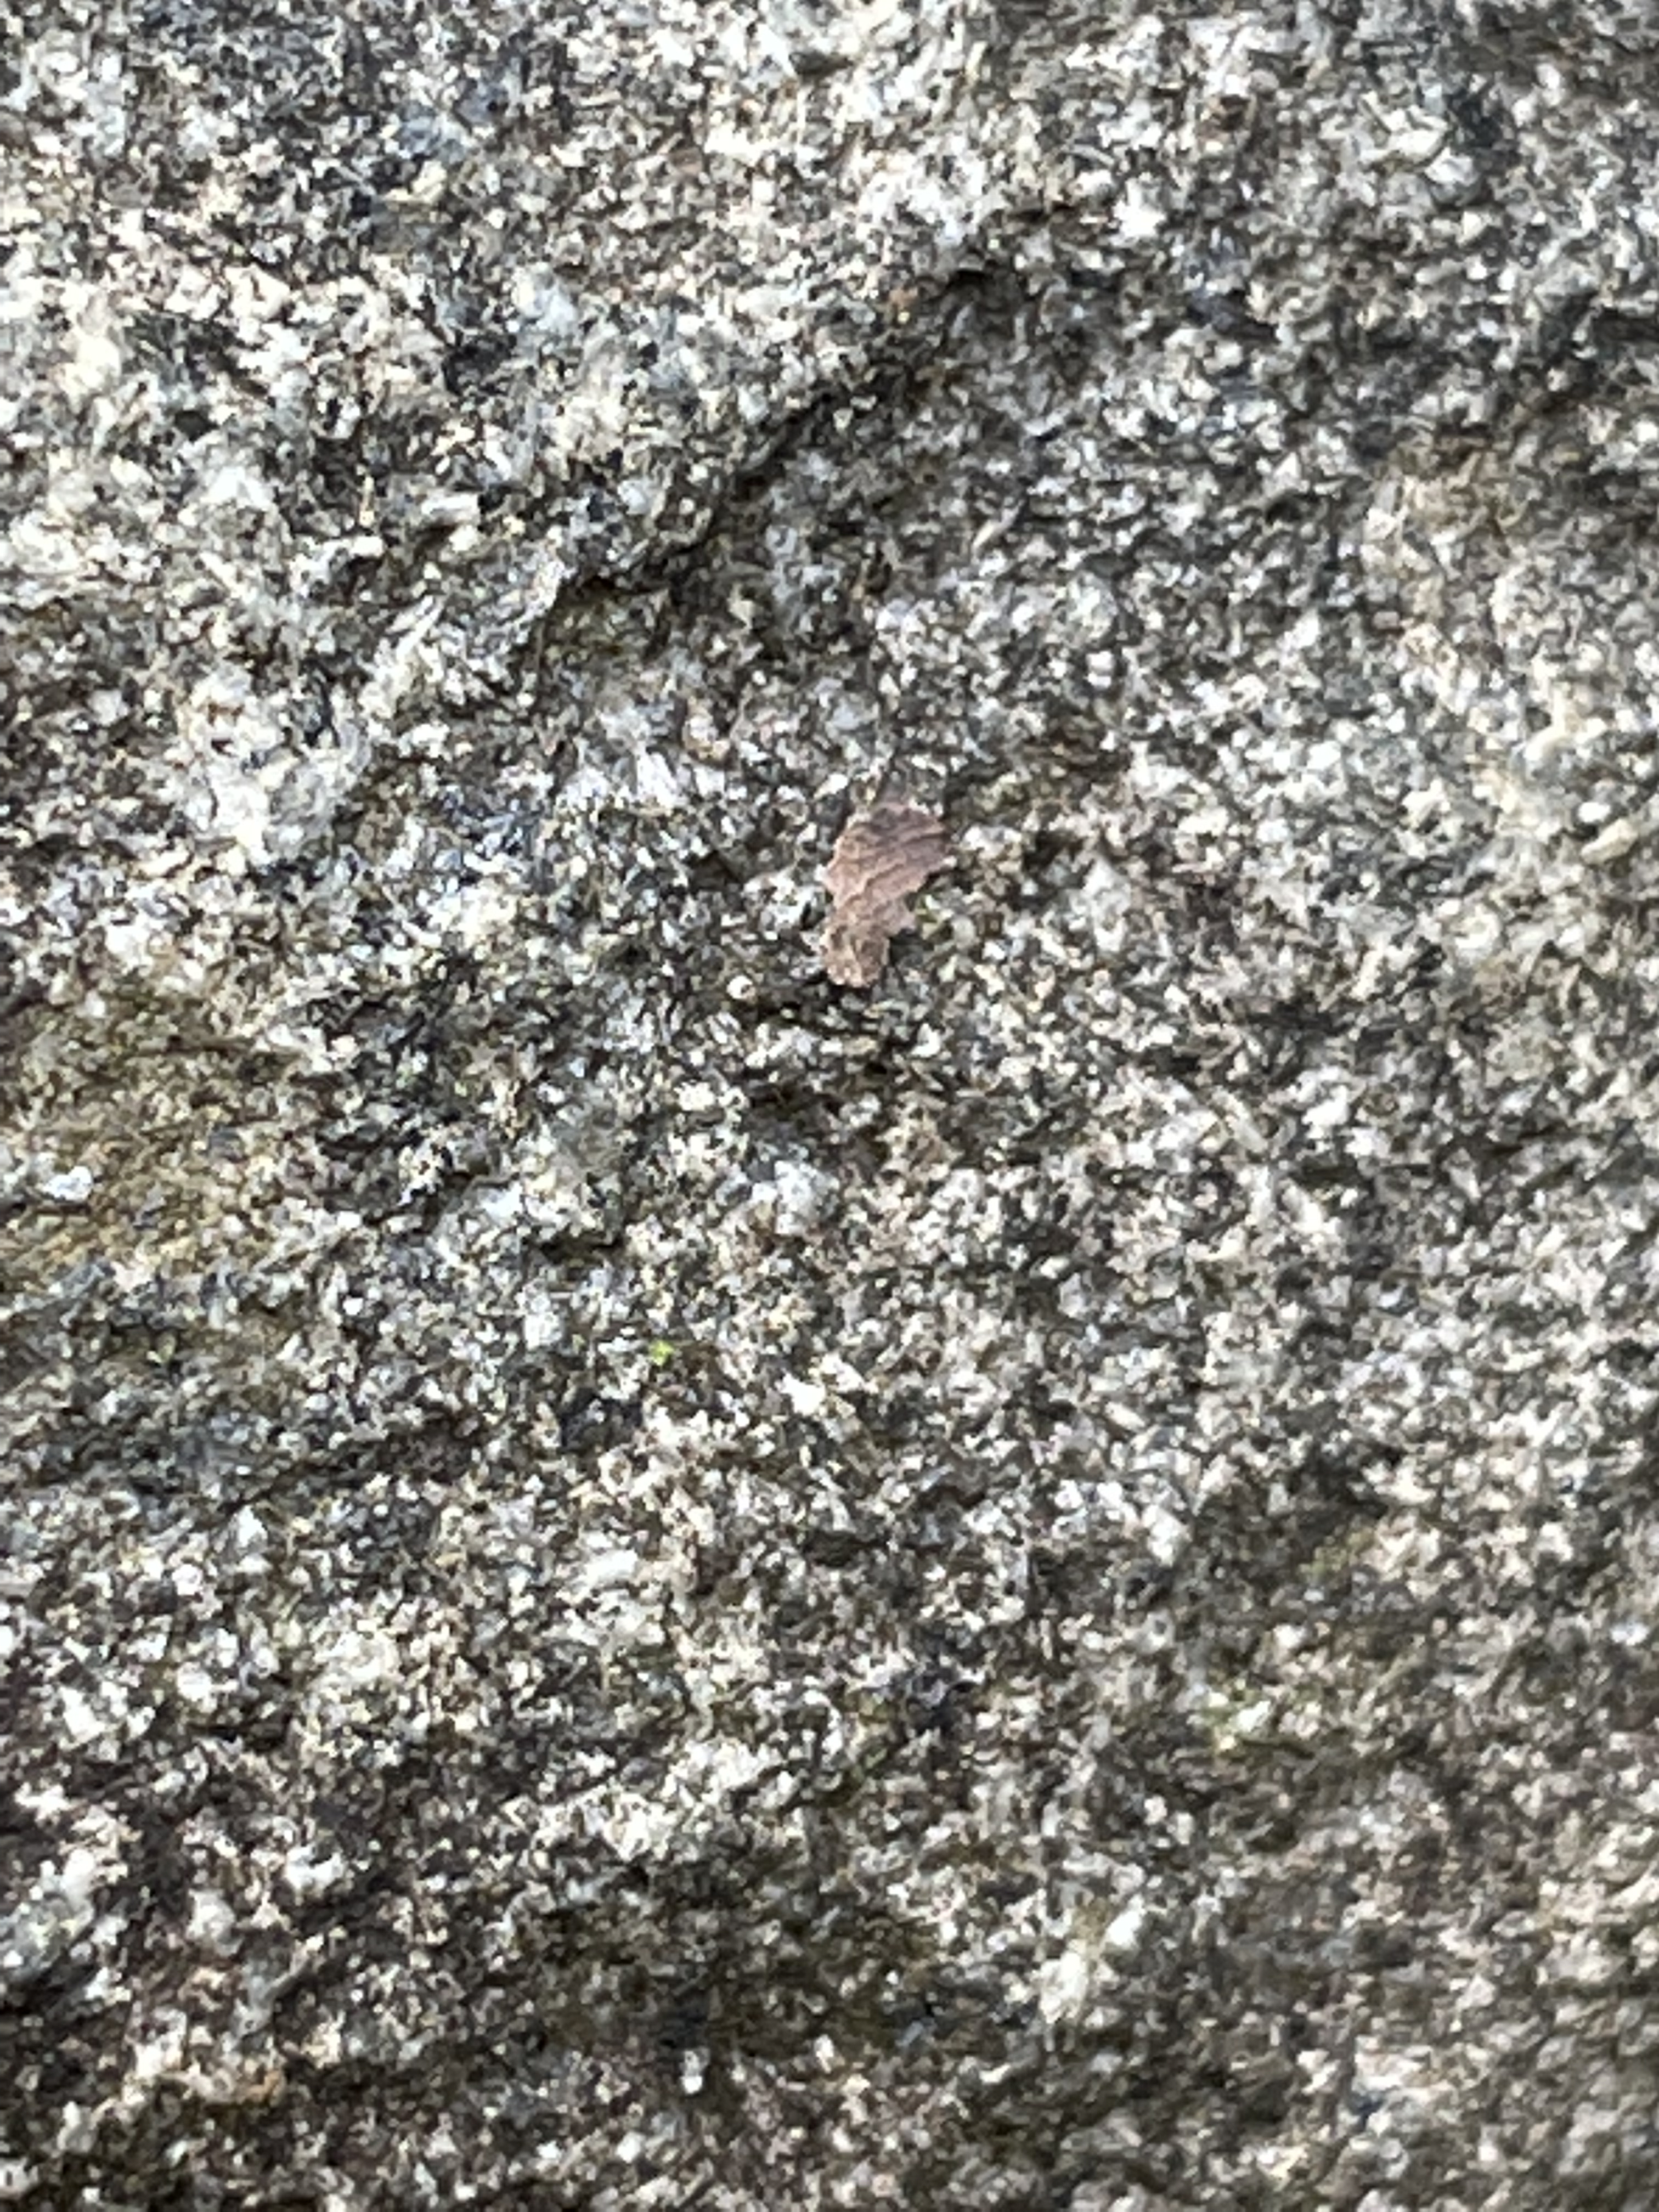
The salt and pepper color is caused by organic stains having nothing to do with the mineralogy. What can be gleaned from this poor field sample is that the individual mineral grains are not rounded and none of them appear to be large, so this is an immature sandstone (greywacke) and not a conglomerate. If it were from an environment like a beach, the grains would be visibly smoother, even to the naked eye. (For example, check out orthoquartzite.)
The sediments that comprise the Newark Group collected in intermontane basins. The Sierra Nevada is an example of what the topography may have looked like when these sediments were deposited about 200 million-years ago.

After being buried several miles (nobody knows exactly how deeply) beneath the surface for 200 million years, these rocks were exhumed when ice sheets advanced into Pennsylvania during the last ice age, which began at least 2.5 million years ago. Northern Virginia was never covered by ice, but it was within a hundred miles of an ice sheet that reached two-miles in thickness. Two miles! The result was felt far to the south, where massive seasonal floods at the leading edge of the ice would have transported very large blocks of stone down rapidly eroding valleys.
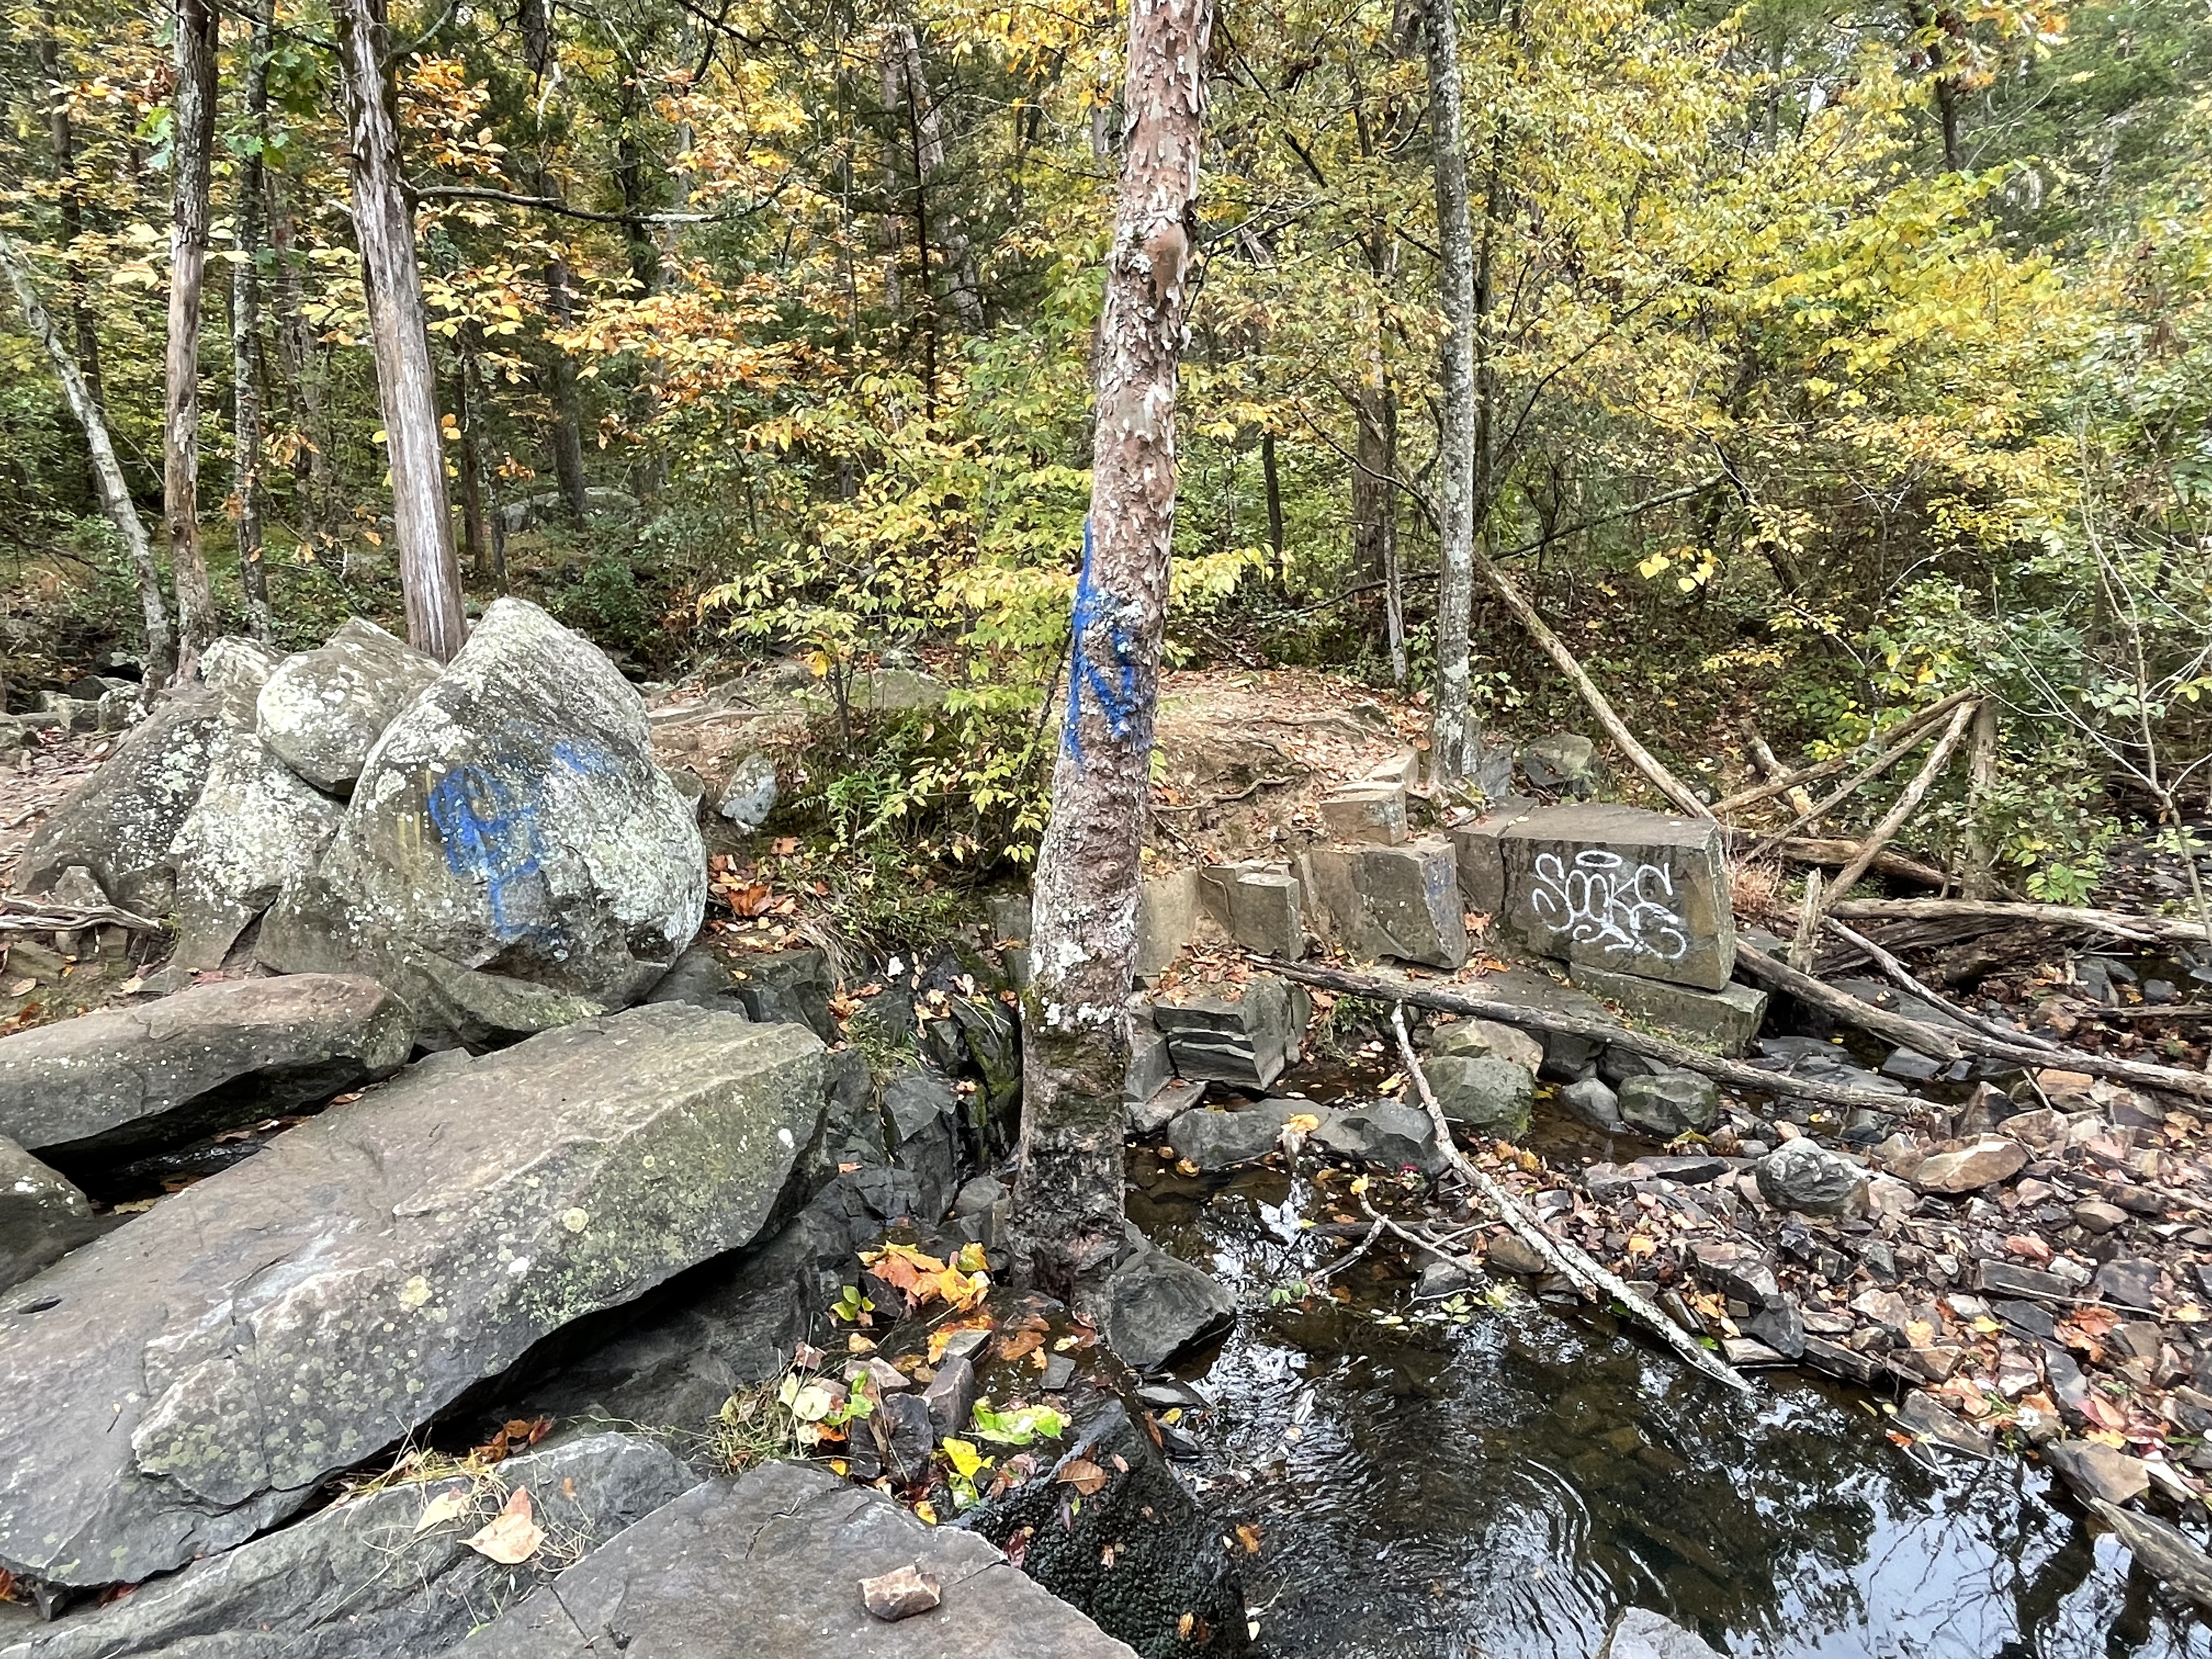
This is a great picture. Four things leap out of this pastoral image of a NoVA forest: (1) The graffitied block reveals bedding much thicker than that seen in Fig. 4, suggesting a dynamic environment, possibly an alluvial fan, when these grains were washed down the sides of rising mountains (see Fig. 6) and came to their final resting place; (2) the larger blocks show a joint pattern that determined how the rocks would break down and weather when the third event occurred; (3) the rounded blocks juxtaposed on top of the jointed bedrock outcrops indicate fast-flowing water that physically eroded them and transported them some distance (less than a mile); and (4) the modern creek flows weakly over its boulder-strewn bed. This short stream, its watershed consisting of a few hilltops, didn’t transport these behemoths anywhere.
But this creek isn’t relict, it’s simply operating on a different time scale.

This boulder field, littering a dry fork of Frying Pan Branch, suggests that the smooth flow over the upstream reach shown in Fig. 3 is capable of transporting large rocks; however, it’s all relative from a geological perspective. If I were to guess, I’d say that the boulders in Fig. 8 haven’t moved in several thousand years. My reasoning is that the clear path seen in Fig. 3 suggests that there are no more large stones to roll downhill and dislodge others, like dominoes. But we never know what comes next.
A summary of the impacts of the most-recent ice age in Virginia is available at this web site. Take a look.
See you next time.
Great Falls, Virginia: Deformation of Precambrian sediments when North America collided with Europe
This is my first post from Virginia. We went to Great Falls National Park on the Potomac River, only a few miles from our home in Northern Virginia. This is a fascinating area that reveals evidence of several cycles of collision between North America and Europe.
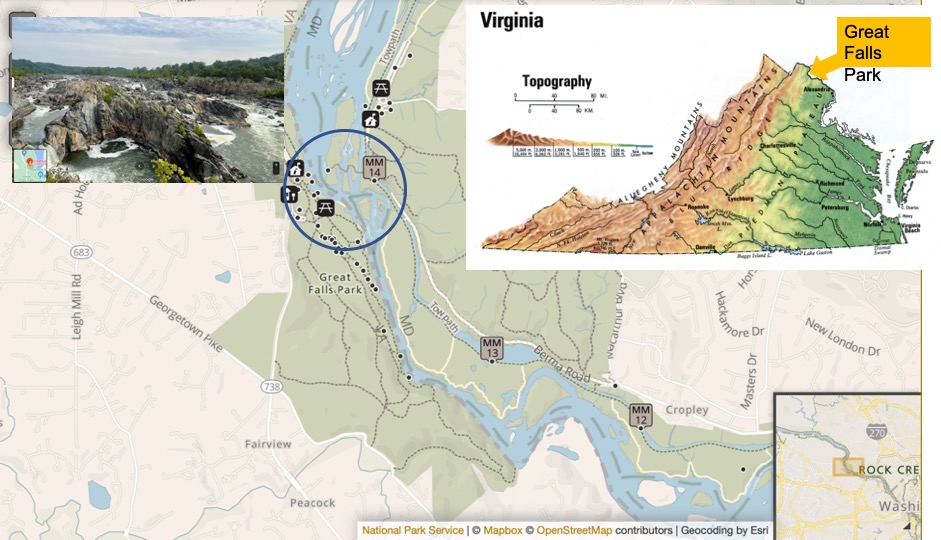
The inset map shows where we went, situated between the Blue Ridge and Coastal Piedmont provinces. Notice the linear topography of the Blue Ridge, which is the result of crustal deformation when North America collided with Europe about 500 million years ago (Ma). The inset photograph (taken from the park’s web site) shows rocks that have resisted erosion and created the narrow gorge south of the circled area on Fig. 1. This narrow border between Virginia and Maryland is called Mather Gorge. The 76 foot drop in elevation is a local manifestation of what is called the “fall line,” where rivers drop out of the Appalachian Mountains to the coastal plain.
A photograph of the metamorphic rocks at this location reveals a polished appearance, with quartz veins (white areas) standing out against the softer matrix.

Sediments deposited during the Grenville Orogeny included every imaginable lithology, from conglomerates to muds, over millions of years. These sediments were buried many miles beneath the earth’s surface and heated by the collision of tectonic plates about 500 Ma, when the proposed Iapetus Ocean was closing to form a supercontinent called Pangea. It is always difficult to infer original orientation of the precursors to metamorphic rocks like these schists, but they have a pronounced orientation of layers. For example, note the near-vertical lineations seen in Fig. 2. This overall structure is also visible at larger scales.

Figure 3 is looking towards the northeast. Note the dark lines between layers of schist on the left (western) side of the photo. These lineations are approximately aligned with the quartz veins and blobs from Figure 2. Compare this image with the inset map from Figure 1 which shows the topography of the Blue Ridge mountains. The NE-SW orientation at the regional scale (inset map of Fig. 1) is seen at the outcrop scale (Figs. 2 and 3) at Great Falls.
Looking southward along the Potomac, into Mather Gorge (Fig. 4), everything falls into place.

I admit to some geological speculation, but I won’t suggest anything unrealistic. Compare Figs. 3 and 4, which look upstream and downstream (respectively), and then glance at Fig. 1, which shows how the Potomac River transitions from a broad riverbed flowing around resistant islands to become restricted to a narrow channel. The range of intermediate scale (what we could see during our field trip) structures in Fig. 2 suggest that Great Falls was a transition zone, where the stress regime changed suddenly when these rocks were deeply buried, possibly because of a change in the lithology of the original Grenville rocks, maybe because of a sudden change in the rate of plate-tectonic movement.
To conclude this post, I’d like to add that the rocks seen at the observation point (Fig. 2) were subjected to the same forces that the rocks at the bottom of the current Potomac River (Fig. 3) are experiencing. That’s why the outcrops are so rounded and the quartz veins and blobs stand out in relief. Quartz is a hard mineral (7 on the Mohs scale). The river excavated Mather Gorge with the help of boulders rolled along its bed for millions of years, polishing the very hard rocks that resisted erosion.
See you next time.
The Adelaide Superbasin
The terminology and nomenclature used in geology change constantly, just like in every other discipline. Thus, what was originally a geoscyncline, became a rift complex, and is now a superbasin. I guess that being bigger is better than being complicated. Adelaide is in the Wild West of Australia. Because of the name change, this post is about the Adelaide Superbasin (Fig. 1).
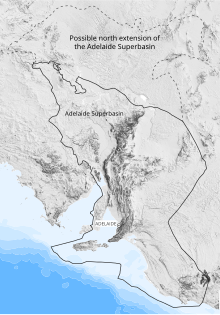
It isn’t possible to describe hundreds of stratigraphic formations in a blog post, so I’ll do as I always do and describe what I saw with my own eyes. I couldn’t find a geological map of South Australia, so I’ve compiled a schematic map of the the region (Fig. 2).

The Starting Point (Fig. 2) was reached after crossing the Murray River at Murray Bridge(Fig. 3), a view not unlike entering the Rio Grande Valley at Las Cruces.
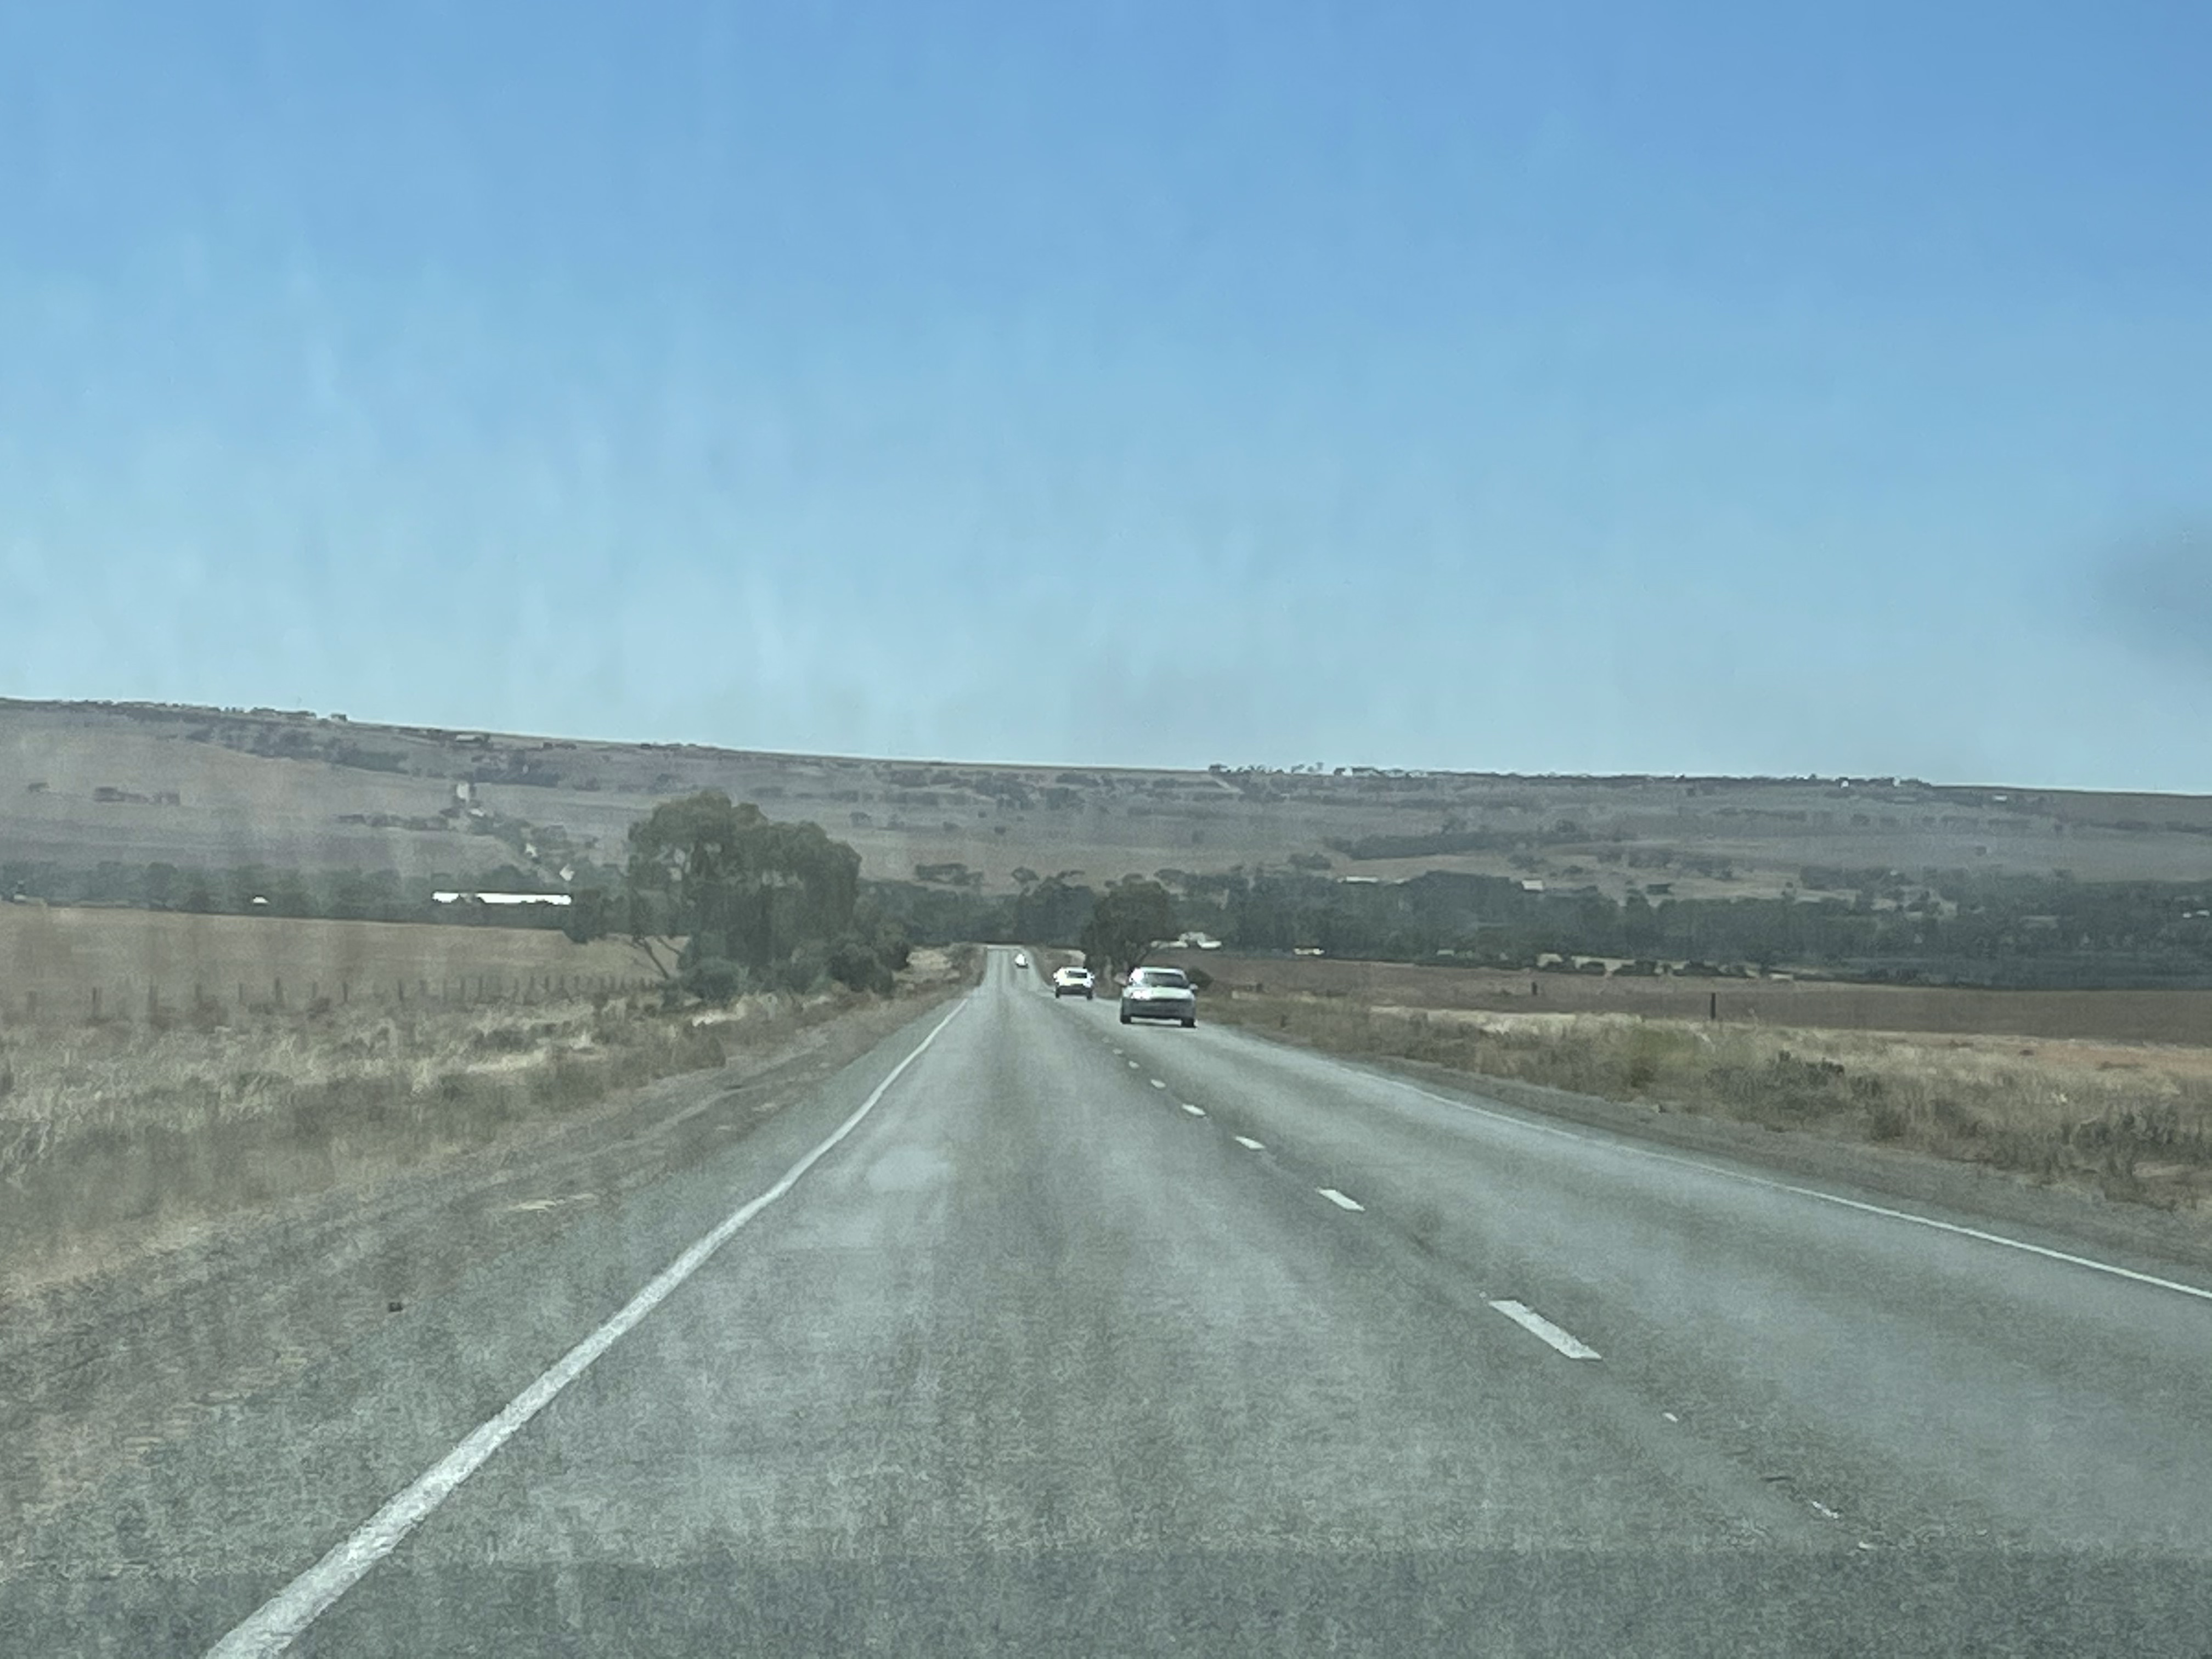
The Murray River was the lifeline for the agricultural regions of South Australia until the1940s, when rail and trucks finally became more profitable. The river remains a center of transportation and tourism (Fig. 4).

The Murray River is also a major source of water for the region. Large pipes followed the highway, leading in different directions, unimpeded by the Flinders Range (Fig. 5).

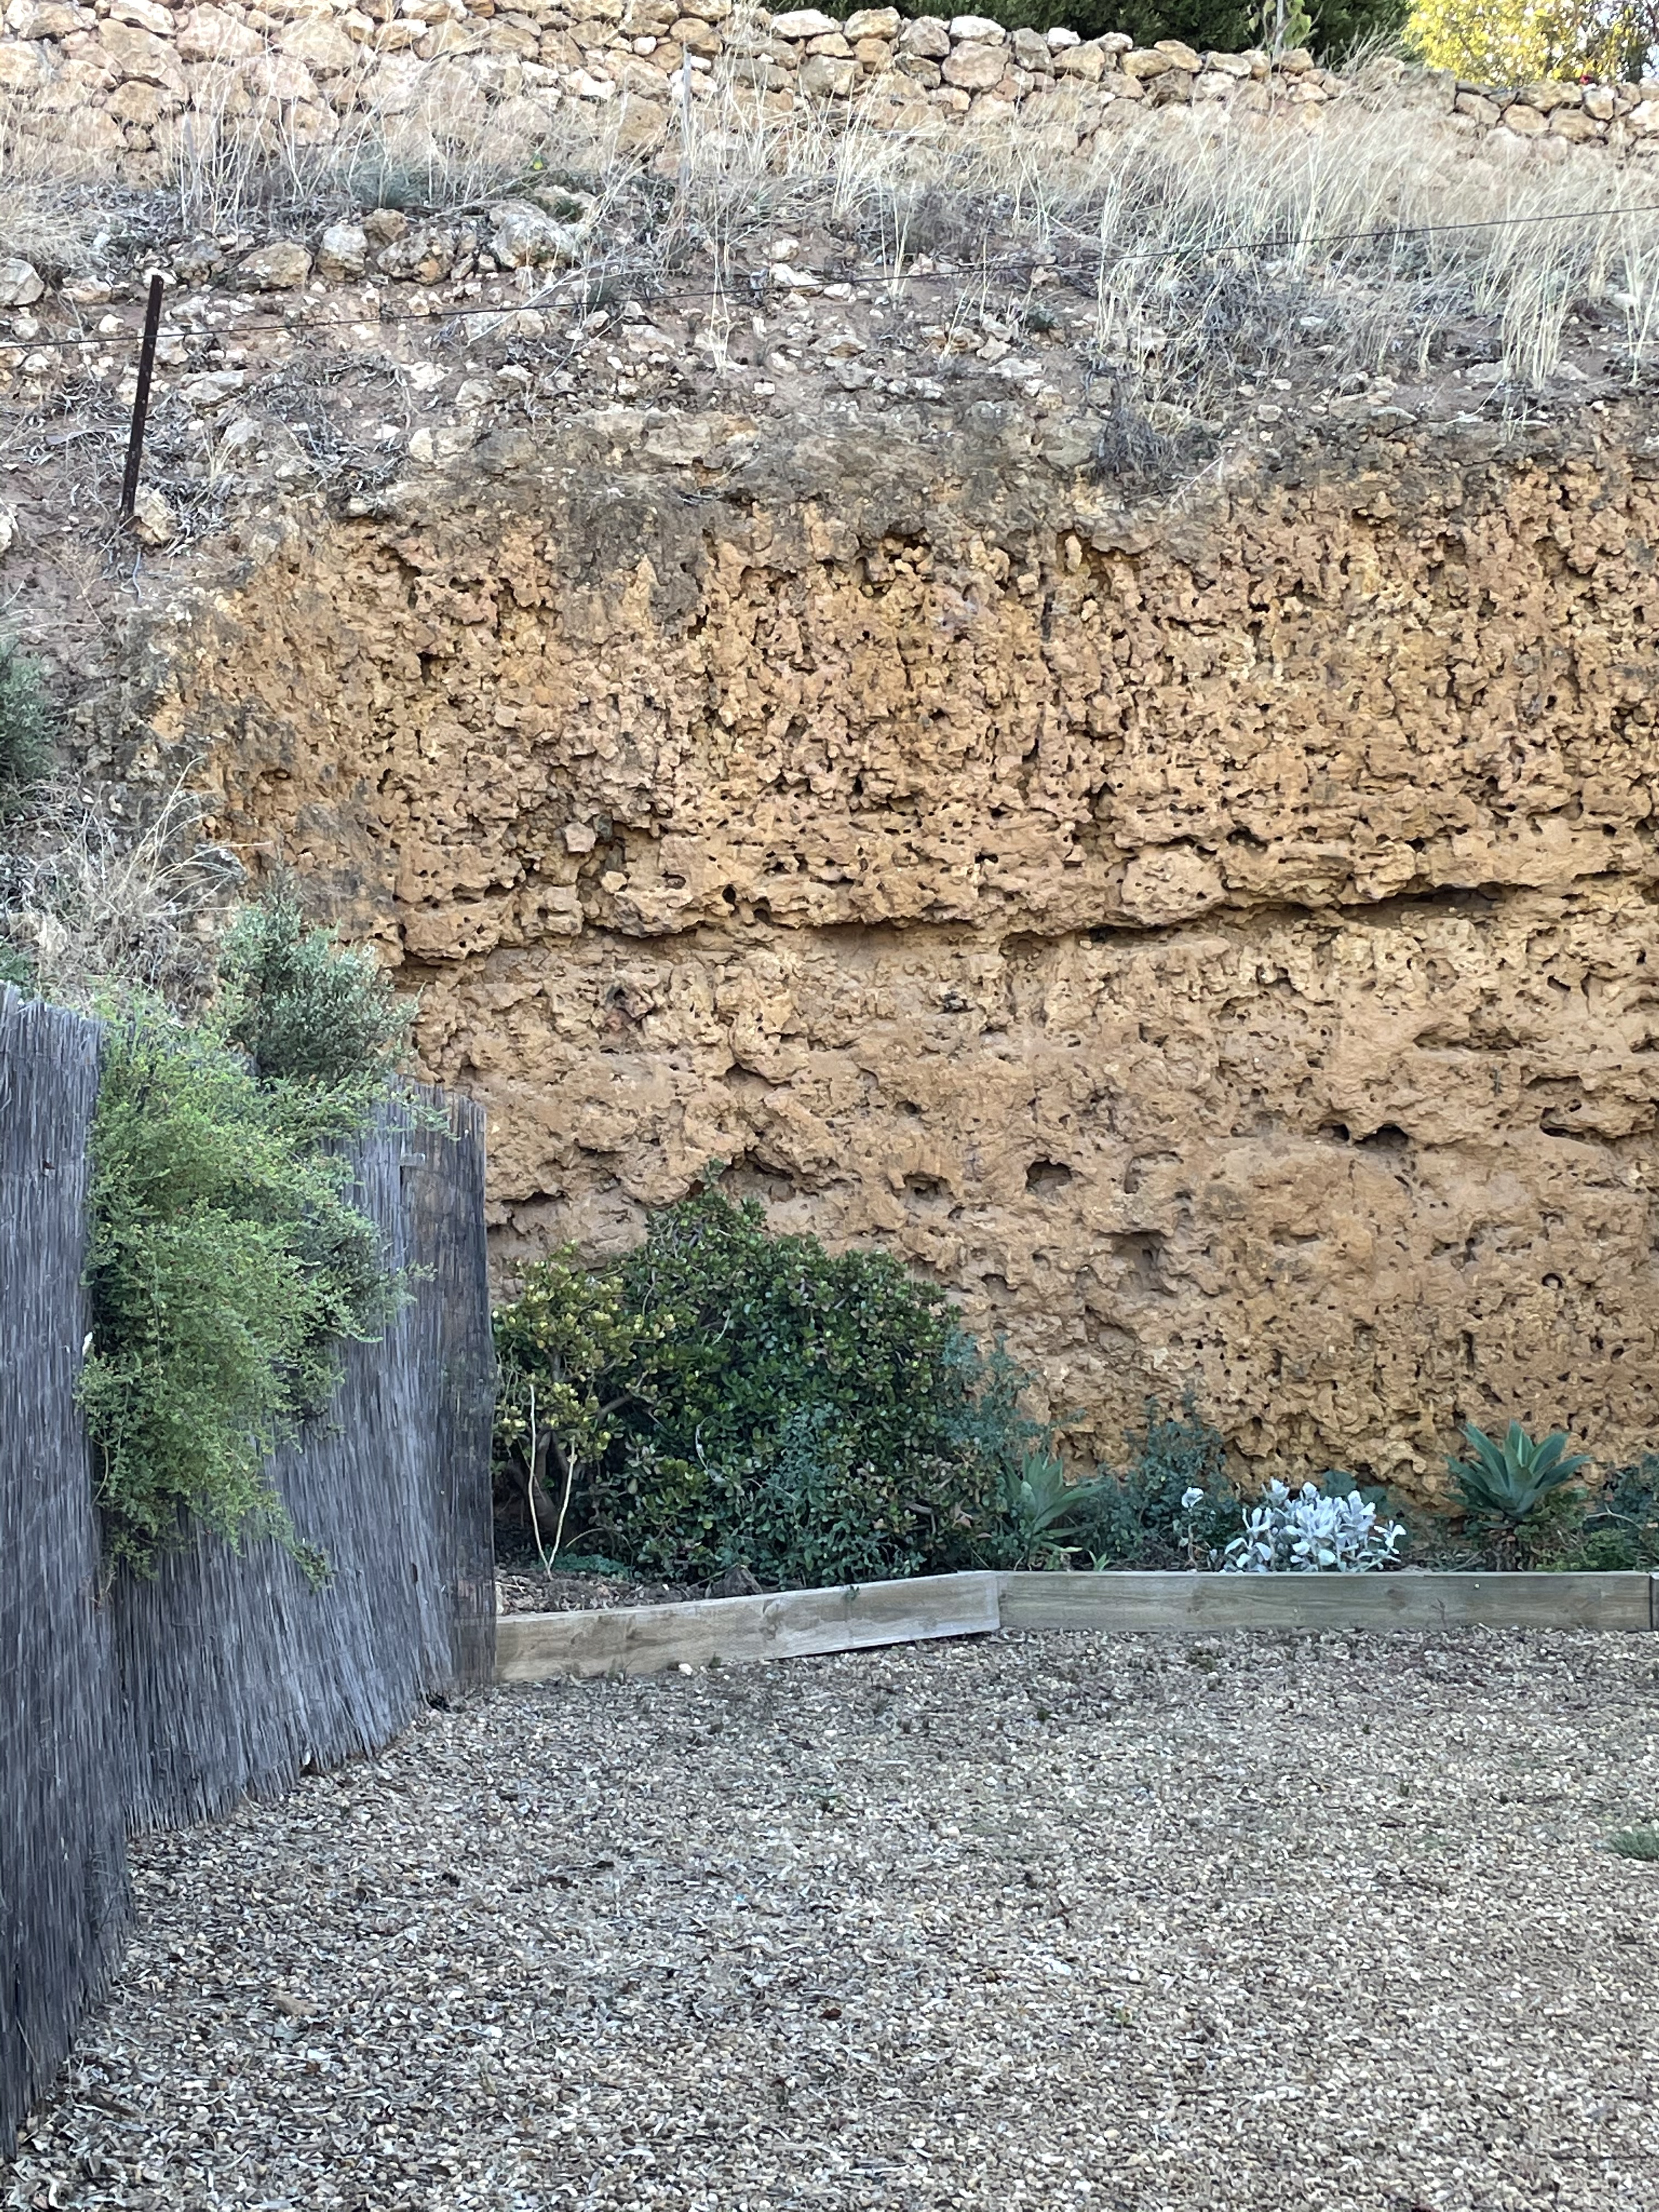
Now we’re ready to begin our journey, at the east side of the rectangle outlined in blue from Fig. 2. Erosion along the banks of the Murray River exposes Cenozoic (66-0 Ma) sedimentary rocks that are poorly consolidated but resistant in the low rainfall of this region (Fig. 6).
Heading WNW from the “Starting Point,” our path took us over some rolling hills capped by rounded exposures of what turned out to be alkali granite (Fig. 7), which is about 500 Ma old.

Viewed up close, this rock consists of quartz and alkali feldspars (i.e. albite and orthoclase), with minor biotite (Fig. 8).

This rock appeared capping hills but formed no cliffs or ledges. Within a mile of this outcrop we found the country rock (Fig. 9), Neoproterozoic to Early Cambrian (541-509 Ma) sedimentary siliciclastic rocks.
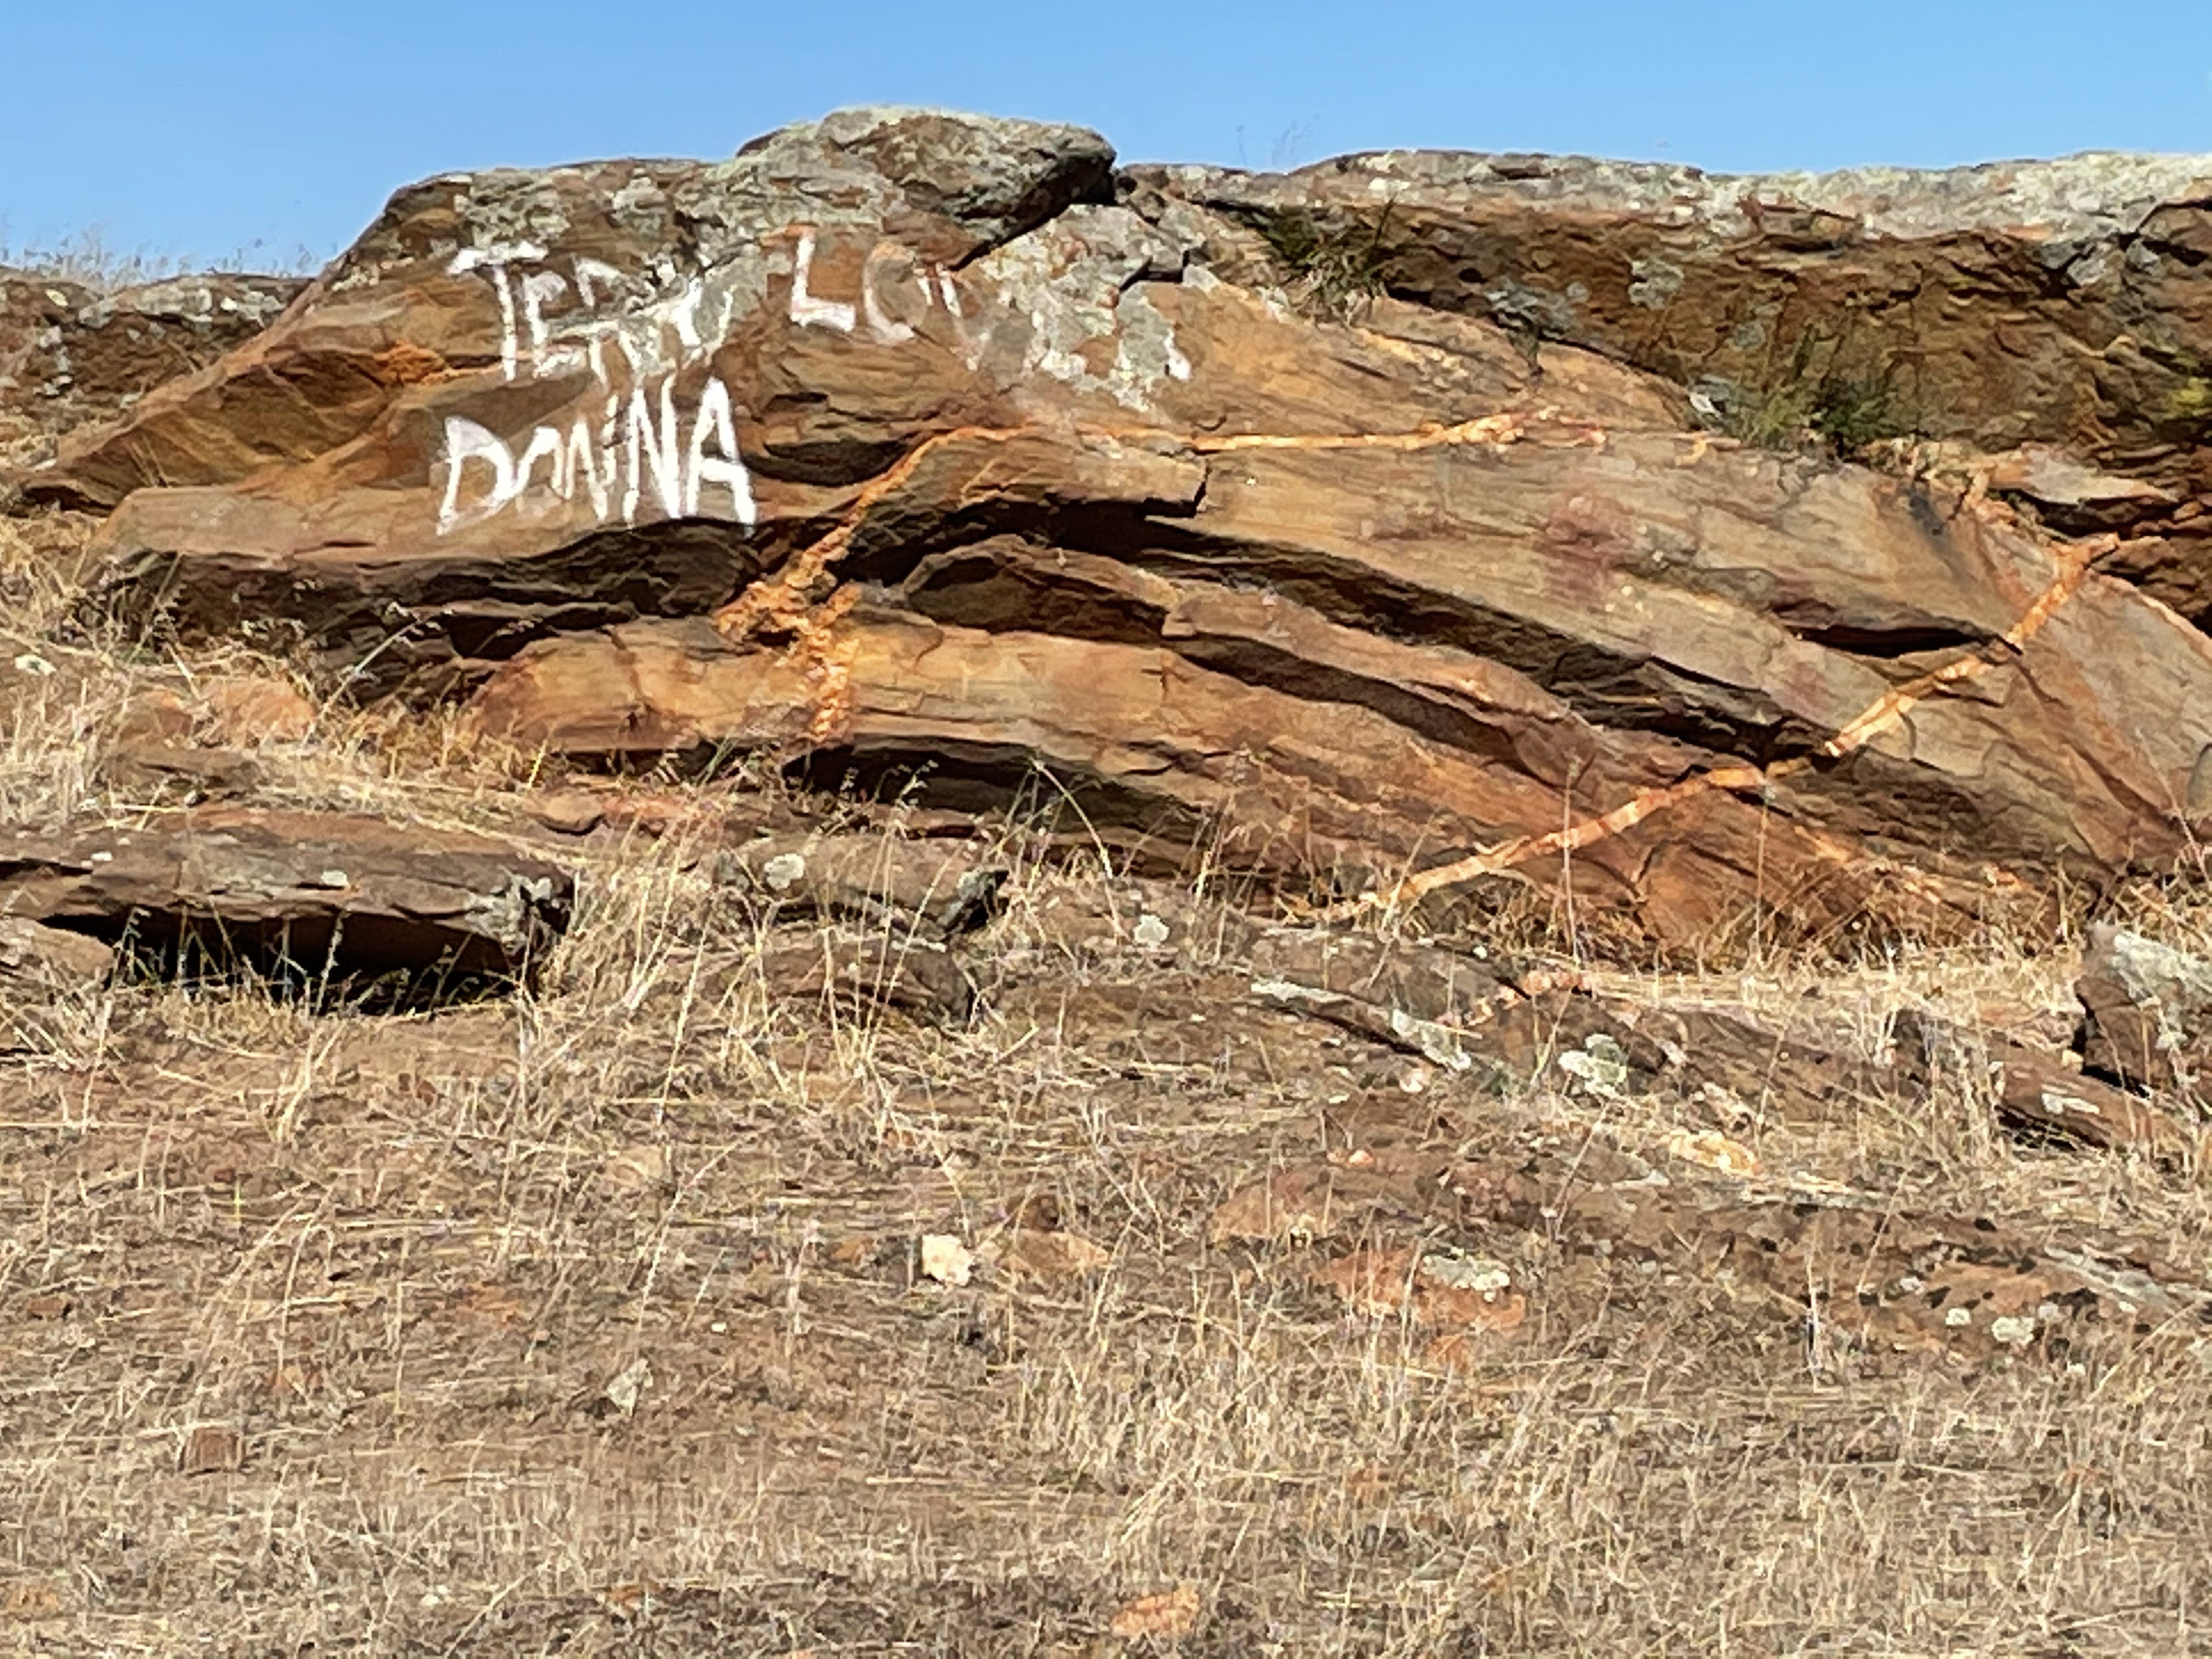

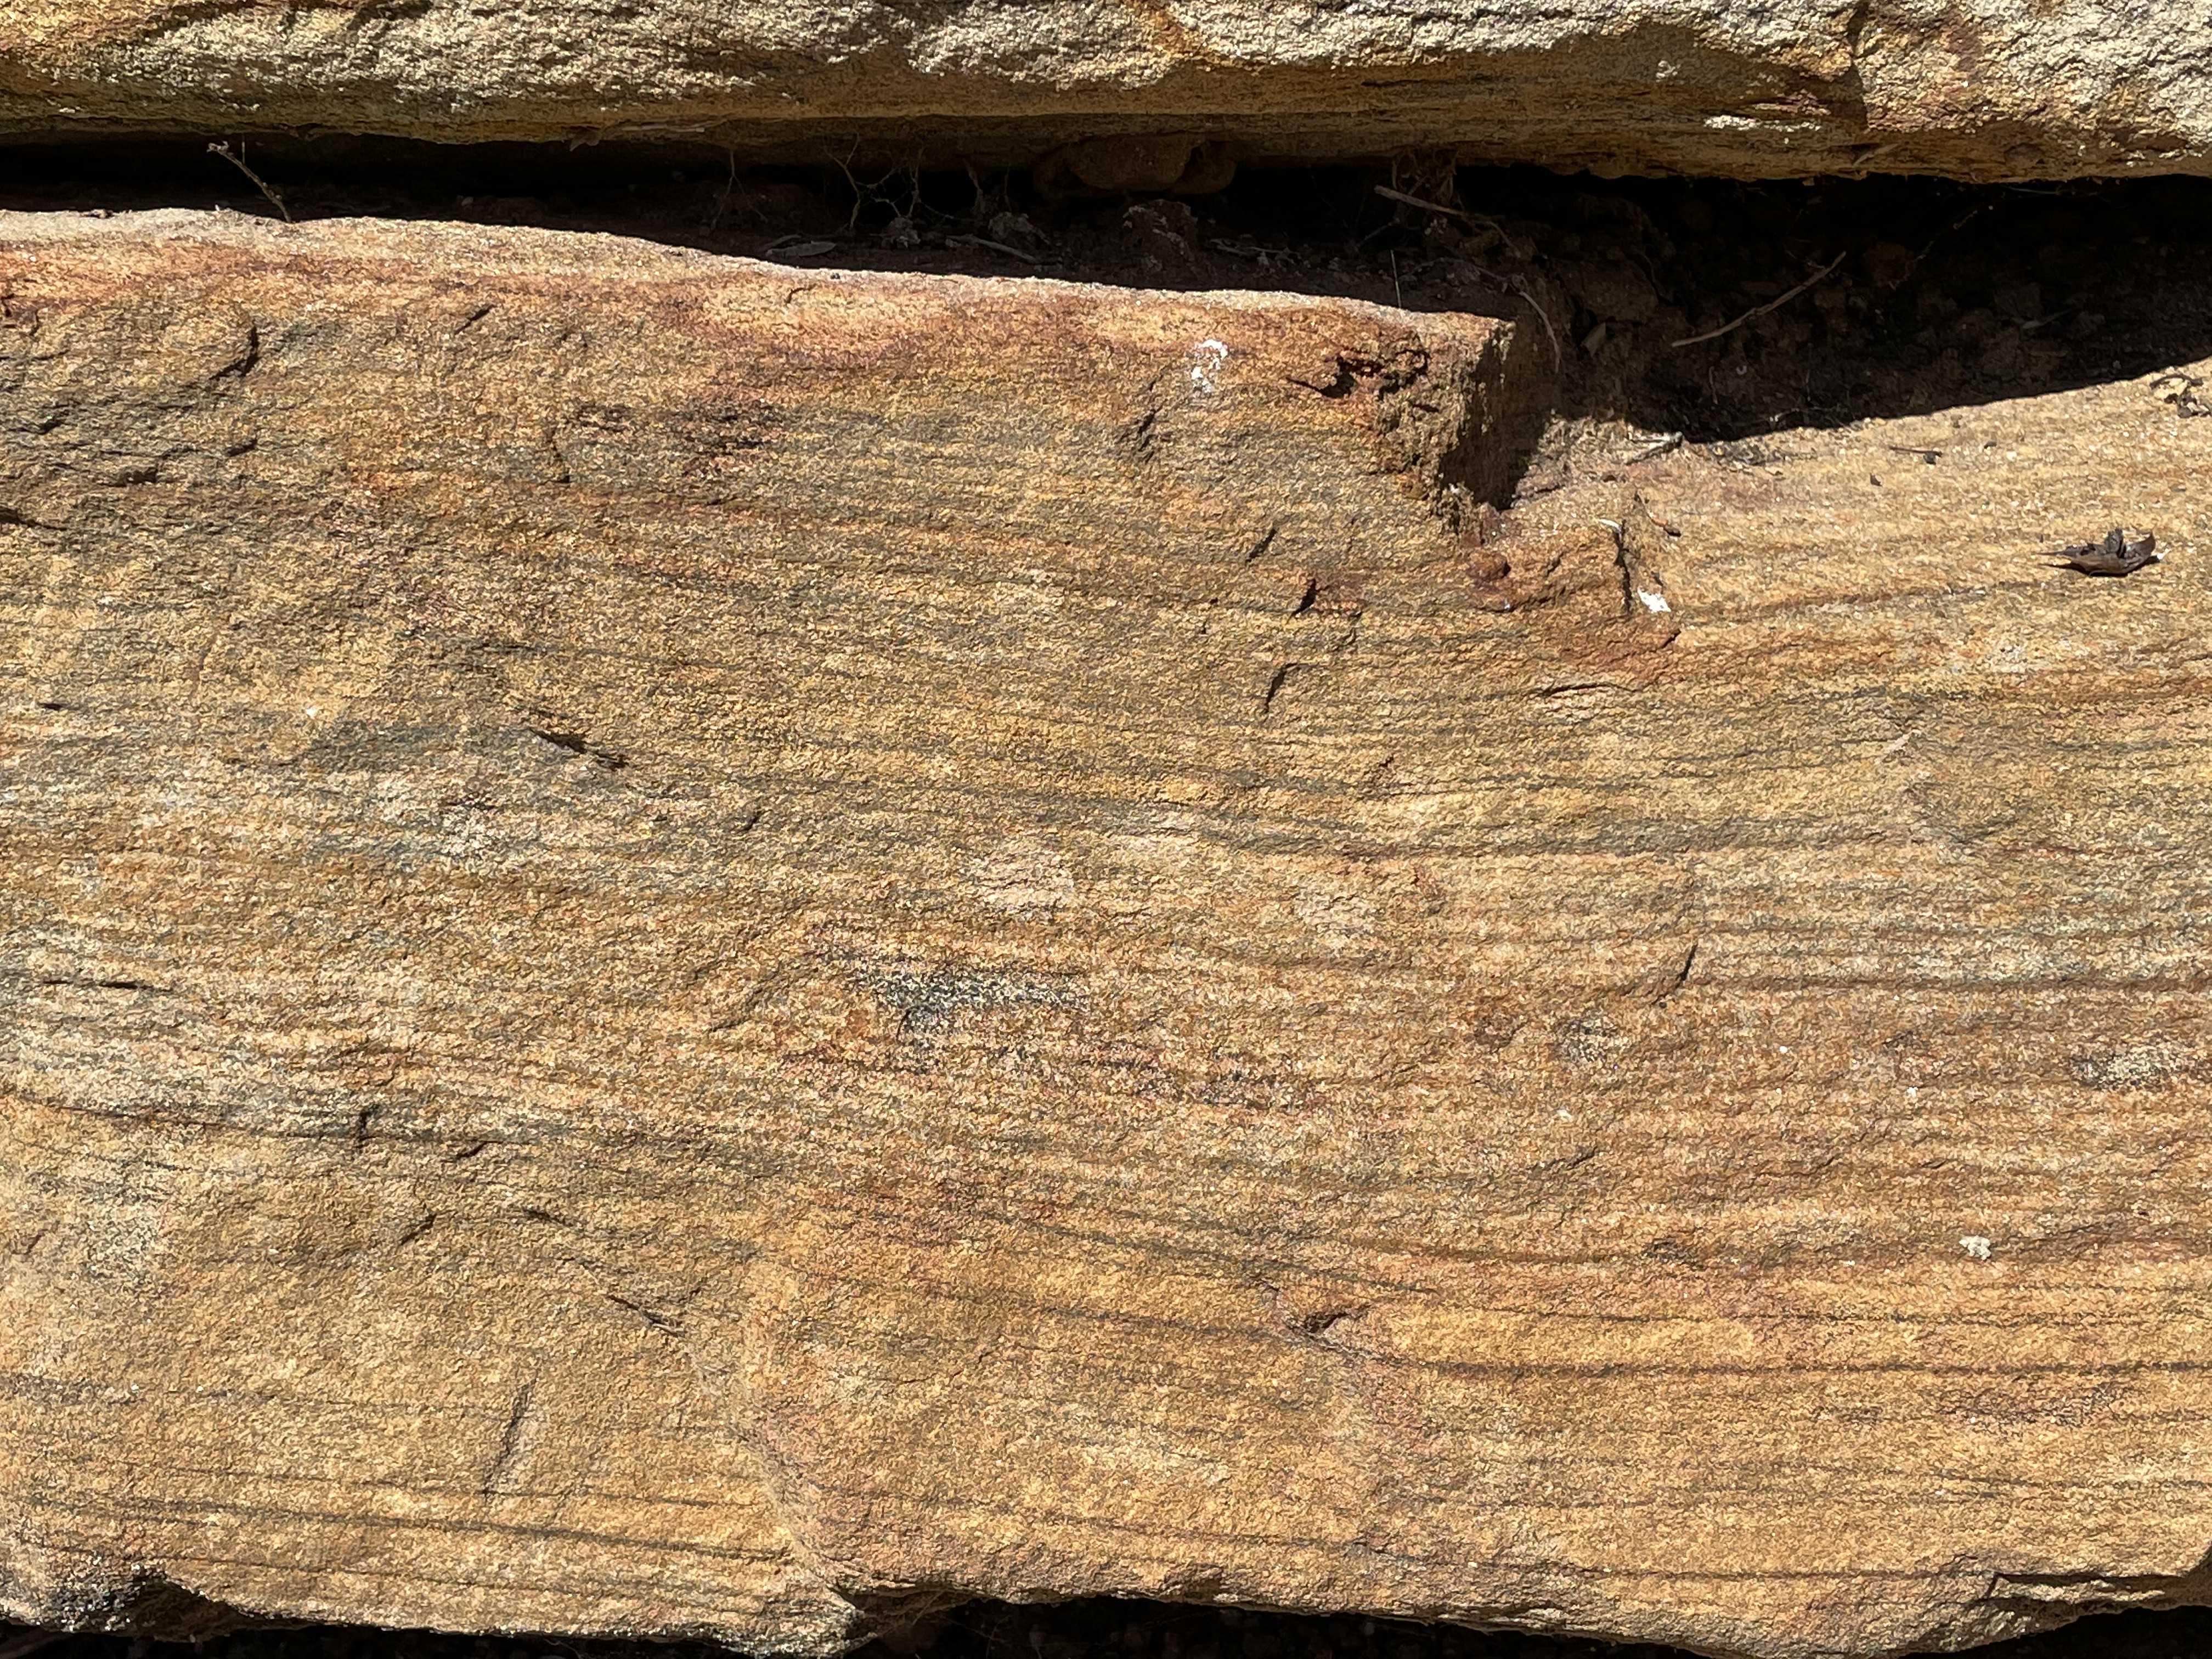
These exposures appear to retain their original sedimentary texture, comprising thin bedding and lamination. However, they are very near exposures of younger granite, which suggests an intrusive relationship during metamorphism. Note the dip of the beds in Fig. 9.
A freshly cut block (to make room for a fence) reveals foliation that suggests high-pressure metamorphism (Fig. 10).

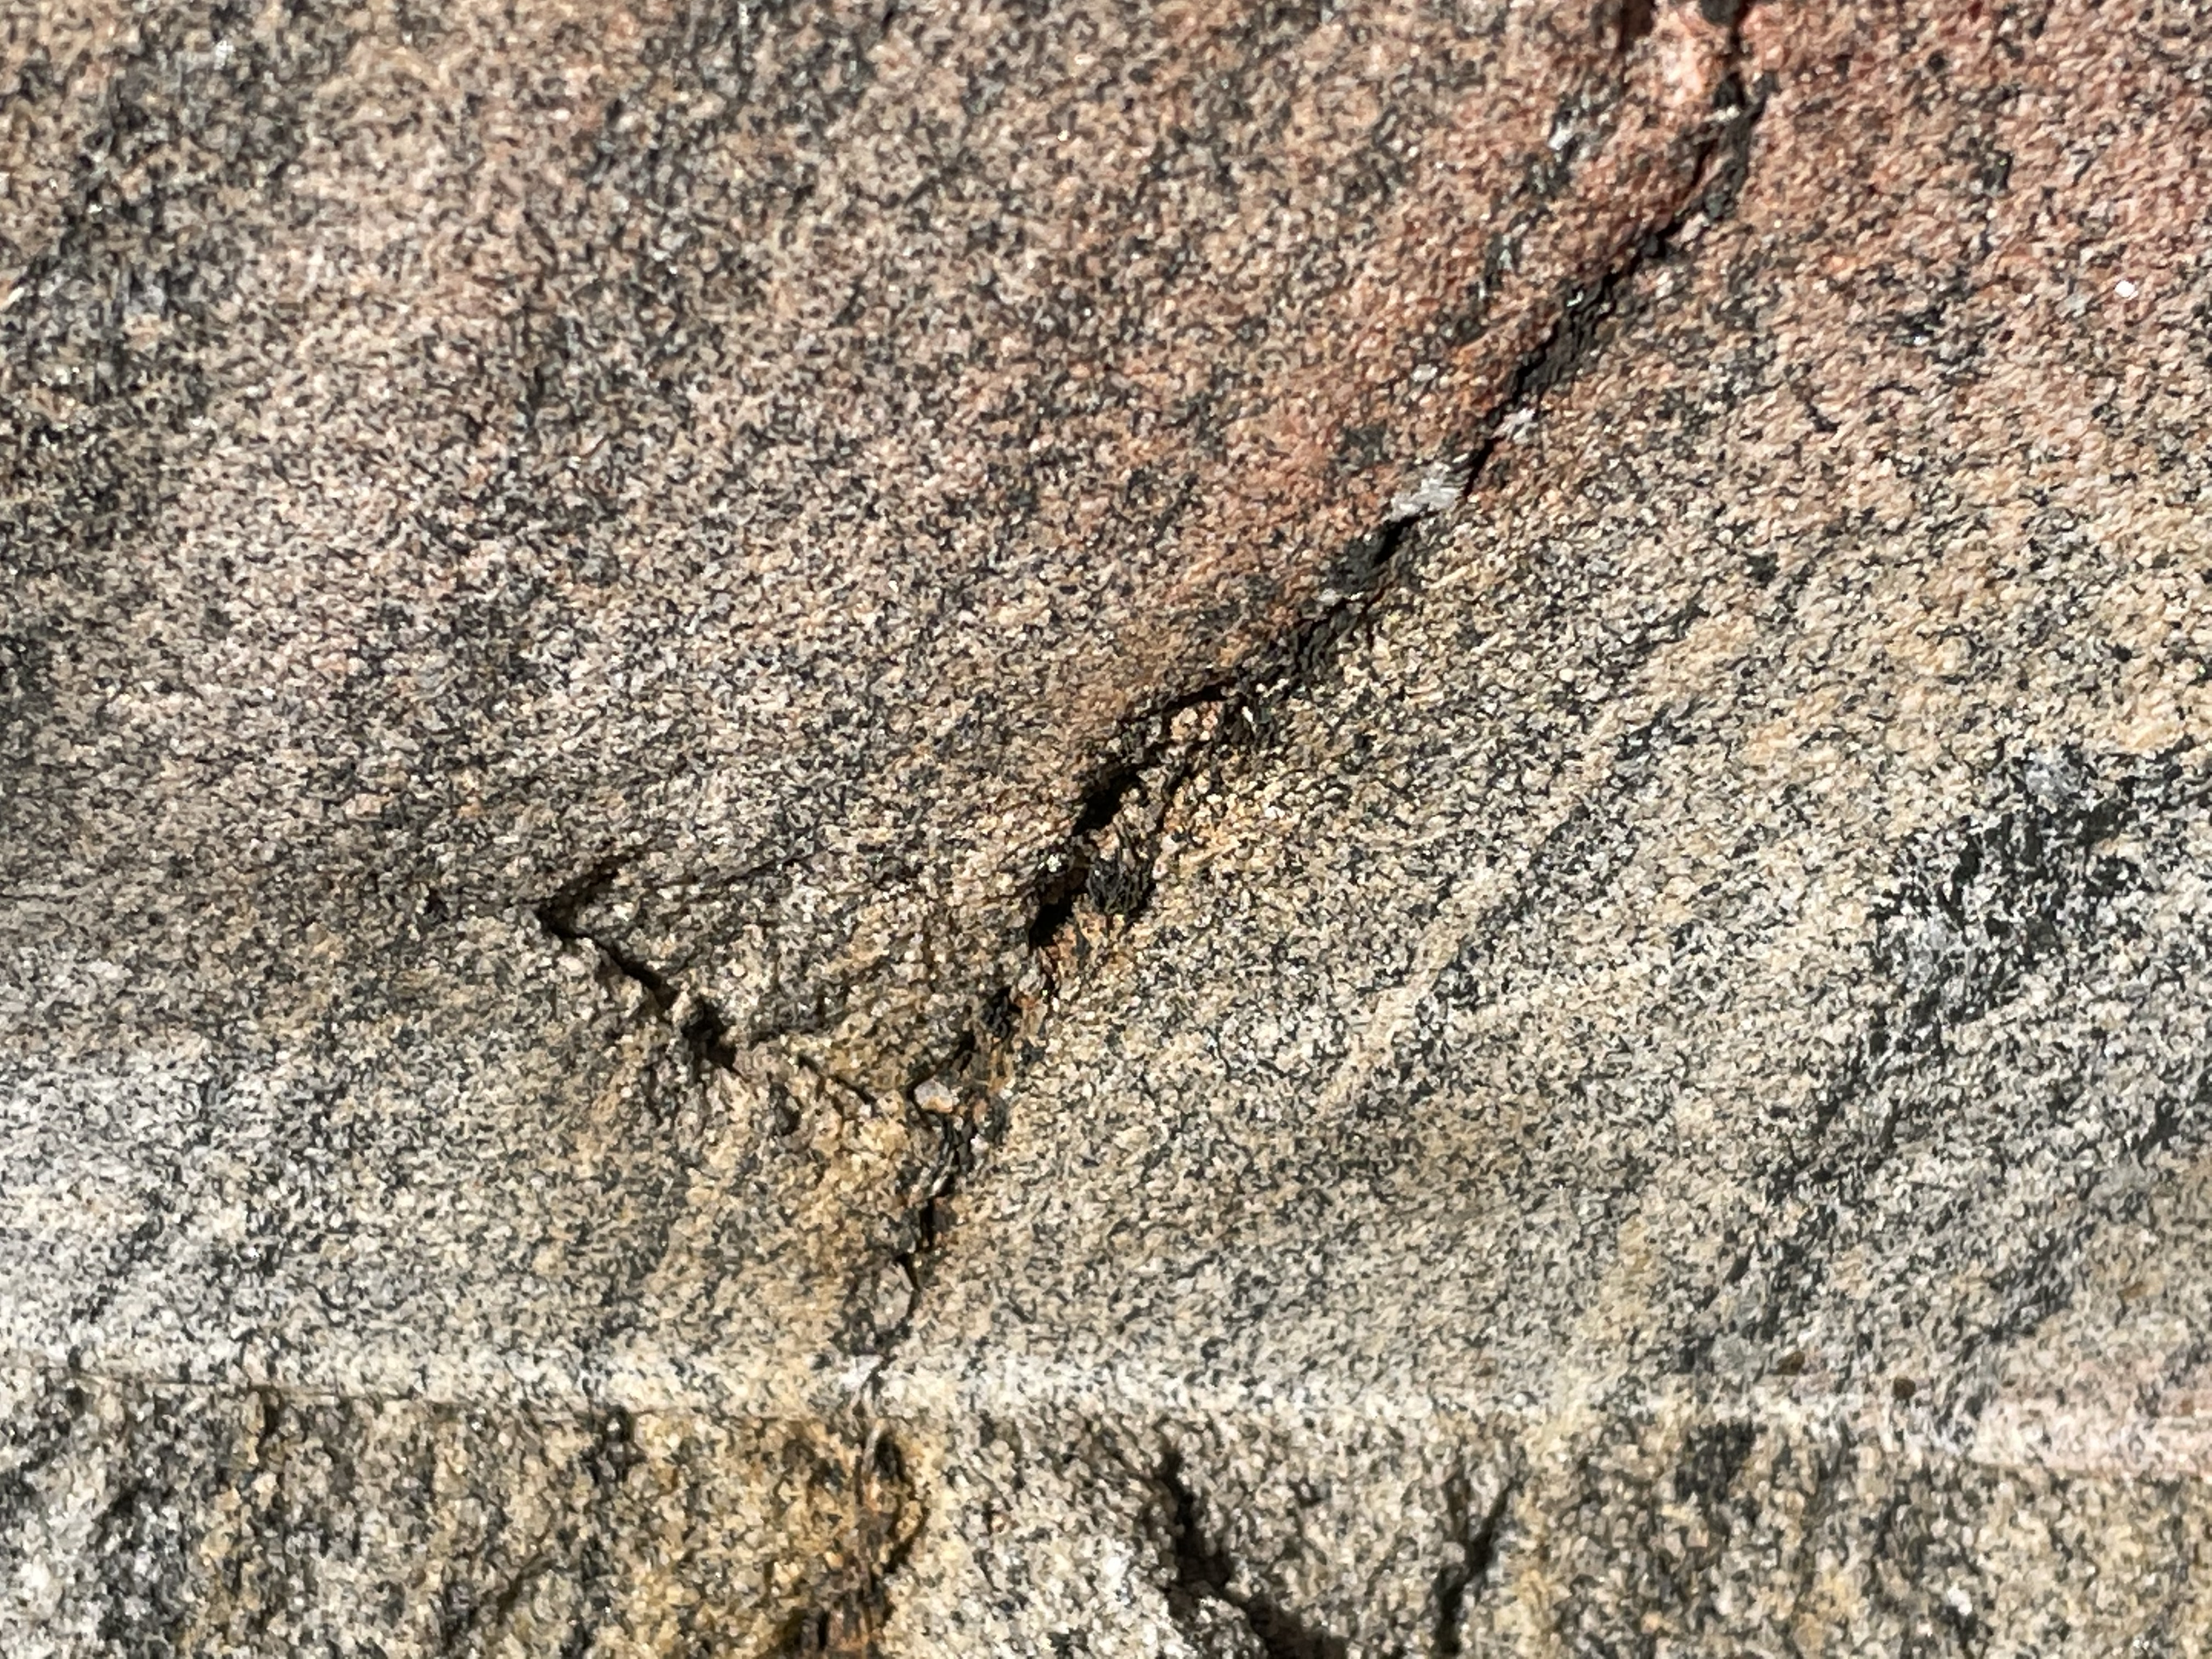

The foliation seen in Fig. 10 is bordering on gneiss, which isn’t formed until the minerals are near their melting point, which is consistent with the proximity of the Palmer Granite pluton (Figs. 7 and 8). Taken together, these rocks indicate deposition in a nearshore marine environment between ~540 and 510 Ma, burial to great depths, and intrusion of a granite magma about 500 Ma. This was an orogeny.
Traveling west (see blue-outlined inset in Fig. 2), we entered a canyon with exposures of metamorphosed sedimentary rocks (Fig. 11).


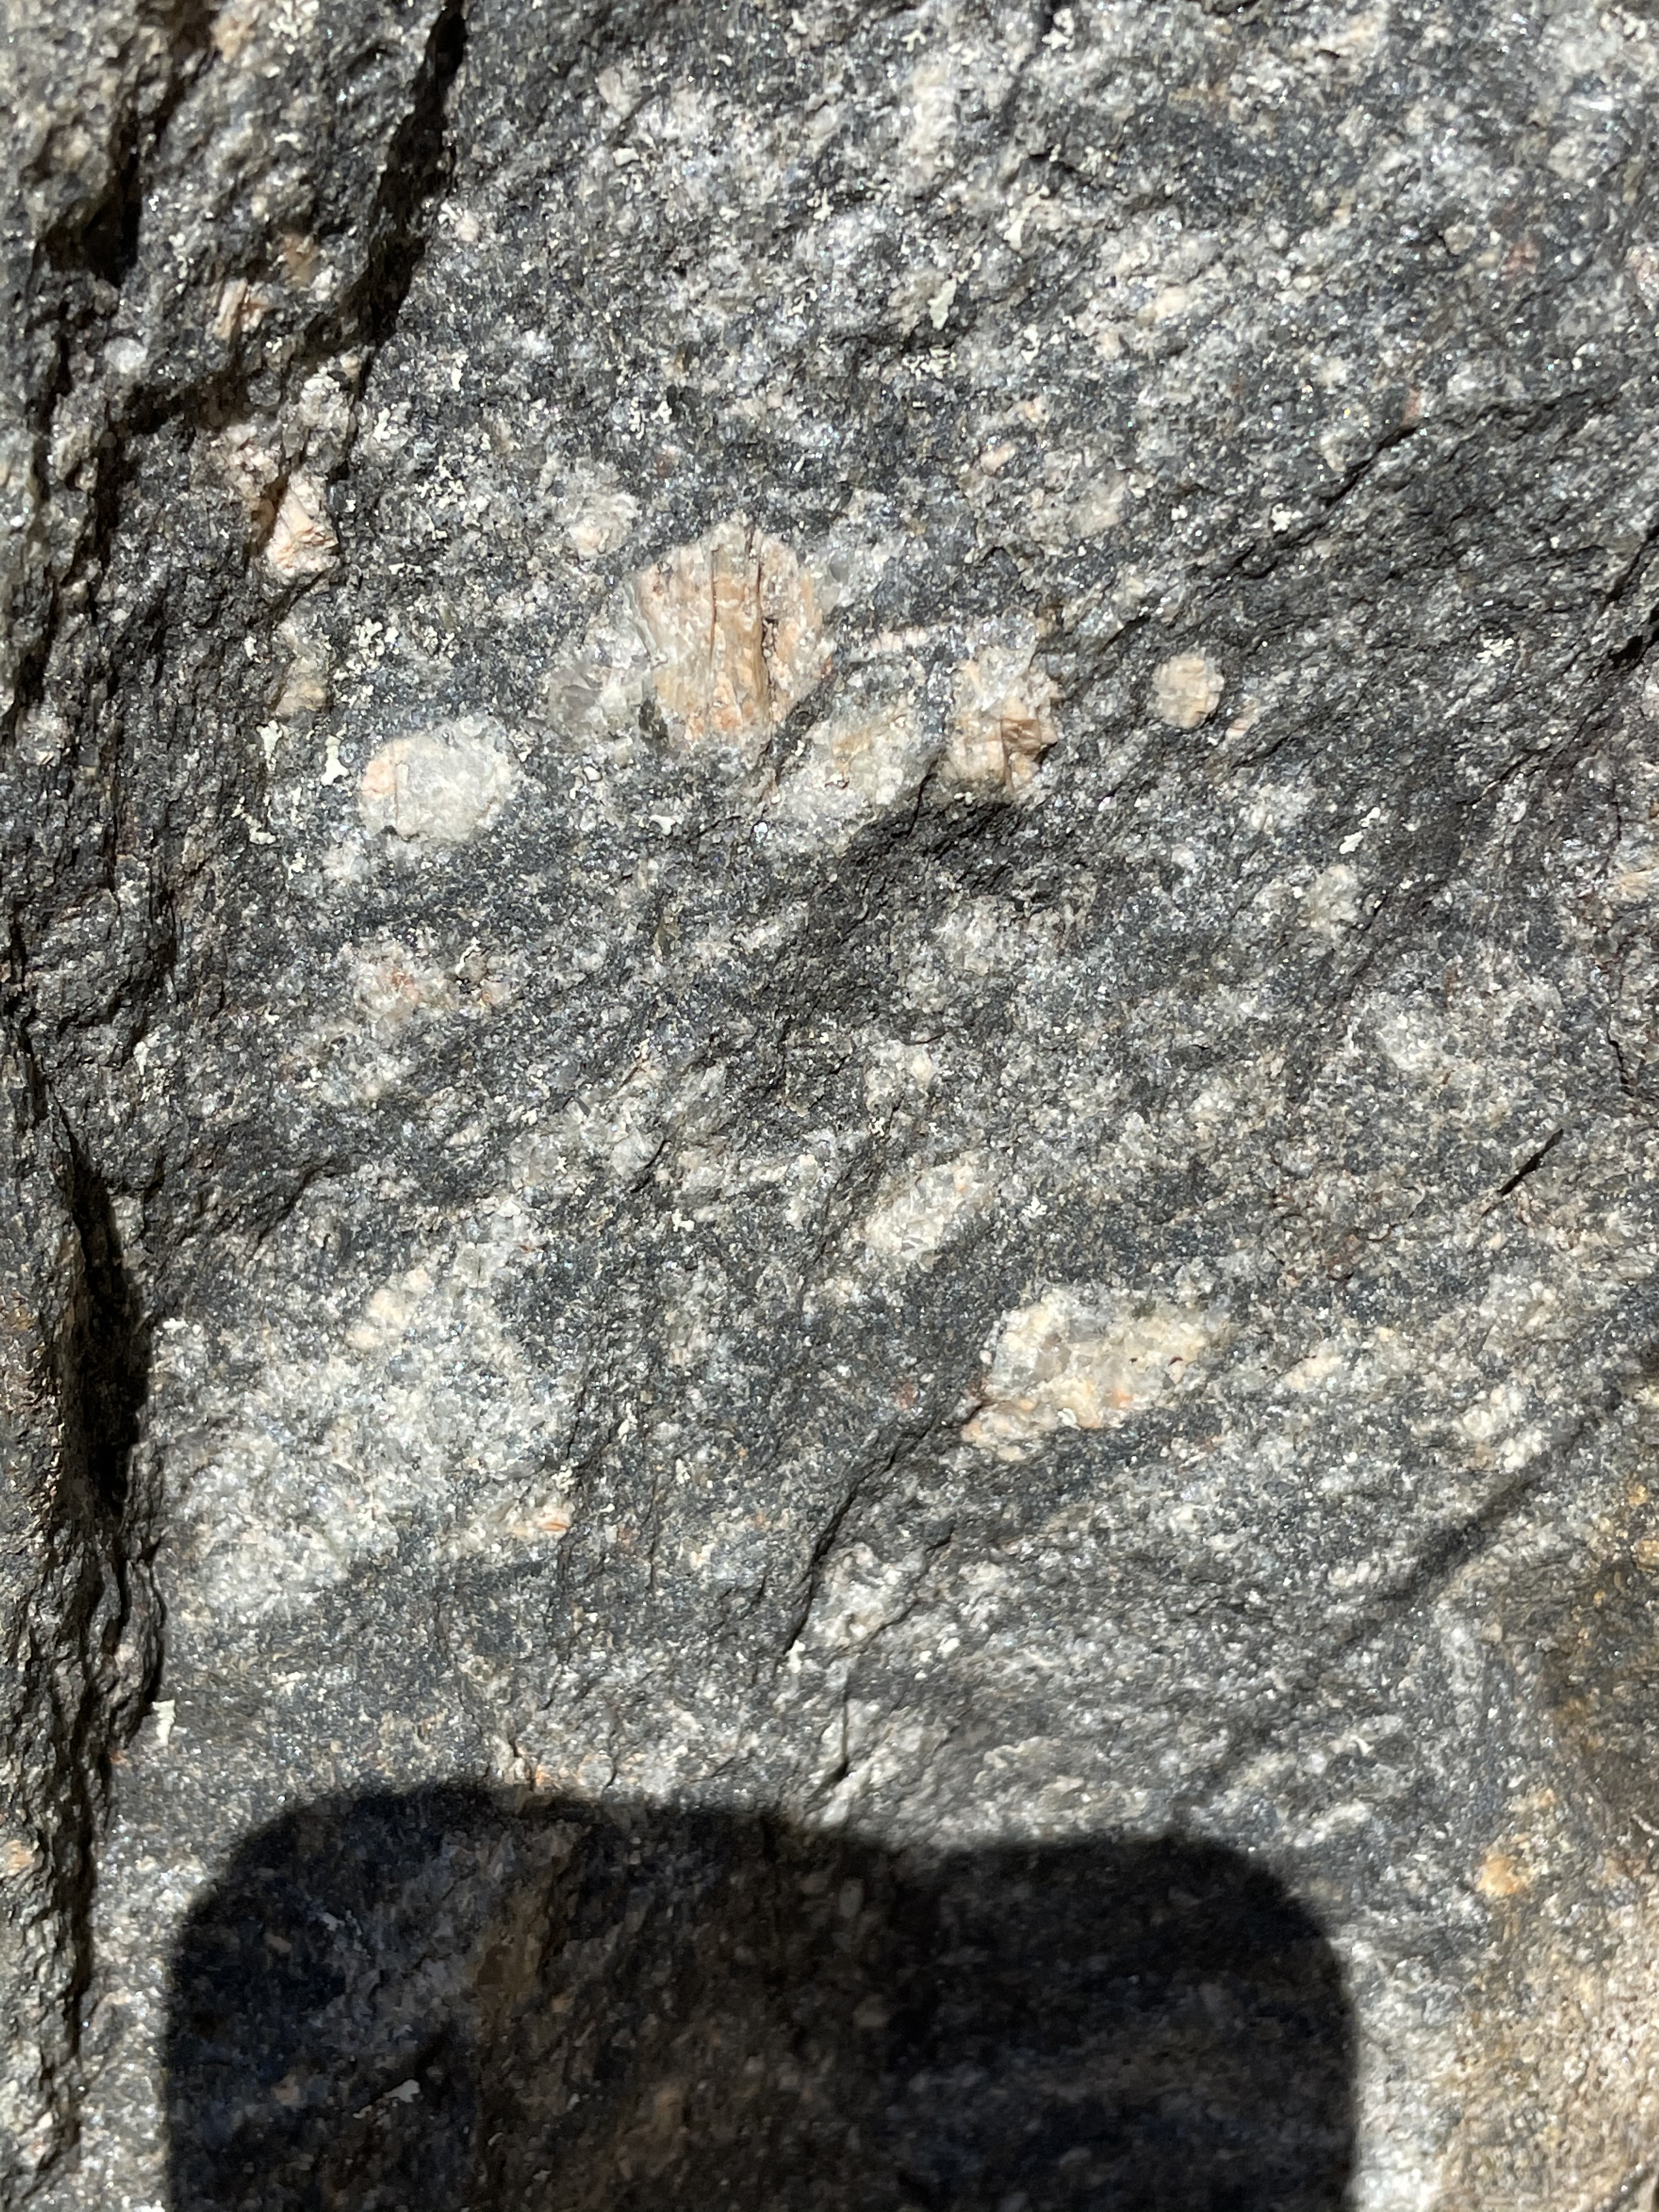

The range of sediments and their metamorphic grade seen in Fig. 11 span 1900 million years. They are exposed because of a major N-S fault running along the Flinders Range. The oldest (Figs. 11C, D, and E) are metasediments with foliation that were deposited between 2500 and 1000 MA.
The exposures in Fig. 11 A and B are from the Burra Group of Cryogenian age (720-635 Ma), long before the Keynes Subgroup sediments (Figs. 9 and 10) were deposited.
The Burra Group has a diverse lithology: laminated siltstone; sandstone with heavy-mineral lamination (e.g. from a beach), comprised of quartz and feldspar, with cross-bedding; dolomite (a carbonate); blue-grey to pale pink; containing lots of clay and lenticular (i.e., many lens-shaped bedding structures). Note that all of these sediments are indicative of a passive margin, not an orogenic belt experiencing rapid uplift and the deposition of immature sediments like graywacke and turbidites.
We followed Kangaroo Creek Reservoir (Fig. 12) to its outlet, where a large cut had been made, exposing two sides of a major fault.

The road along the west side of Kangaroo Creek (Fig. 12) had been following the fault, taking us into sediments of the Emeroo Subgroup (720-635 Ma), the same age as the Burra Group but containing only quartzite (metamorphosed sandstone), sandstone, dolomite, and conglomerate. Road cuts reveal the rock textures associated with a fracture zone (Fig. 13).


The major fault that runs the length of Kangaroo Creek Reservoir is exposed at the reservoir’s outlet (Fig. 14).
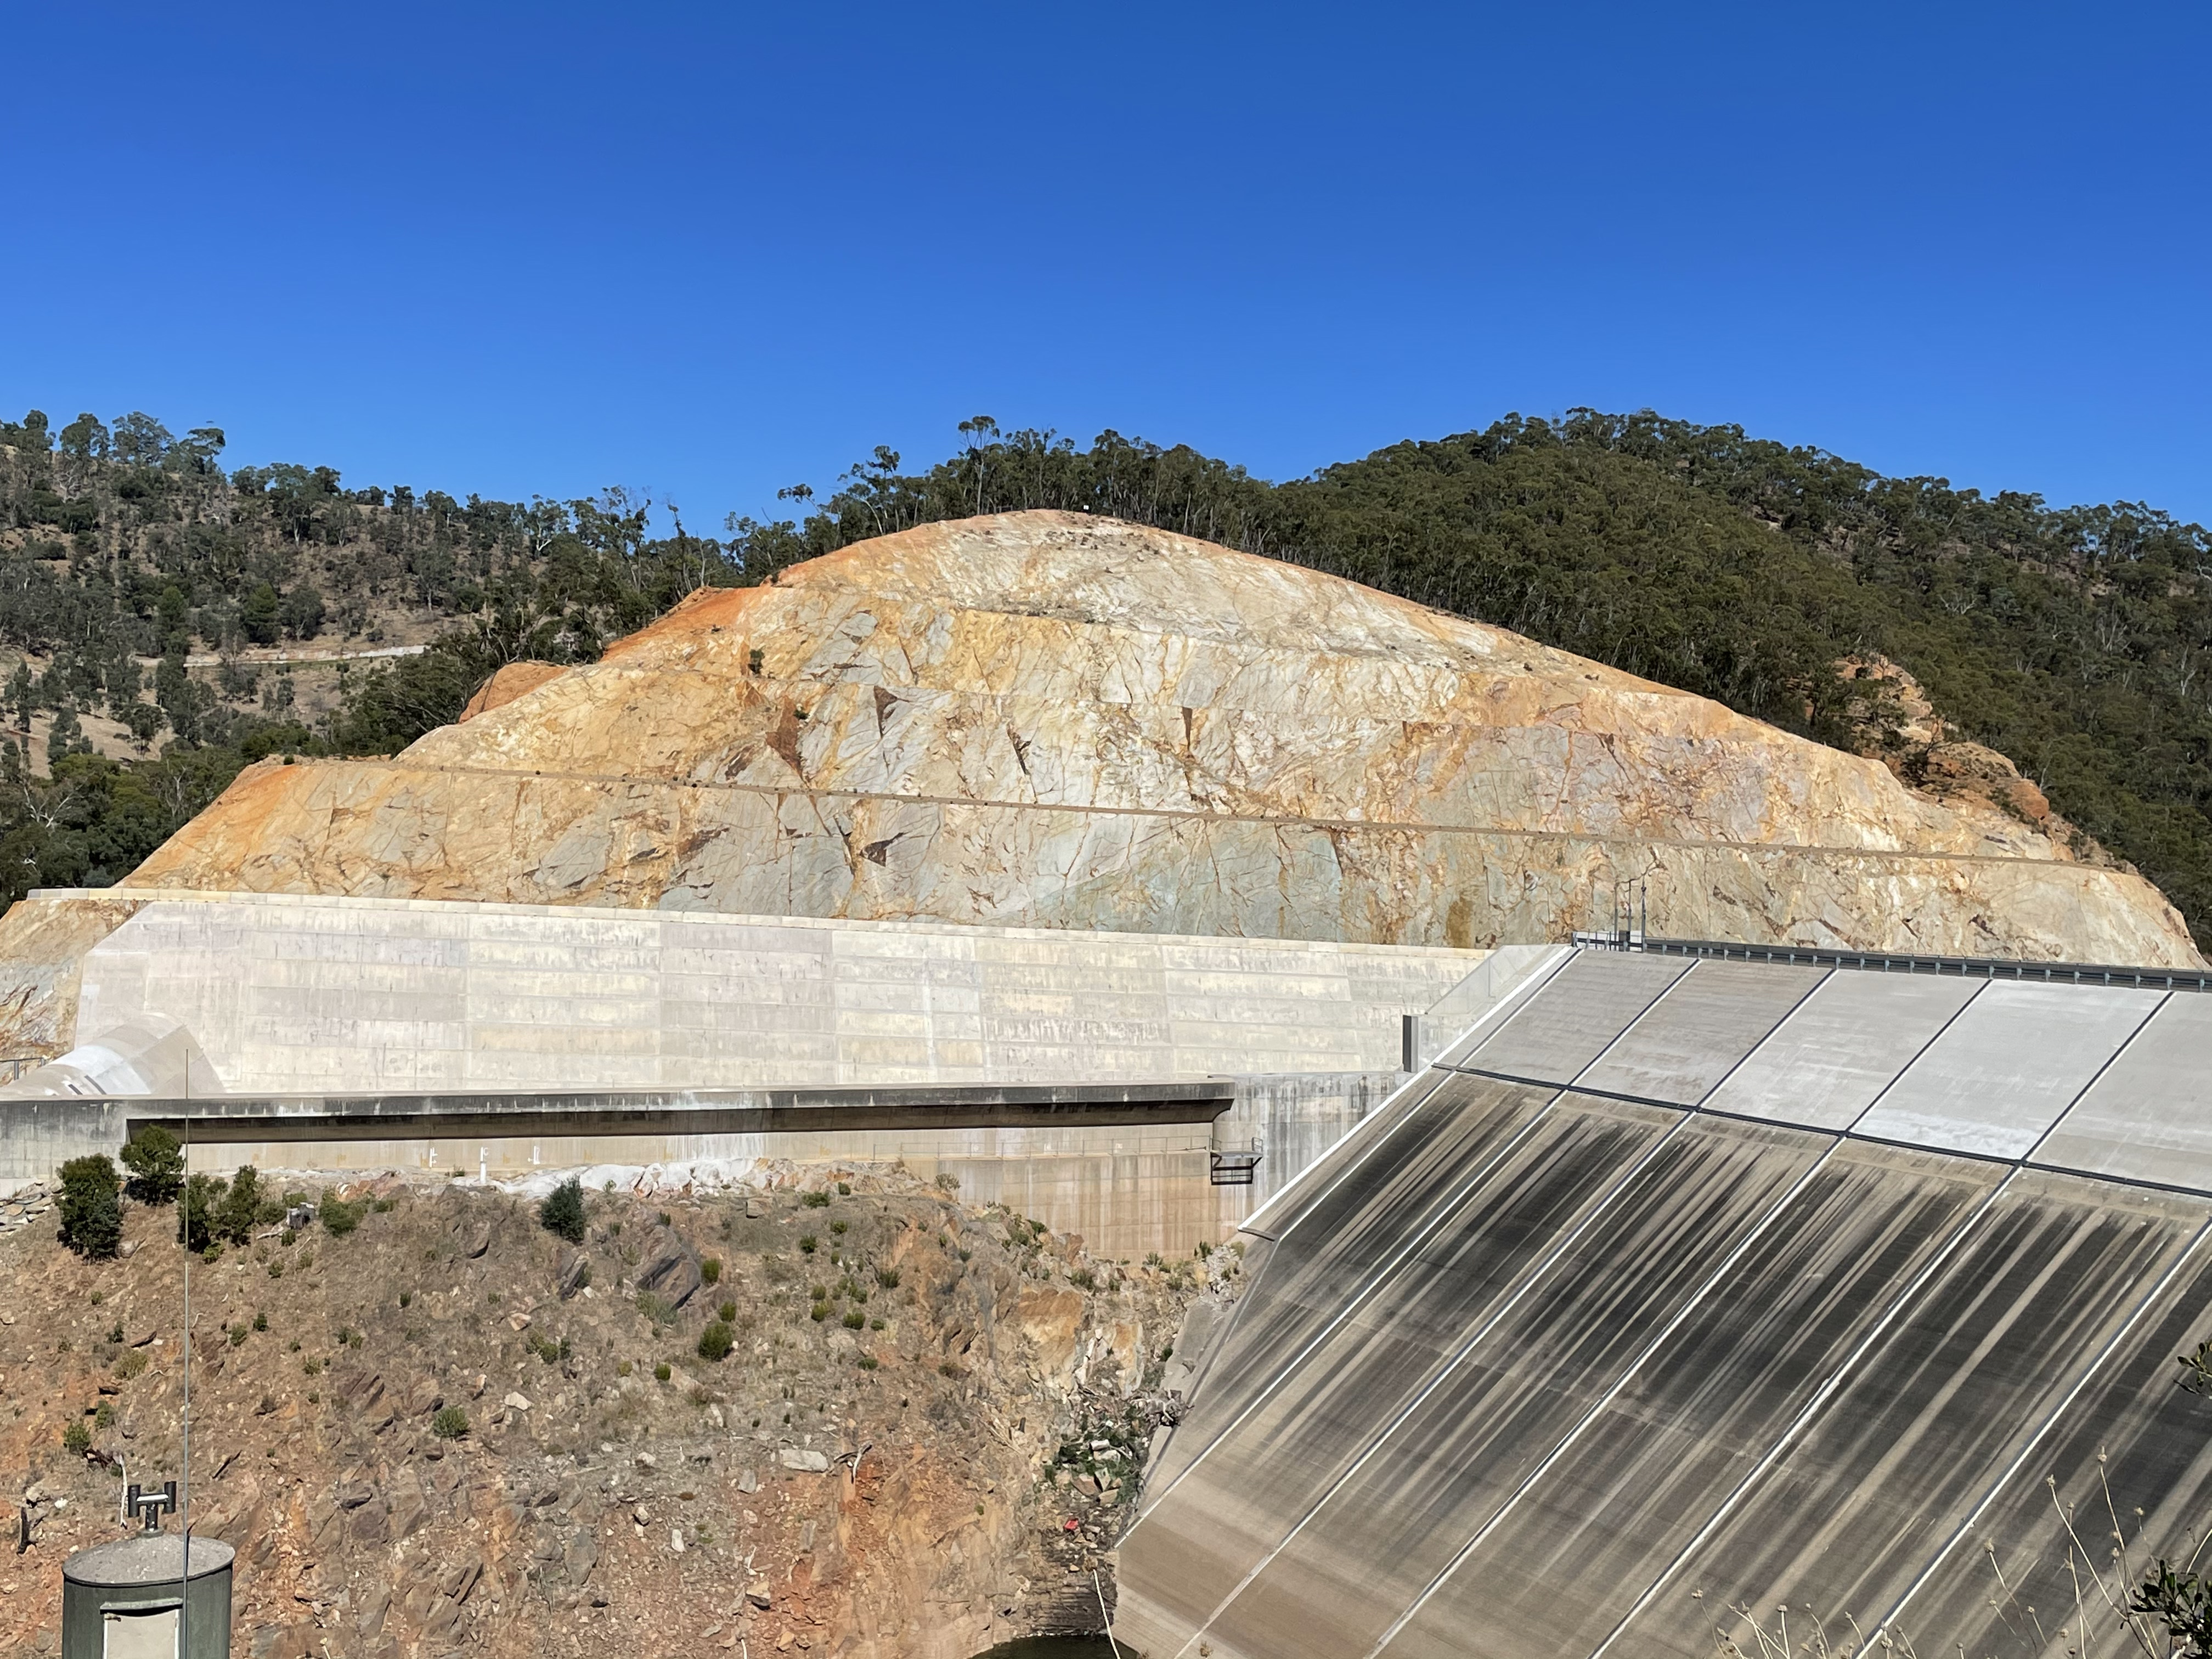

Note that the rocks in Fig. 14B are darker than those on the south side. Both sides of the fault expose rocks from the same stratigraphic formation but within different units. The south side (Fig. 14A) could be either quartzite or possibly dolomite because both can have a similar color. No exposures were available for close examination, however, so I’m going to put my money on dolomite. Such a large exposure of quartzite, from my experience, would either show bedding or be massive, whereas there are irregular lineations in this exposure. Dolomite is a carbonate mineral, formed by the recrystallization of the original calcite that would have formed marine animal shells in the ancient seas. The transformation from calcite to dolomite during diagenesis is not well understood. Thus, it can take many forms whereas sandstone is quite limited.
No report in Australia would be complete without the final photo from a beach. We ended up on the main public beach serving the Adelaide region (Fig. 15), to discover that it is a disaster compared to the “unimproved” beaches we’ve seen elsewhere in our travels.

The groin in the distance prevents sand being transported to this beach by waves and so it is starved of sediment. Thus, the nearshore bars and high berm to the left of the image. The beach face had a large component of fine-grained sediment as well. The beach was less than a mile long, terminating at the west end at an opening to a lagoon.
Summary
This is the last post from our trip to Adelaide, so I’ll summarize the geologic history briefly.
Between 2.5 and 1 billion years ago, South Australia was a passive margin (like the East Coast of the U.S.) and a variety of sediments accumulated in every imaginable coastal environment. Then there was a hiatus of about 300 million years, indicated by an unconformity between the Barossa Complex and Burra Group. A lot can happen in 300 million years, including an orogeny and subsequent uplift and erosion of the sedimentary record of such an event.
Between 720 and 635 million years ago, this region was a passive margin again, receiving similar sediments as a billion years earlier. These sediments were deposited on a surface that represented 300 million years of lost time. I didn’t find any dating of the orogenic event that produced the metamorphism seen in Figs. 11C, D, and E. Maybe it occurred during that missing interval or maybe…
The Delamerian Orogeny lasted from ~515 to 490 million years ago, long after the Burra group sediments had been buried and lithified.
The youngest Paleozoic sediments (the Keynes Subgroup, Figs. 9 and 10) were deposited between ~540 and 510 million years ago, overlapping slightly with the Delamerian Orogeny. However, the 105 million year hiatus between the Burra Group and the Keynes obscures a lot. For example, a little over 200 million years ago, North and South America were connected to Eurasia and Africa. Like I said, a lot can happen in a hundred million years.
At any rate, a series of granitic intrusions occurred, pushing their way into older sedimentary rocks, about 500 million years ago. This led to more metamorphism and deformation, probably associated with the Delamerian Orogeny.
Erosion followed until the Cenozoic (less than 68 million years ago), when terrigenous sediments accumulated everywhere, as revealed along the Murray River (Fig. 6).
Within the last couple of million years, Australia drifted over a mantle plume and volcanism began in Victoria, several hundred miles to the east near Melbourne, producing vast sheets of basalt.
This story is missing a lot, which we saw on previous trips. I’ll tie them together in a later post.
Drive to Adelaide, SA: Paleozoic Sedimentary Rocks
Today’s post covers the drive from Site 1 to Site 2 (Fig. 1), going from Quaternary volcanics to folded and faulted Paleozoic sedimentary rocks. The latter are presumably similar to the rocks that hosted the original magmatic gold that was eroded to form alluvial ore bodies like at Sovereign Hill.

Site 2 (from Fig. 1) can be expanded to show details of our movements within Grampians National Park (Fig. 2). Figure 2A shows the topography of the entire mountain range and the inset (Fig. 2B) is the first location we visited (Site 3).

The quaint tourist town of Halls Gap was entered through a narrow opening in the frontal ridge, seen to the extreme right side of Fig. 2B. Looking up from town, the ridges can be seen to form cliffs and dip generally westward (Fig. 3).

Figure 2 suggests steep cliffs on the east side of the ridges, as indicated by darker shading, and lower slopes on the west. The yellow-filled area in Fig. 2B is a uniform block that is tilted westward, which will be shown in detail below. Our path took us west of this fault block. The road is indicated by a white line pointed westward. A circuitous path took us eventually to Site 3 and afforded an opportunity to examine the rock up close (Fig. 4).
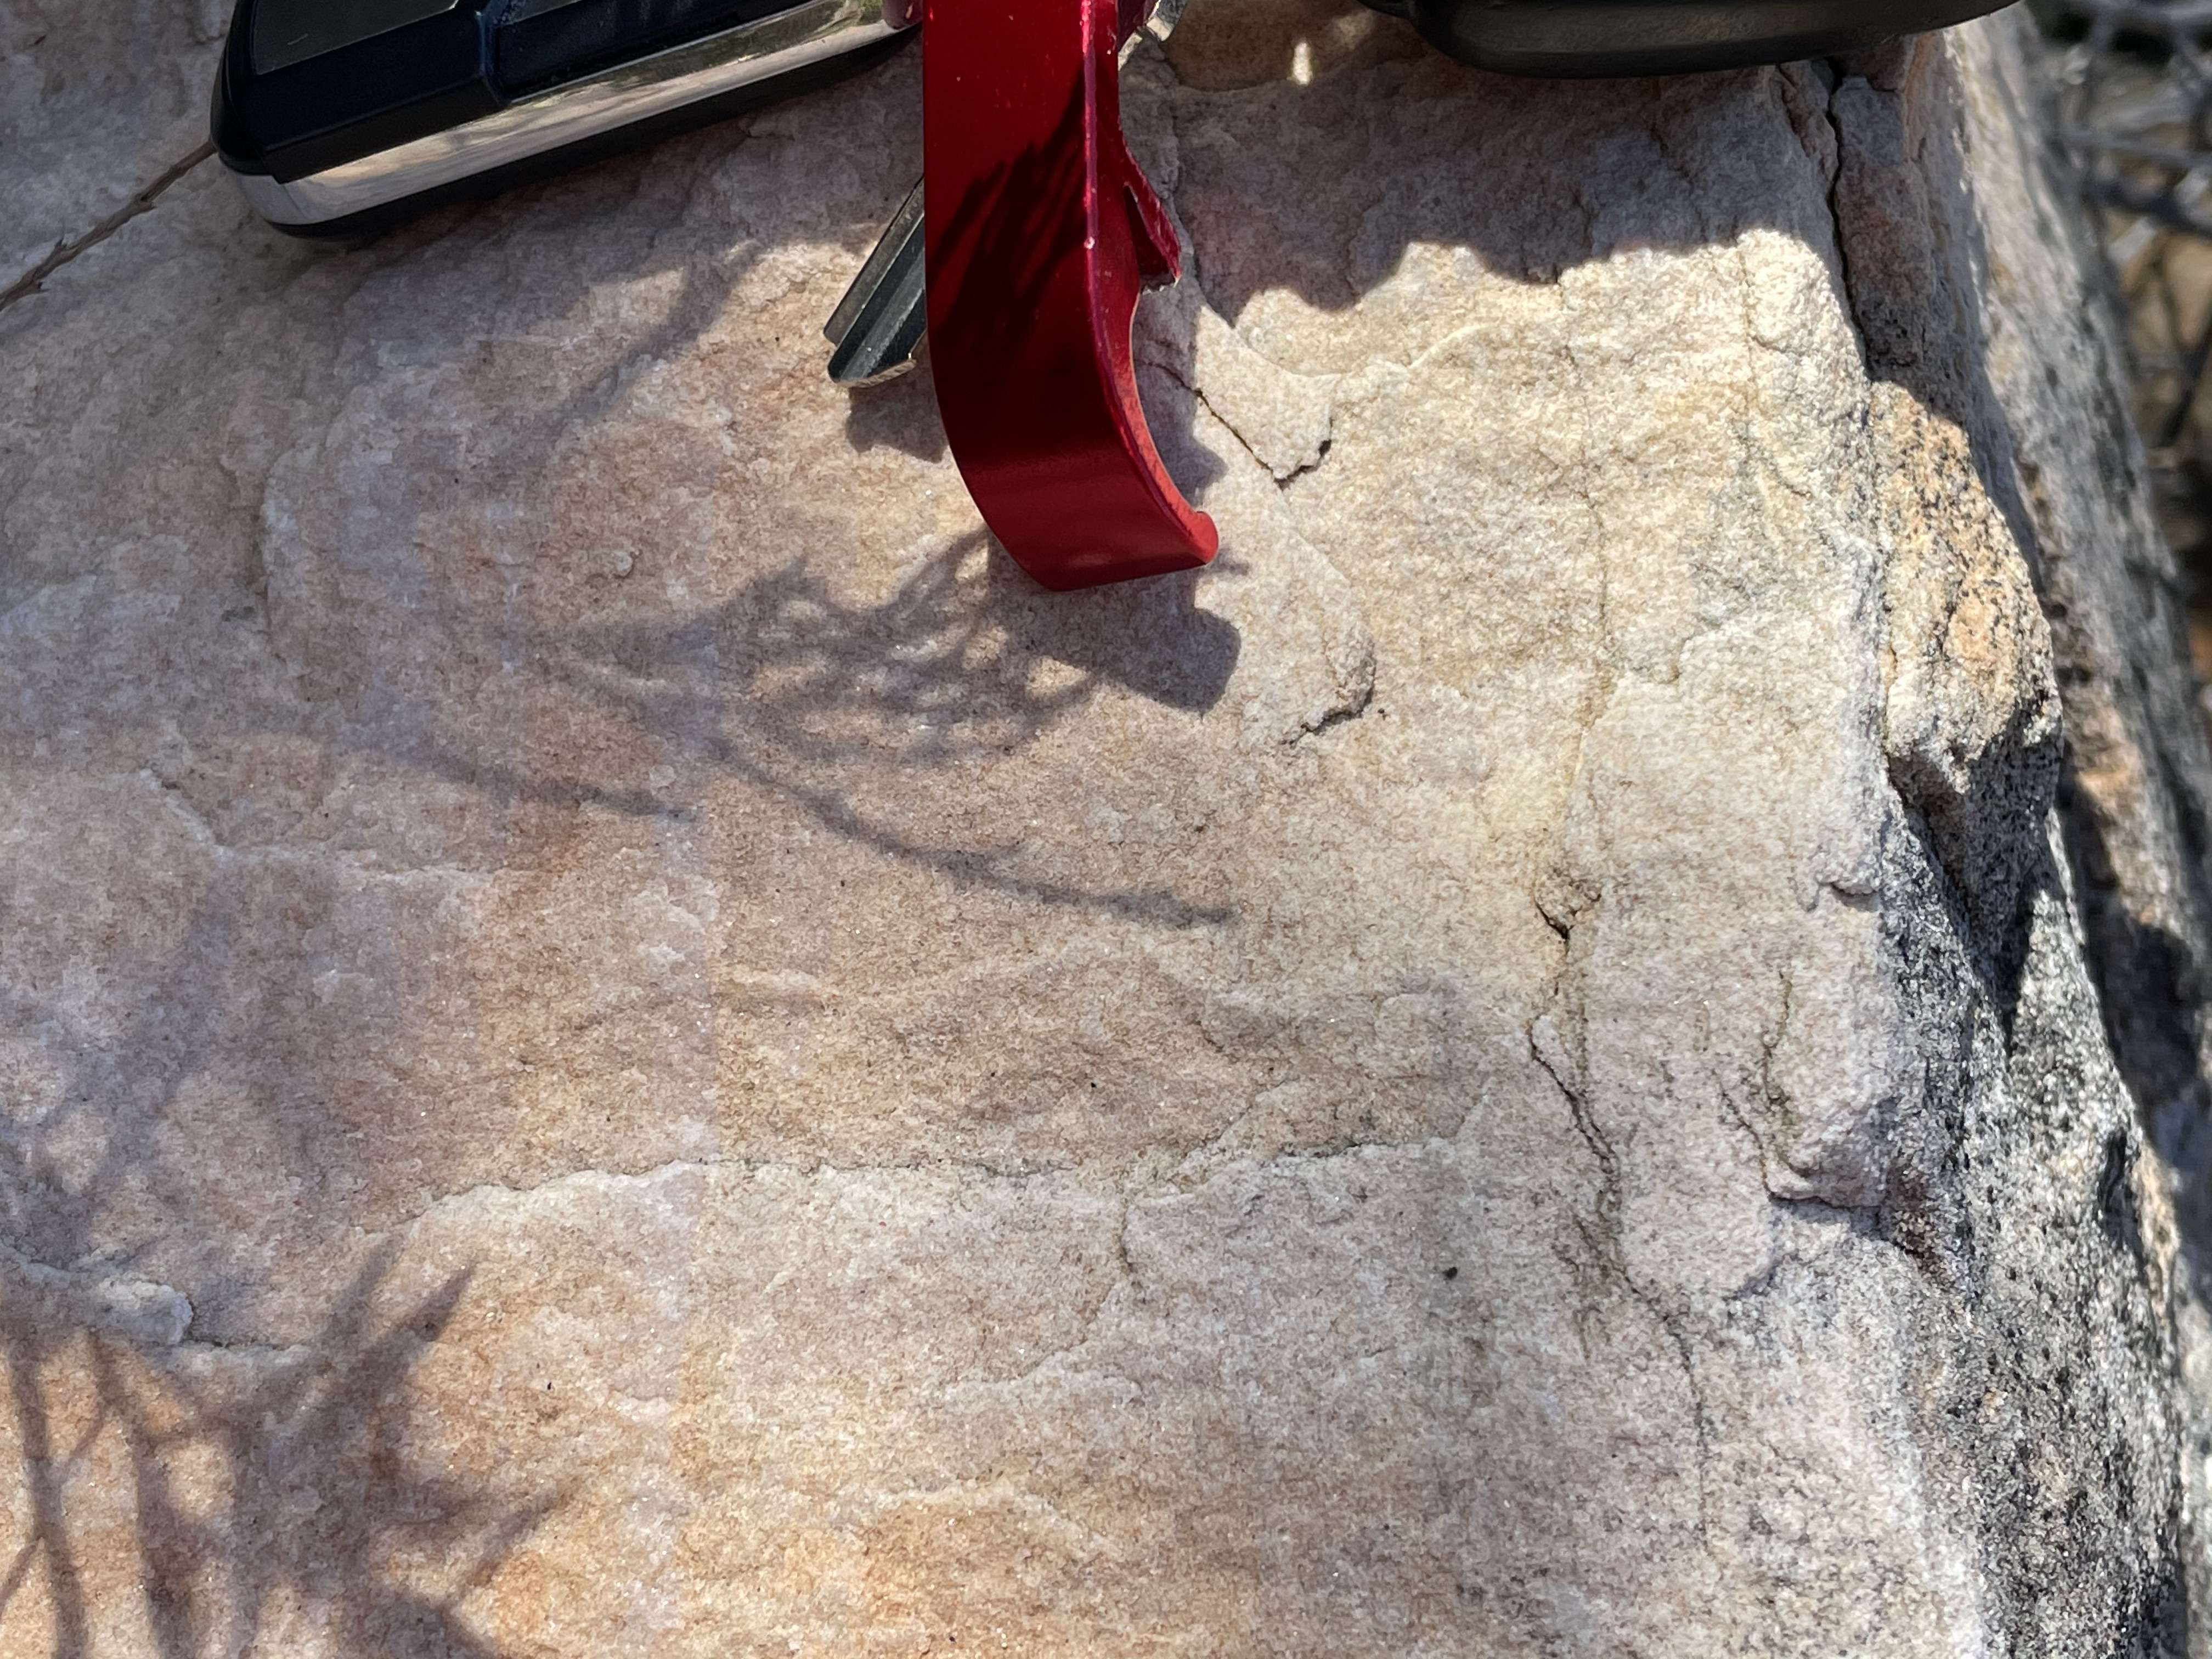
This is a well-sorted sandstone. According to RockD, it is the Grampians Group, marginal marine and fluvial sandstone with some red mud and conglomerate (444-427 Ma). This sample doesn’t show any crossbedding or other fluvial structures but it is fairly uniform in texture. Furthermore, zooming in on Fig. 4 reveals that the grains aren’t as rounded as we would expect from a beach or marine sand, which has been worked by wave action. The reddish hue is another indicator of a fluvial origin because marine waters have less oxygen and don’t oxidize iron within the cement. Oxidized iron (rust) comes in many hues of red.
The view from Site 3 (Fig. 5) reveals Lake Bellfield in background and the fault block shaded in yellow in Fig. 2B in the foreground. Note the uniform surface dipping to the west. This is a bedding plane and it was originally horizontal. Note also how the cliffs in the center-right of the photo are nearly horizontal. This suggests folding, which is associated with compressional tectonics. Keep in mind that these rocks were buried several miles beneath the surface when deformation occurred ~400 million years ago.

As it turns out, the rock layers are not uniformly dipping to the west as suggested by the topographic map (Fig. 2). For example, at Site 4 (see Fig 2B for location), the following view (Fig. 6) shows the variability of the mountains as seen from the ground.

Looking first to the southern end of the range (e.g. Zumsteins in Fig. 2A) shows the kind of appearance that the westward dipping fault block in Fig. 5 would imply (Fig. 7A).
Figure 7. Close-up shots from Fig. 6.

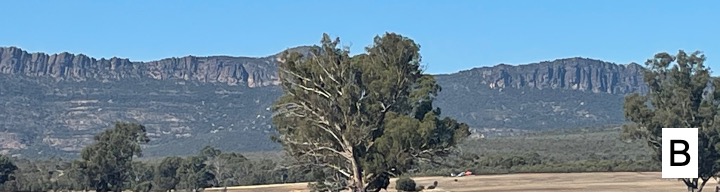

Figure 7B, slightly to the north, reveals high cliffs somewhat further away, possibly east of Wartook (see Fig. 2A). The cliff is unbroken except for a saddle just to the right of the central tree. Further north (Fig. 7C), the ridge is in the foreground and a higher ridge, facing east, forms the skyline. This location is about where Laharum is located in Fig. 2A. Thus it would seem that faulting was not uniform. No where is this more evident than just north (to the left) of Fig. 6.

The southern (right side) rocks tilt to the north whereas the northern (left side) tilt to the south. Glancing at Fig. 2A, we see that the V formed by these fault blocks is at the narrowest (and lowest) part of the ridge they form.
Taken together, these observations suggest that deformation was not a simple process here, just as observed in previous posts. The geologic map (Fig. 9) reveals several faults in Grampians National Park.
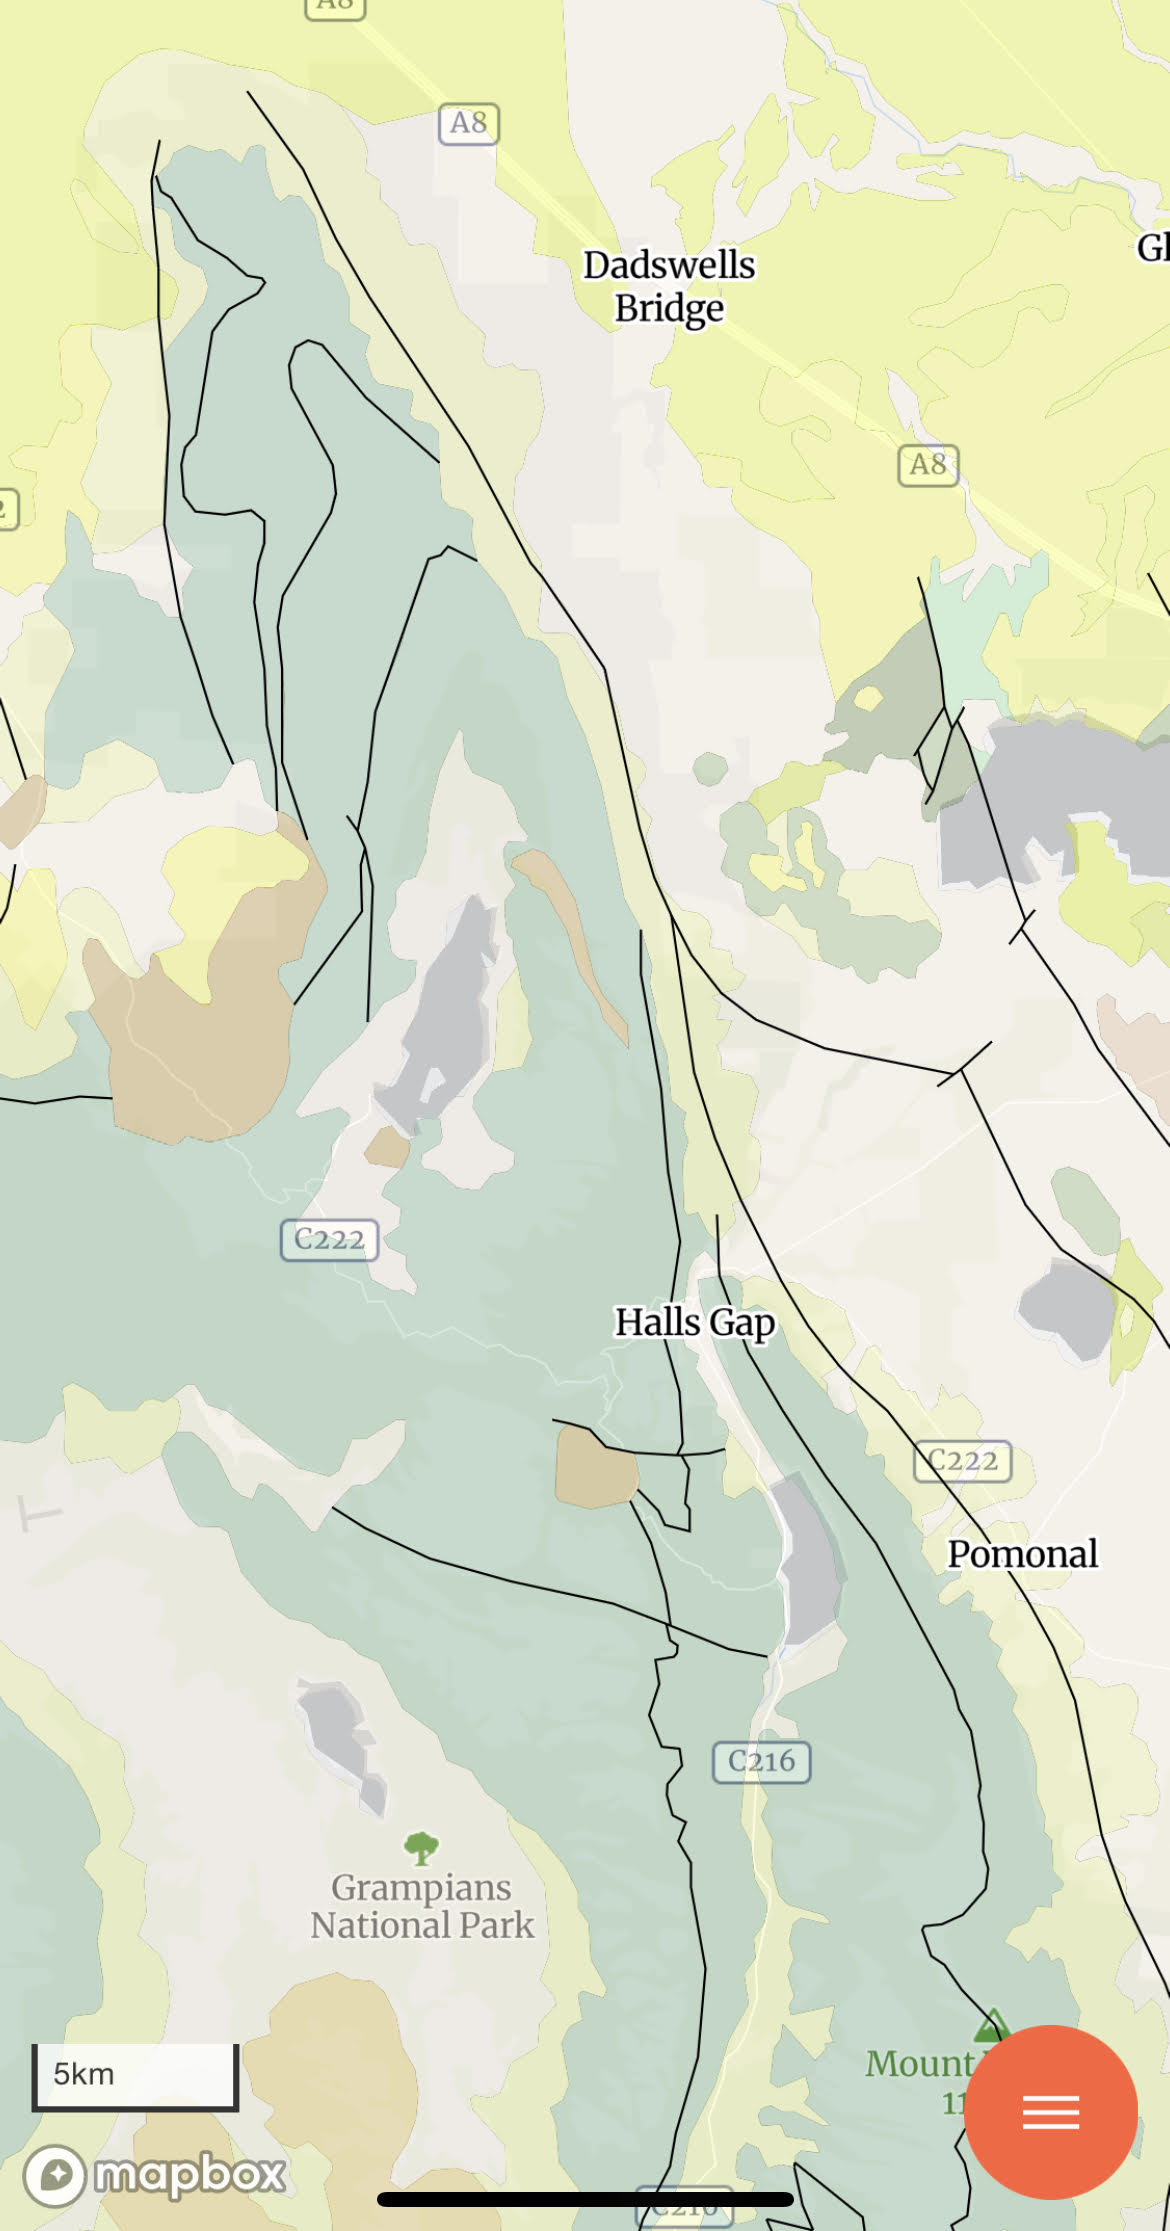
The map reveals several N-S trending faults along which the huge blocks seen in Fig. 2B and Fig. 5 tilted to the west. It also shows nearly orthogonal faults (e.g., south of Halls Gap), and curved ones near Dadswells Bridge. This suggests that folding may have occurred after faulting. One possibility is tectonic inversion, in which (for example) a stress field changes from extensional (e.g., before 450 Ma) to compressional (e.g., after 400 Ma). Such an inversion of tectonic stress would reactivate old faults and deform them, as well as allowing thrust faults (compression) to occur on previous normal faults (extension).
Just an idea…
Drive to Adelaide, SA: Quaternary Volcanics
The next few posts are going to document and discuss some of the geology we encountered on a drive from Melbourne to Adelaide, South Australia. The border between states is open now so it was no problem. The total trip is about 450 miles in length. We took three days to make it all the way. This post is going to present our observations from the morning of the first day, to keep the post shorter. I know I get carried away sometimes.
Figure 1 shows the geologic map of the part of Victoria covered on the first day. This post wlll discuss Location 1 only.
The volcanics were erupted over older rocks, in this case Paleozoic sedimentary rocks that had been intruded by granitic magma during the period of mountain building discussed in previous posts. Gold was deposited in fractures and faults at that time. Later, as the mountains eroded, the gold was deposited in rivers and because of its resistance to weathering, and collected in significant deposits. This kind of gold deposit is called alluvial. The Sovereign Hill mine was the site of the richest alluvial gold rush in the world, with one nugget weighing more than 150 lbs.
The location of the original shaft (Fig. 2) is now a tourist site. The underground mine play ran out and less expensive methods became employed to recover the ore.

Underground mining produces large piles of ore (Fig. 3), which mark the location of mine entrances throughout the world.
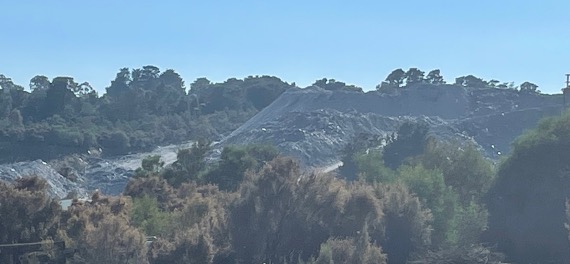
There was a mining project still going on, however, out of sight of the tourists, on the other side of the hill (Fig. 4).

I’m not sure if the operation is working directly on low-concentration sediments or simply created a large basin for the highly toxic waste products produced by acid-leaching methods. We didn’t see any evidence of large earth movers or dump trucks, however. This involves a lot of on-site chemical processing (Fig. 5).
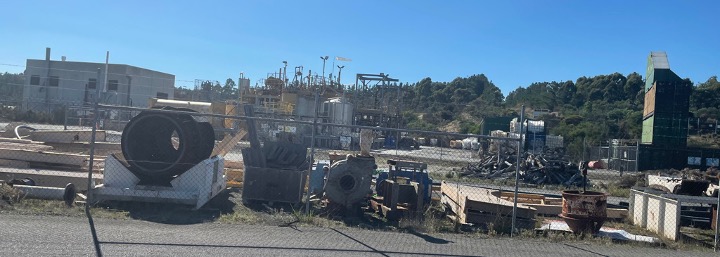
As already mentioned, the gold was located in Paleozoic sedimentary rocks beneath the Quaternary volcanic rocks. As seen in Fig. 1, this was an extensive volcanic field, which implies that there should be volcanoes still to be found because of the young age (< 2 Ma). A topographic map of the area in fact reveals the presence of many volcanoes (Fig. 6).

Here’s what those volcanoes look like from a distance.
Figure 7 shows a large number of volcanoes, like where the most eastward arrow in Fig. 6 is pointing. They were covered in grass and were used for grazing sheep mostly. We couldn’t get access because they were all on private land and, surprisingly for Australia, there was no volcano park or anything…

As seen in Fig. 1, in some locations the older Paleozoic rocks were present at the surface (Dark blue in Fig. 1). The terrain here consisted of rolling hills, occasional ridges, and volcanoes. The ridges may be the surface expression of folds in the older rocks, created when the intrusion responsible for the gold mineralization occurred. That was back about 400 Ma in the past, however. At any rate, Fig. 8 was taken on a downhill slope from one of these ridges, showing an unusually large volcano in the distance, possible the complex near the town of Ercildoune in Fig. 6.

That’s it for this post. We finally drove through the volcanic complex we’d heard about and, although we couldn’t visit any volcanoes ourselves, it was inspiring to drive through so many volcanoes, to imagine what it was like when they were erupting the massive volumes of lava seen in Fig. 1.
Next time, we’ll continue to the west to examine some Paleozoic sedimentary rocks that have been folded and faulted.
Geology of Australia: a Summary
This post is going to summarize everything I’ve learned about Australia from all my field trips so far. The first section, presents our last field site in the Australian Capital Territory, however, before summarizing the geology of the ACT, Queensland, Victoria, and Tasmania.
Tertiary Sediments
This is the last post from the ACT. Site 31 (see Fig. 1 for location) is located in the Botanical Garden, where a gully was excavated to create a rainforest. Despite the low rainfall in the area, it worked and a path leads through what appears to be an erosional gully from Queensland.
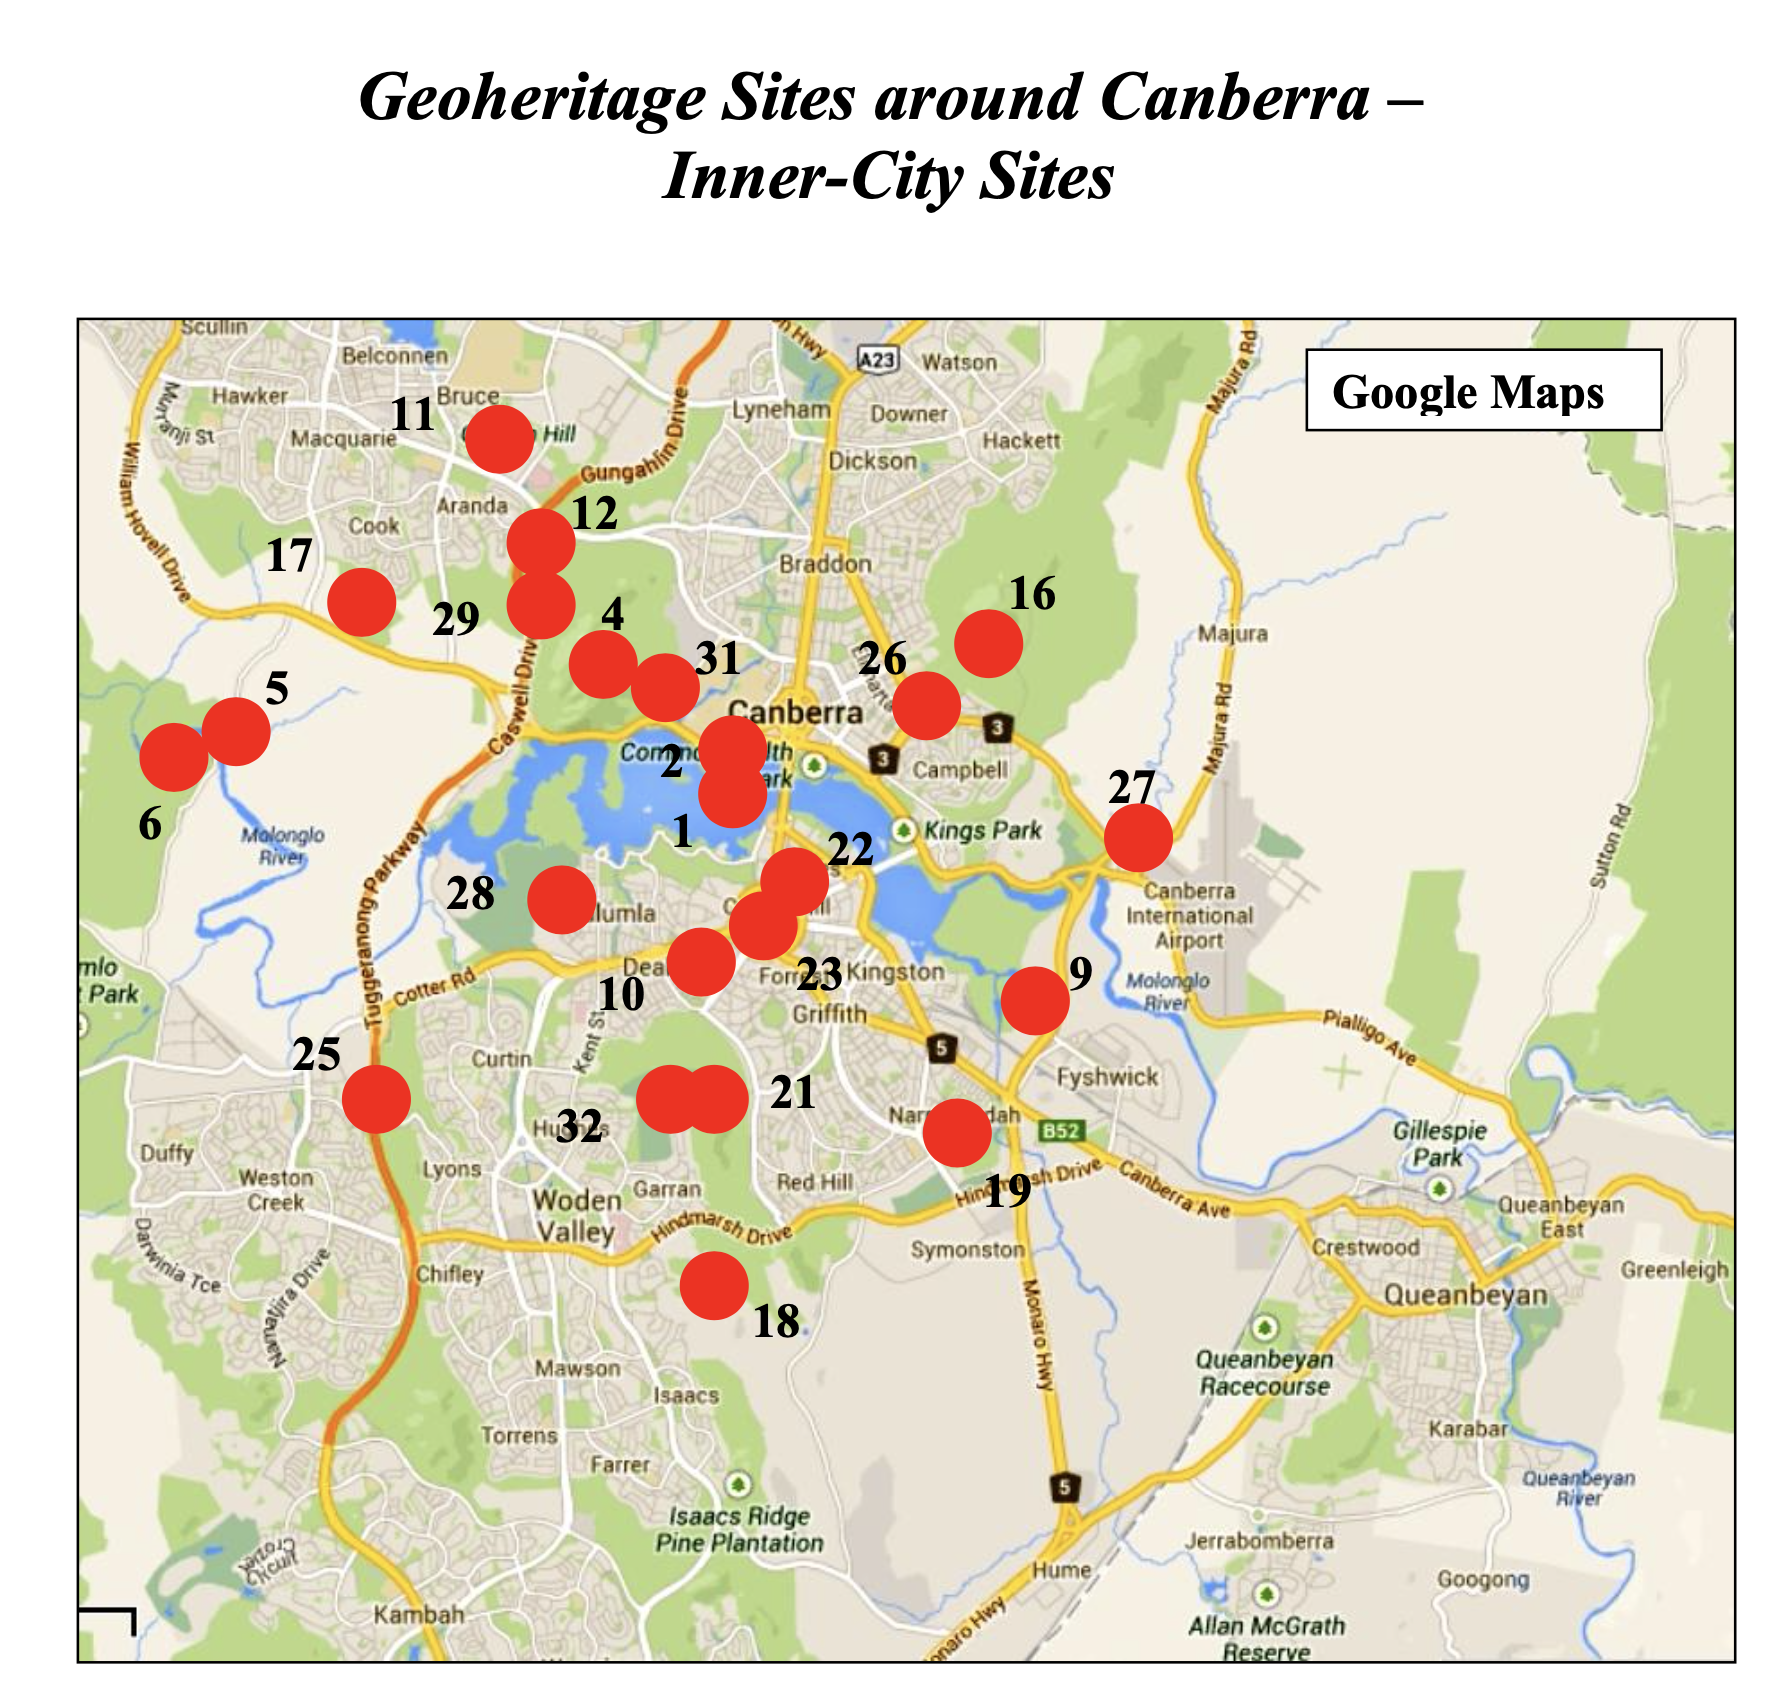 Fig. 1
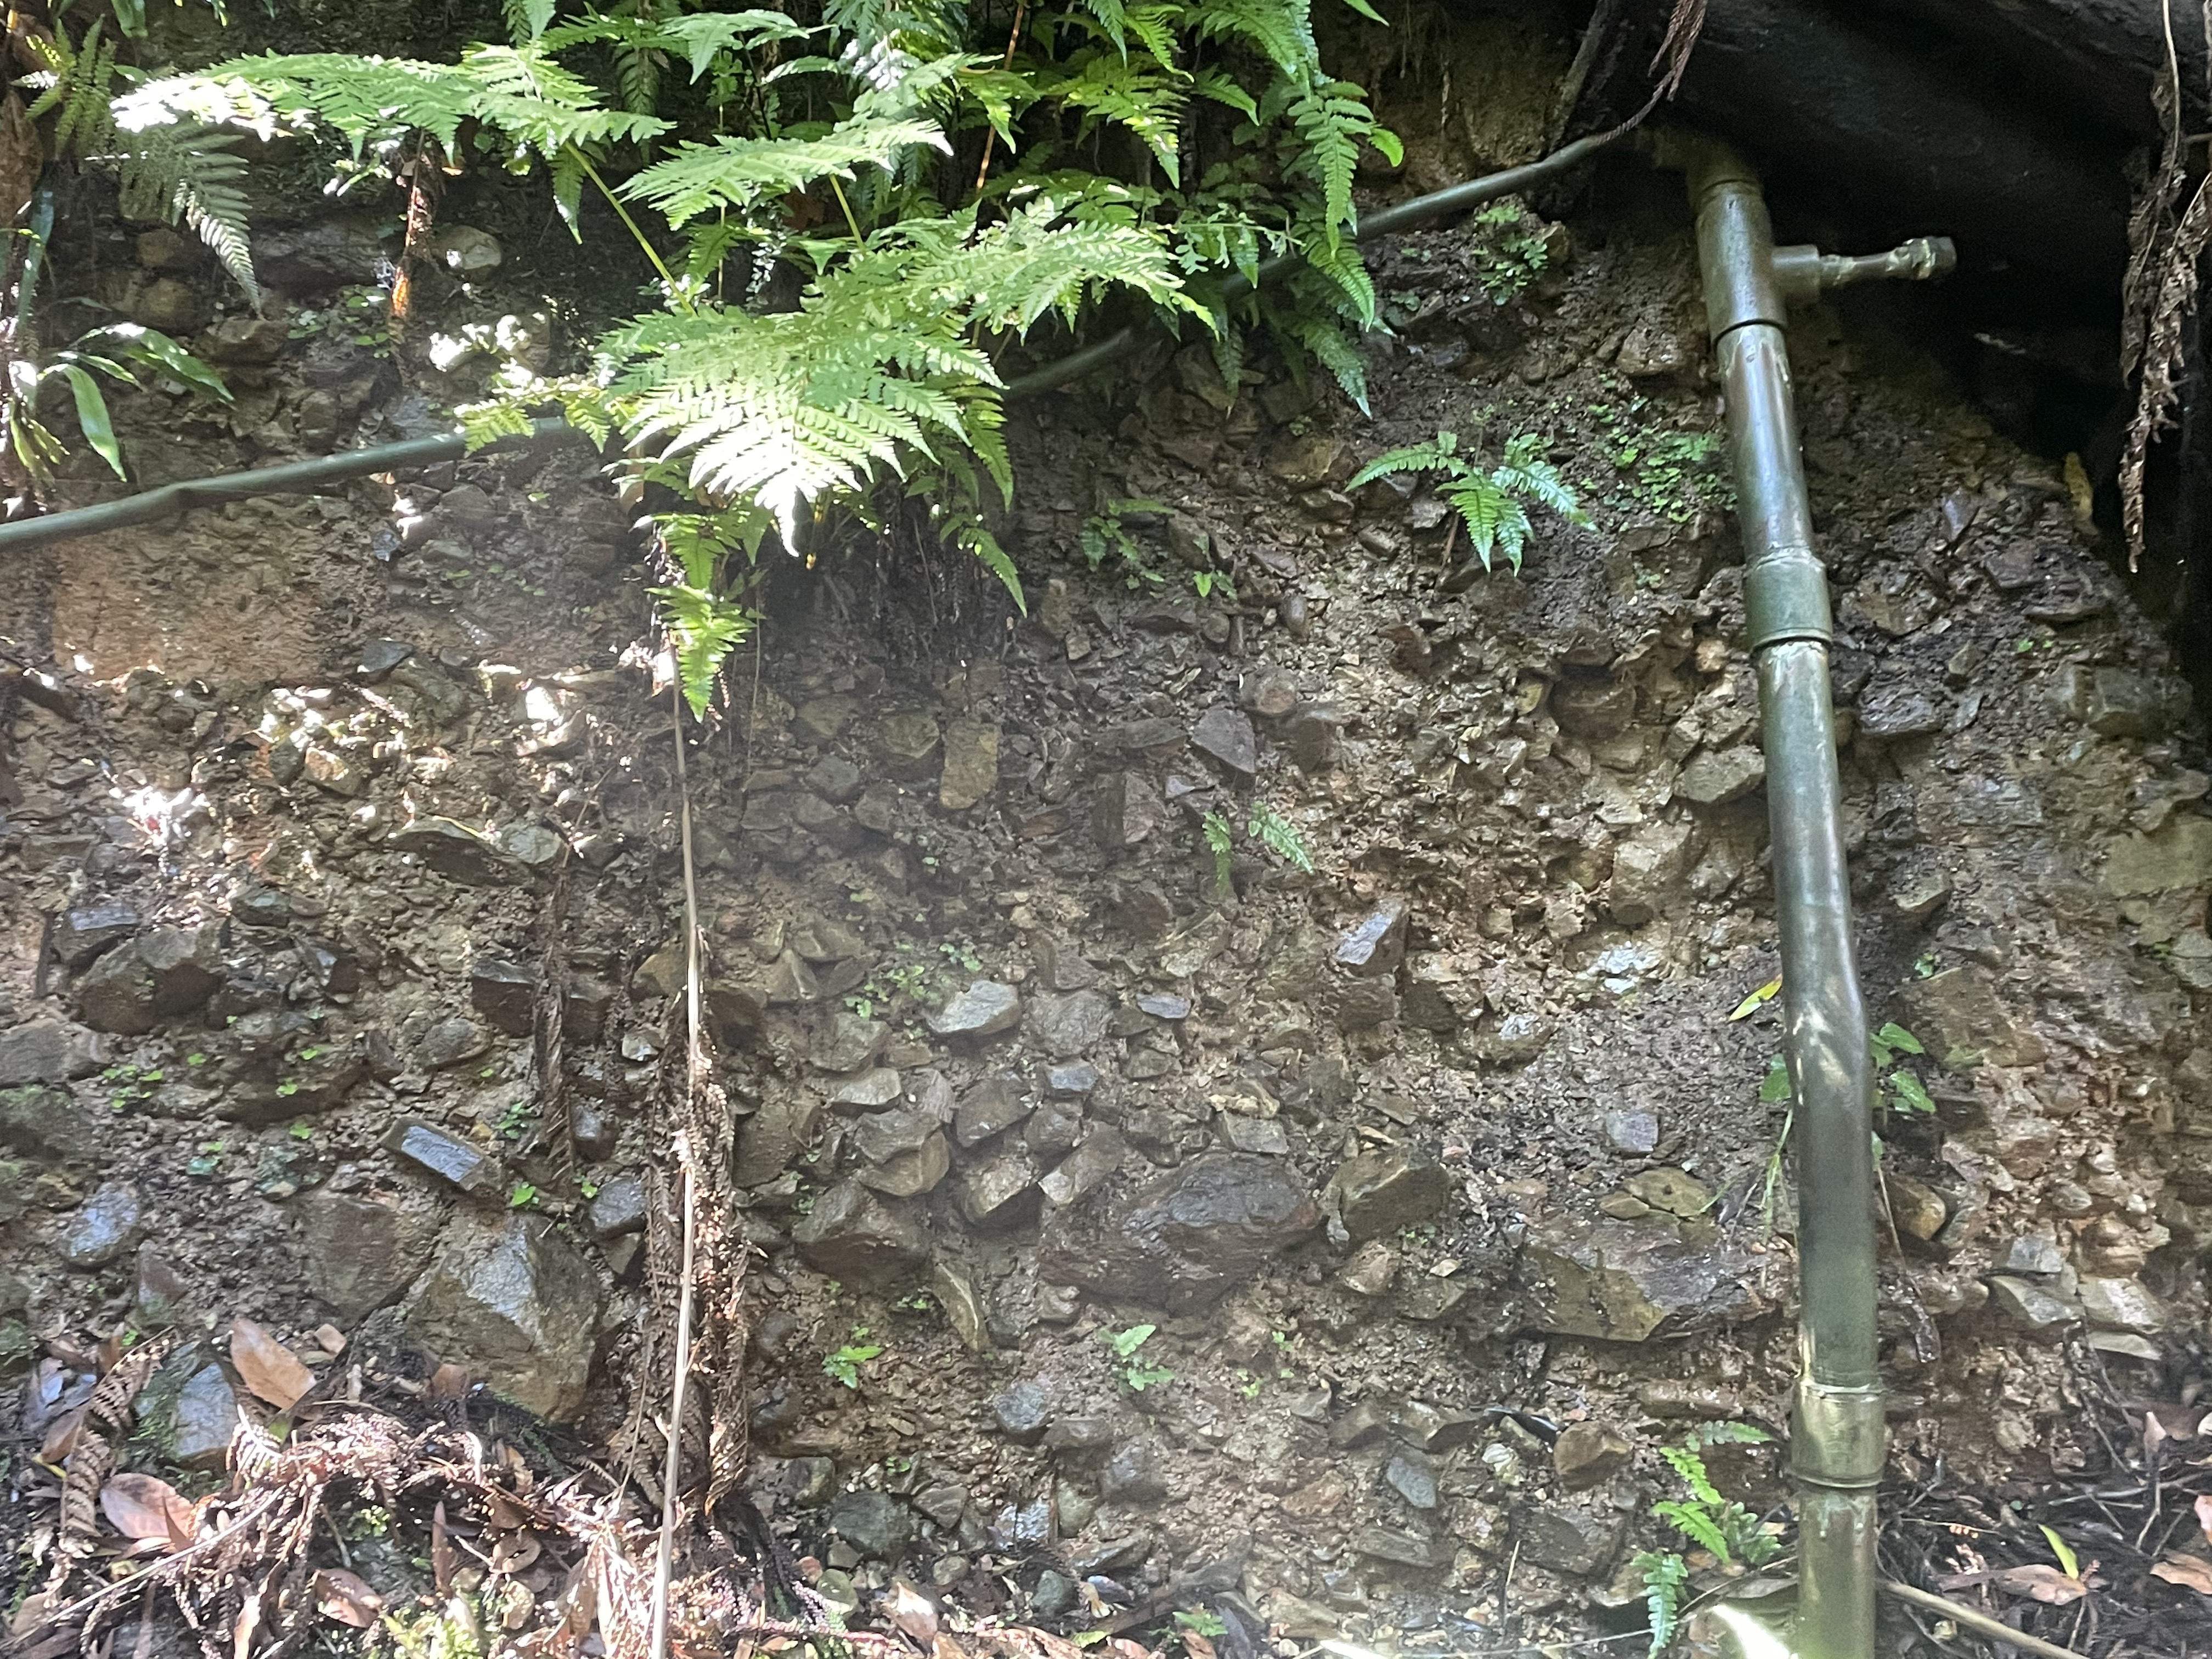
The fanglomerates exposed by the excavation haven’t been dated but are believed to be 2-3 million years old. This is too old for carbon-14 and too young for other radiometric techniques. Apparently, they don’t contain sufficient fossils to date either. These rounded cobbles of all sizes (Fig. 2) were deposited on an alluvial fan (hence the name) near steep mountains.
Fig. 2
 A
A  B
B
 C
C
The cobbles range in size from ~one foot in diameter to less than an inch. Such a disparity is size results from short transport distance from the source, but the rounded shape of many of the cobbles suggests that transport in steep and rapidly flowing streams before deposition.
ACT Summary
Most of the rocks we’ve seen in the ACT were deposited/intruded/extruded between 485 and 400 million years ago. The oldest rocks were originally deposited in an ocean trench near rapidly rising land with volcanoes erupting periodically, someplace like Japan today. Sedimentation accompanied by granite plutons pushing into older rocks as well as explosive volcanism continued throughout this interval. Sometime after ~420 Ma, many of the older rocks were buried and subsequently folded during a major compressional tectonic event. All of this occurred within a relatively small area, but over an immense time interval.
Whatever event created the mountains that must have existed ended and erosion began. Erosion of this immense mountain range continued for almost 400 million years, at which time the remnant mountains were still large enough to have active alluvial fans between 2-3 Ma.
Events in Queensland
We can fill in some of the gaps from the ACT by reviewing our trip to Brisbane.
First, Sand and mud were collecting in a shallow marine environment between 383-323 Ma, less than 600 miles NE of Canberra. These sediments were deeply buried, deformed, and slightly metamorphosed sometime after deposition. Volcanism was occurring as well.
Between 237 and 200 Ma, sand and mud were being deposited in a delta environment with enough organic matter collecting to form commercially viable coal beds. During this same period, massive layers (>300 feet) of rhyolite were ejected from a shallow magma chamber, forming one of the largest calderas in the world. Erosion ensued until 23-16 Ma, when basalt flowed over the Brisbane area. (Note the change from felsic to basic volcanism during this geologically brief time span.)
Changes in sea level are currently leaving a record in beach sediments that may someday become rocks.
Events in Tasmania
Sedimentary rocks were collecting in Tasmania (~600 miles to the south) between 1600 and 540 Ma. Volcanism was also occurring during this interval, recording a mountain building event not that different from that which occurred later. In fact, the dates are close enough (540 Ma here versus 485 Ma in Canberra) to justify calling this a continuous orogeny. Slightly later (500-470 Ma), a coastline was present in central Tasmania, and intermediate-to-felsic volcanic rocks were produced when a large granitic pluton was emplaced into older sedimentary rocks. More granite was emplaced between 420-360 Ma.
To get an idea of what might have been happening over such a long time (~1600-350 Ma), imagine all the islands east of Australia (preferably viewed on a globe) colliding with it, being swallowed beneath the much more massive land mass. Finally, picture Australia colliding with South America about 350 million years ago. It was that massive an event. Faults and folds are everywhere.
Between 252-201 Ma, Tasmania was collecting rocks in lakes and rivers, i.e., terrestrial sediments. There was also some alkali volcanism occurring. This period didn’t last long, however, being followed (201 and 145 Ma) by the emplacement of a huge basic intrusion close to the surface, between layers of sedimentary rock (aka laccolith).
Basalts flows spilled out of multiple volcanos around 60 Ma. Gravels and sandy sediment collected after ~2 Ma and the current surface is eroding as the land rebounds from removal of miles of sediments.
Summary of Victoria
Melbourne was part of a massive delta system during the Ordovician period (~490-440 Ma), at the same time that so much was happening ~400 miles to the north, in the ACT. These rocks were later folded. Sedimentation shifted to sandy during the Silurian period (~440-416 Ma), probably due to a river changing course. Sometime after 440 Ma, regional compression changed from SE-NW to SW-NE, and increased in intensity.
During the Cretaceous period (145-65 Ma), clastic marine sediments were collecting, as well as nonmarine. Sea level was oscillating. No radiometric dates are available.
The SE tip of Australia was covered by a massive volcanic field after 65 Ma. These flows reached the ocean and extended offshore. Some ash layer were created as well. Nonmarine sediments were also collecting during this period, but they weren’t buried deep enough to become hard.
Between 10 and 5 Ma, the Melbourne area changed from a shallow marine/deltaic environment to an arid land, with episodic sedimentation in streams. Basalt flows continued to pour onto the land, until 700 thousand years ago. During the last million years or so, the climate has dried and most rivers don’t reach the coast, leaving relict sands scattered over older rocks exposed at the coast. Cliffs are common features, partly because of sea level change, partly because of isostatic rebound.
That’s it so far. I’ll update the summary as the field data accumulate.
Australian Capital Territory: Orogenic Volcanism
As I’ve been discussing in the last few posts, the rocks of the ACT record a mountain-building episode between about 485 and 400 million years ago. This post is going to examine some volcanic rocks extruded towards the end of this period.
We drove to the top of Mount Ainsley, Site 16 from the regional guide (See an earlier post for details), from where we looked down on Canberra (Fig. 1), standing on top of a stack of mostly volcanic rocks extruded between 433 and 427 Ma, towards the end of the orogeny. The top of the mountain is approximately 800 feet above the base, which also reveals outcrops of the Mount Ainsley Volcanics formation. That is a thick pile of volcanic material deposited over a 6 million-year interval.
Fig. 1
 A
A  B
B
However, as we’ve learned before, geological time is long. For example, (using SI units for convenience), the mean extrusion rate is 250 m/6 million years, or 40 cm/1000 years. The number is simply too small to comprehend as an annual rate. This is a good rate, however, because it suggests that on average about 40 cm (16 inches) was extruded from a nearby volcano every 1000 years. So it wasn’t as if hell was raining down daily. Let’s see how our estimate compares to the rocks.
We’ll start at the highest point on Mount Ainsley. It’s typical for volcanic rocks to look like they have bedding because they are often produced in episodes and thus form layers, but they aren’t deposited by water so they don’t have well developed layers. That’s what we see in Fig. 2
Fig. 2
 A
A  B
B
 C
C  D
D
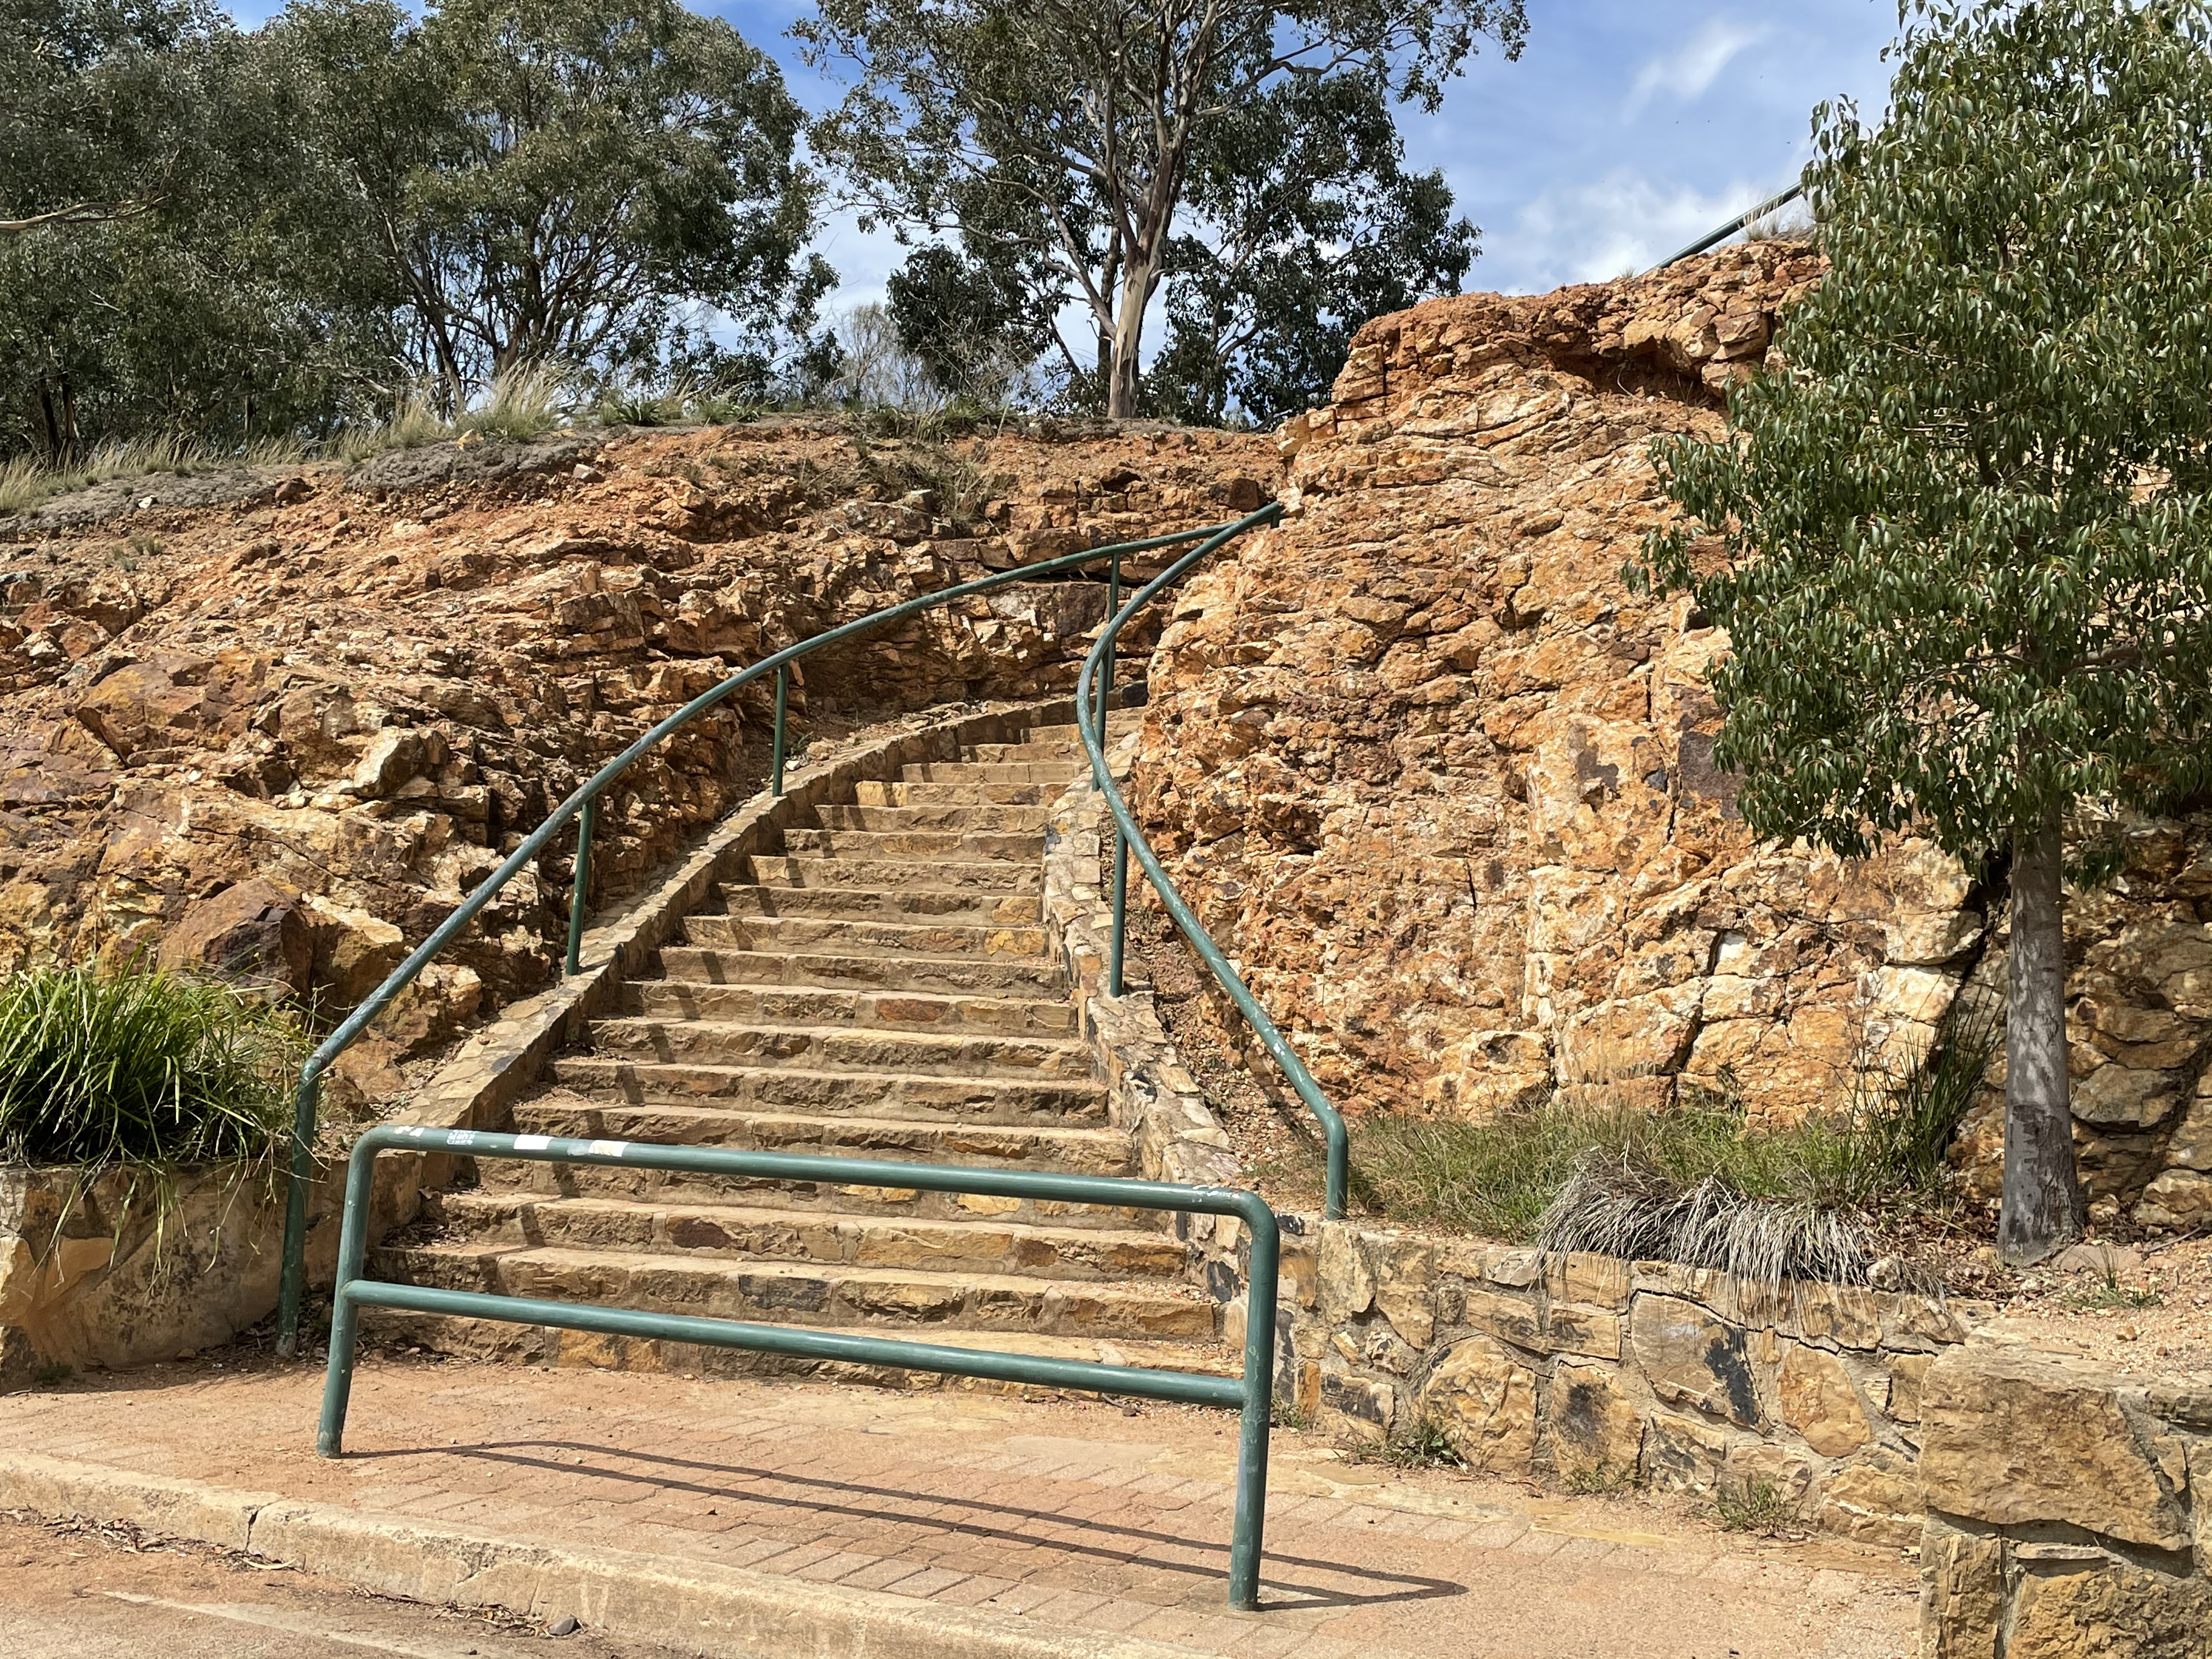
Figure 2A shows a well-preserved face, and this irregular bedding as well as some fractures are visible. A close-up (Fig. 2B) shows a gray rock, varying from lighter to darker shades. There is some irregularity in the coloration on this relatively fresh surface and xenoliths (pieces of rock) and phenocrysts (minerals) are visible as lighter color blebs and very small particles in panel B. The variability of the deposit is obvious in Fig. 2C. The left side of the steps is thinly bedded whereas thick layers are visible to the right. In fact, Fig. 2D (taken on the other side of the knob that defines the highest point of Mount Ainsley), shows massive, rounded appearance.
The only way to identify individual volcanic deposits is if enough time passes between them for the surface to weather. That isn’t obvious here and there was no mention of it in the guidebook. Thus, it’s possible that Fig. 2 represents a single episode, or many scattered over decades or centuries.
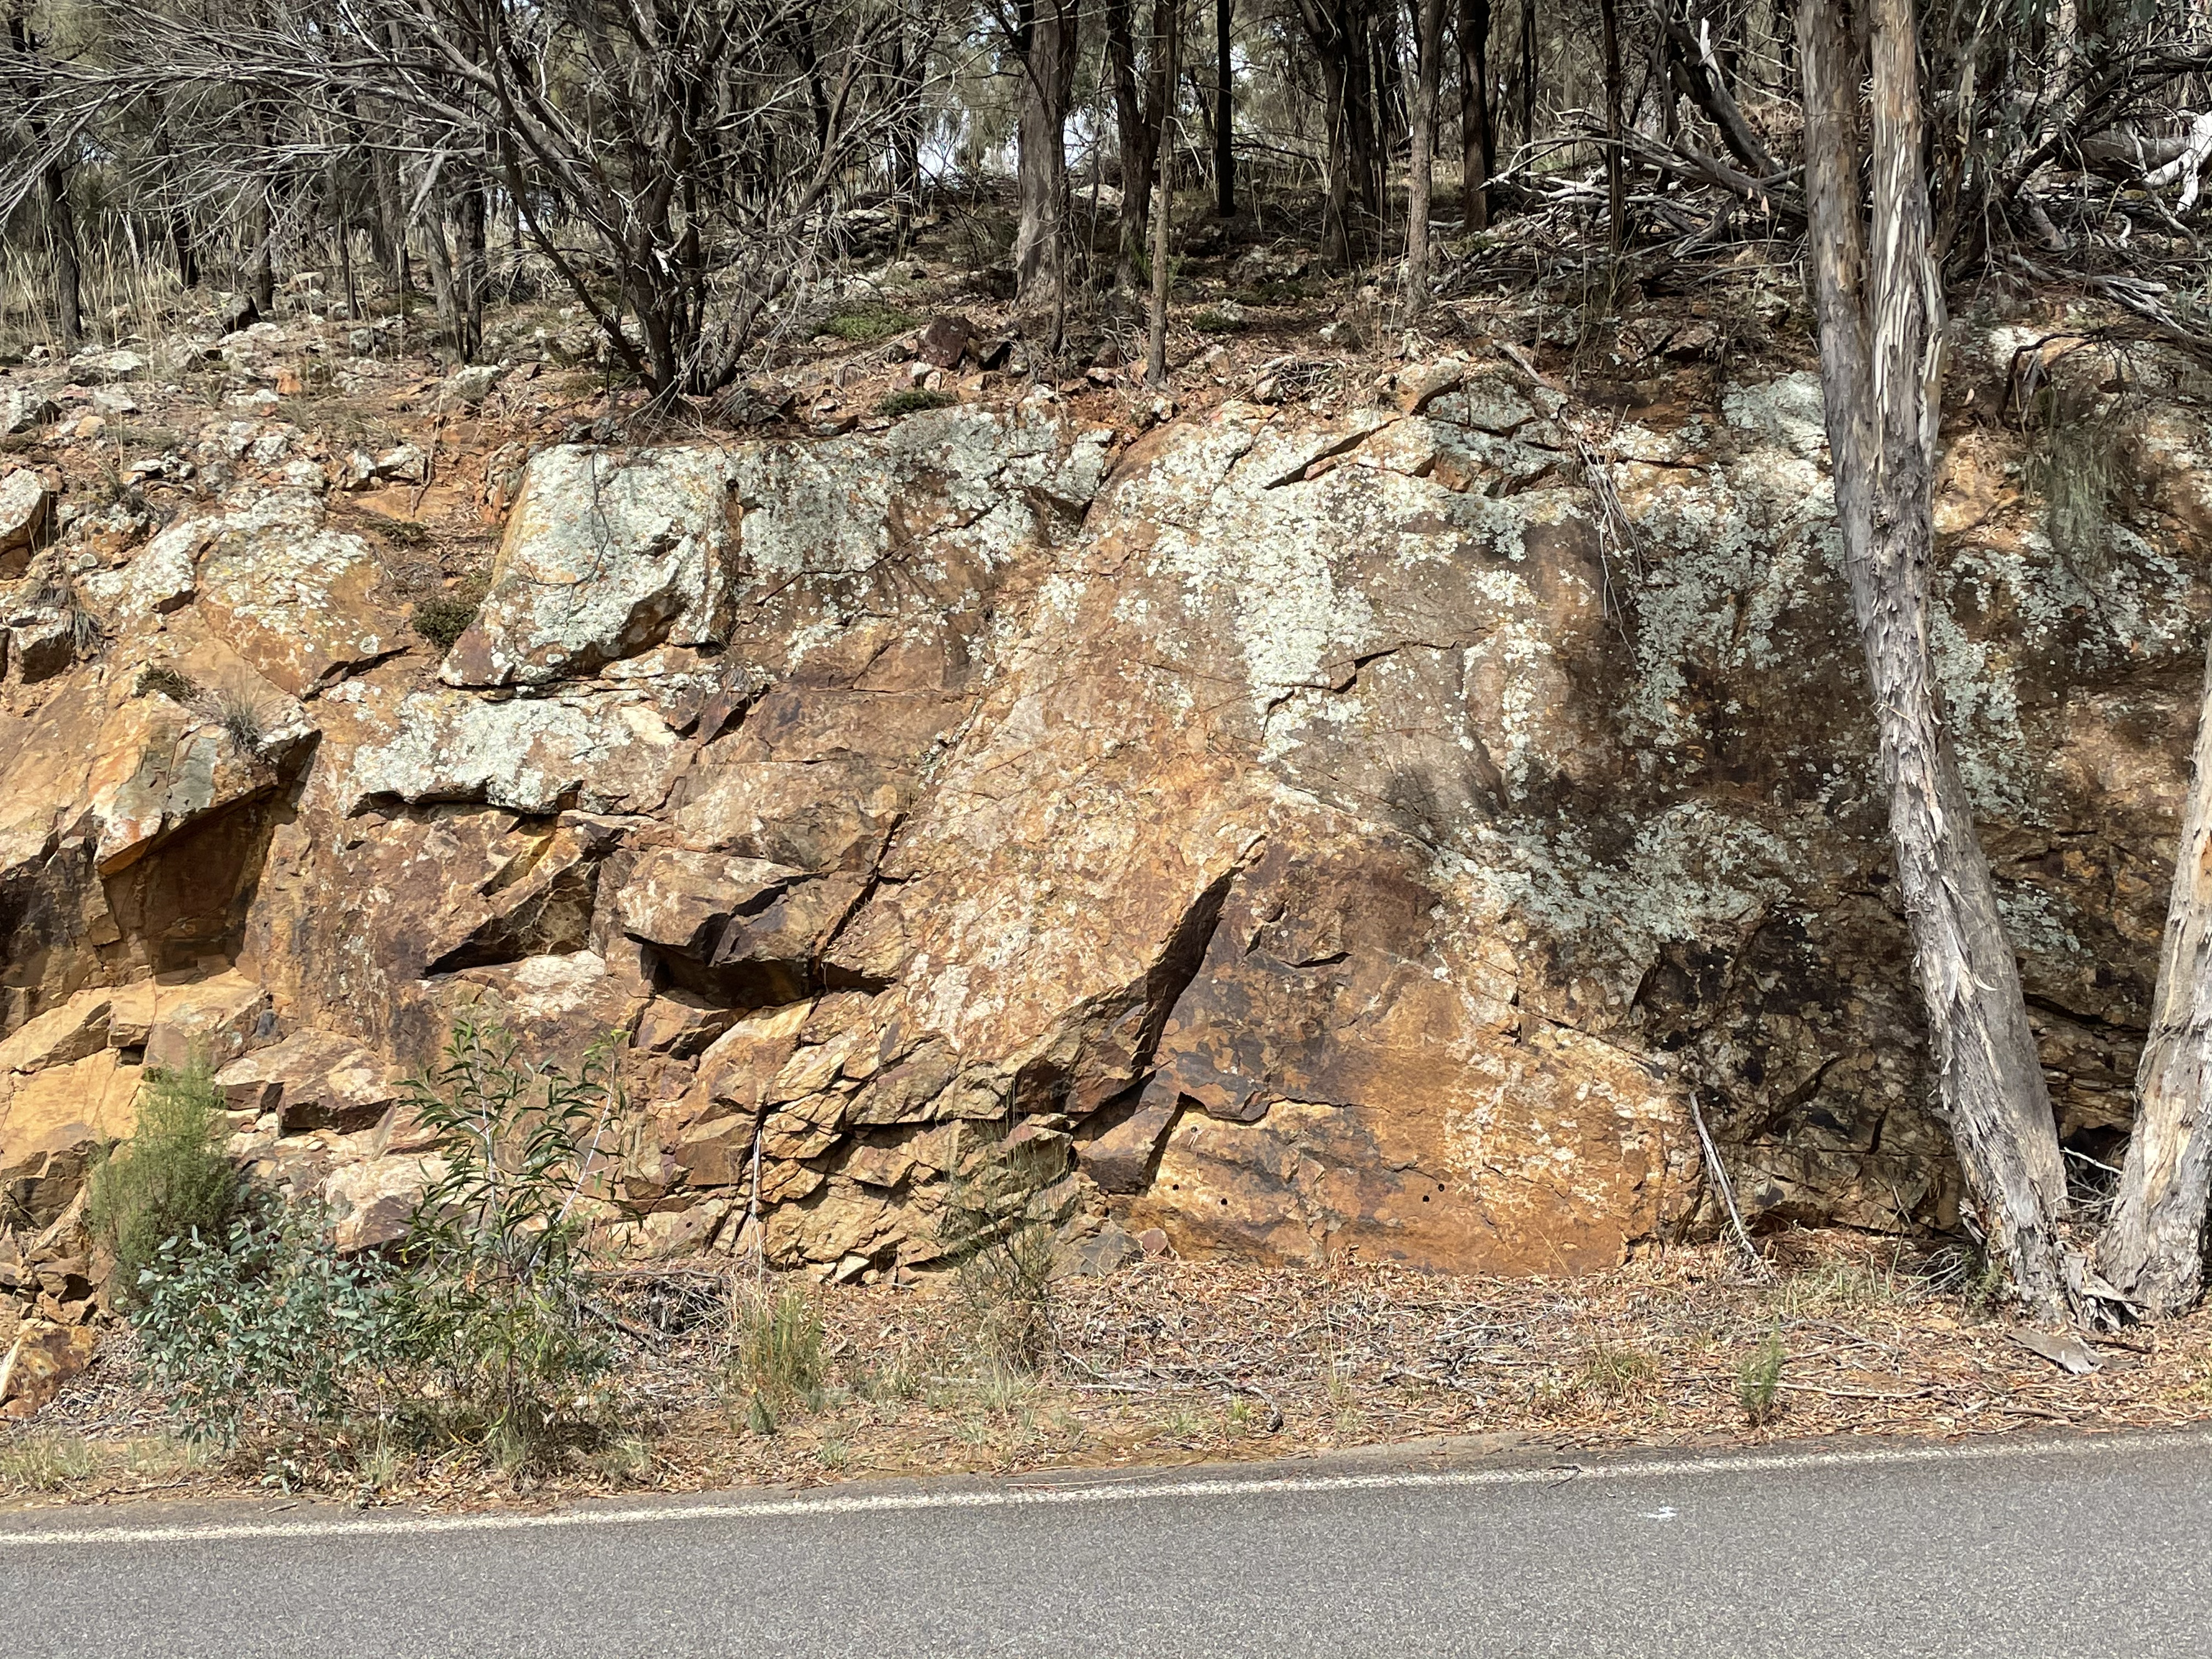
Massive layers are exposed in road cuts as we head down the mountain (Fig. 3), through the thick section of volcanics.
Fig. 3
 A
A  B
B
Figure 3A is featureless but panel B reveals a different texture in the middle of the photo, as if the material was fractured before it cooled, giving it an irregular appearance.
I haven’t mentioned what kind of volcanic rock this is. First, it’s gray color is intermediate between darker volcanics (e.g., andesite) and rhyolite, which is very light gray. The guidebook identifies this as dacite, which is in fact intermediate between the two. Dacite consists primarily of quartz (gray material in photos) and plagioclase feldspar (white material). Some of the 800 feet of volcanics was probably extruded as a thick substance because magma with lots of quartz tends to be thicker than low-silica melts. However, these magmas also tend to be explosive (remember Mt. St. Helens), trapped gasses being released catastrophically.
At the bottom of Mount Ainsley, we went to Site 26, where blocks of agglomerate are exposed in a small area (Fig. 4).
 Fig. 4
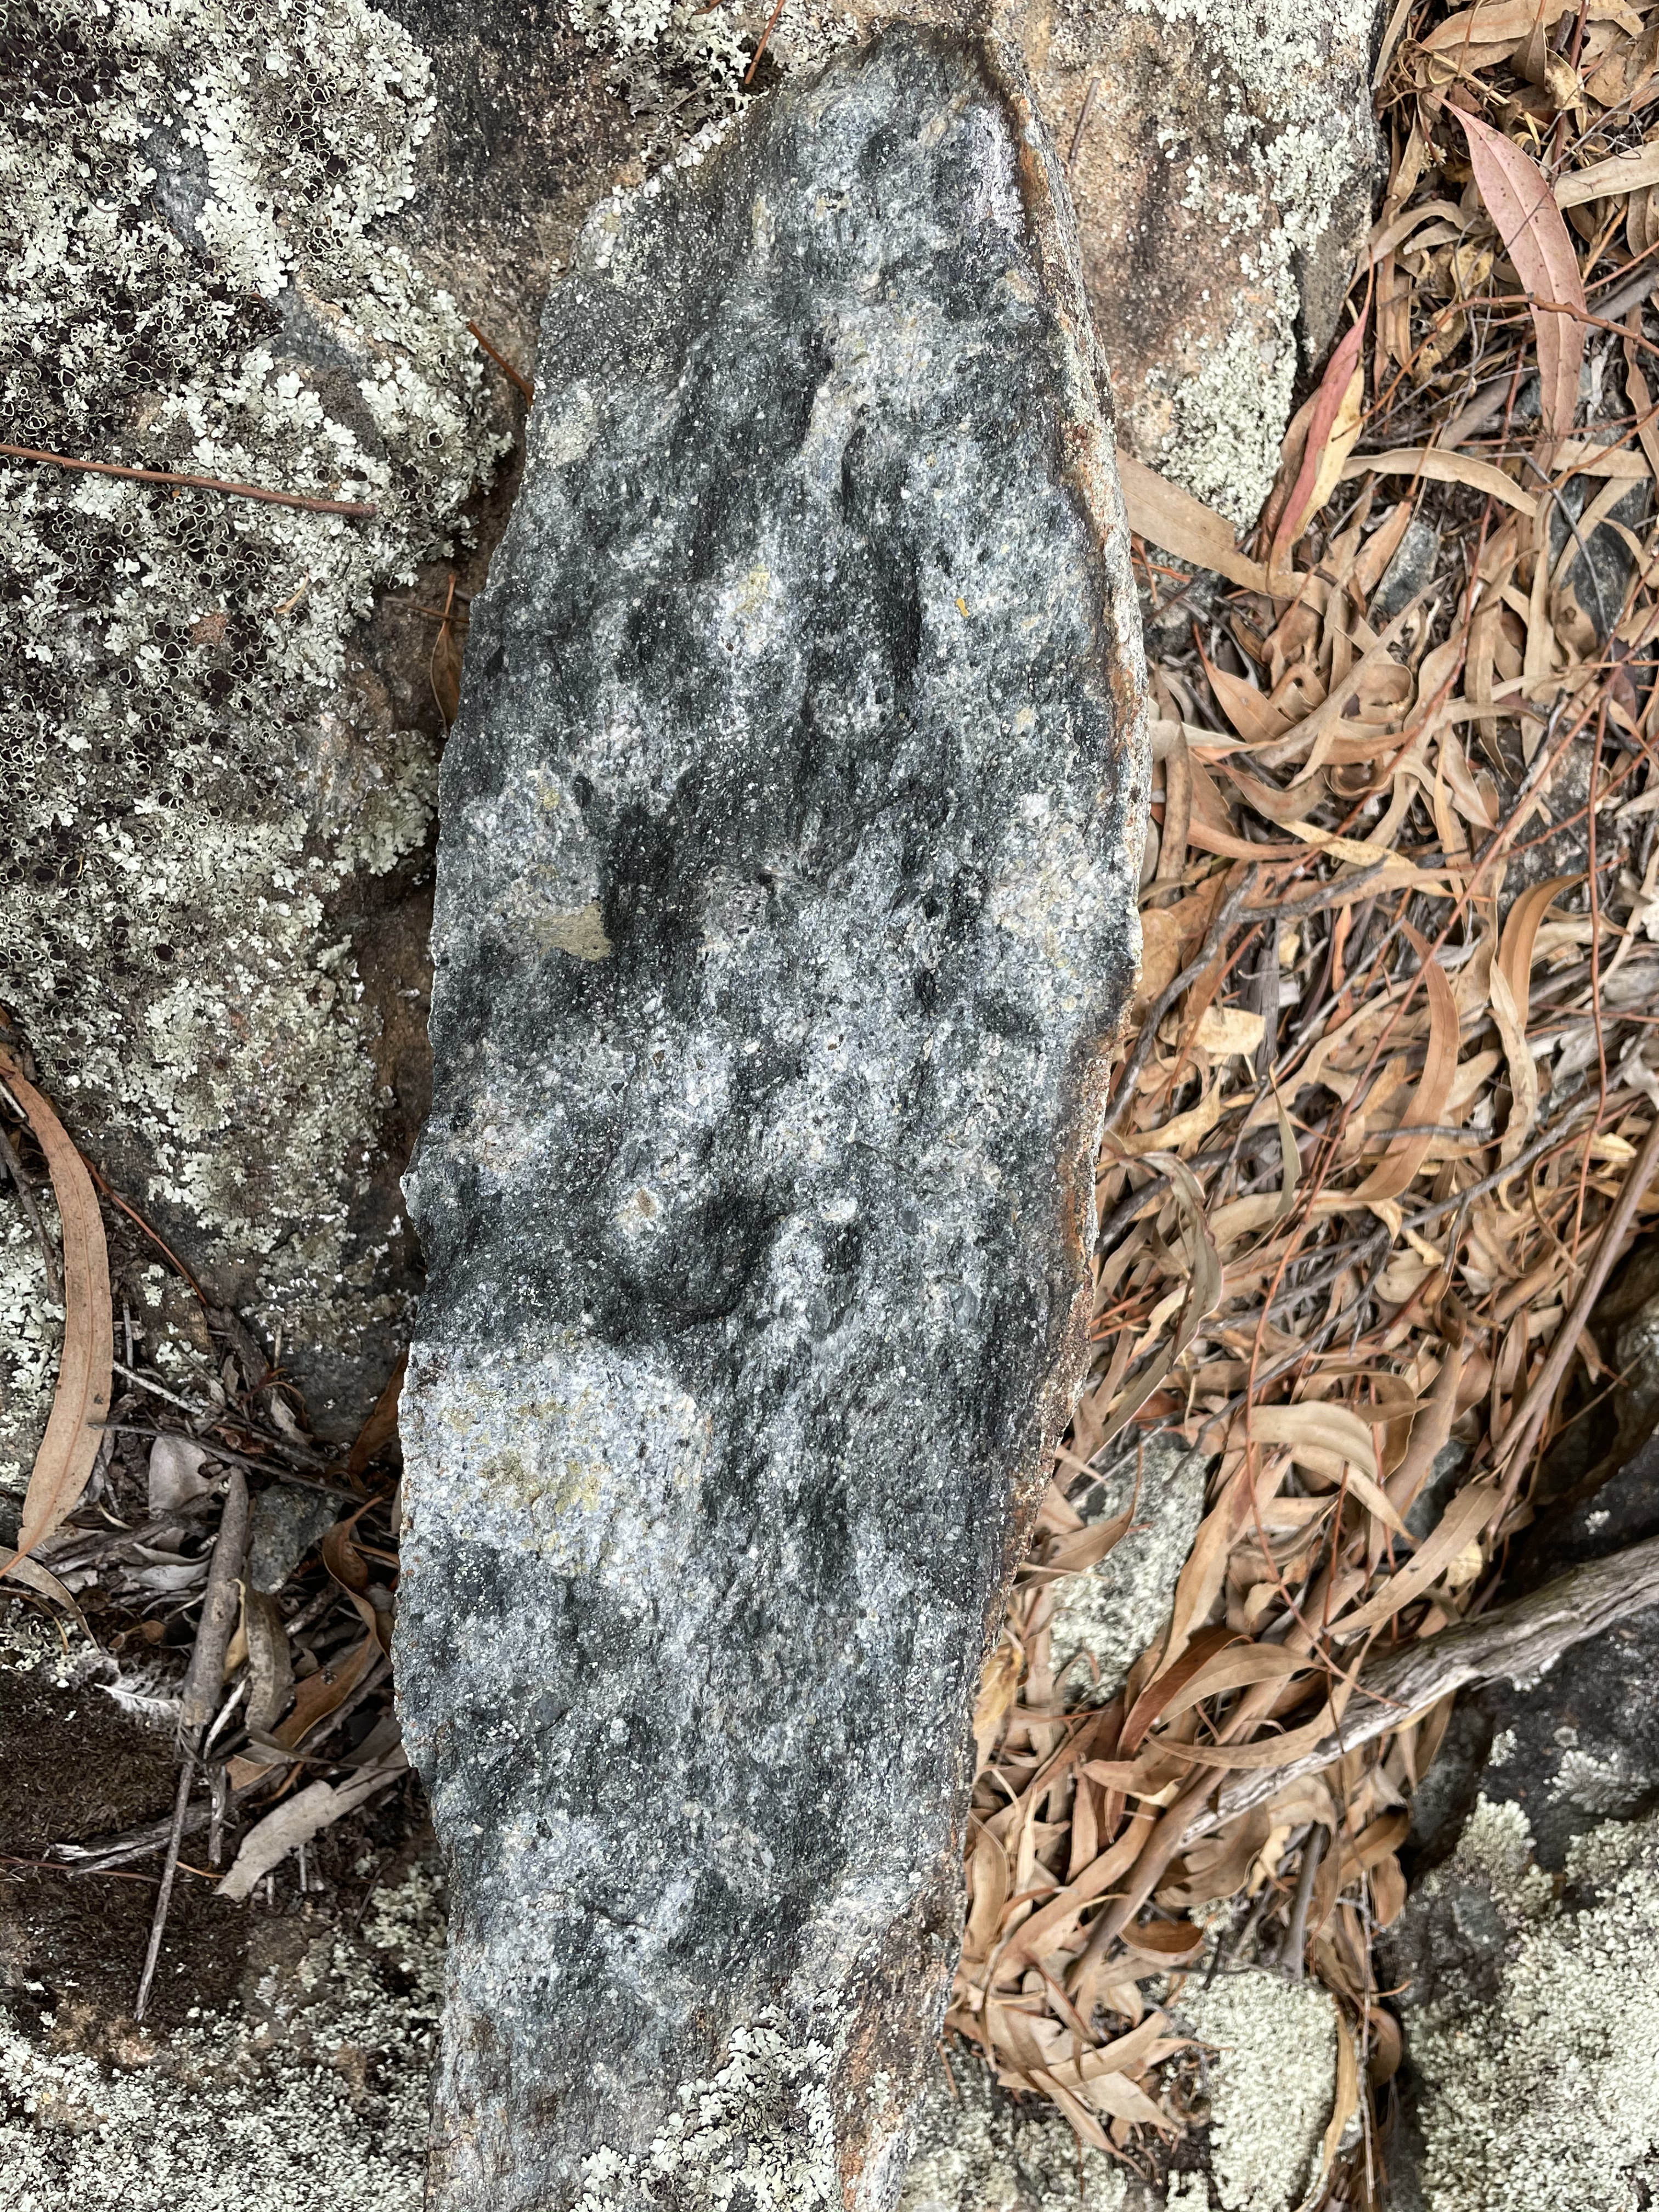
These boulders are in place, being the tips of a larger outcrop covered by the thin soil. A piece broken off by a previous visitor was waiting for me (Fig. 5A). I didn’t have to touch it. Note that we are now at the bottom of the mountain, somewhere near the bottom of the pile of volcanic material. These rocks are certainly thousands, if not millions, of years older than those in Fig. 2.
Fig. 5
 A
A  B
B
The sample in Fig. 5A is 18 inches long. The lighter areas are either pieces of country rock, or feldspar (which crystallizes at a higher temperature than quartz). Figure 5B is close enough to see the wide range in the size and shape of the phenocrysts (the image is ~5 inches across).
I’m going to take a moment and look at this rock (not the same sample) even closer (Fig. 6).
Fig. 6
 A
A 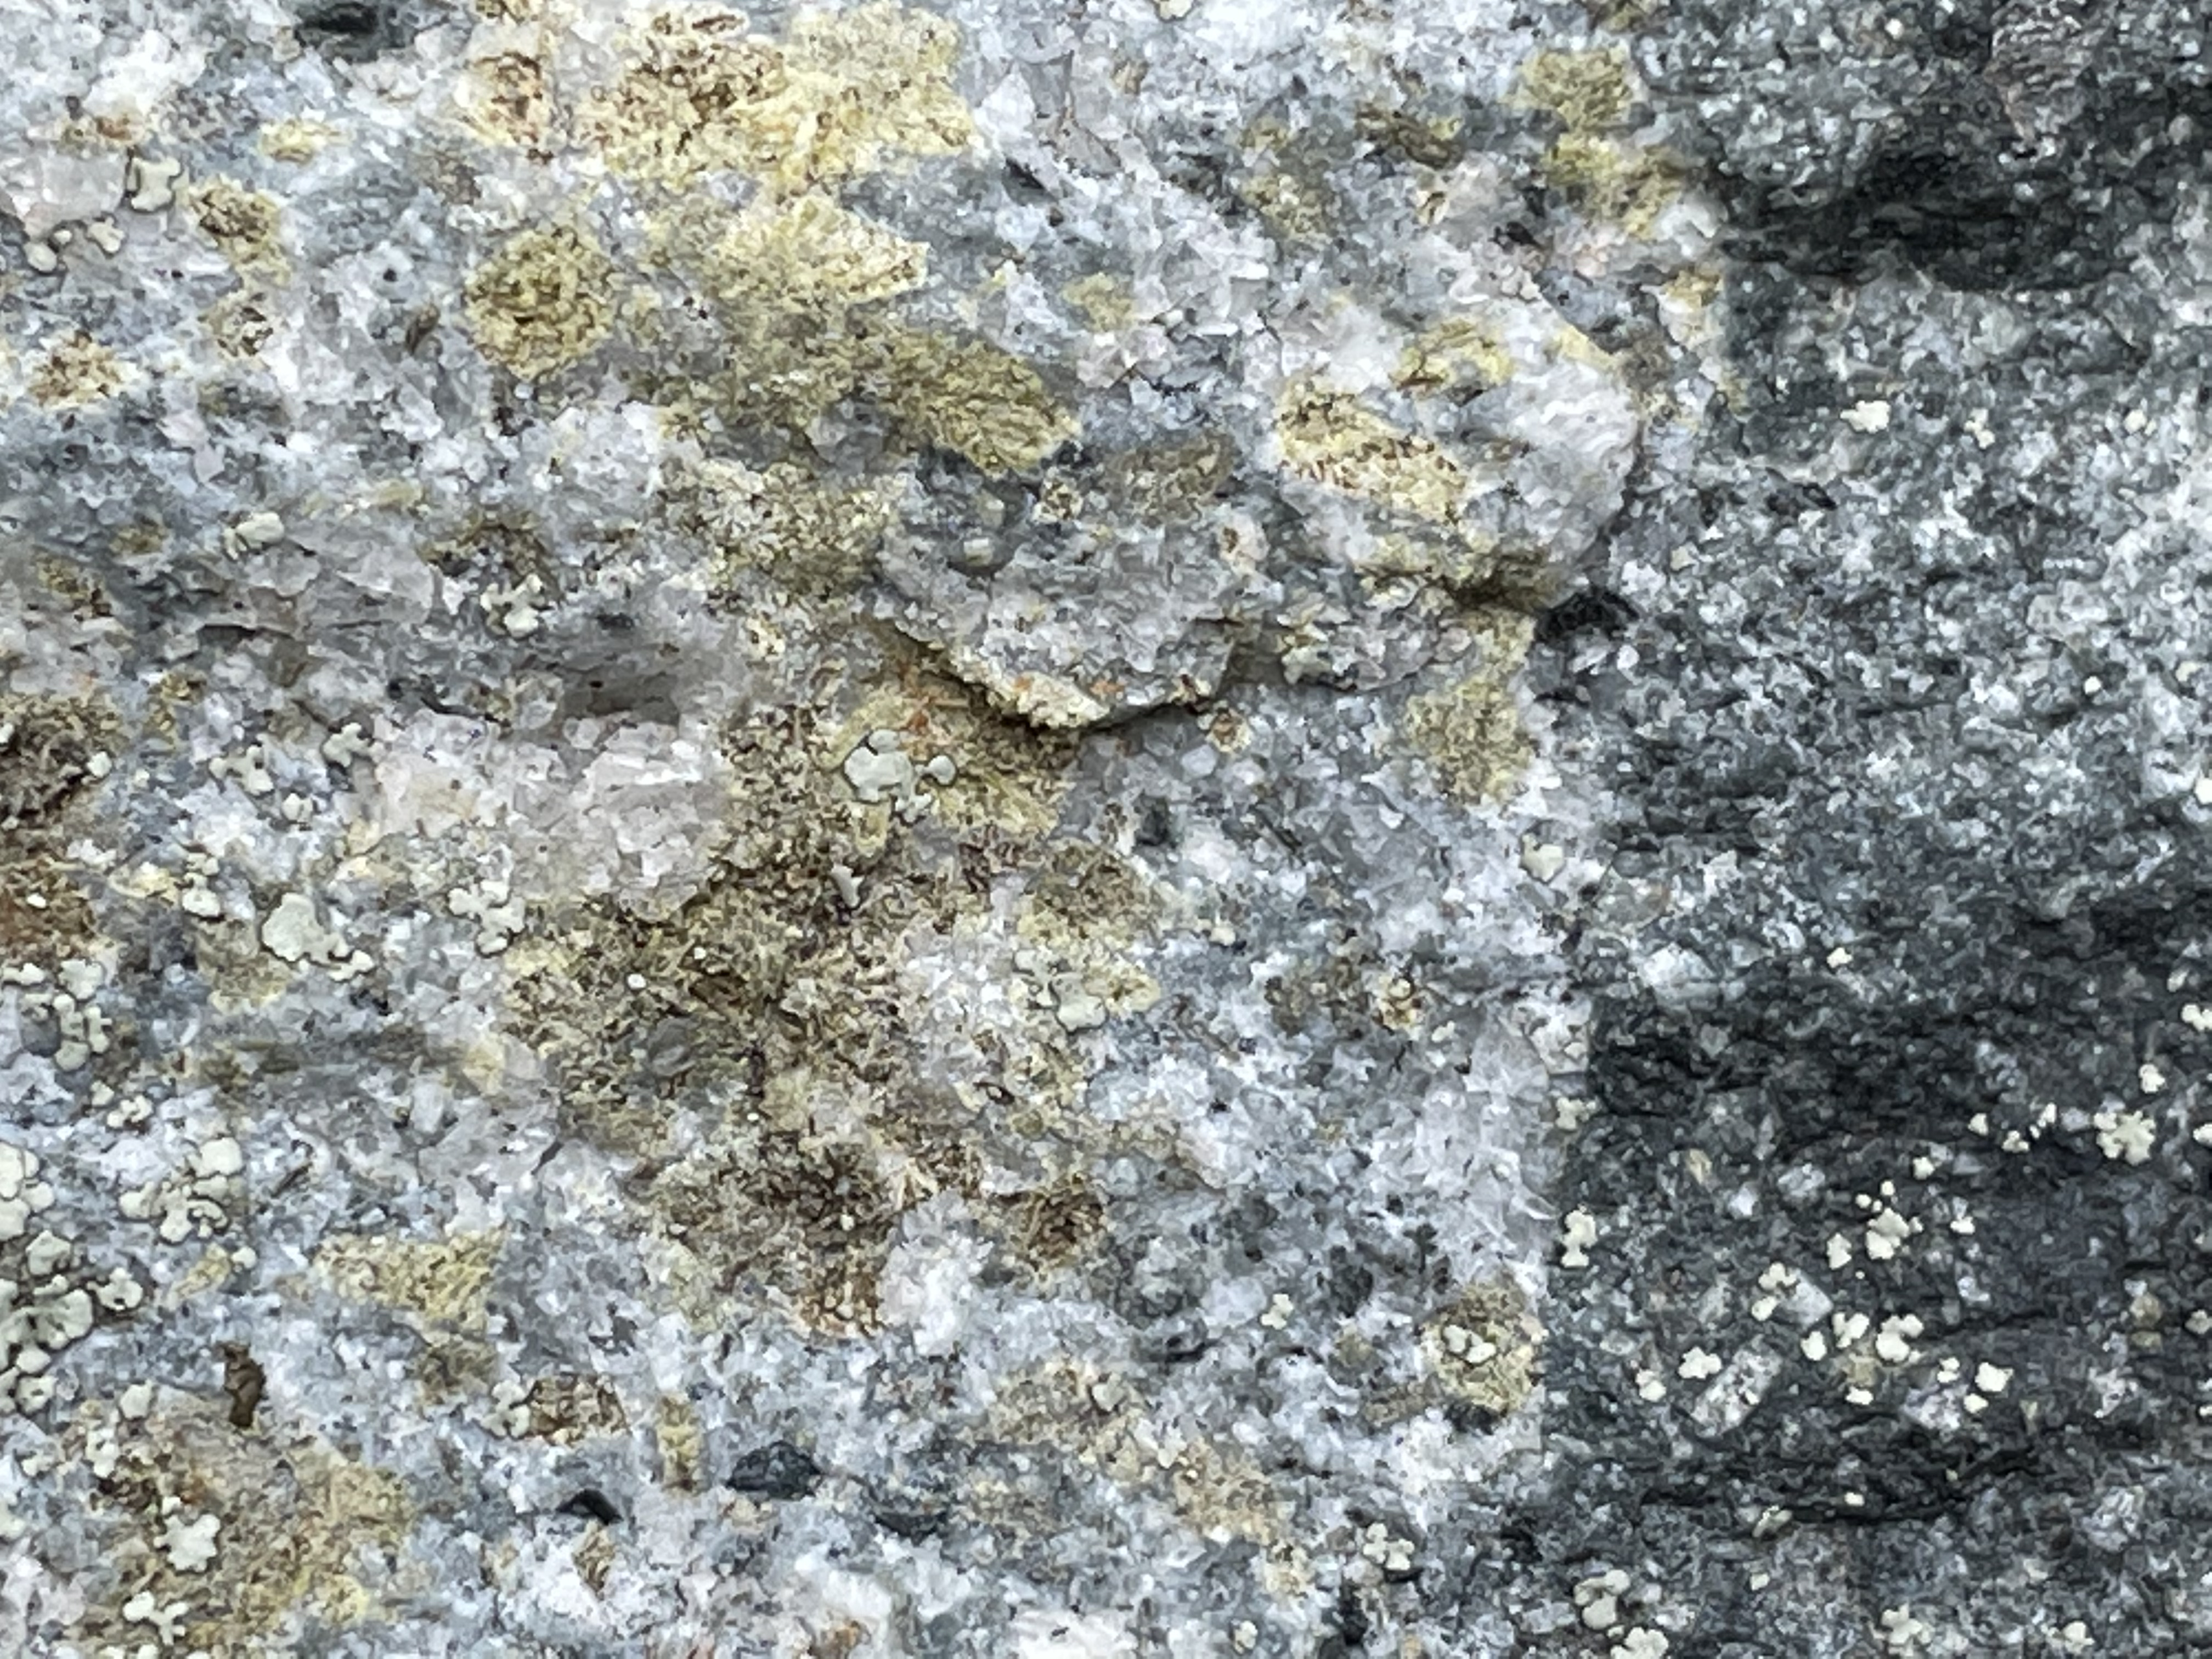 B
B
 C
C
Figure 6A is about 3 inches across, and individual phenocrysts can be identified, including both white (feldspar) and black (unknown) minerals. Zooming in on the photo, the crystallization of the phenocrysts is clear, and even the dark gray groundmass takes on an irregular shape, no longer appearing uniform.
Figure 6B is at even higher magnification. It shows the edge of one of the white phenocrysts against the matrix. The contact is not as sharp as one would expect if it was already solidified and then ejected along with the fine particles within which it was trapped. This magma blasted out of the volcano so hot that the material raining down on the land fused together, while retaining individual mineral characteristics. It wasn’t molten. This kind of structure is unique and well known because we can study ignimbrite in the modern world.
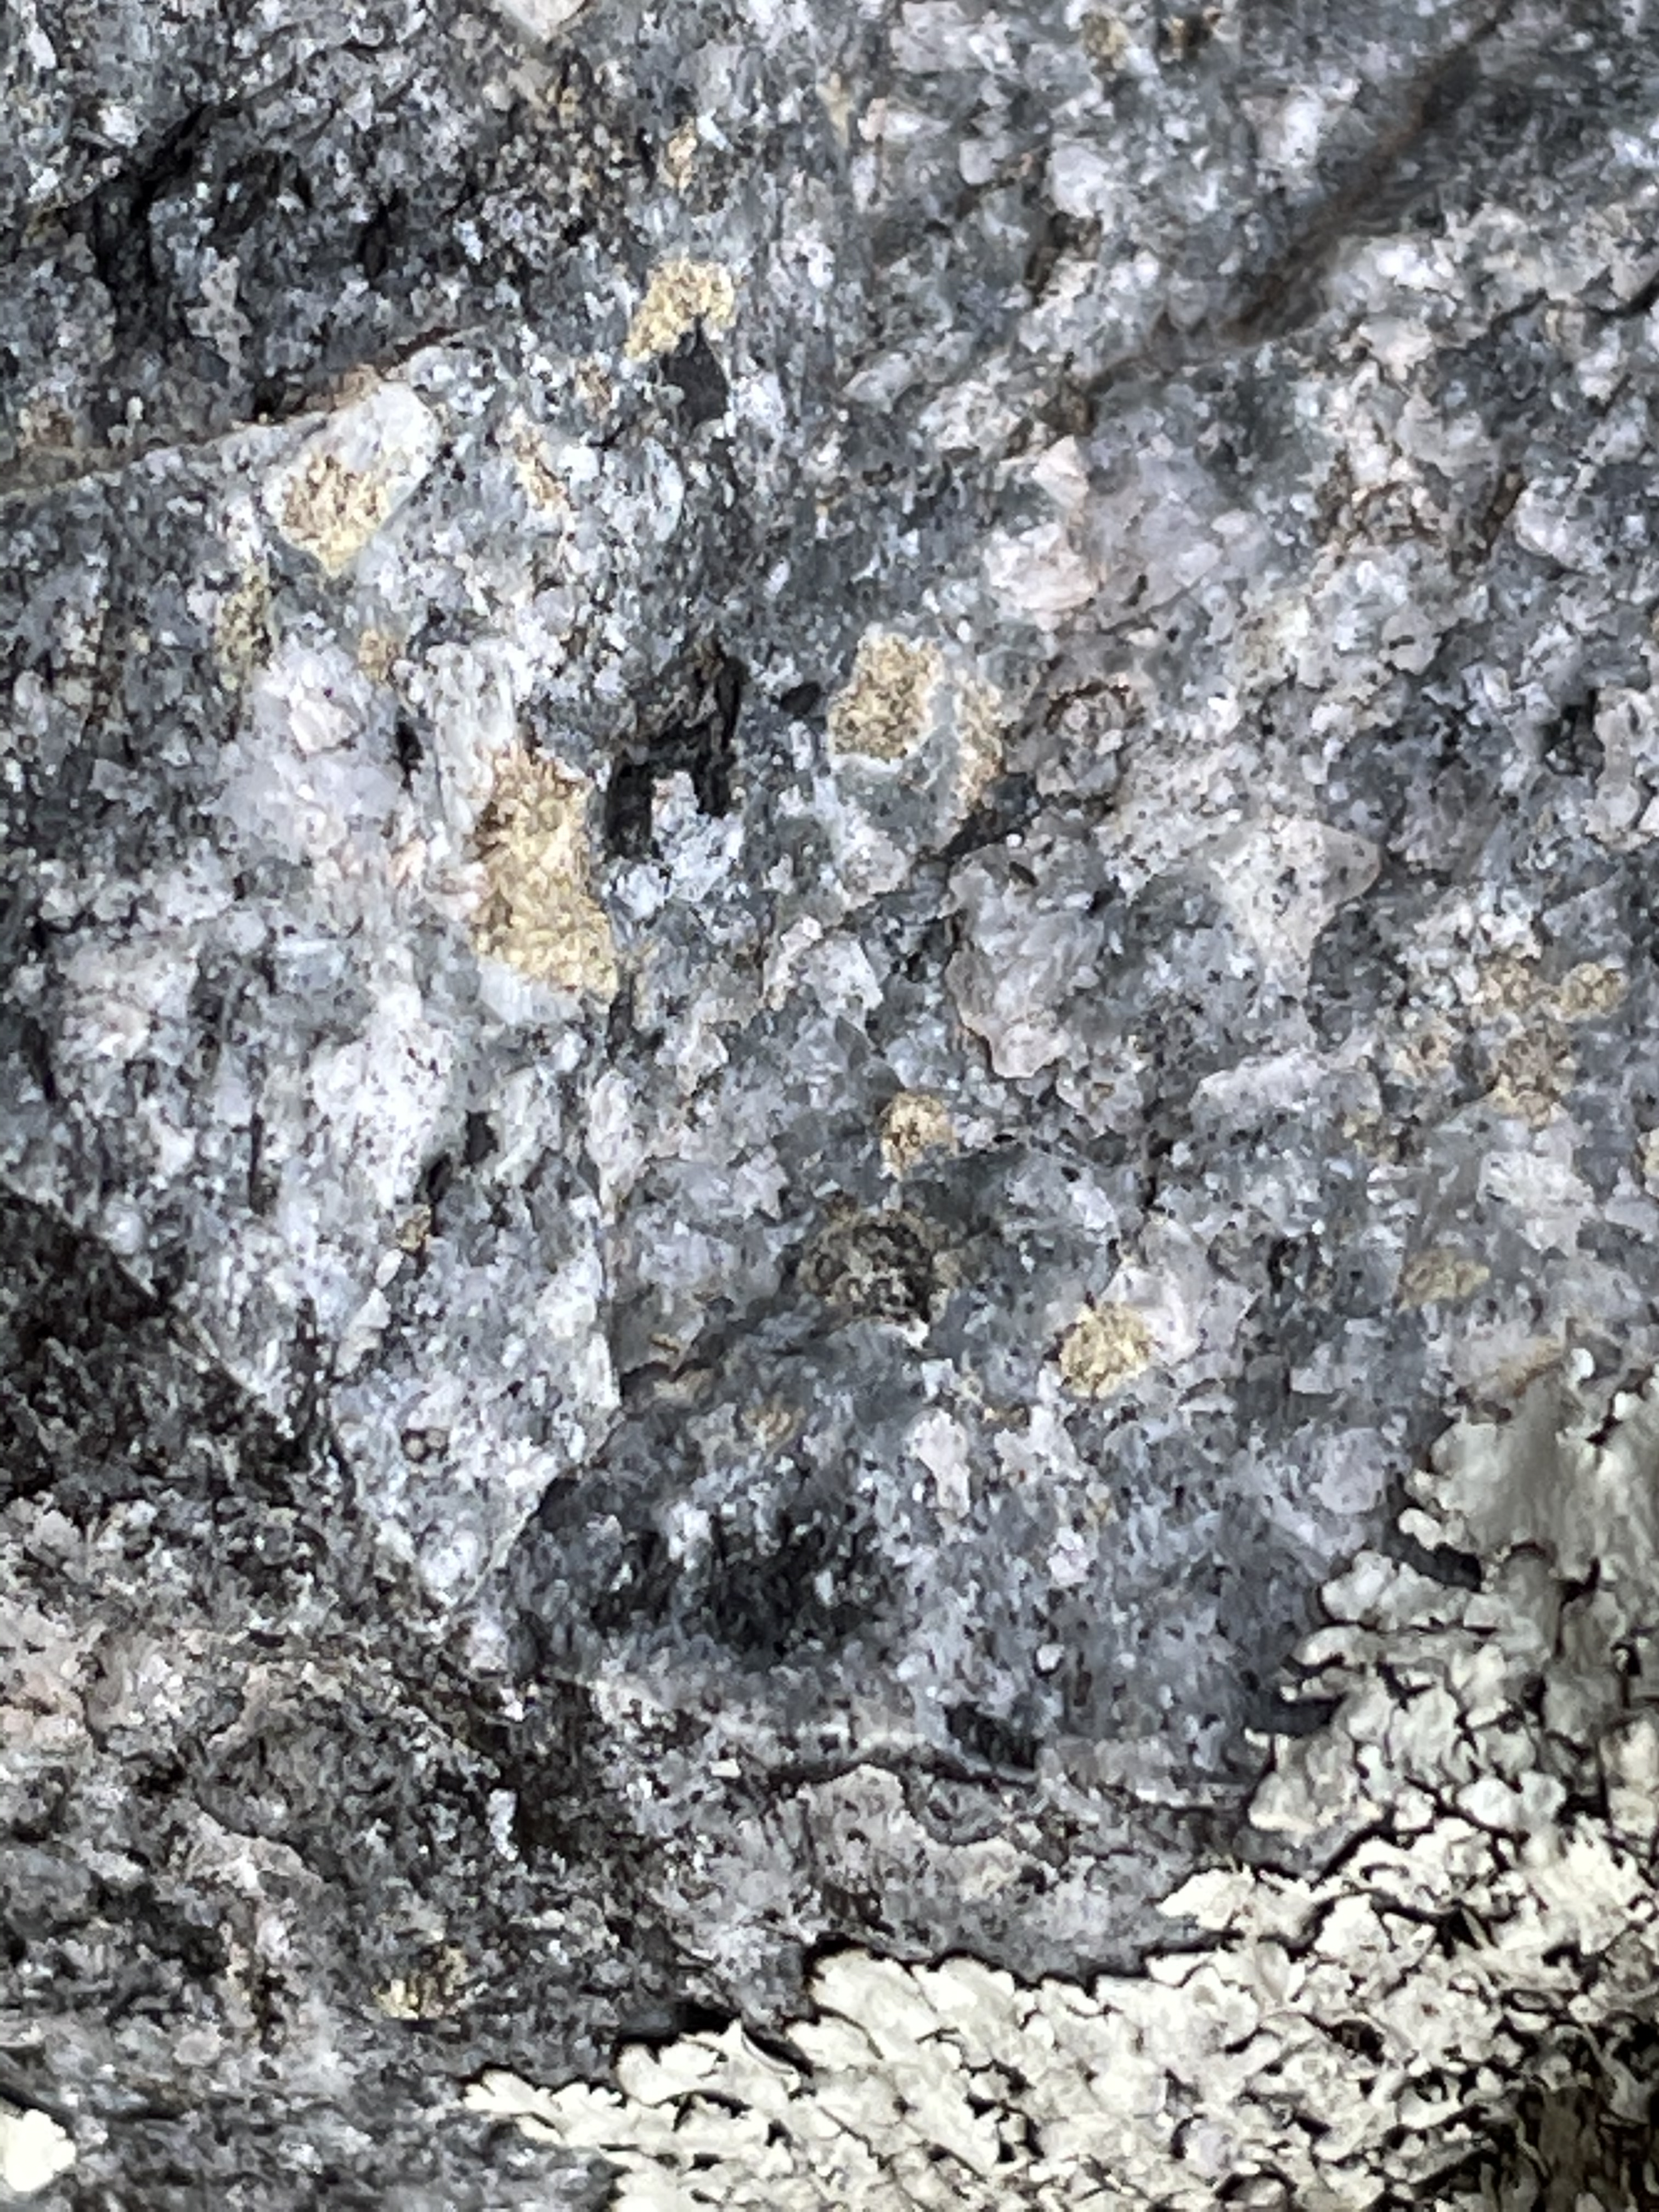
I threw Fig. 6C in for the hell of it. This is at the highest magnification my phone could achieve. Zoom in on this photo and you’ll see the assortment of crystal shapes that existed in the magma chamber when the phenocryst (angular, light-colored shape) composed of individual crystals was ejected. Note the sharp contact in the lower-left corner of the photo, so different from Fig. 6B.
Neither the magma chamber nor the external environment was uniform. Imagine a pot of boiling oil, bubbling, spilling out of the pan and making a mess. That what an eruption from this kind of volcano is like.
I’ll wrap up this series of posts next time.


Recent Comments