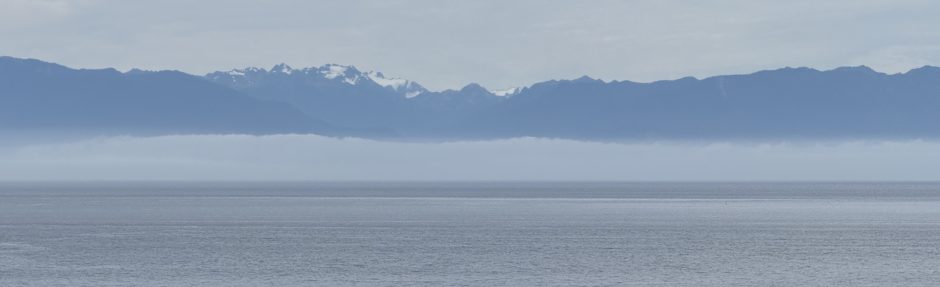
Mount St. Helens Revisited: Miocene Volcanic Rocks
I couldn’t stay away from this fascinating active volcano. I reported on the recovery of the north flank, after the 1980 eruption, in a previous post. Today I visited the eastern and southern flanks, which were spared the devastation of an enormous explosion.
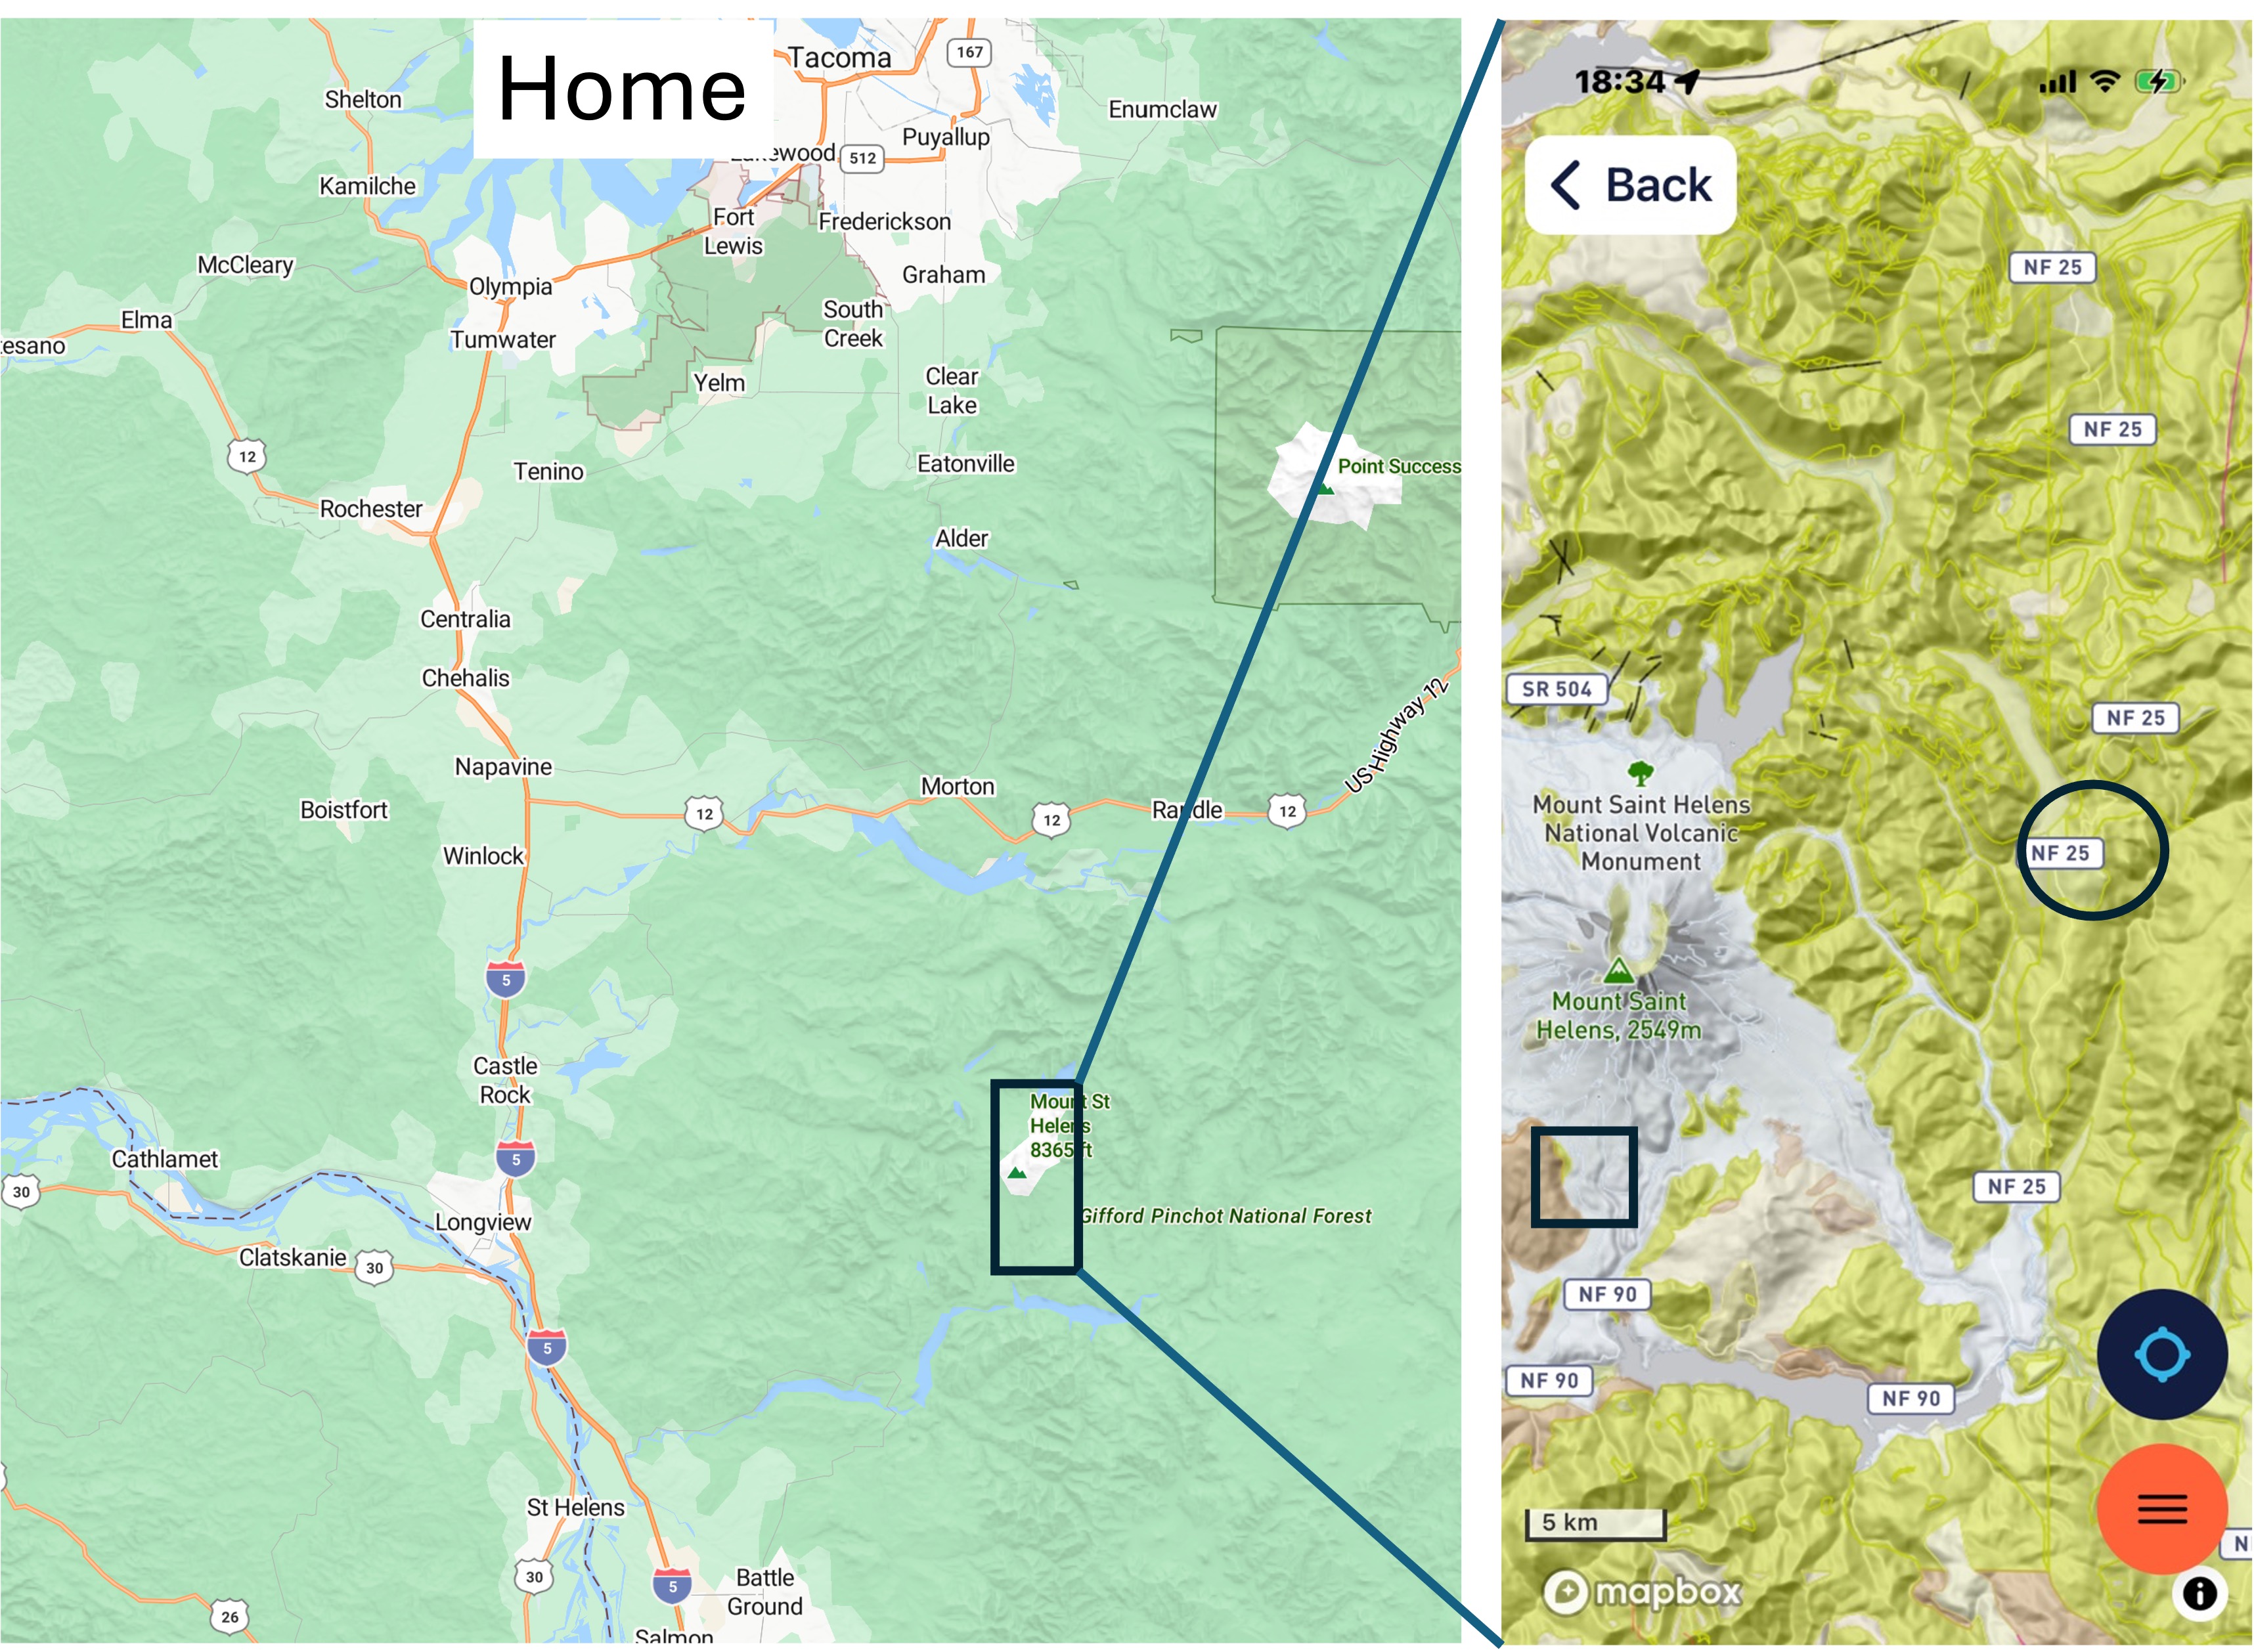
Figure 1. Mount Saint Helens National Volcanic Monument is about three-hours from Tacoma (Home in the left plate). We took back roads and circumnavigated the volcano today, following NF 25 (seen in the right plate), which took us through a volcanic terrain constructed during the last 23 million years. The circled area is the focus of this post. The rock types vary widely, but they are predominantly andesitic flows, ash layers, and breccias. The usual mixed bag of volcaniclastic rocks we expect in a subduction zone plate margin.
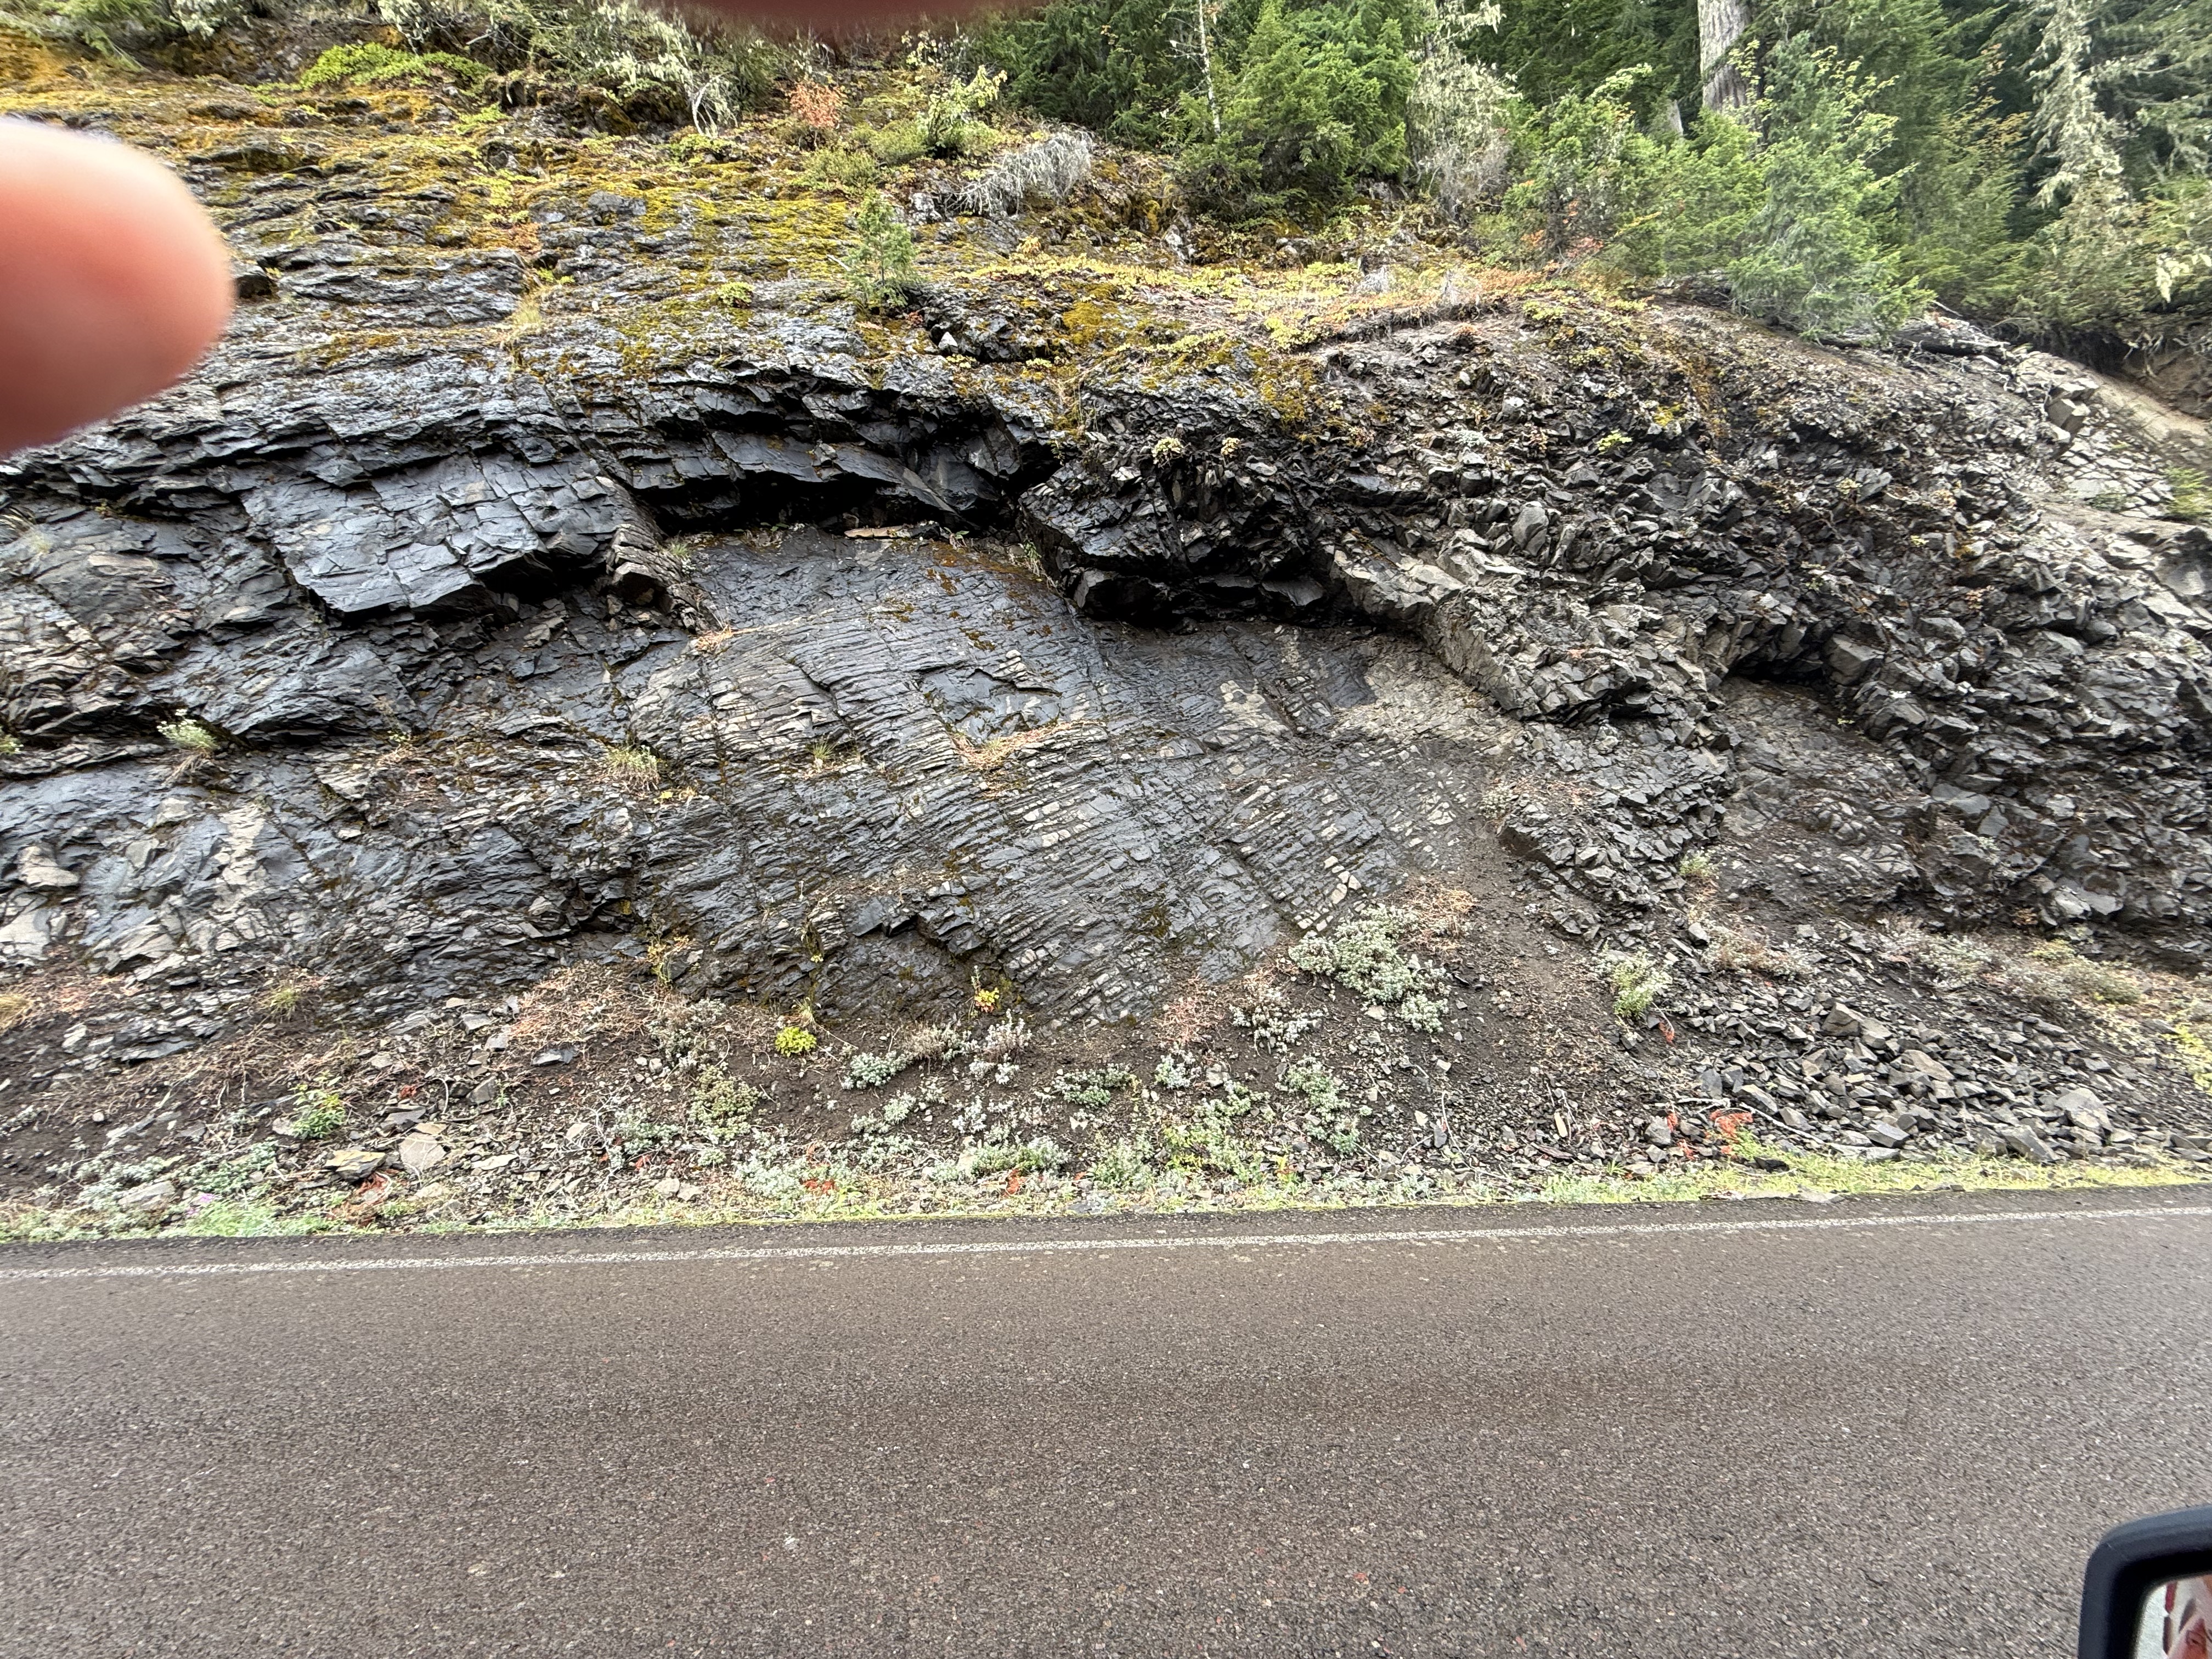
Figure 2. This photo reveals a series of thin beds that suddenly dip towards the road. They are highly fractured to the right of the image. Obviously, these were not recently erupted; they have been deformed in the last twenty-million years.
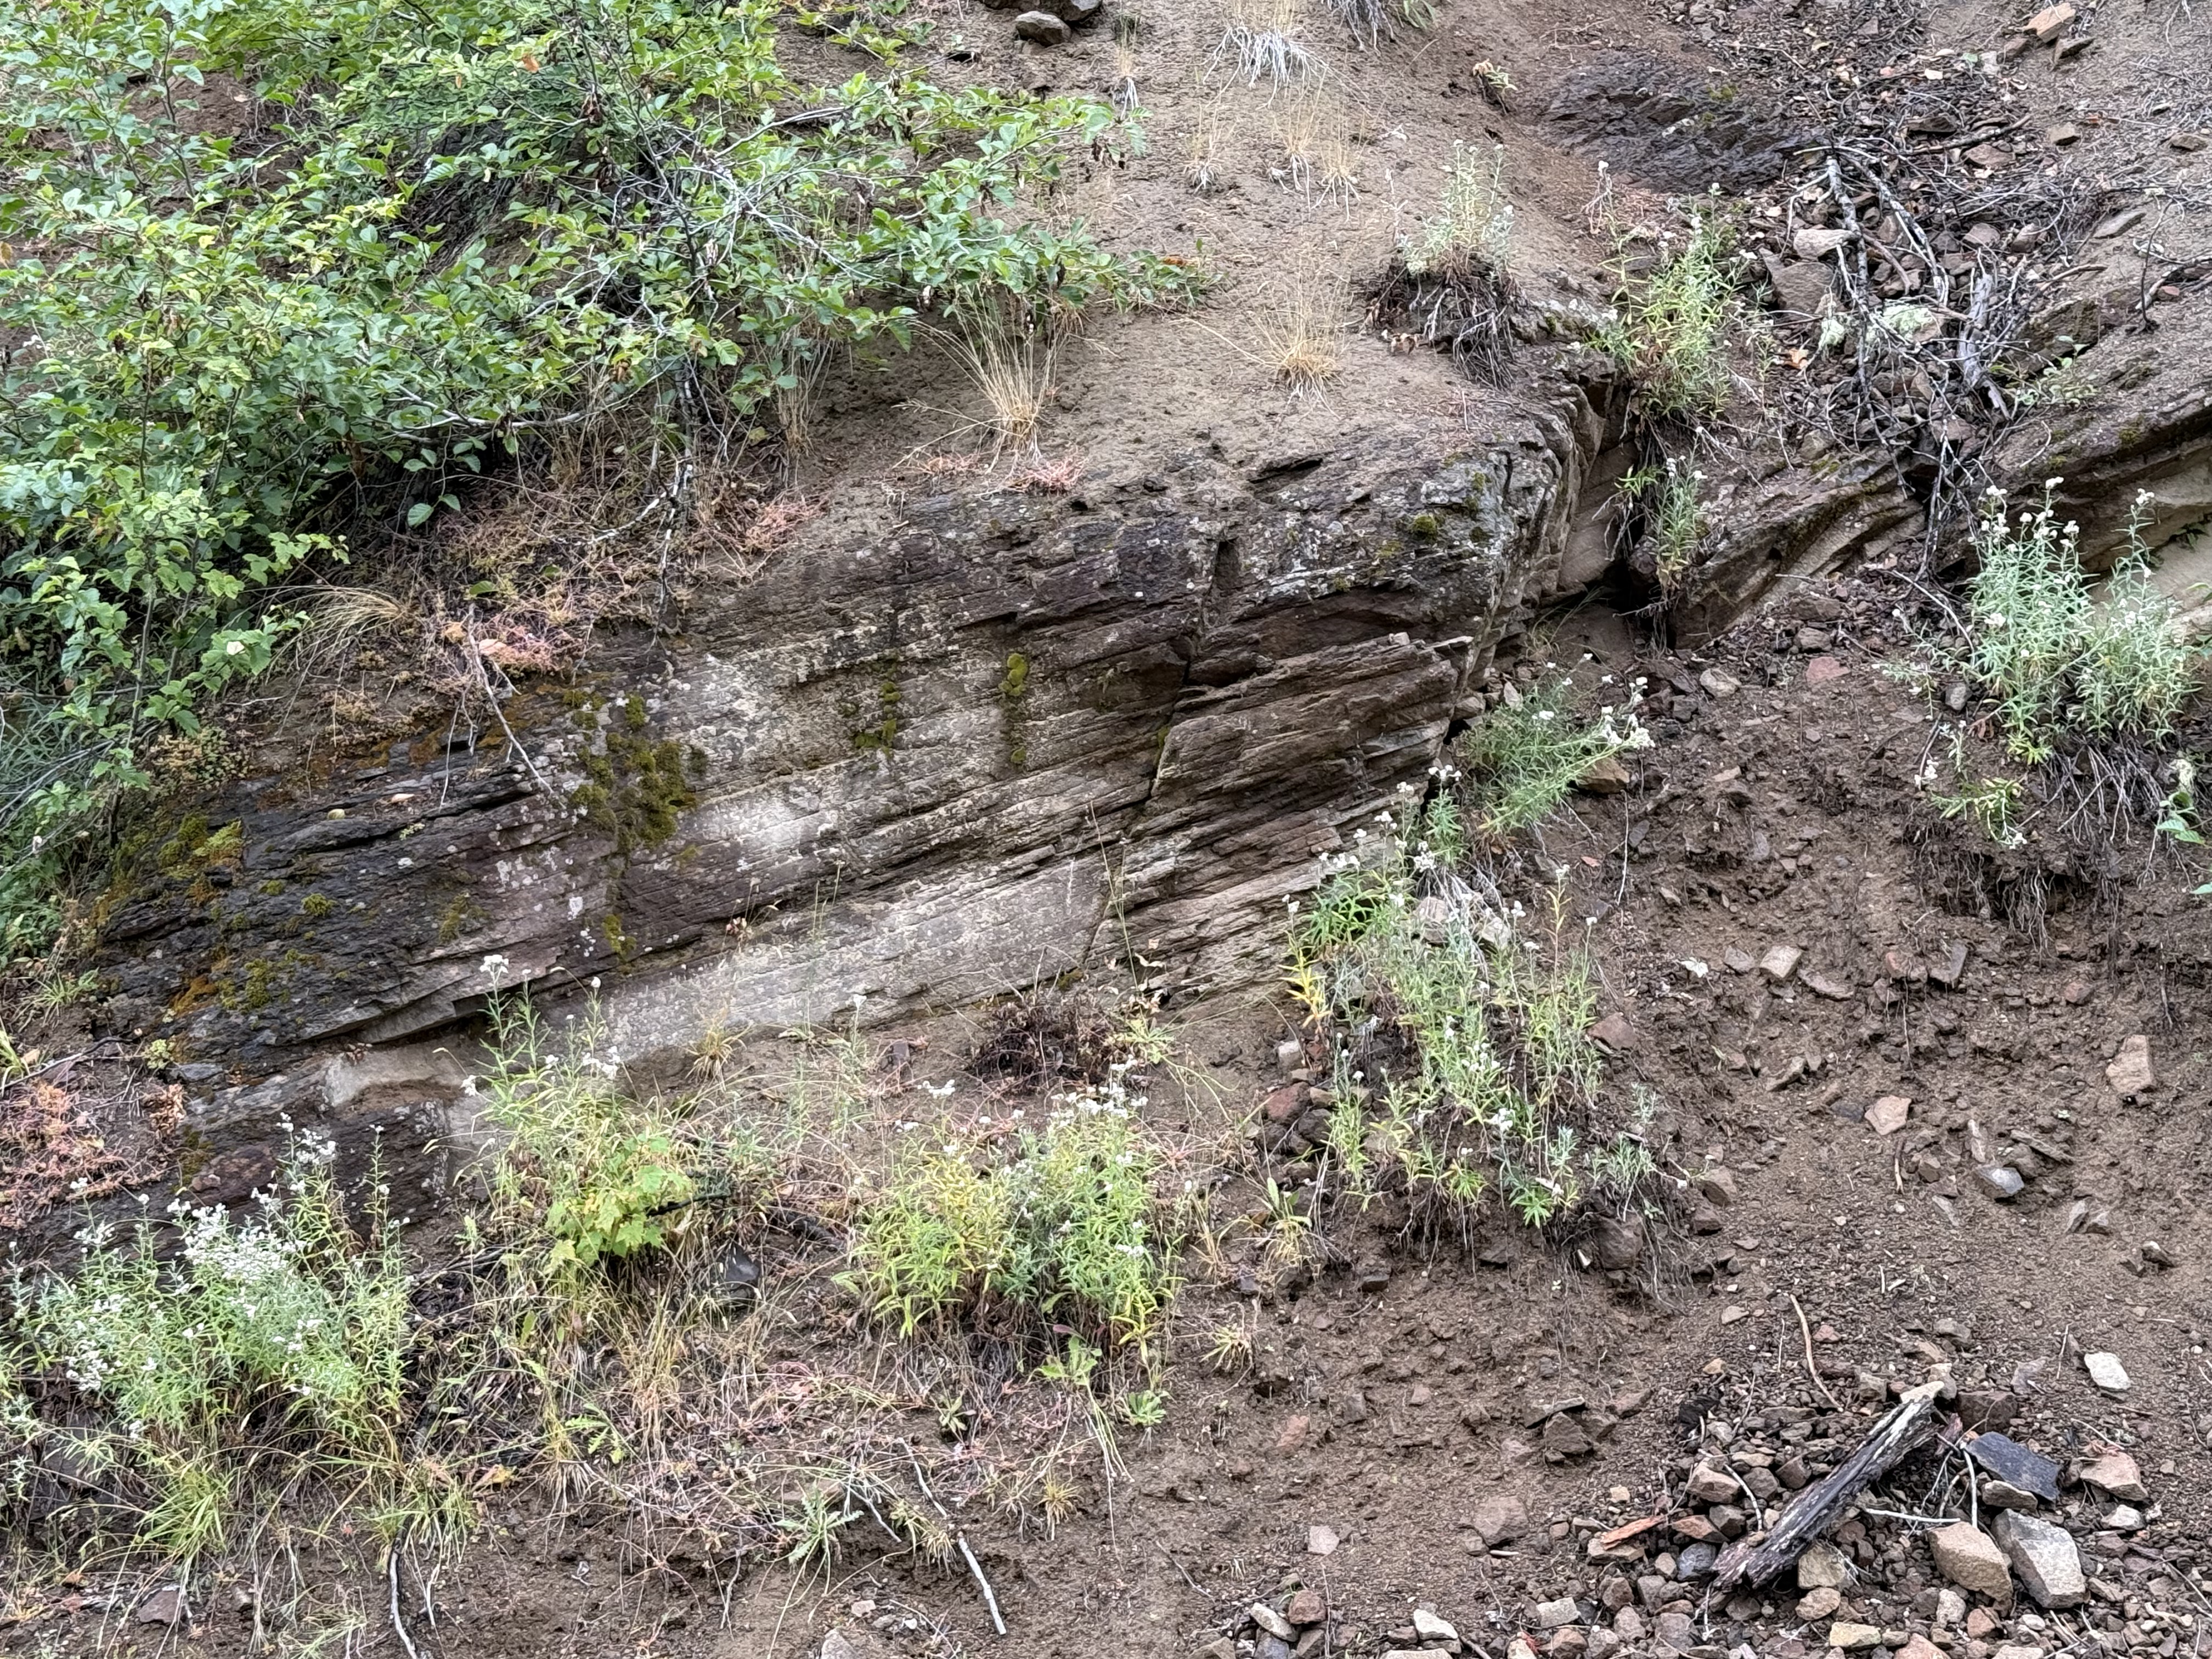
Figure 3. This image shows layers of volcanic ash that are weathering to reveal how thin the laminae are.
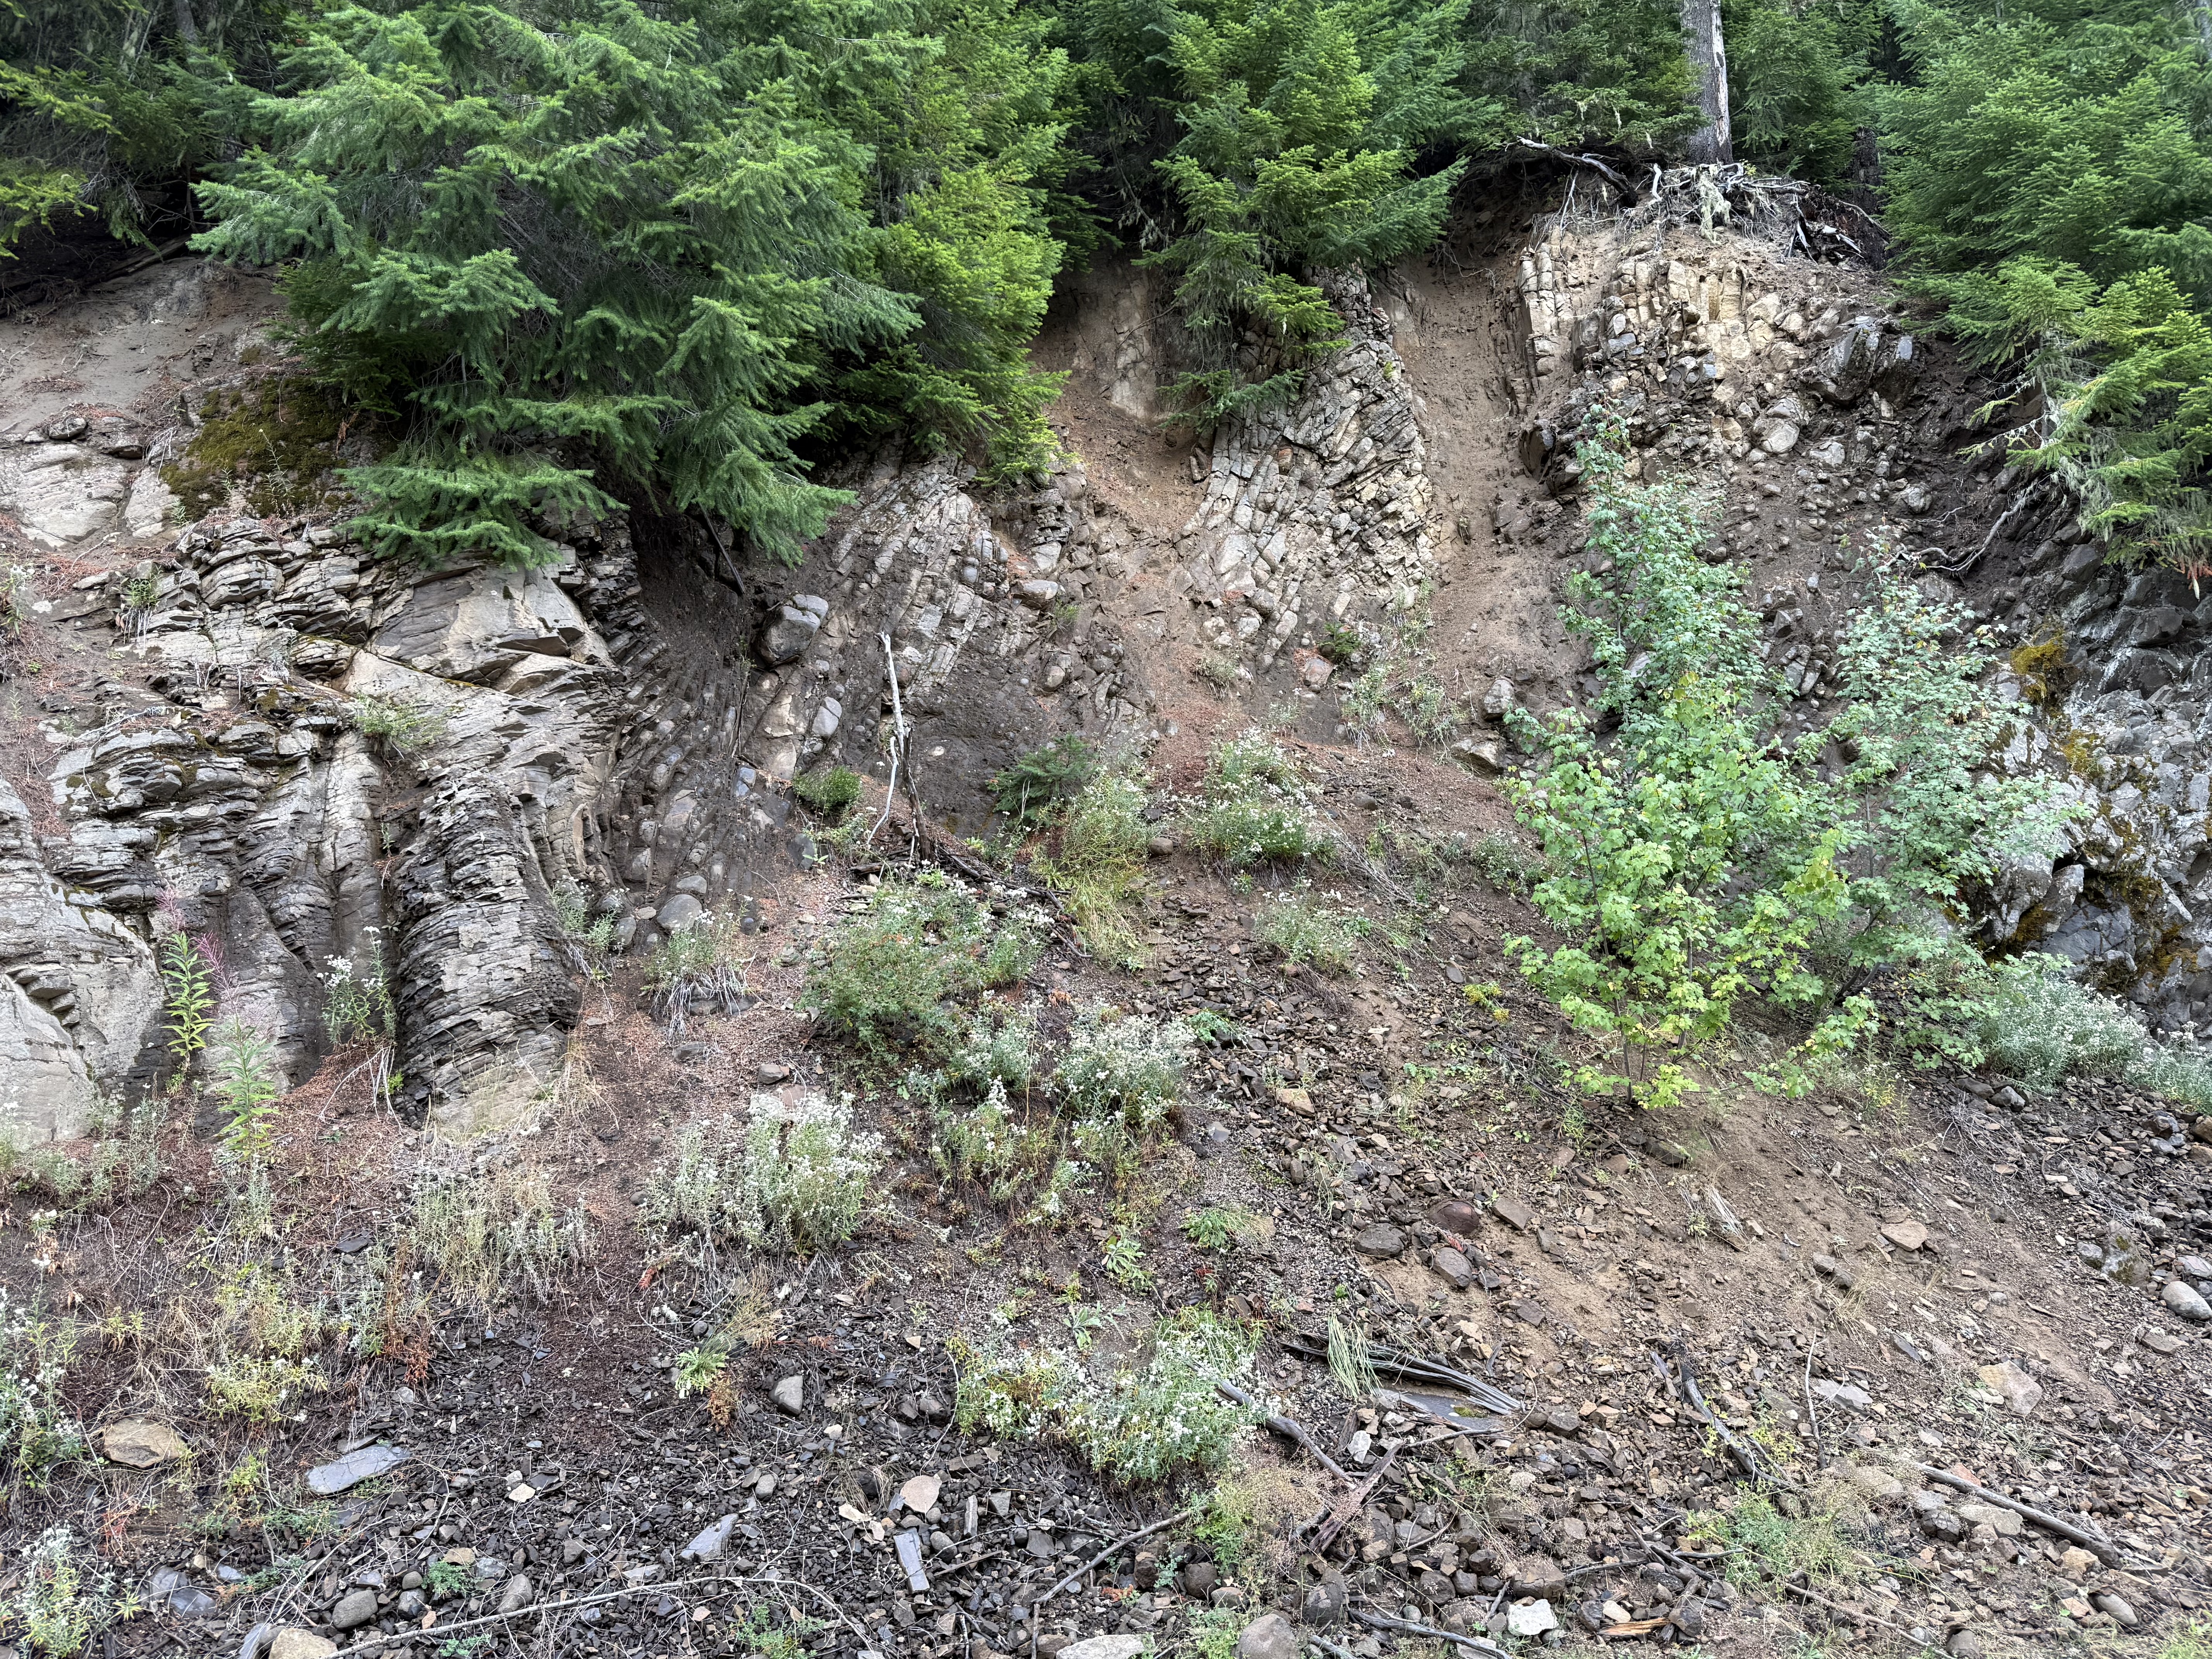
Figure 4. This photo dramatically reveals how much can happen in 10-20 my (million years). It was taken a few hundred yards from the previous photo. To the left are layers of ash that dip away from the camera–juxtaposed with steeply dipping layers that curve to the right and become almost horizontal (in the plane of the image) in the upper-right image quadrant.
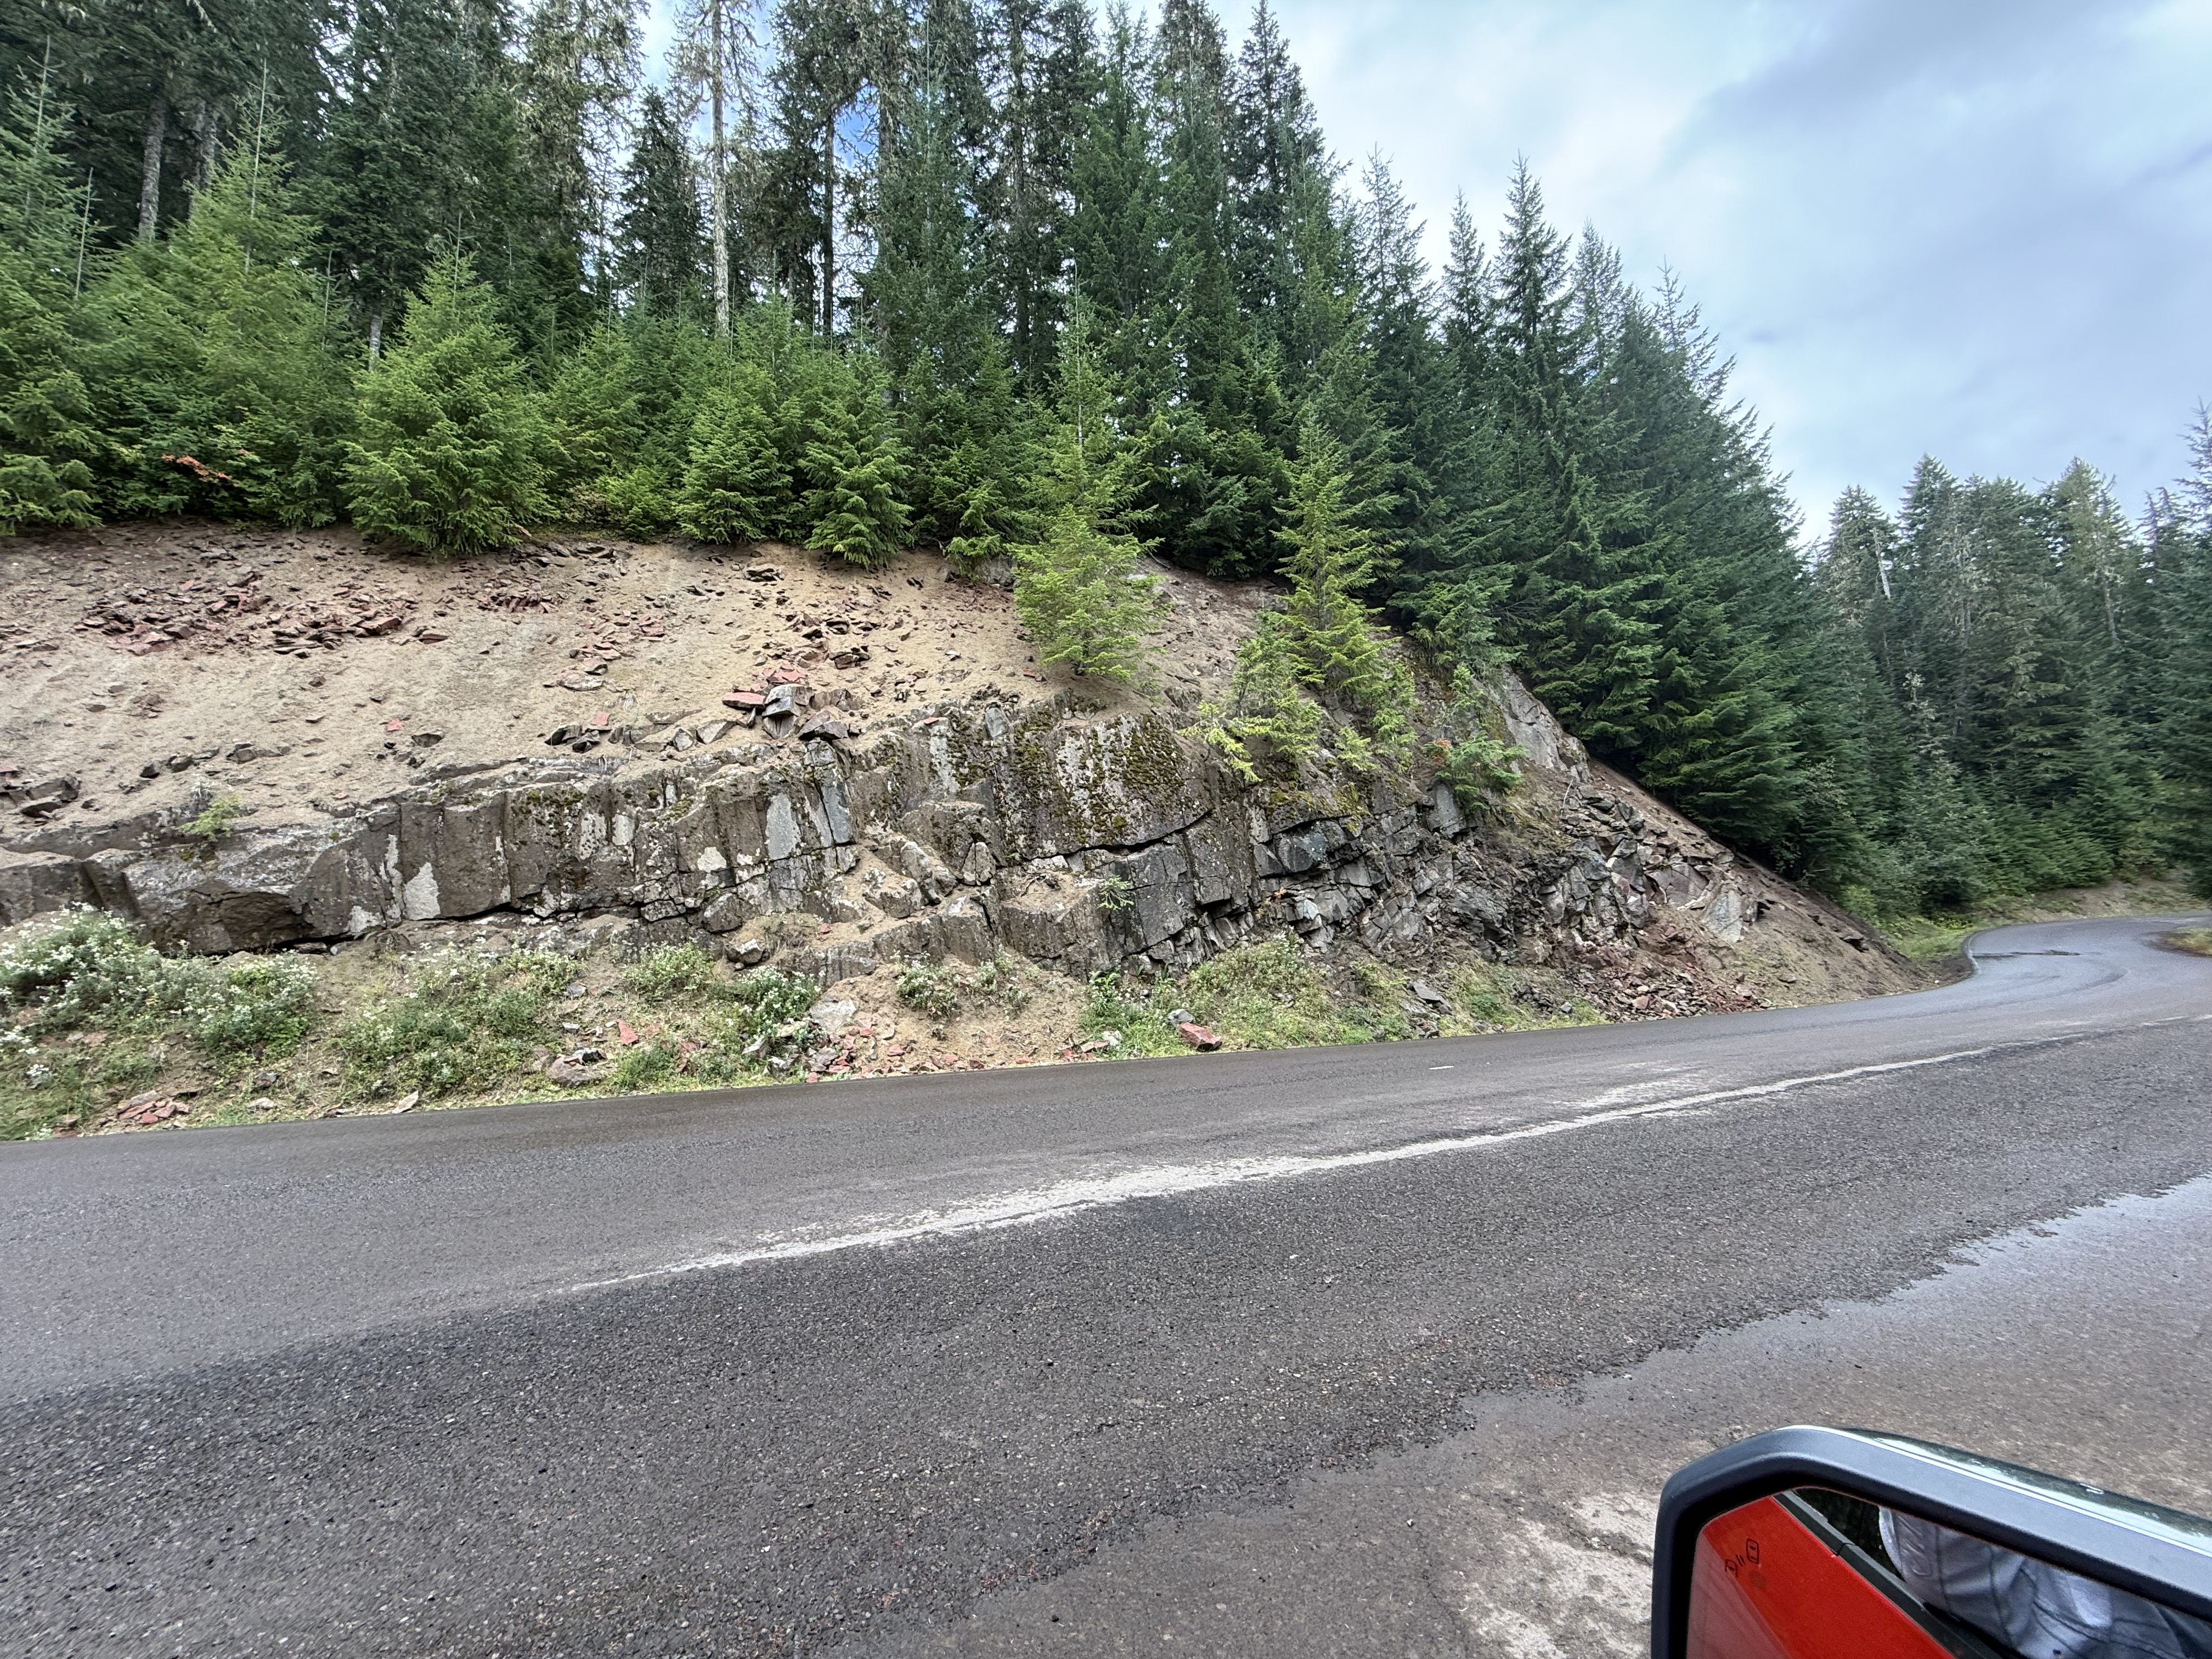
Figure 5. This image, taken less than a mile from Fig. 4, reveals thick layers of ash and flows. I didn’t examine them closely, but the middle-right of the photo shows a substantial change in bedding.
Final Thoughts
Mount Saint Helens is part of the Cascades range, an elongate series of volcanoes that have been active for the last 60 my because oceanic crust is being subducted beneath the North American tectonic plate. The rocks we saw today are from an earlier phase of volcanism; they were buried to depths of several miles, deep enough to become cemented, but not deep enough to become ductile. Thus, they failed in brittle fracture as they were compressed by the huge pile of volcaniclastic rocks created along the ocean margin.
What comes up must go down. This simple phrase means that the earth’s upper mantle (including the subducting ocean plate) melted and produced a lot of magma, which rose because of its lower density and high pressure, filling every fracture, expanding them into magma chambers. The mantle collapsed because of these voids and the weight of the recently extruded magma. A balloon being repeatedly inflated and deflated.
Meantime, the compression was inexorable. The recently buried volcanic rocks broke along faults, creating the juxtaposition of volcaniclastic material we see in Fig. 4.
These aren’t geologically old rocks. This is a continuous process that we are able to witness in real time throughout the world.
We’ll see this continuous process in closer detail with my next post.
Geologic Survey of Eastern Vancouver Island, British Columbia

Figure 1. View looking west along the coast from Beacon Hill, in Victoria. The cliffs on Vancouver Island are similar in height to those across Juan de Fuca Strait, in Washington. However, the bluffs are composed of glacial deposits further south in Seattle, rather than bedrock. The large tidal range (7-10 feet) exposes rocky platforms at low tide. I’ll examine several of these features in this post.
Introduction
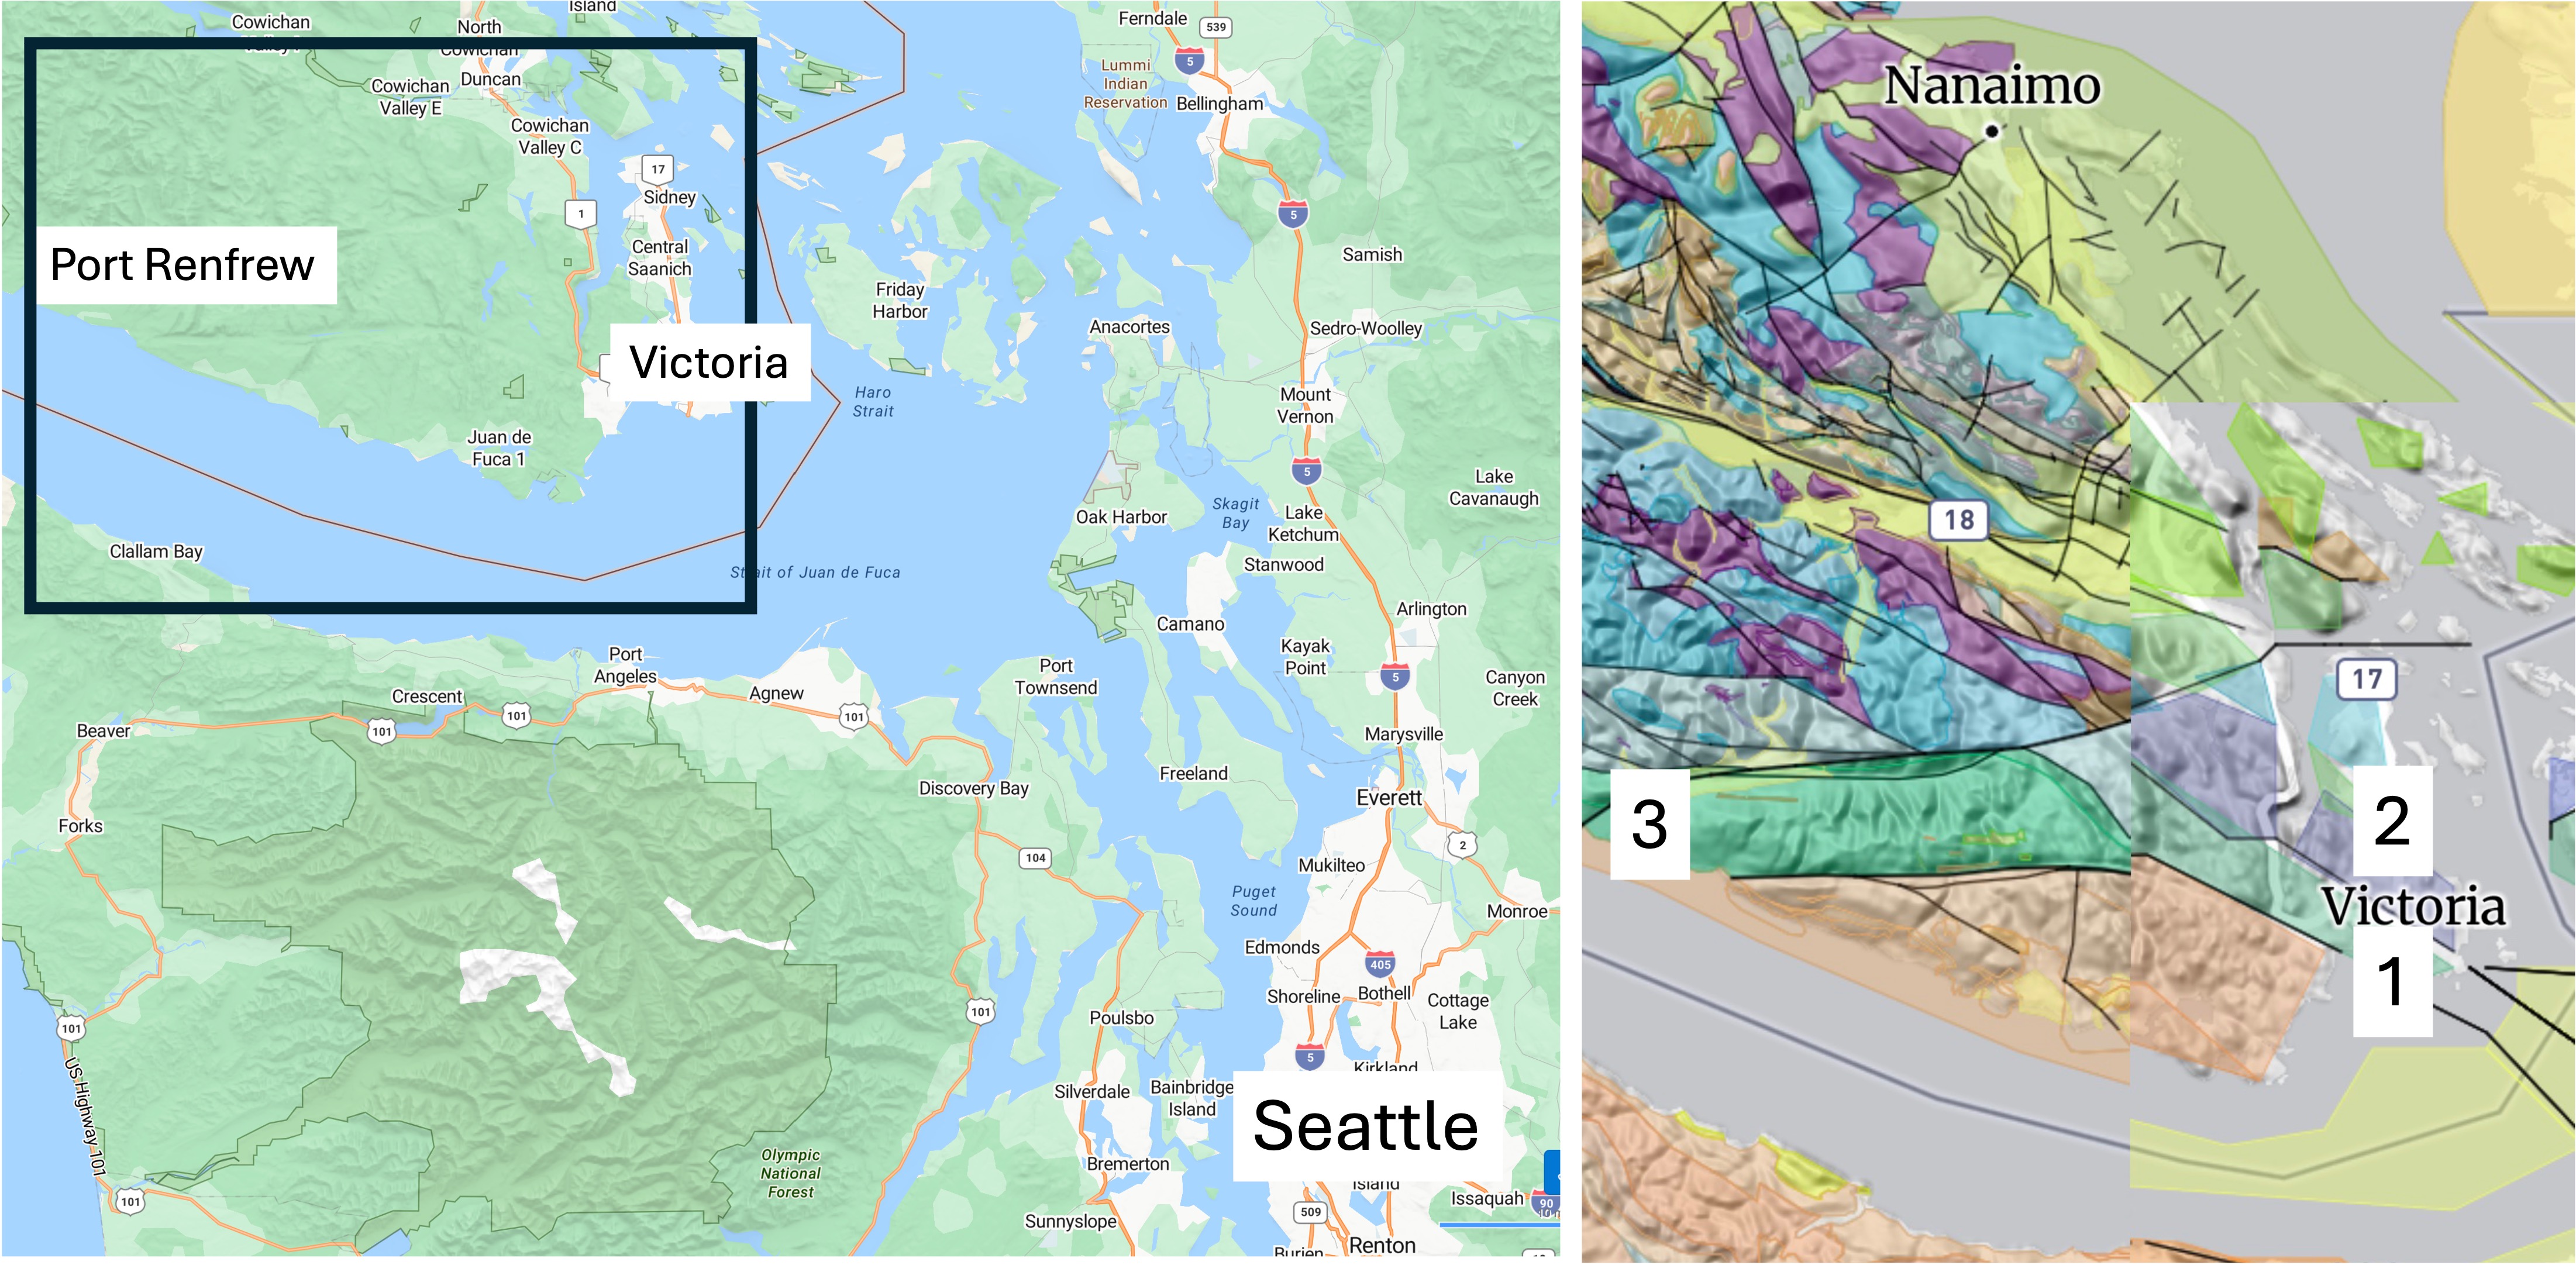
Figure 2. We drove to Port Angeles on the Olympic Peninsula and took a ferry to Victoria. We also drove about 70 miles west to Port Renfrew. The inset geologic map reveals a maze of faults and rock types. The rocks around Victoria comprise the Westcoast Crystalline Complex, which includes granitic and metamorphic rocks dated between 540 and 143 Ma (colored green). The purple area indicates a suite of granitic intrusions from the Jurassic period (200-160 Ma). The numbers indicate locations discussed below: (1) Beacon Hill; (2) Mount Douglas; and (3) Port Renfrew.
Beacon Hill
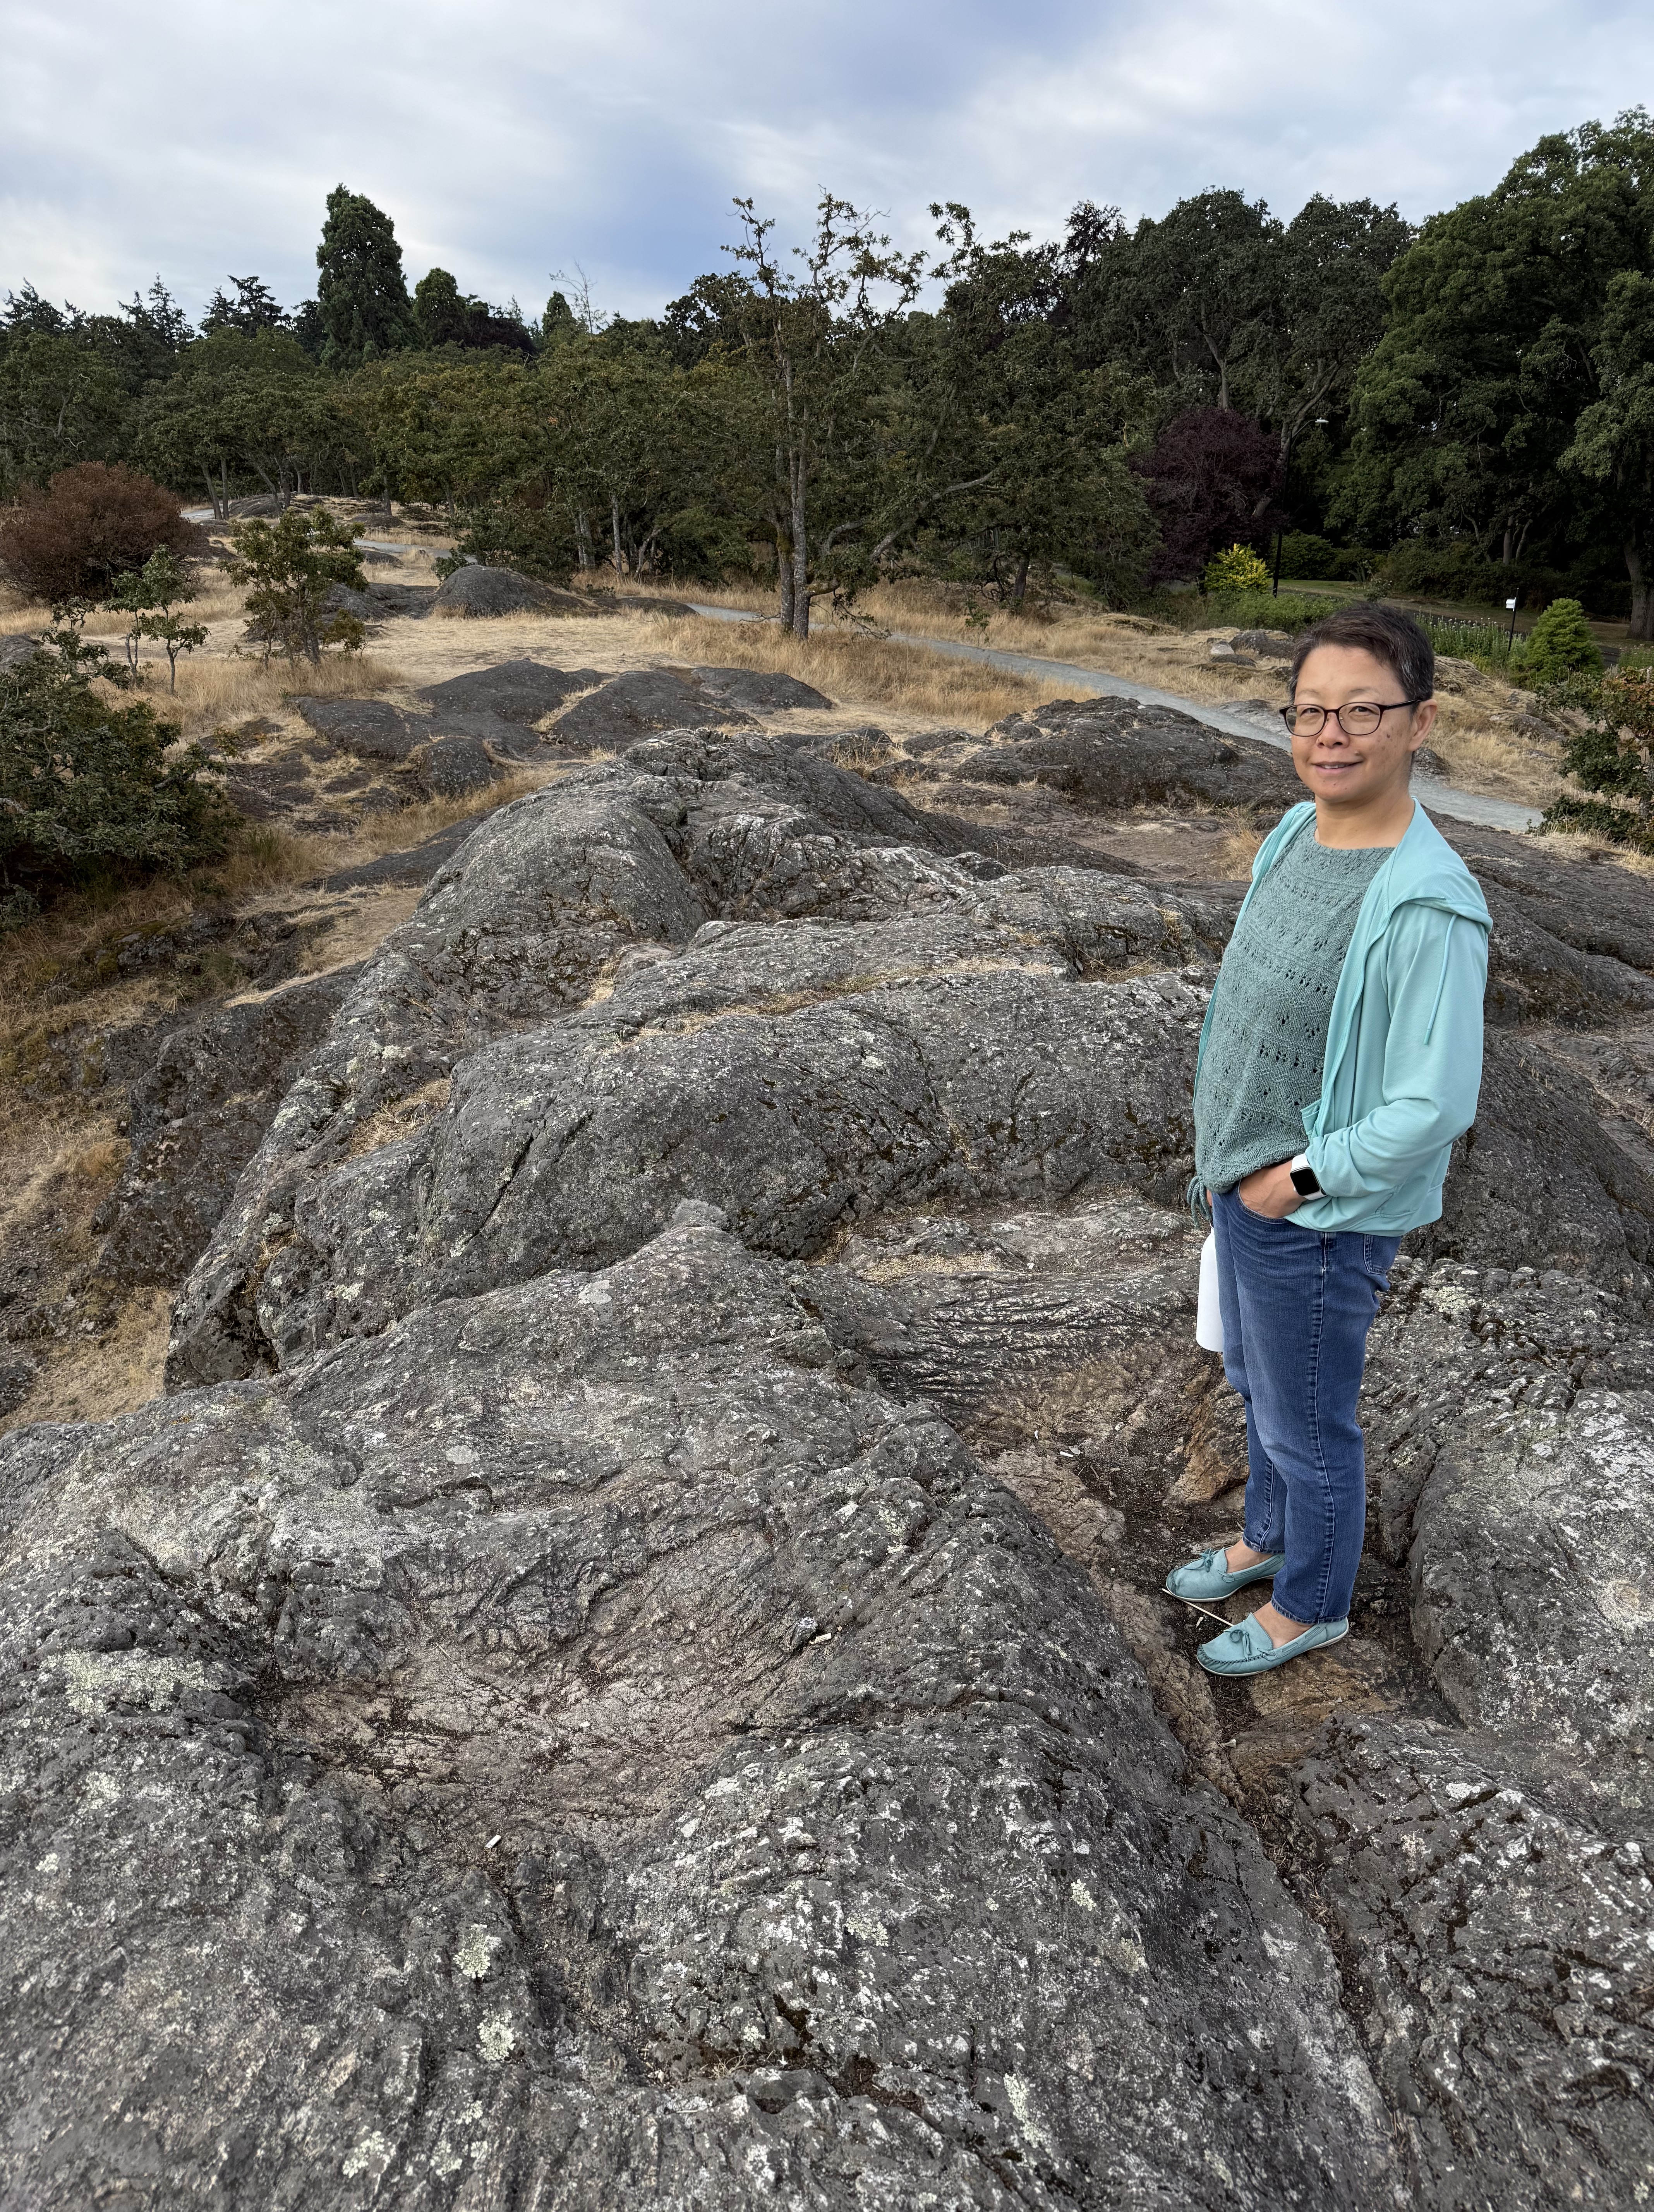
Figure 3. This exposure of the Westcoast Crystalline Complex at Beacon Hill Park doesn’t tell us much. These rocks are weathered and stained, making identification difficult without breaking off a fresh piece. We don’t do that here at Rocks and (no) Roads. Nevertheless, I am relatively confident that they are not sedimentary rocks.
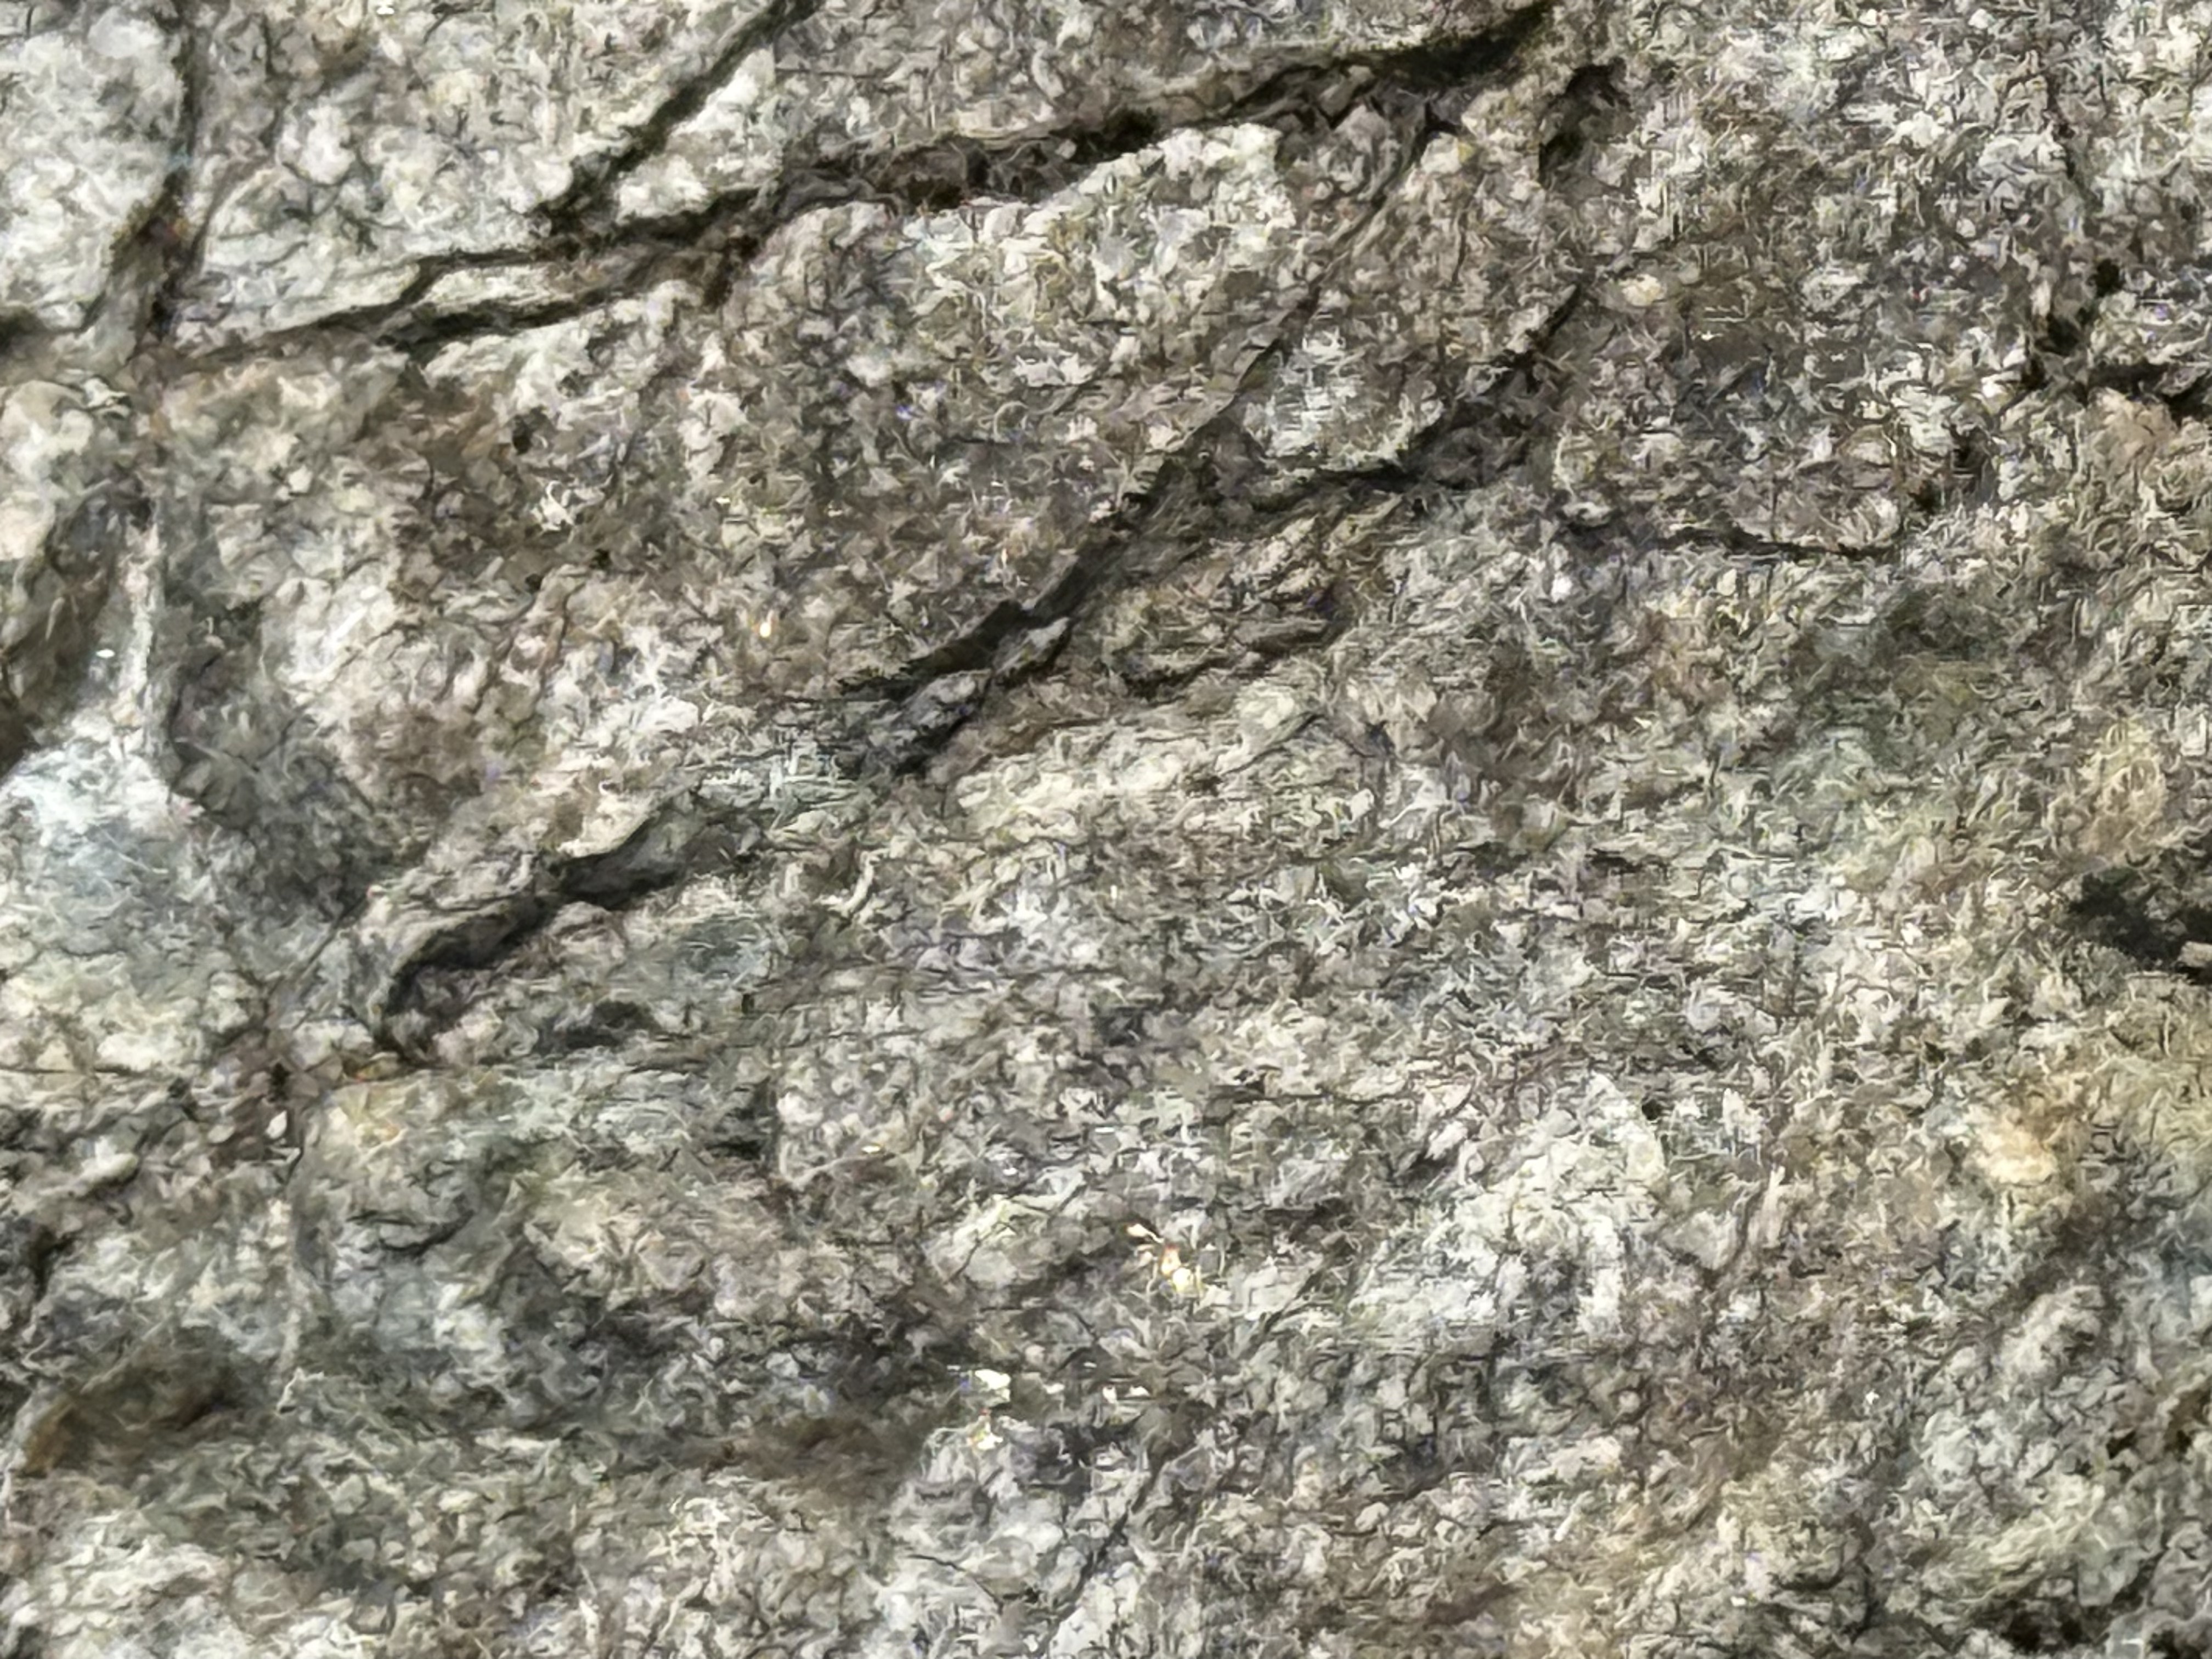
Figure 4. This photo uses a magnification of 10x, and the field of view is less than an inch. Individual crystals of feldspar can be seen throughout the image, recognizable by flat surfaces that form irregular boxes. These light-colored feldspars are indicative of continental intrusive rocks like you would find in a subduction tectonic environment. The gray blobs are quartz. Based on this brief examination, I think these are granodiorite, an intrusive rock rather than metamorphic.
Mount Douglas
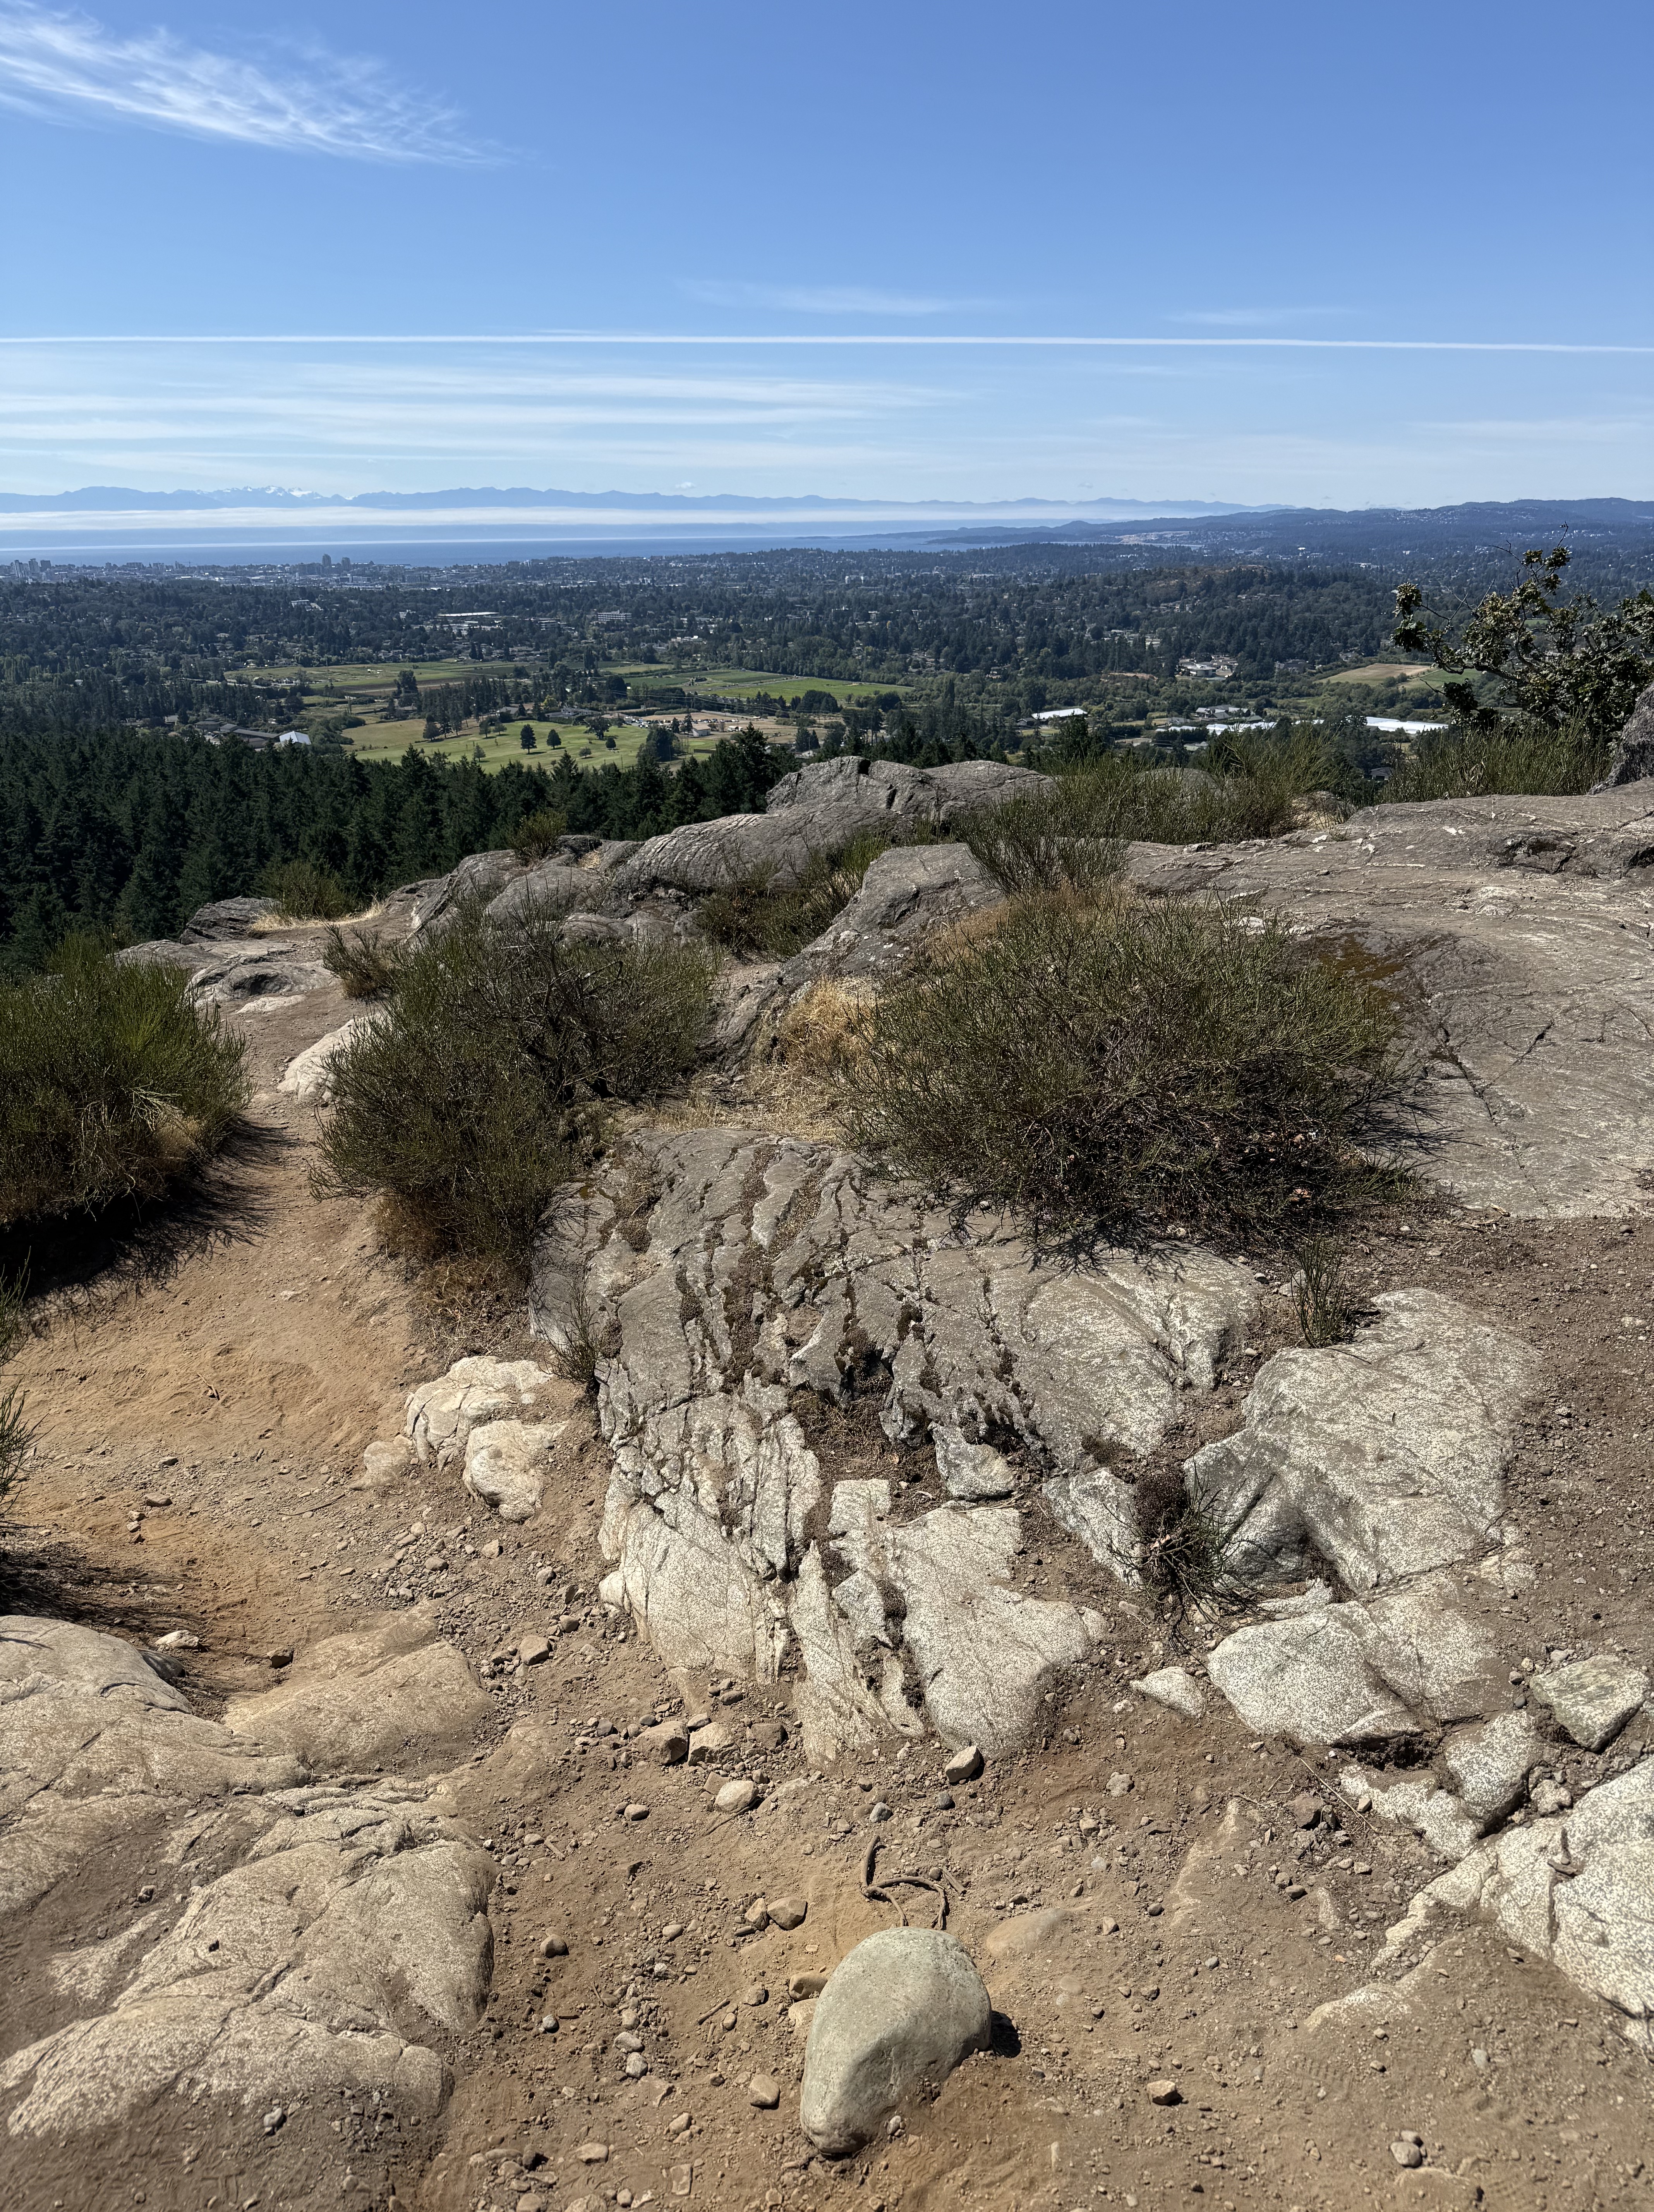
Figure 5. The view, looking south from the top of Mount Douglas (see Fig. 2 for location), reveals Mount Olympus (snow-covered peaks in the distance); and intrusive rocks with the characteristic salt-and-pepper color of granodiorite. This exposure also contains a set of joints (large X pattern enhanced by weathering) that would have appeared as the rock rose through the crust as overlying rocks were eroded. Victoria is visible in the distance.
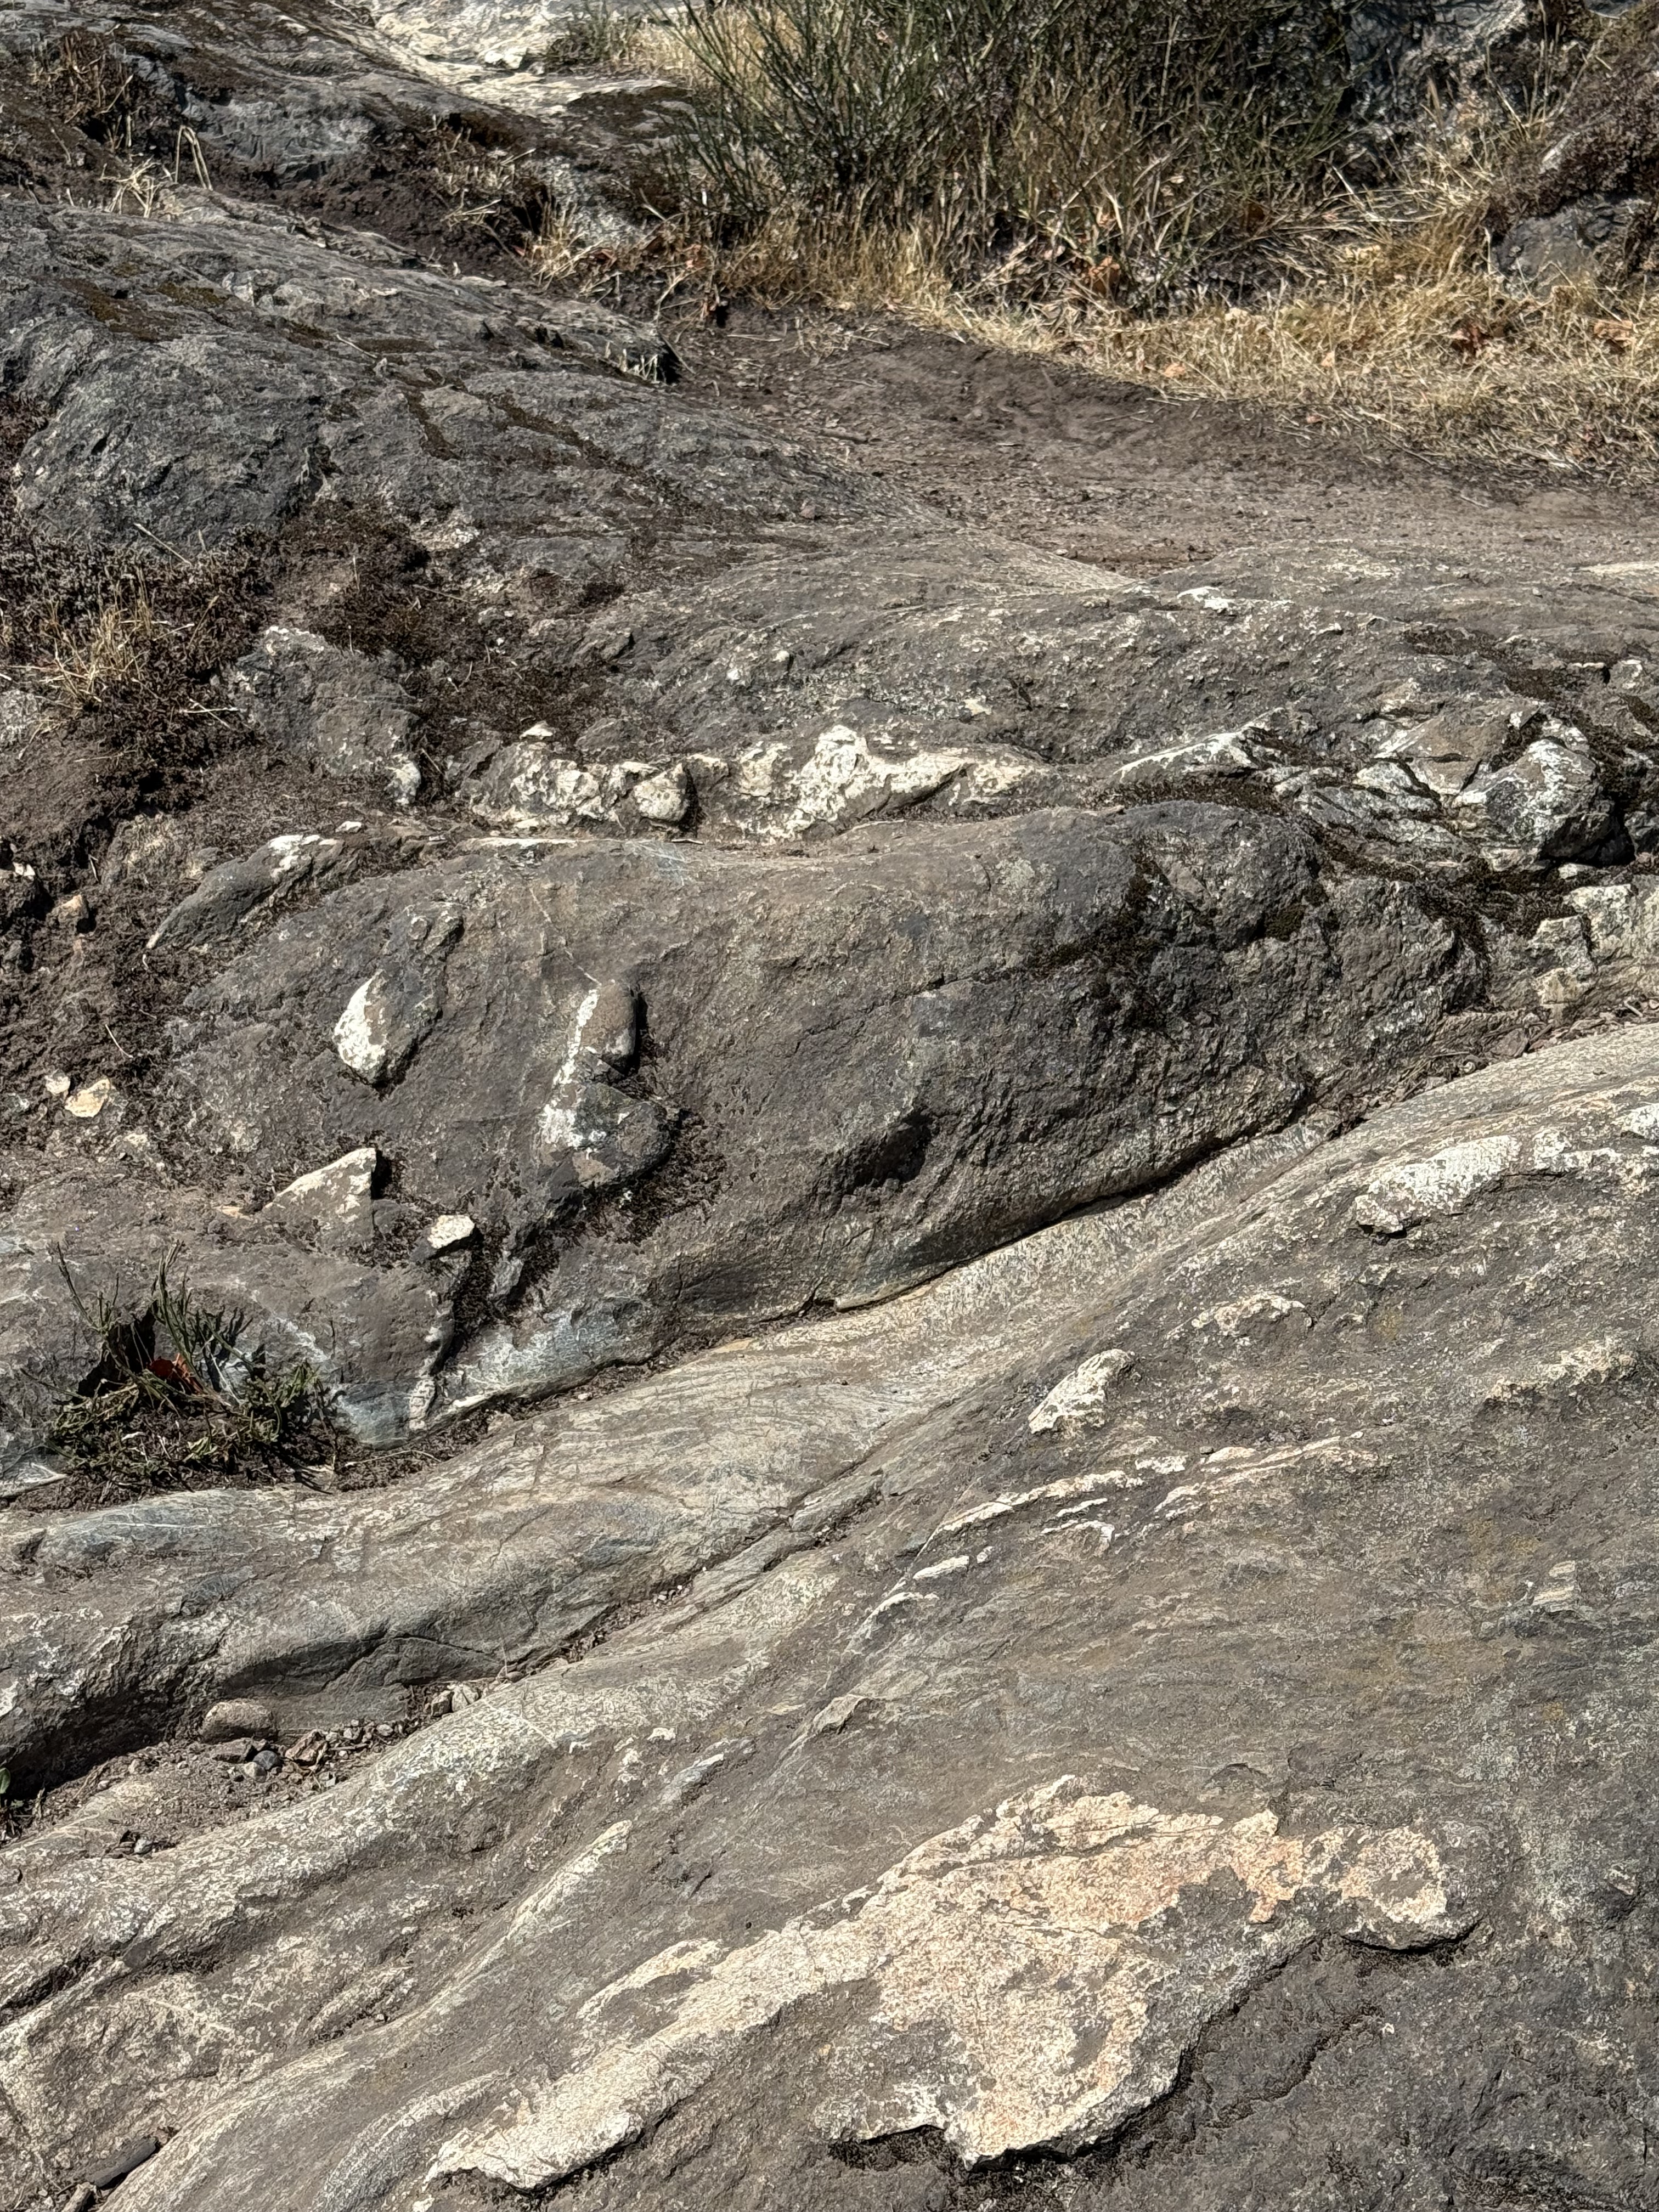
Figure 6. This image shows veins of quartz or feldspar (white material) that would have filled cracks and voids after the main magma had solidified (tens of miles deep), but residual liquids were still present.
Port Renfrew
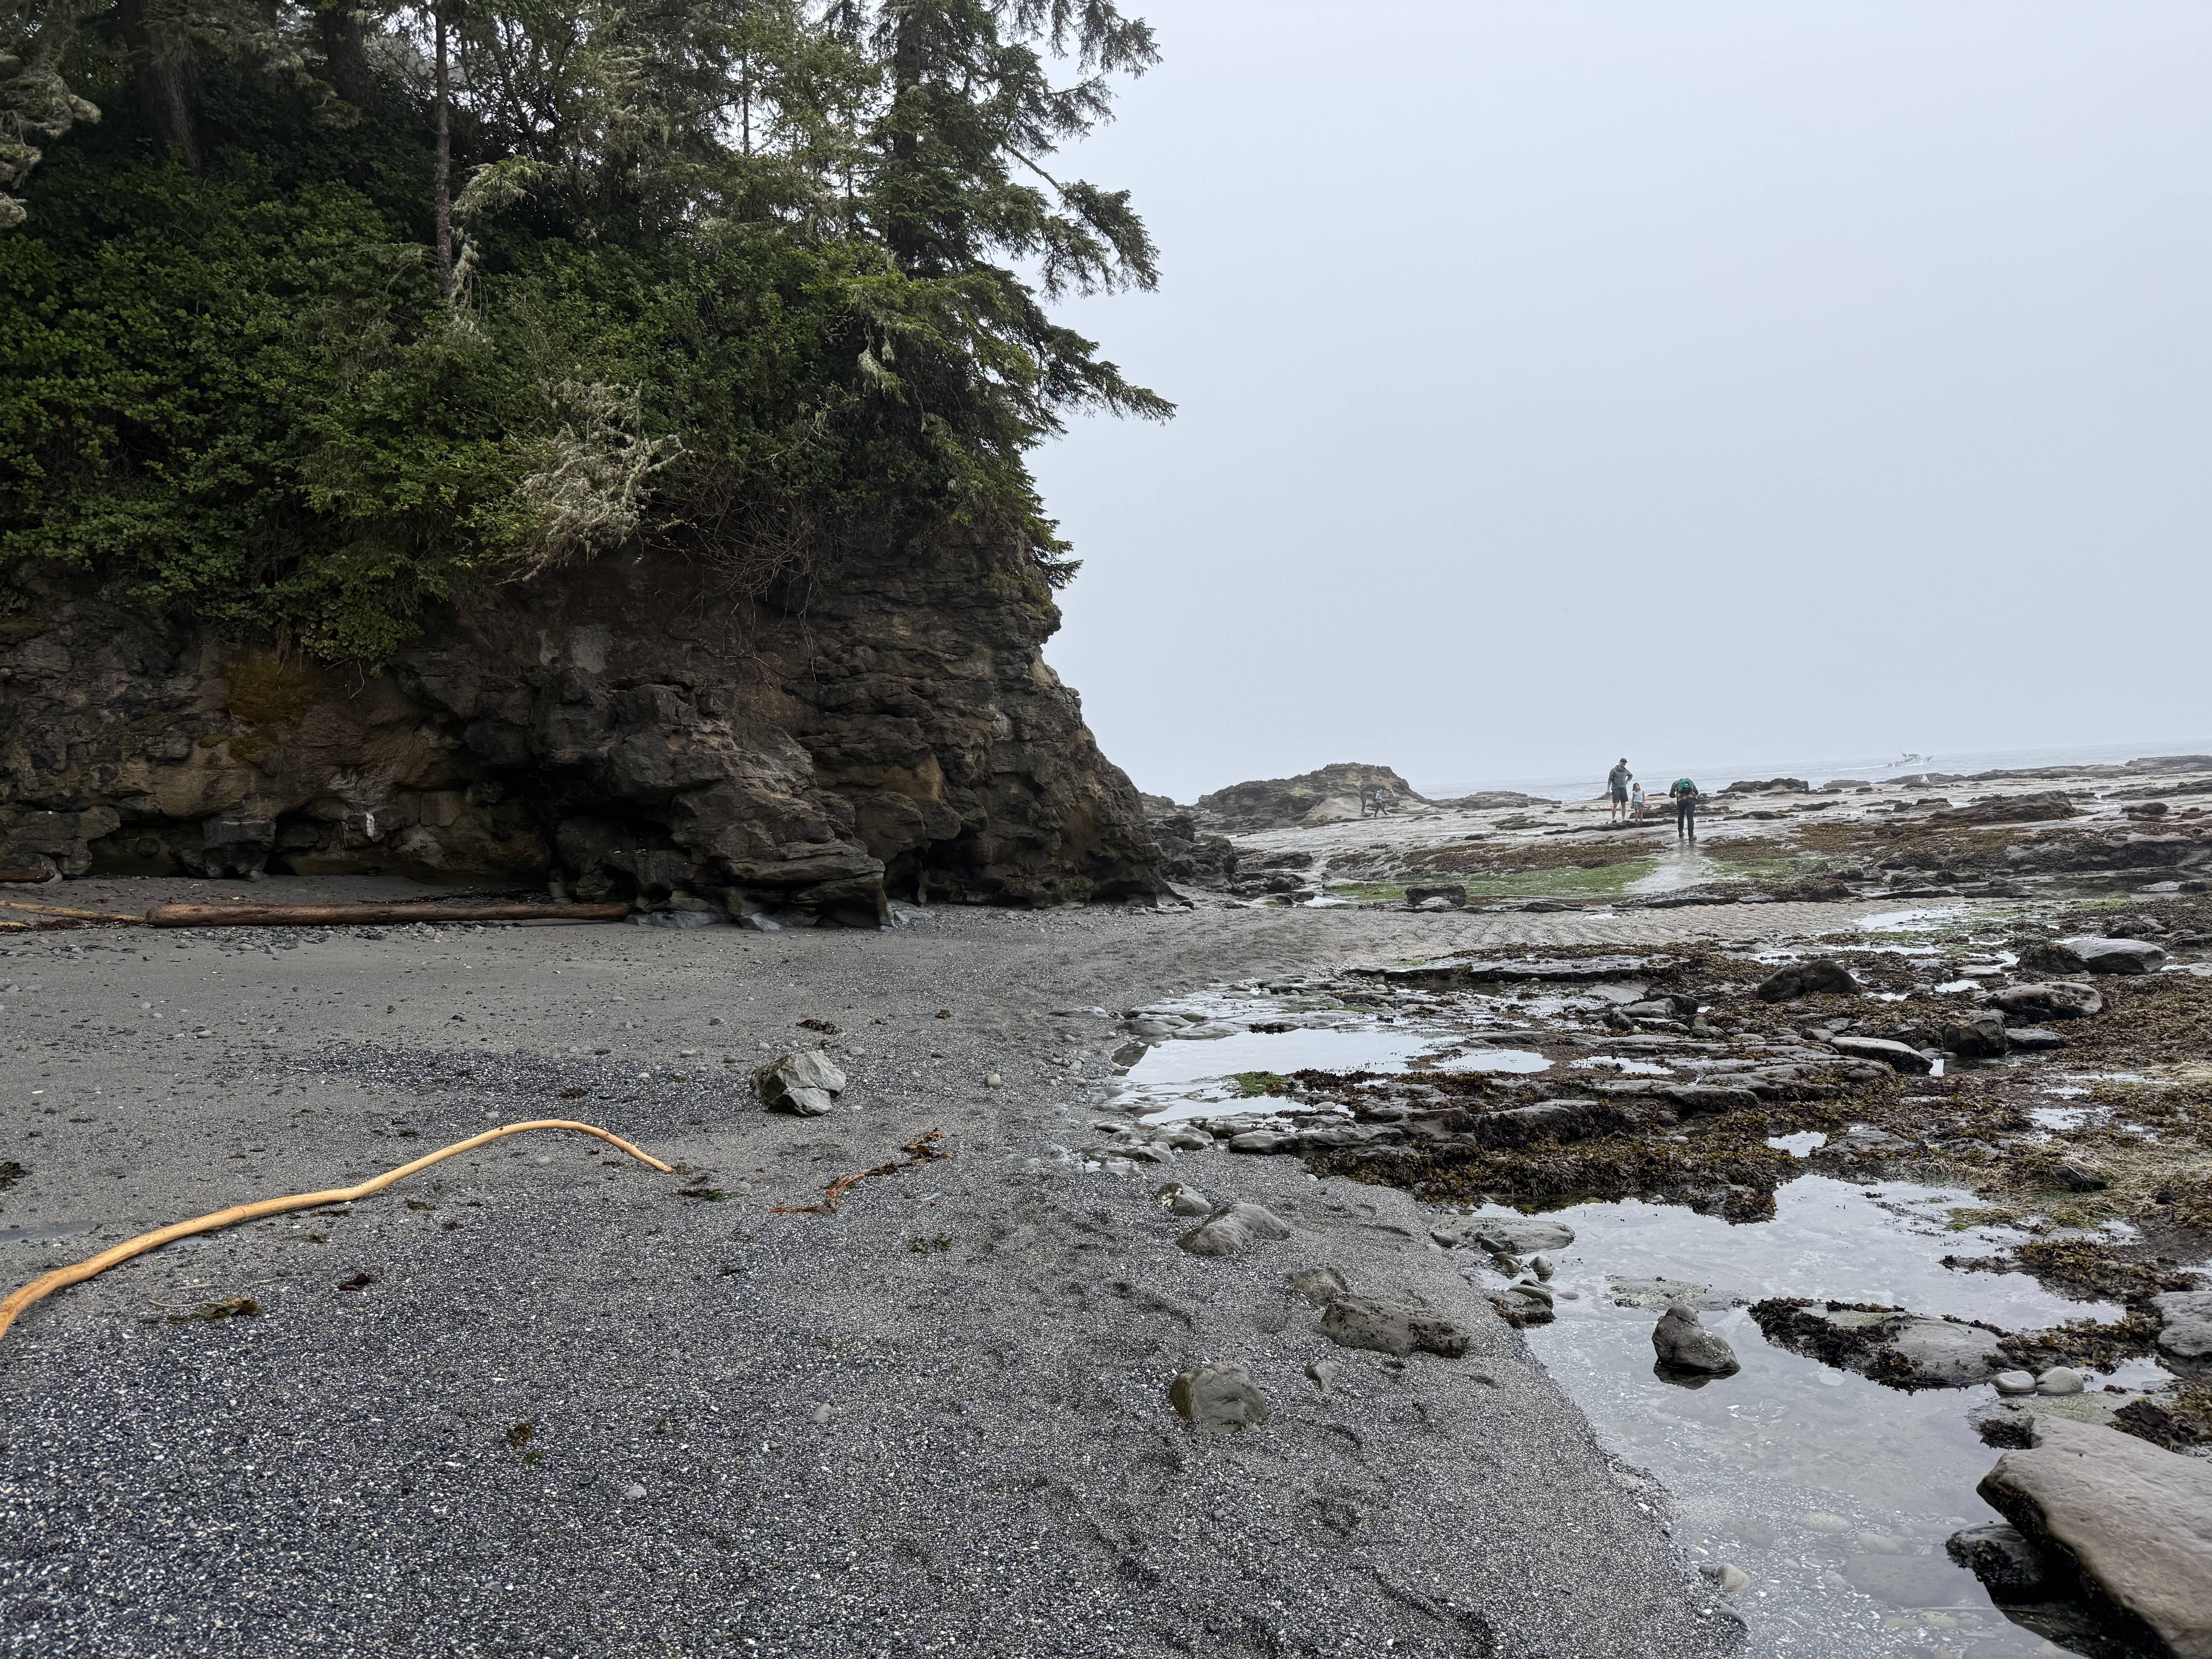
Figure 7. The cliffs at Port Renfrew are lower than in Victoria (compare to Fig. 1). They also don’t appear to be the same intrusive rocks we saw at Beacon Hill Park or Mount Douglas. The beach is covered with boulders and dark, coarse sand that couldn’t have originated from the erosion of granitic rocks. Let’s take a closer look.
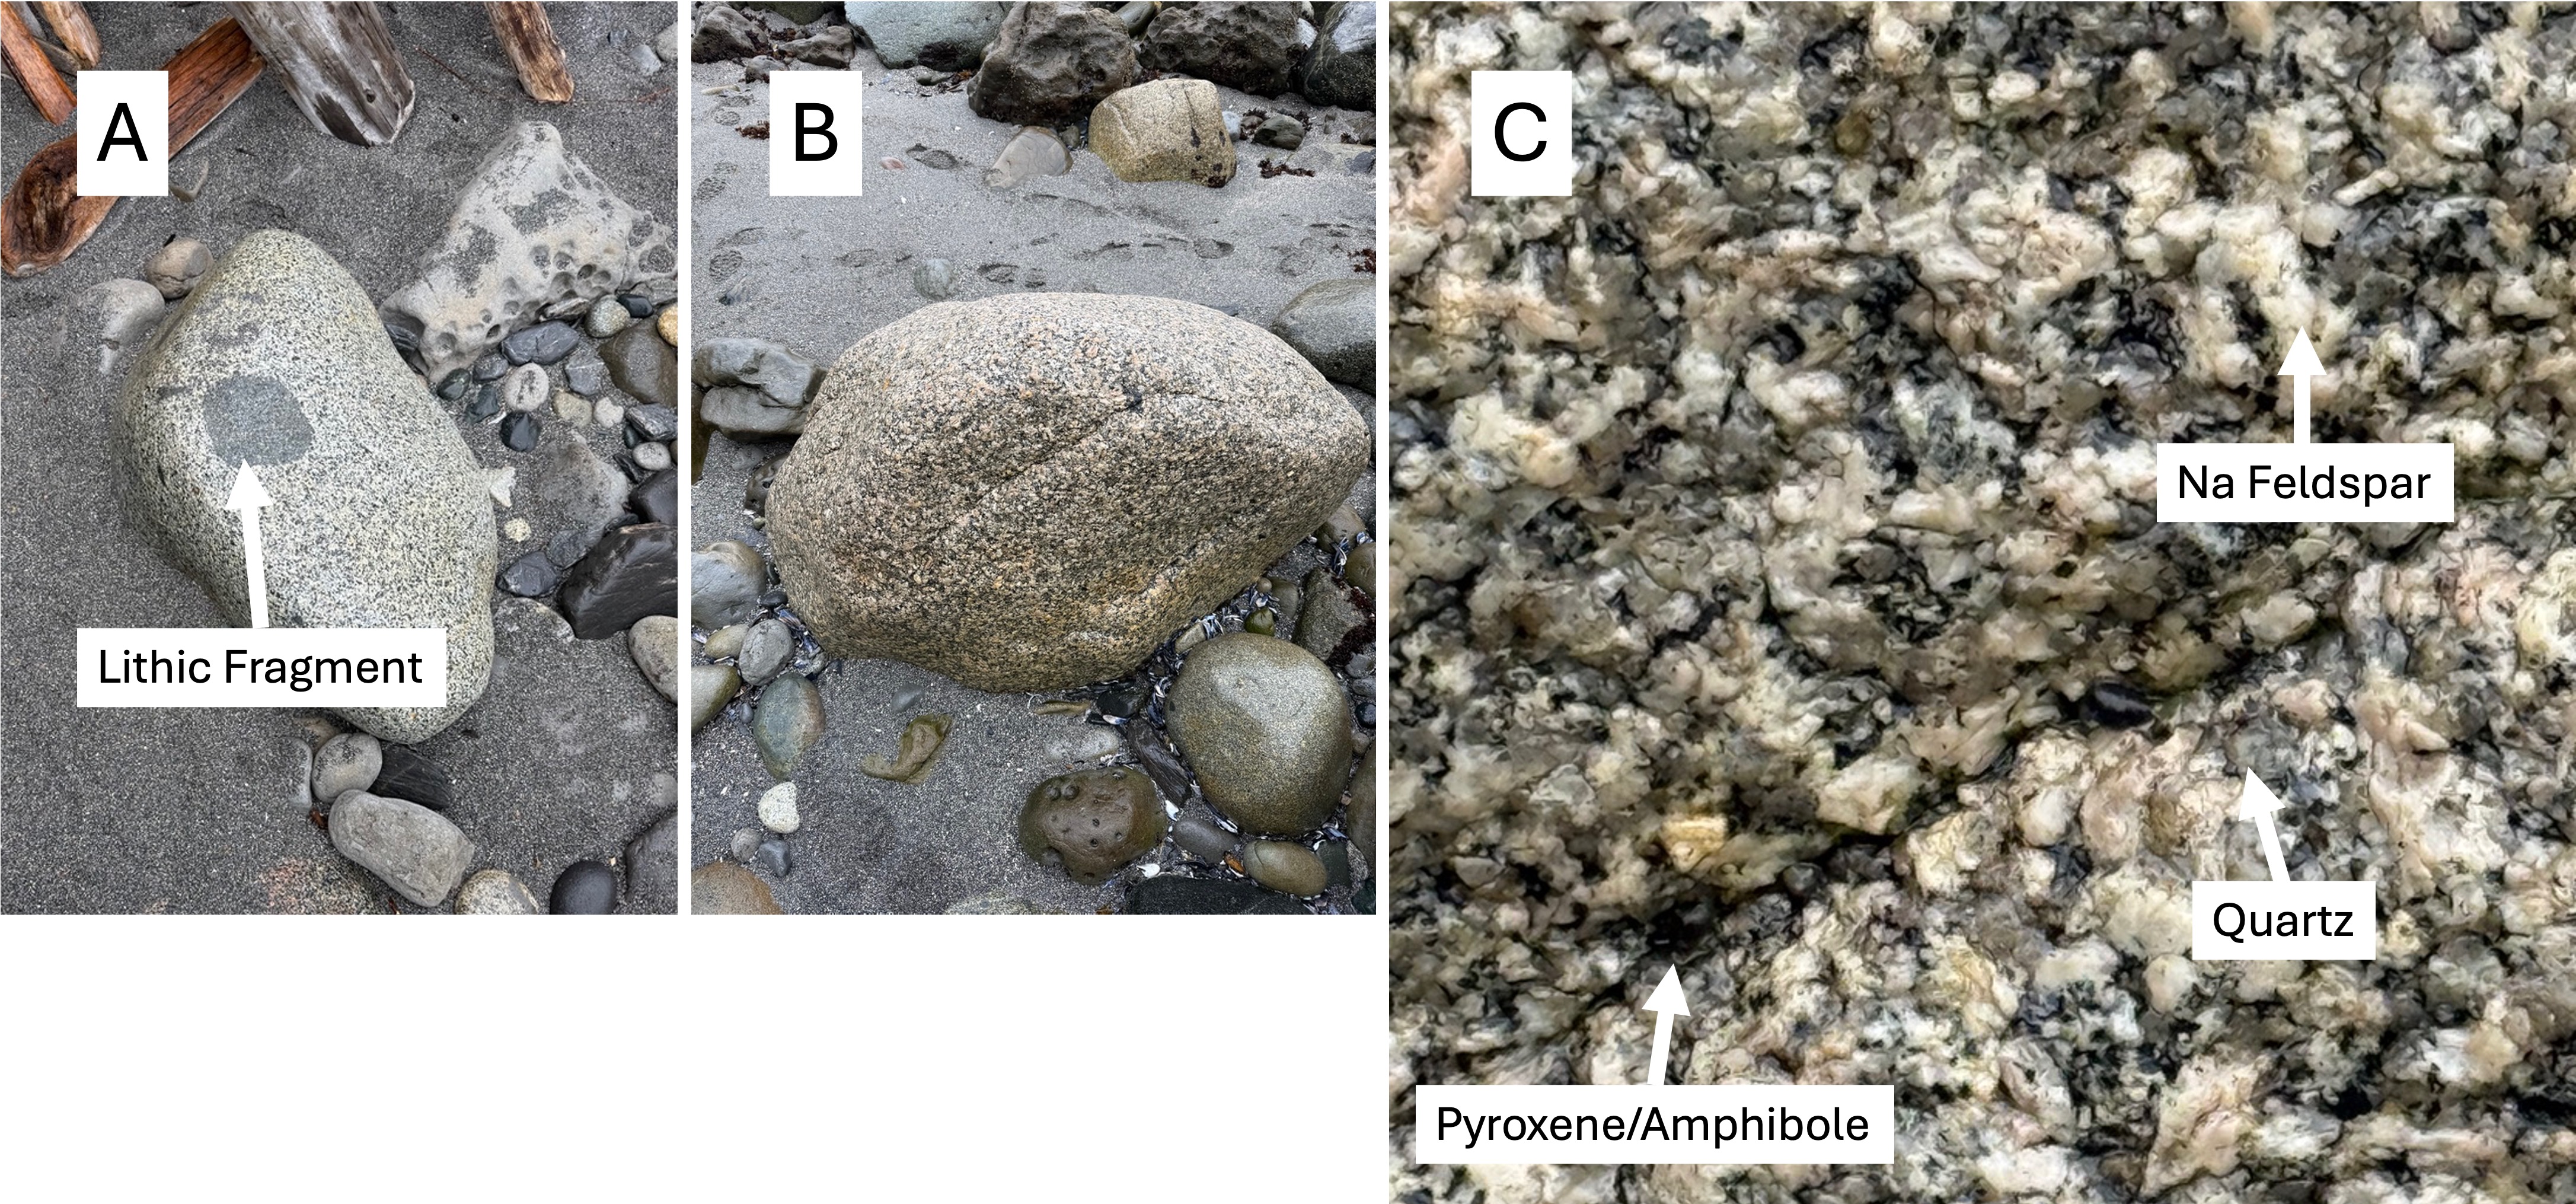
Figure 8. (A) This boulder includes a piece of the rock the magma was intruded into. The rounded edges suggest that the magma was still hot enough to partially melt the fragment; furthermore, the lack of a halo surrounding the inclusion implies that the melted material was incorporated into the magma by mixing. (B) This looks a lot like the granitic rocks in Fig. 5. (C) This boulder is fresh and individual minerals can be identified. Being wet enhances the contrast. The low quartz composition (I estimate it at ~20% from the gray blobs) suggests that this is either granodiorite or tonalite, depending on the amount of Ca-bearing feldspar. That requires either a chemical or mineralogical analysis. These boulders were transported along rivers from the center of the island, which is composed of granitic rocks (Fig. 2).

Figure 9. These ripples are almost a foot long, measured from crest to crest; and the troughs are filled with larger fragments of rock and shell. You don’t see these sedimentary structures preserved in the rock record very often, even if they do survive the vigorous tides on Vancouver Island.
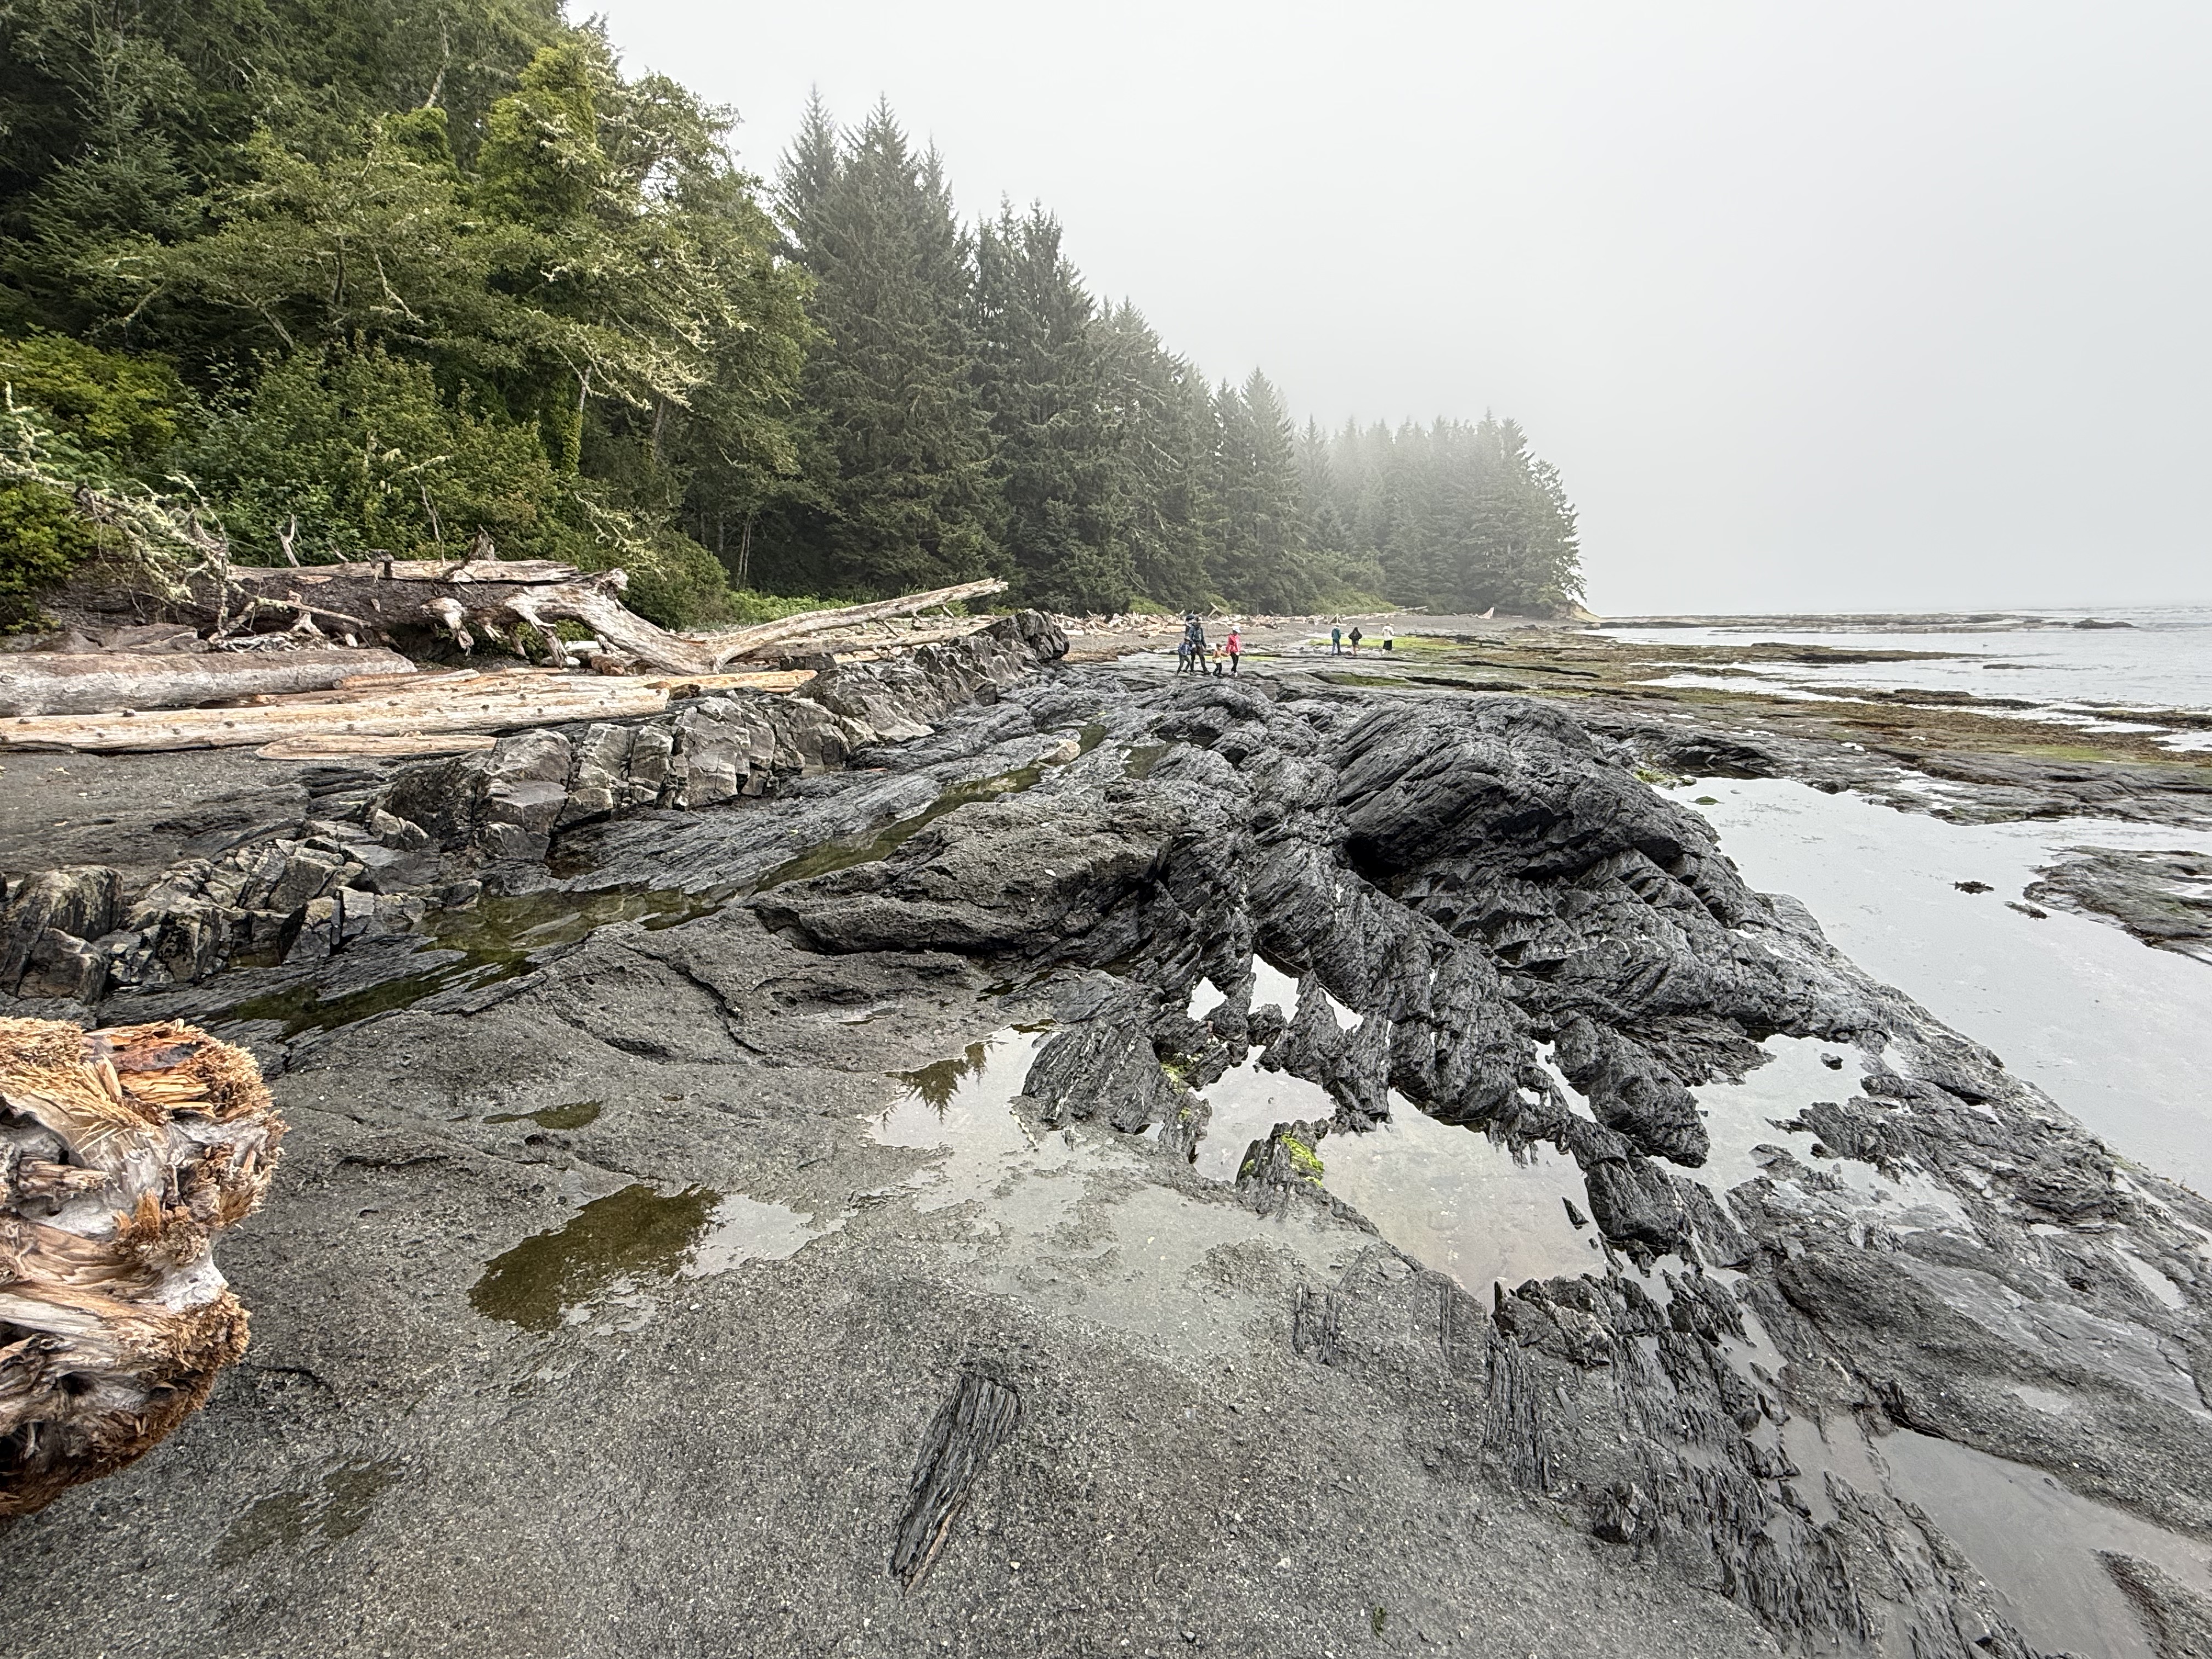
Figure 10. Exposures like this make geology fun. The darker rocks are tilted about 30 degrees to the left, but there are two distinct rocks types here: the lighter colored rock to the left is the same sandstone that makes up the cliff (Fig. 7); and the darker rock is schist, highly altered mudstone. In other words, a mildly altered rock is in direct contact with a metamorphic rock.
I checked with RockD, which integrates a global geologic map with location, and discovered I was standing on the contact between Leech River Complex metamorphic rocks (200-66 Ma) and Carmanah Group unaltered sedimentary rocks (37-23 Ma). This is a textbook unconformity that represents at least 29 million years.
The younger rocks are nearly horizontal, so I think this is an angular unconformity. During the missing millions of years, the older sediments were buried and heated enough to create schist; then uplifted and exposed to the sea, whereupon the younger rocks were deposited on a beach not that different from what we see today.
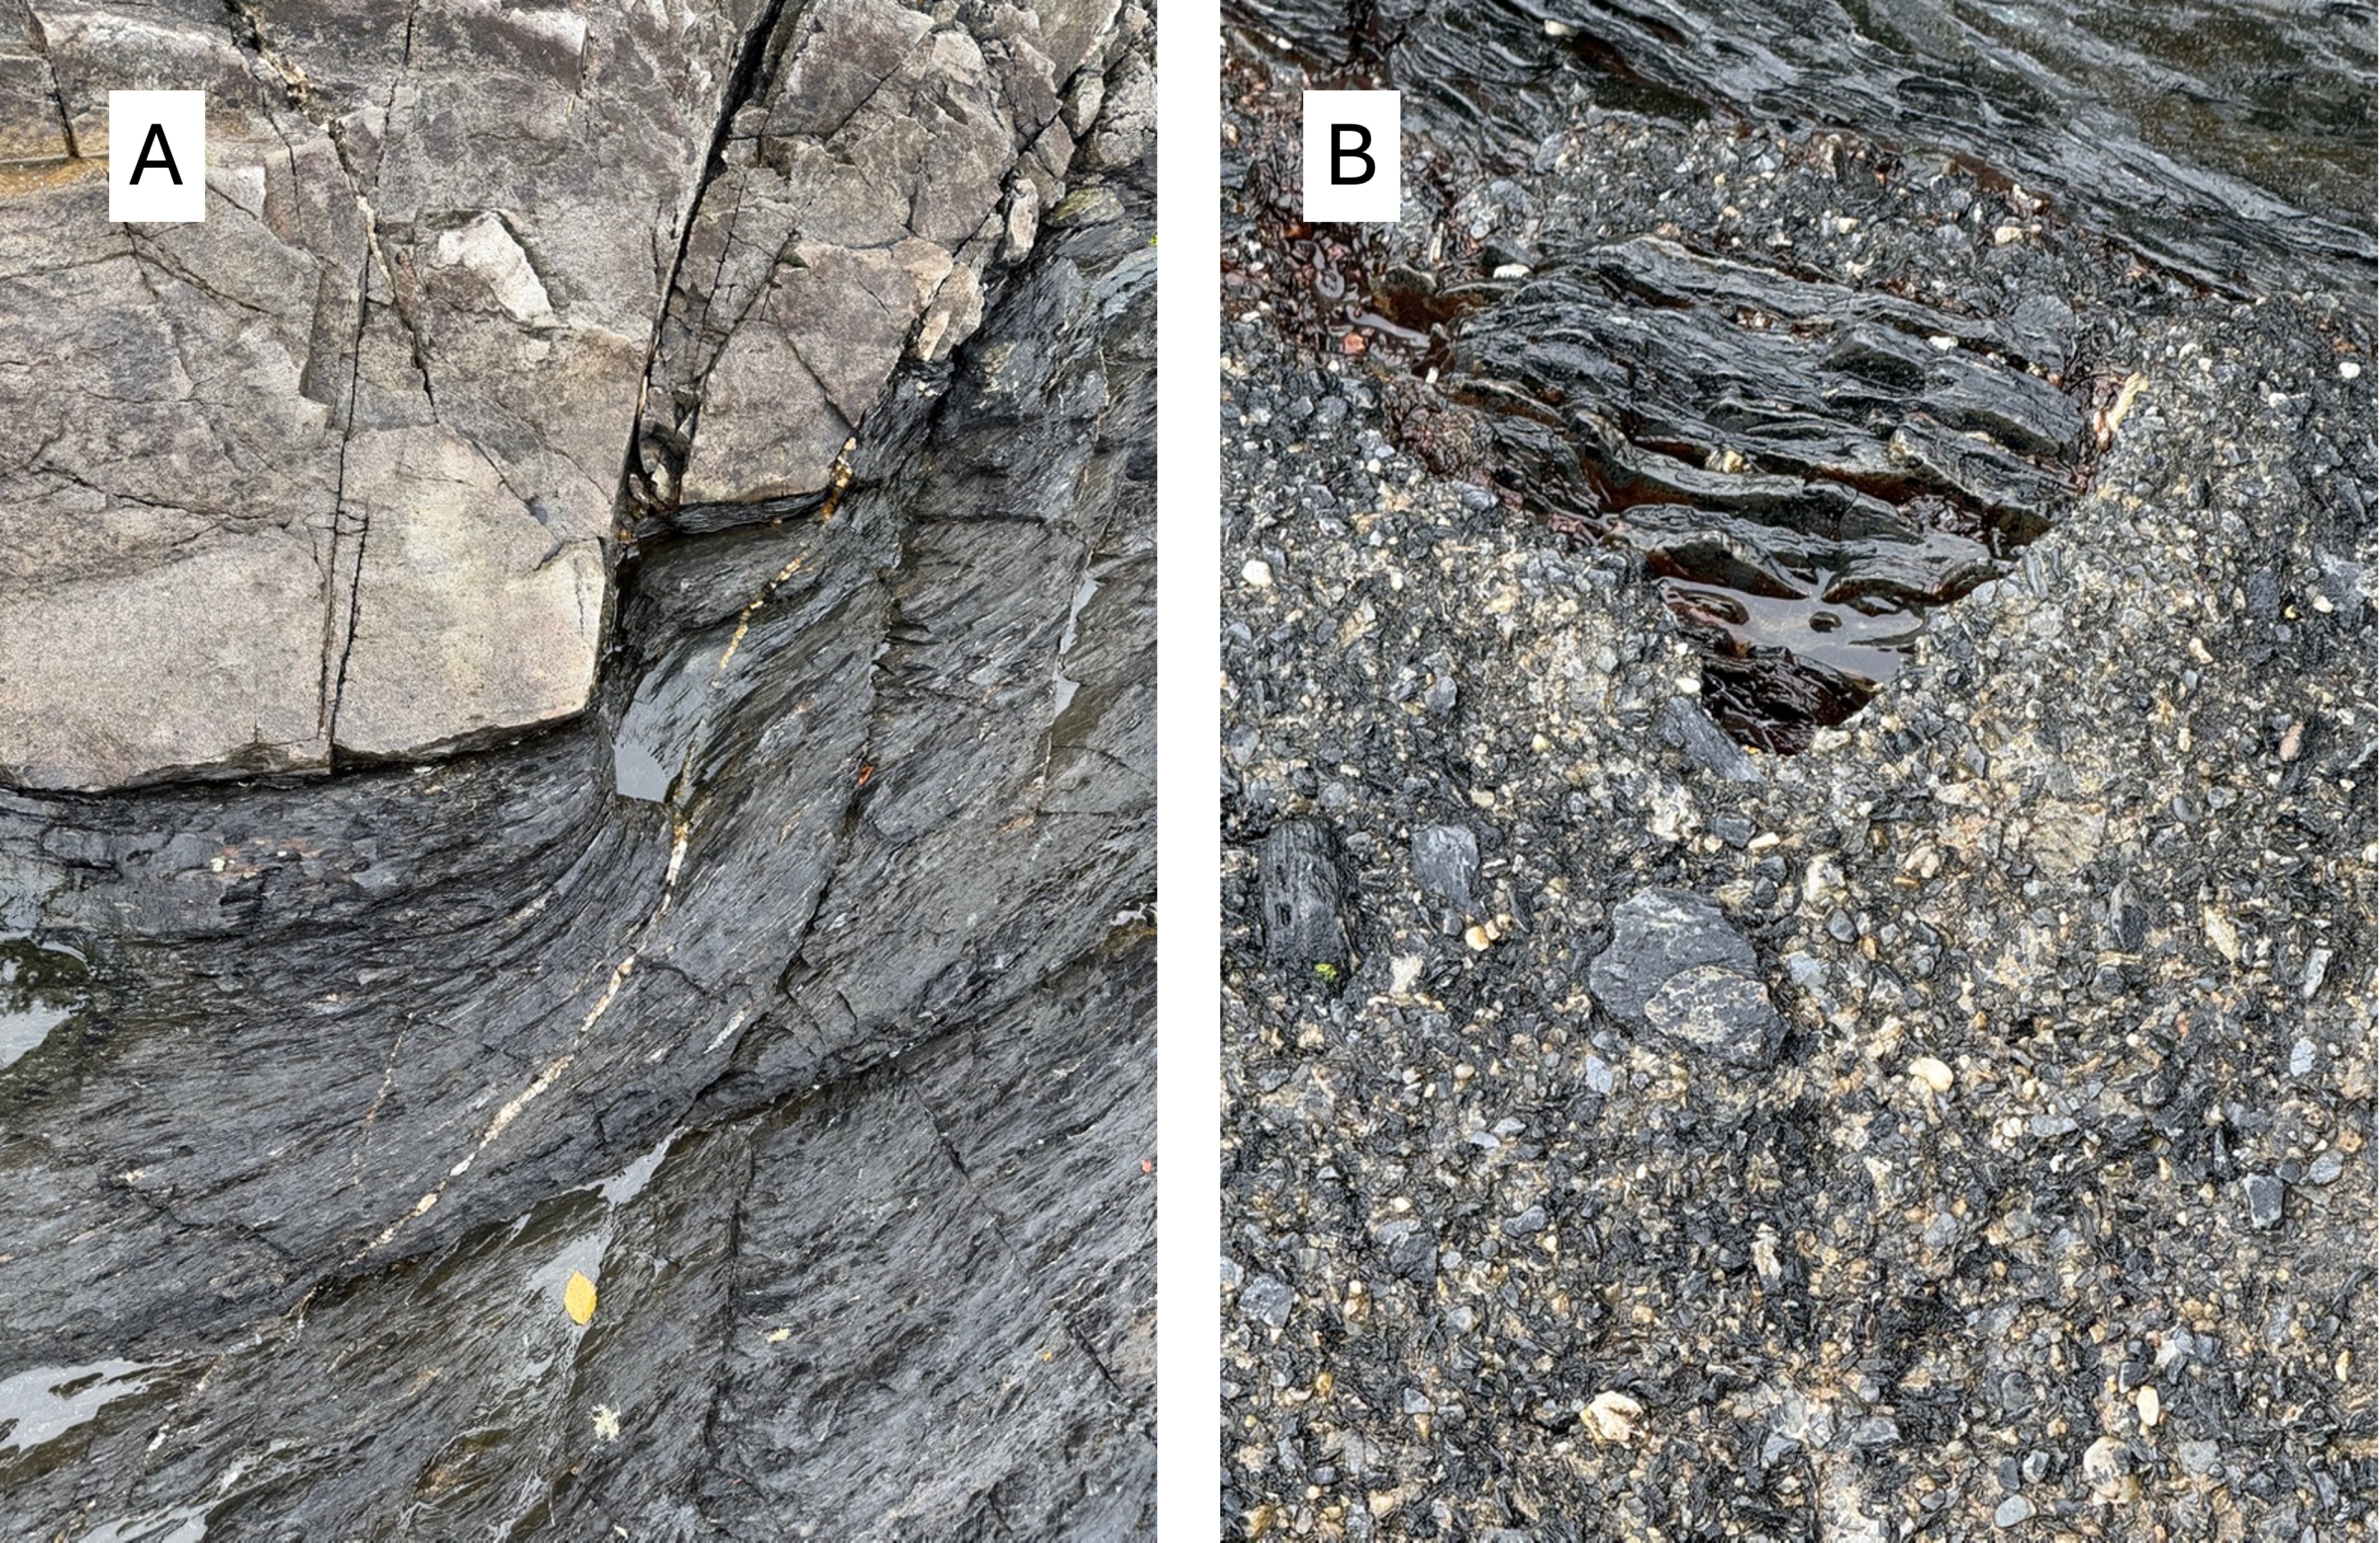
Figure 11. The devil is in the details, as shown in these images. (A) The older rock was folded during burial and, when exposed to the waves, eroded along relict bedding surfaces. Coastal sediments were then deposited in nooks and crannies like we see today. (B) Those dark fragments that look like they’re lying on the beach are actually cemented in place; the background pebbles aren’t modern sand, but instead sand frozen in time at least 29 million years ago.
Amazing.
Summary
Sometimes you can tell a story about the rocks you find, and this is one of those times. And it’s a story that unfolds across the globe. However, this story can’t be easily told because it unfolds on a sphere–the Earth. I’ll do my best.
For hundreds of millions of years, way back in the Paleozoic era, what we now call North America was drifting eastward and the West Coast (e.g. the Pacific Northwest) was a passive margin, like the East Coast is today. Suddenly, geologically speaking, the supercontinent, Pangea, which had been created from all the continents, split apart. North America reversed direction and the passive margin became a collisional plate boundary.
Ocean crust, and any islands or microcontinents that were in the way, were swallowed by the mantle or crushed by North America, creating the igneous rocks we saw at Beacon Hill Park and Mount Douglas. Muddy ocean sediments were swallowed and transformed into the schist we found at Port Renfrew. Volcanoes erupted all along the West Coast.
Then the story gets complicated and controversial.
Because the earth is not flat, crustal plates don’t slide beneath one another like sheets of paper. They crumple at the edges, forming transform faults (e.g. San Andreas fault of California) along which tectonic plates (or pieces of them) can slide past each other horizontally. This probably occurred between 200 and 66 million-years ago; if so, the rocks of Vancouver Island were originally deposited/intruded in Eastern Washington before sliding hundreds of miles to the NW.
When the crumpled edges of the colliding plates had taken up the slack, subduction resumed to the SE and the Cascades Range of volcanoes was born. This process continues to this day.
That’s the best story I’ve heard so far.
Eocene Continental Sediments in Flaming Geyser State Park
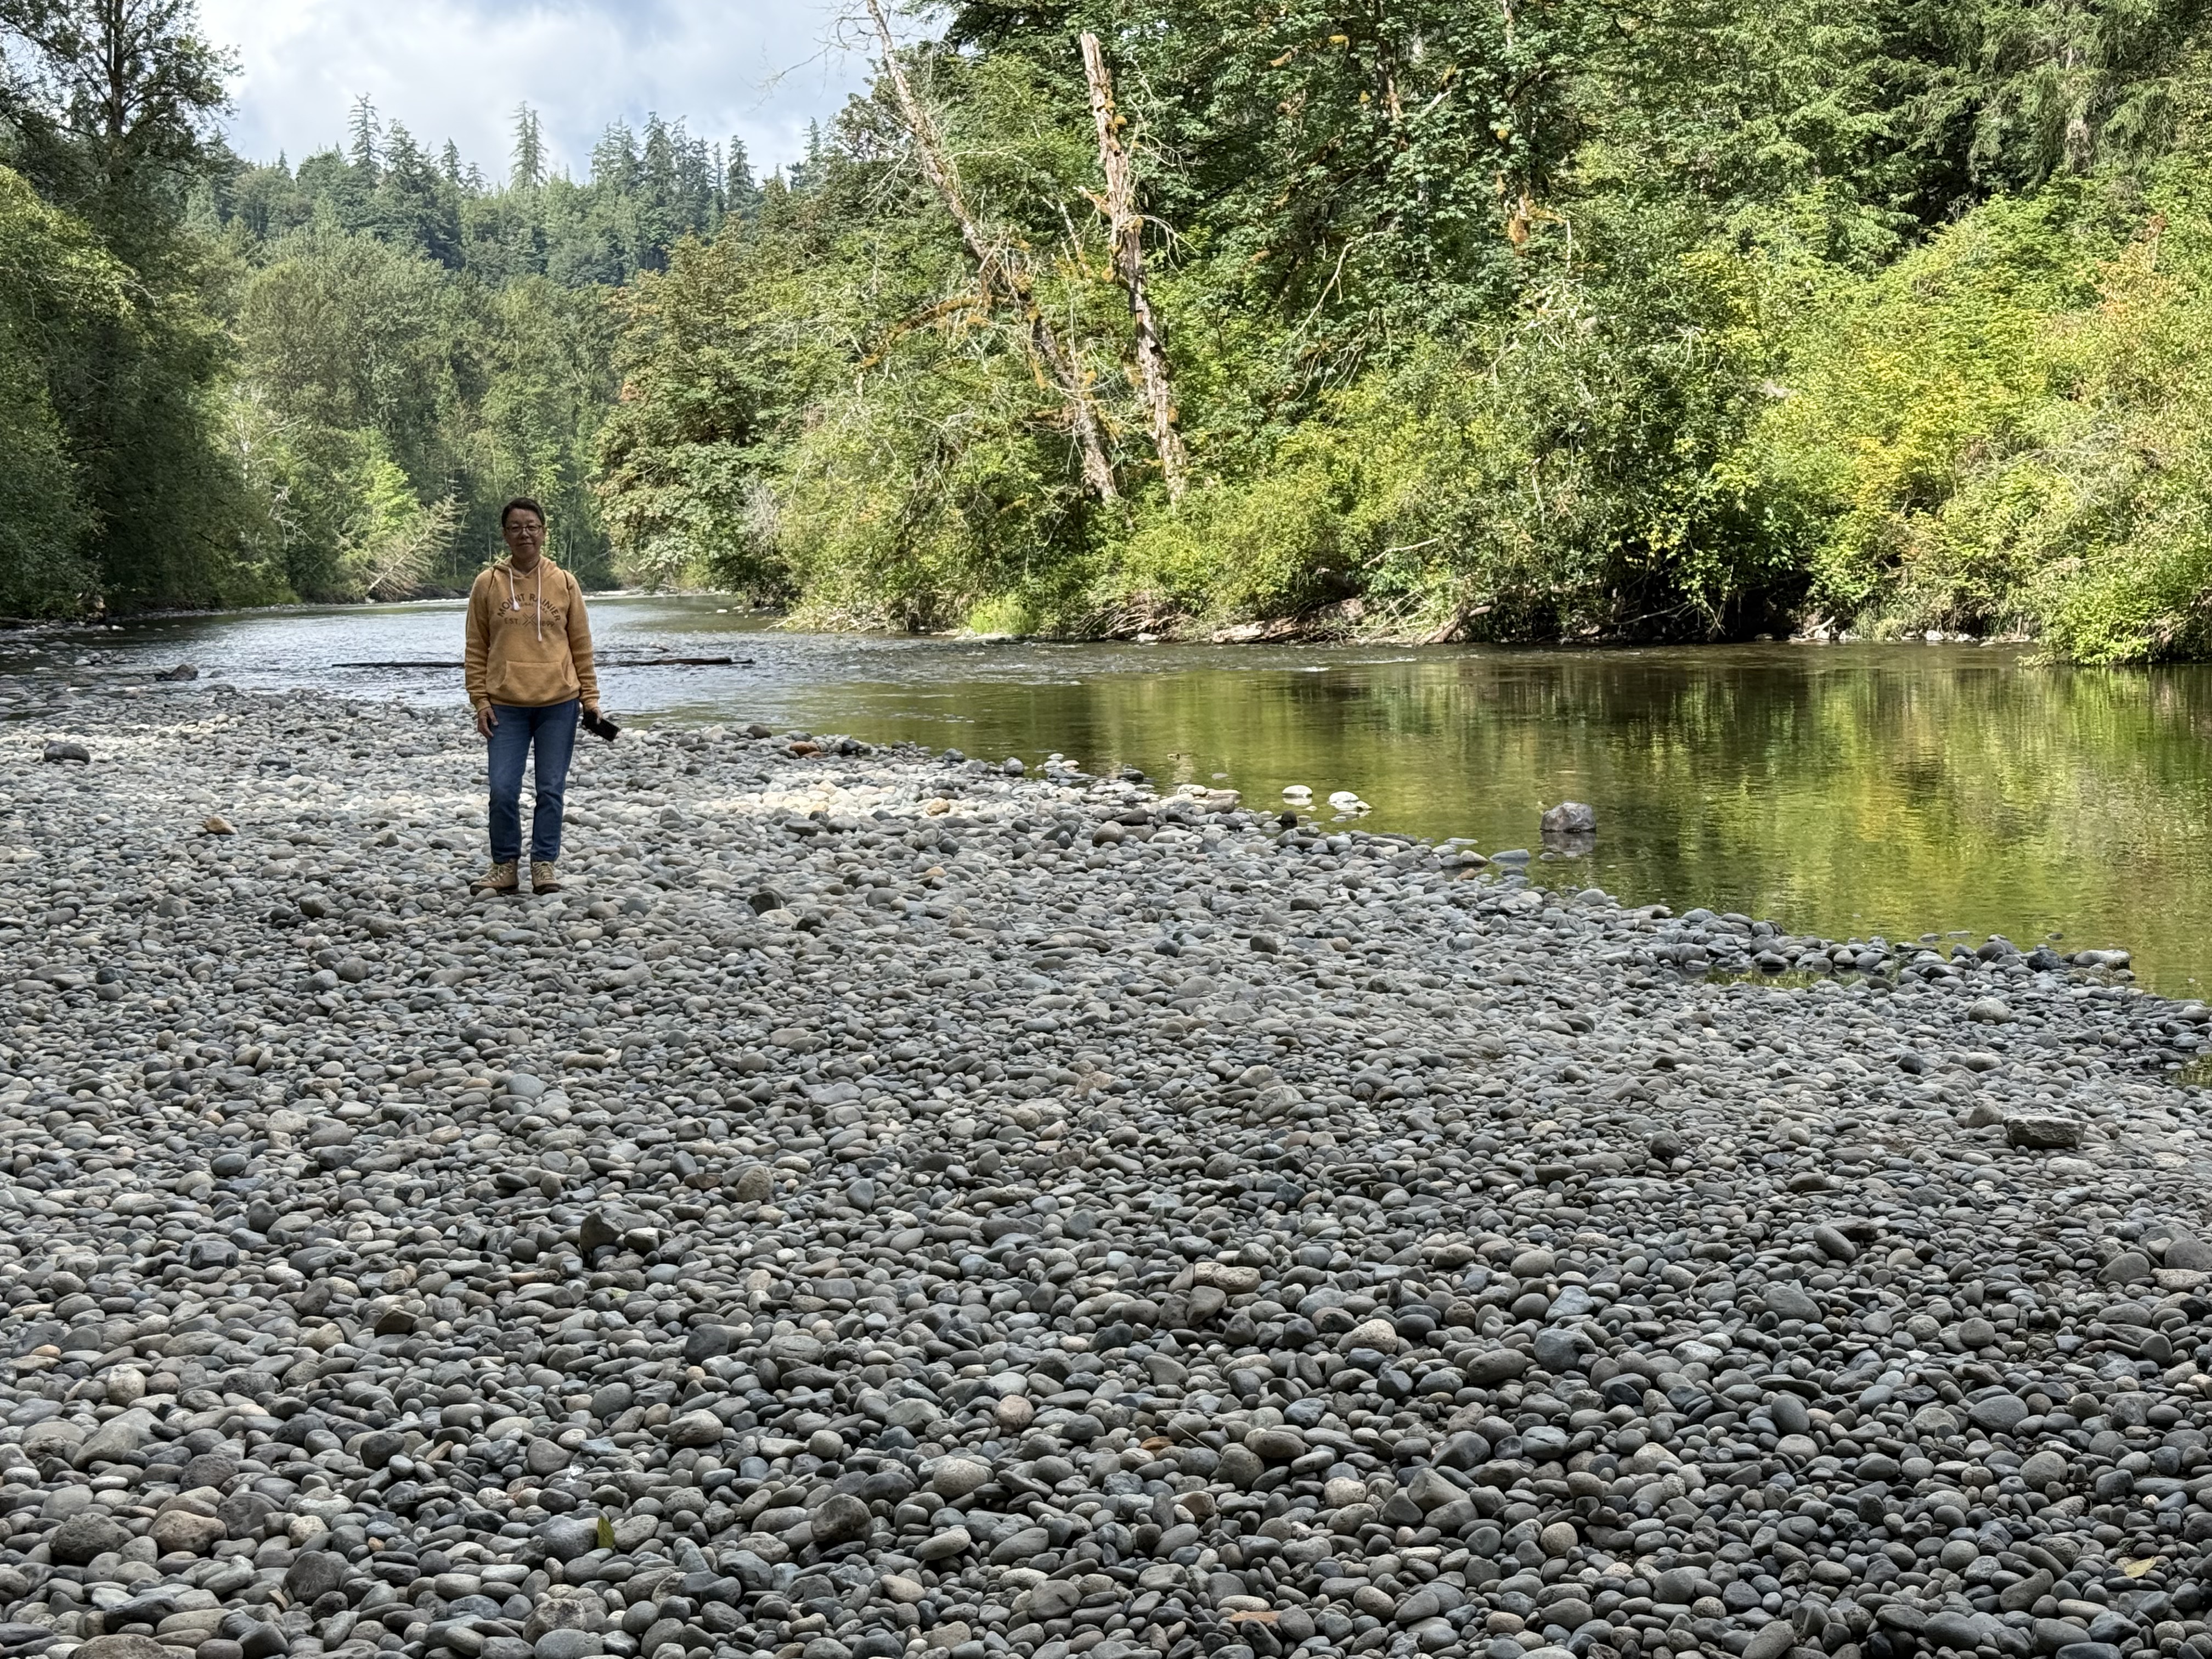
Figure 1. Flaming Geyser State Park is located along the Green River (see Fig. 2 for location), where its valley narrows and deepens. This photo shows a typical gravel stream, but there is plenty of sand and even clay available to construct a flood plain. The alluvial deposits downstream are rich farmland, where we saw a variety of vegetables growing.
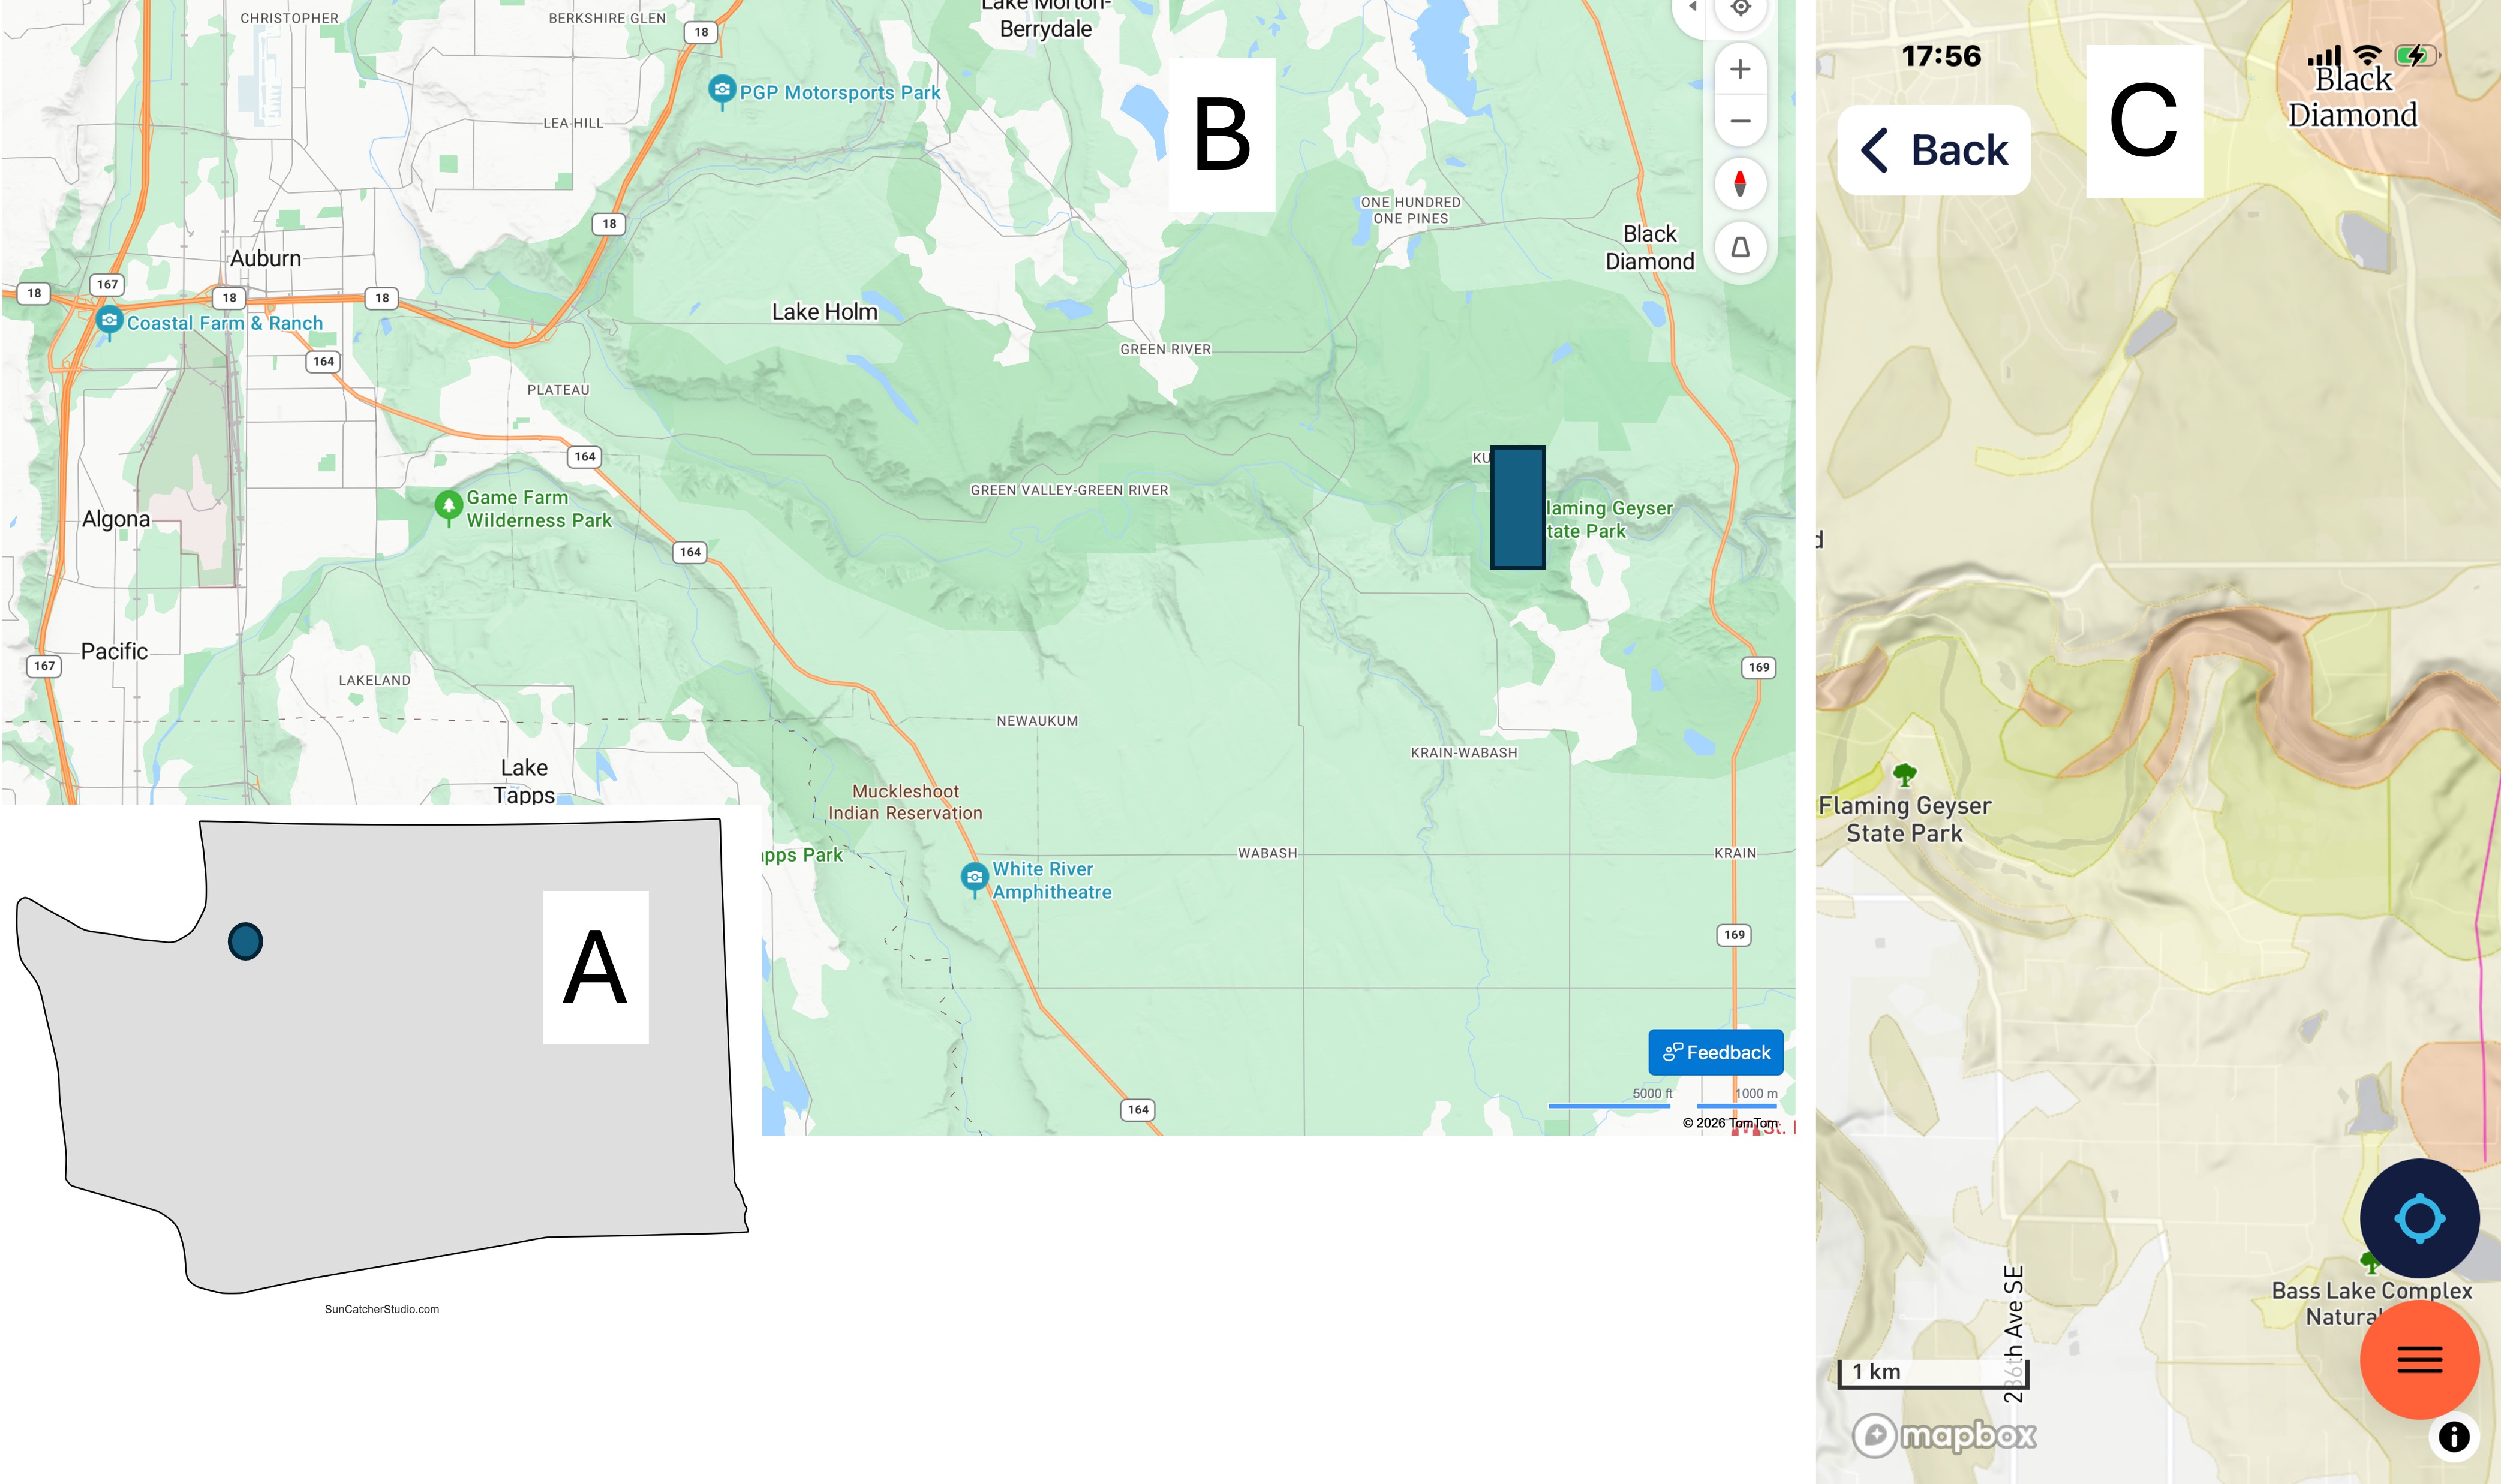
Figure 2. (A) Location of the study area SE of Tacoma in the foothills of the Cascade Range. (B) Green River has eroded a valley in the glacial till and bedrock along its path. The northern margin is steeper throughout its length. Flaming Geyser State Park is located upstream of the arable land, where the river becomes rocky and the valley narrows to a gorge. (C) The geologic map from Rock D reveals Eocene (56-33.9 Ma) continental sedimentary rocks along the stream bed whereas further north, Vashon till of Pleistocene age (2.58Ma – 11.7 Ka) covers the region in a thinning-eastward blanket. Just south of the river itself, Quaternary (2.58 Ma – Recent) fluvial and alluvial sediments have accumulated.
To the extreme east side of (C), a fault line can be seen running N-S. Faults are common, but often difficult to identify, within the region because the Cascades are the result of oceanic-crust subduction beneath the North American tectonic plate.
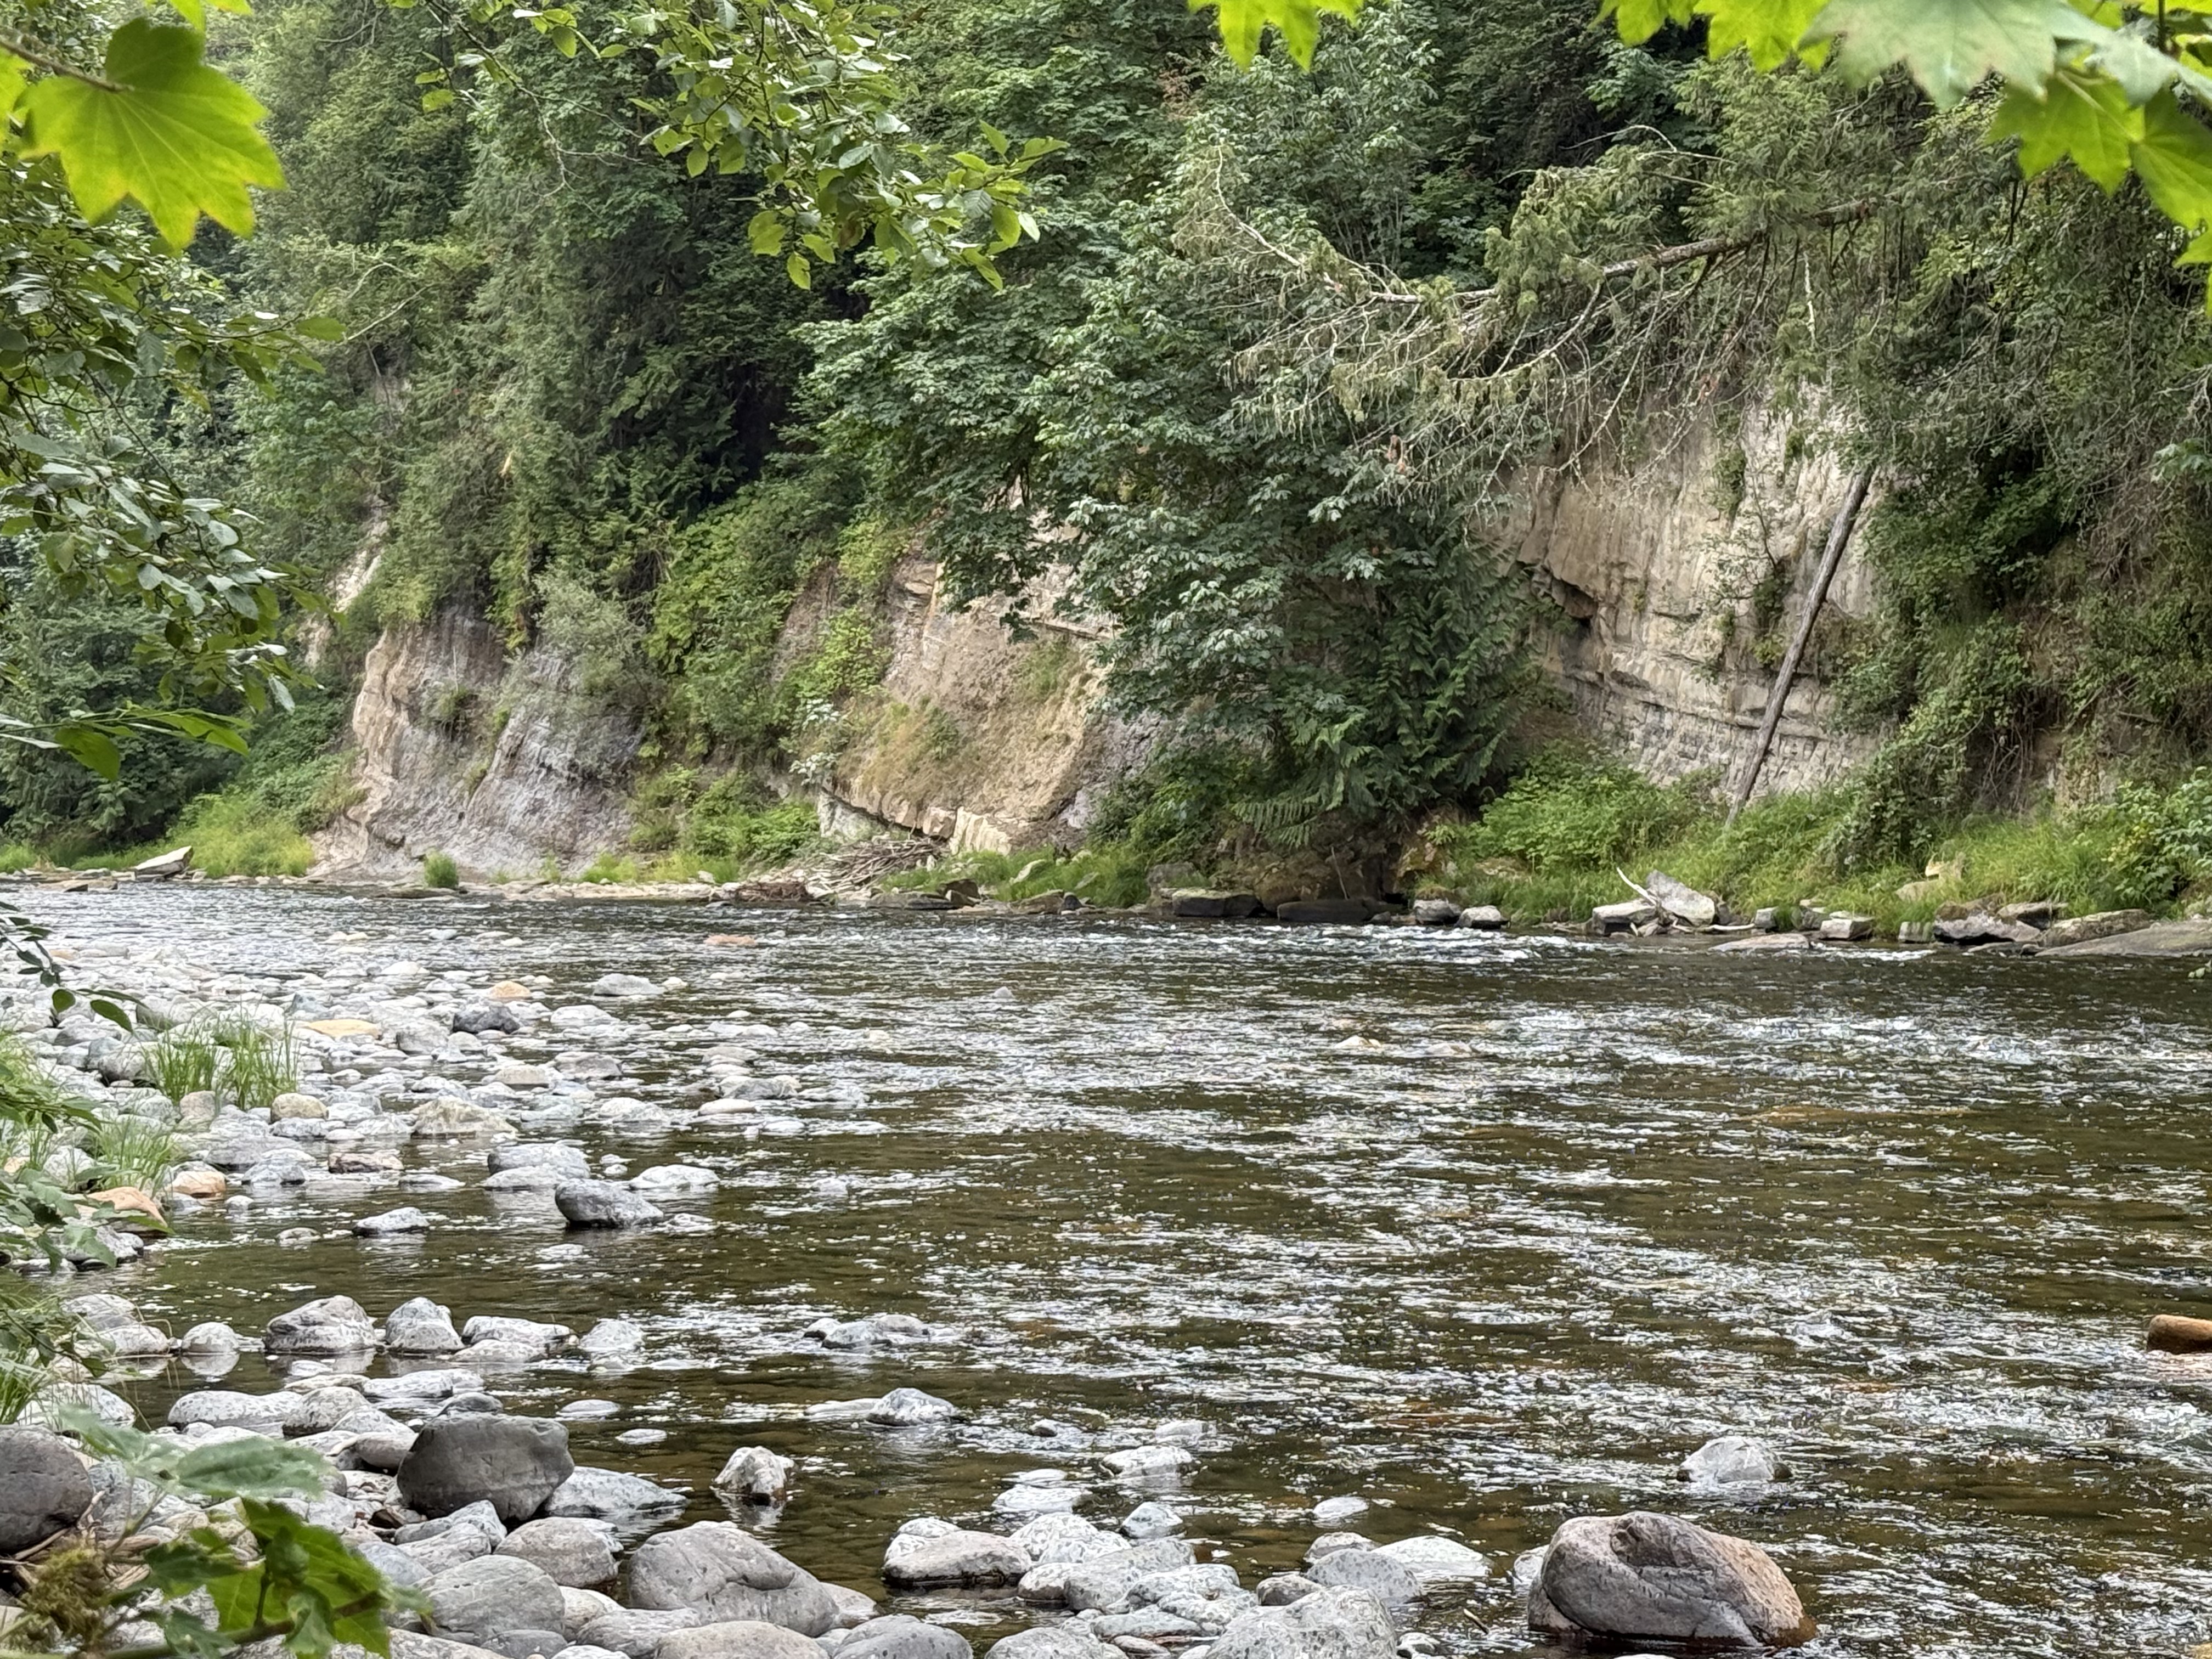
Figure 3. These layers of Eocene terrestrial sedimentary rocks have been tilted eastward (to the right), towards the fault seen in Fig. 2C, suggesting that it is a normal fault; however, their beds aren’t quite continuous, suggesting some slippage between them. The patches of foliage separating them may indicate minor faults, where the rock is ground into fine material suitable for plants to thrive. For example, the leftmost exposure is similar in stratification to the middle strata of the center exposure; the rightmost exposure doesn’t seem to be continuous with either, except for the thin, resistant bed immediately below the cliff on the right, and a similar “marker” bed a few feet lower in the middle exposure.
Following a horizontal line between them, the rocks are younger to the left, but not by much–possibly a few thousand years. This brittle deformation would have occurred a few miles within the surface when the faults were active; unfortunately, faults cannot be dated with precision.
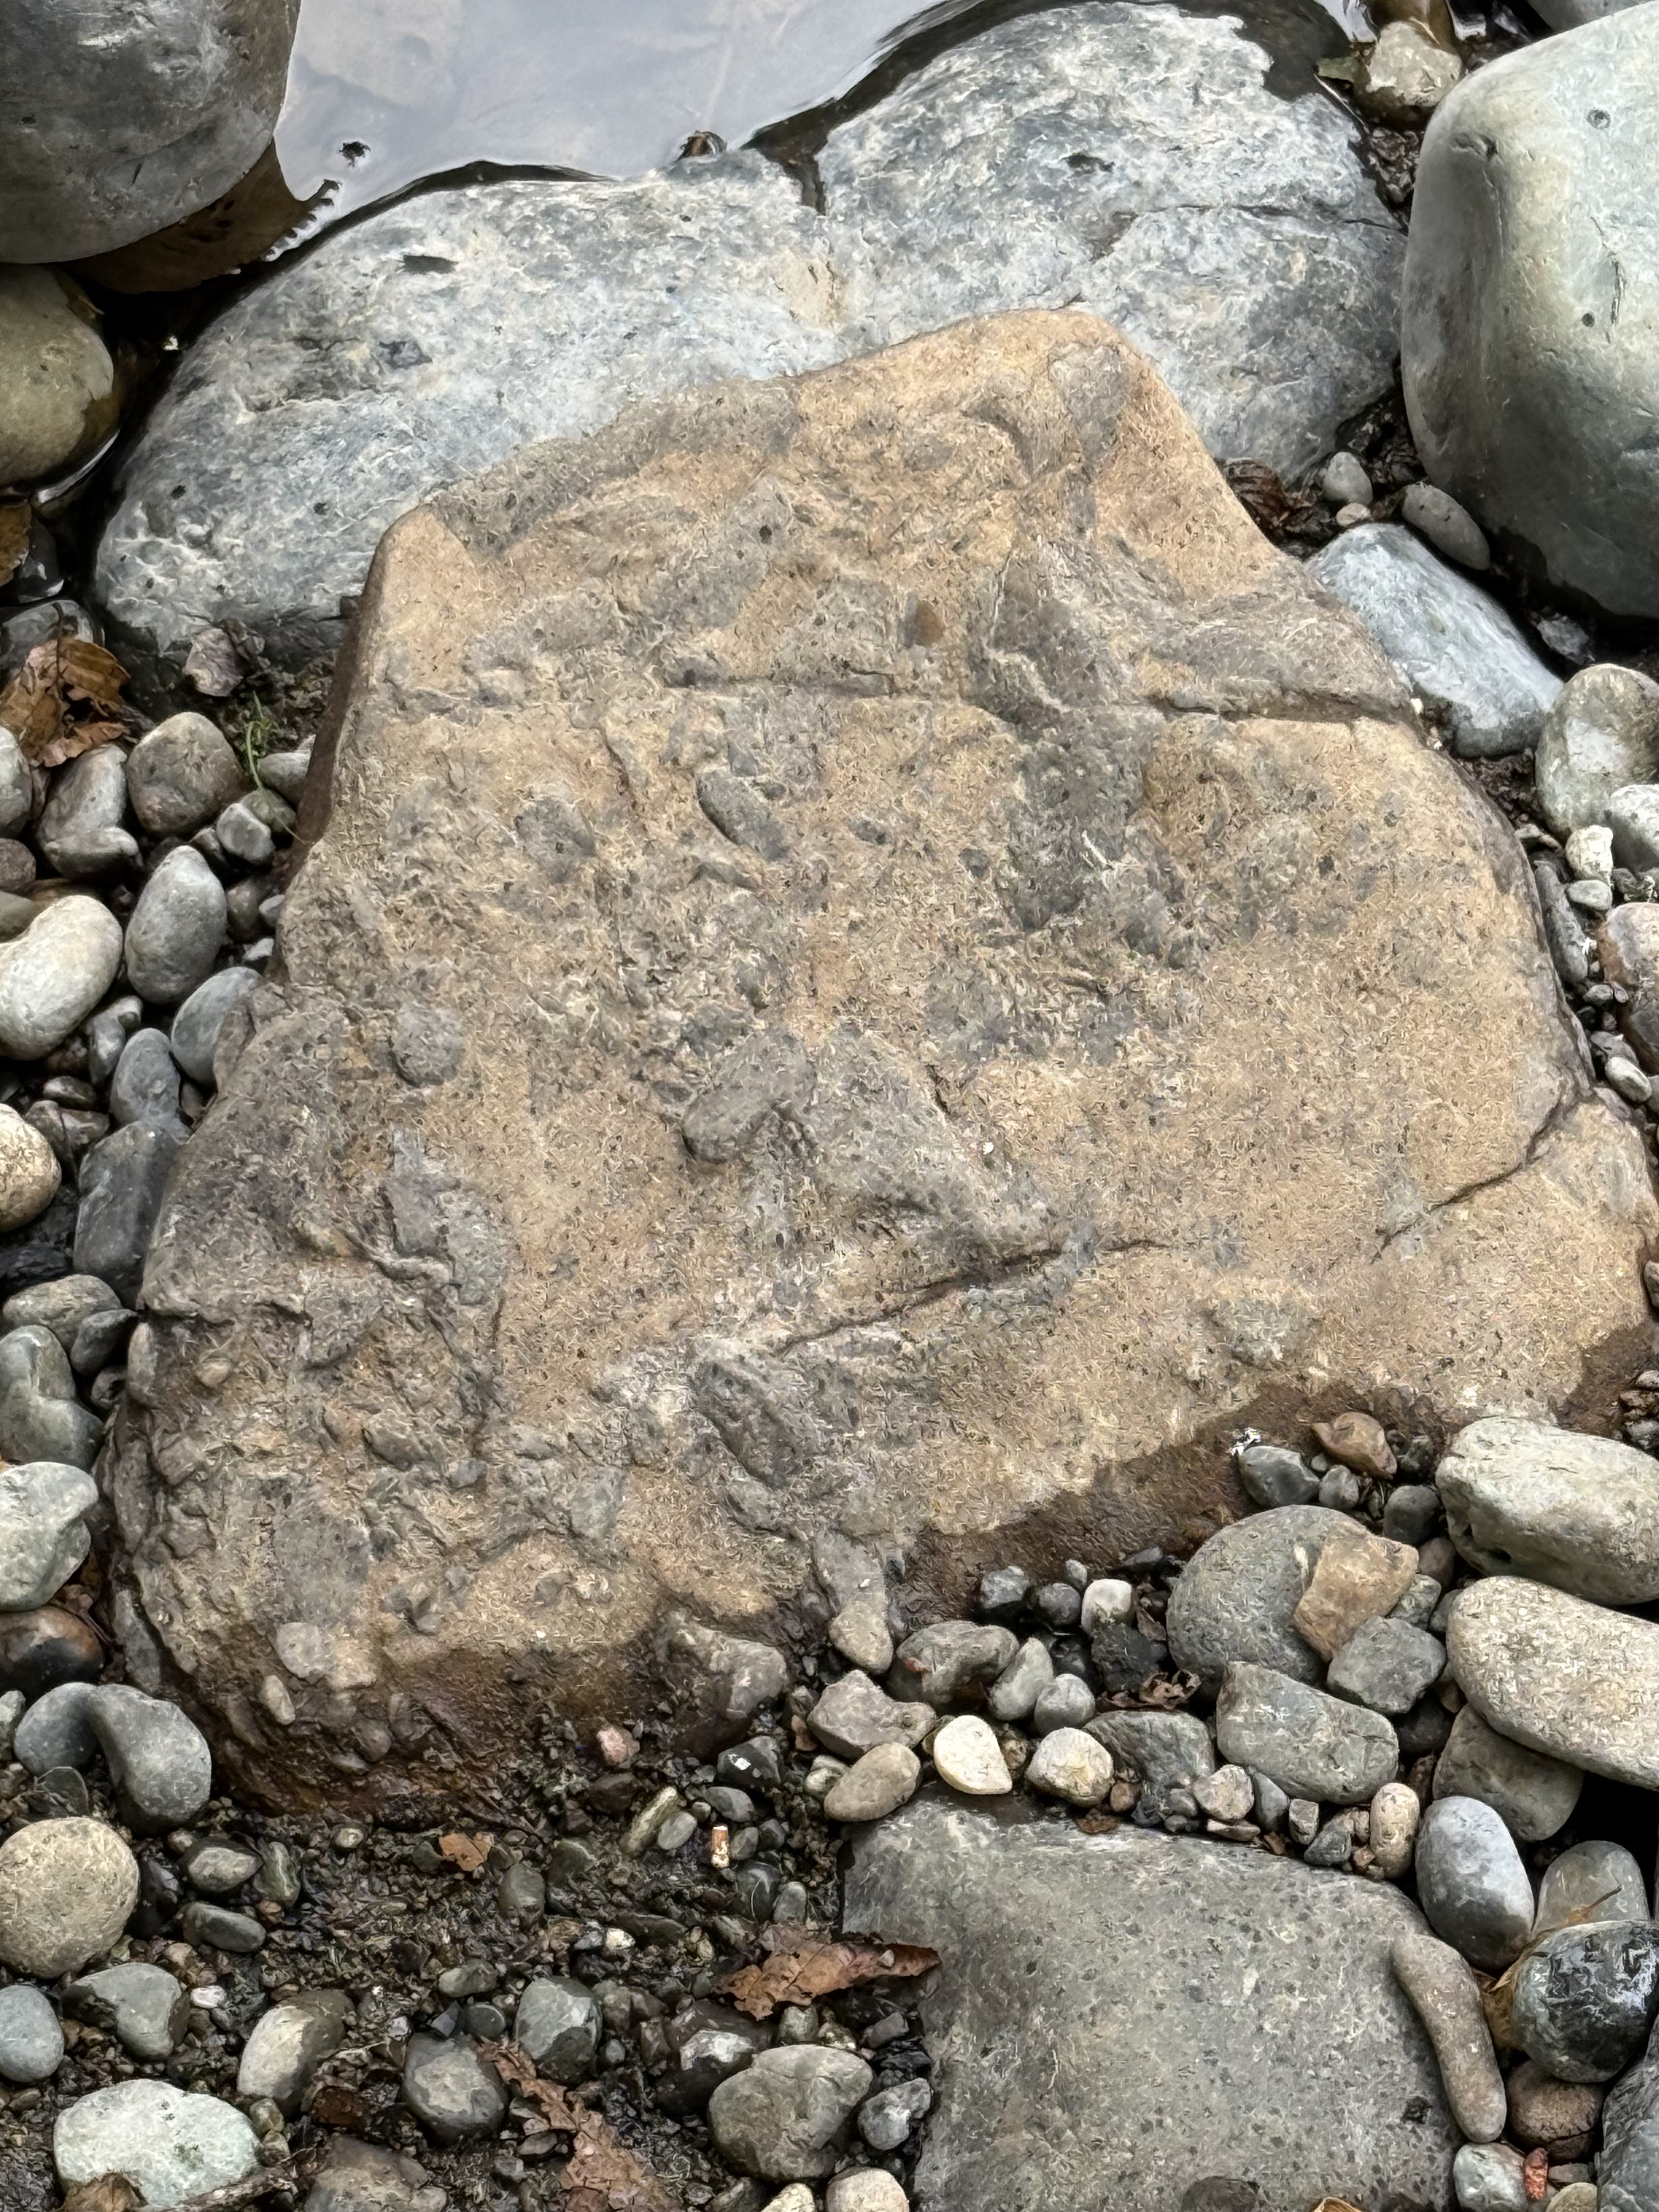
Figure 4. This is an interesting sample, which required some thinking, and a conversation with ChatGPT, to arrive at the most plausible explanation for the irregular blobs of darker material protruding from a reddish matrix. I’m pretty sure this texture arose from mingling of magmas with different compositions: the reddish one is andesite, and the darker material is something closer to basalt (there is a spectrum of chemical compositions); they were incompatible, but the magma wasn’t hot enough to totally incorporate the more basaltic material into the andesite.
We are seeing magmatic mixing processes frozen in time here.
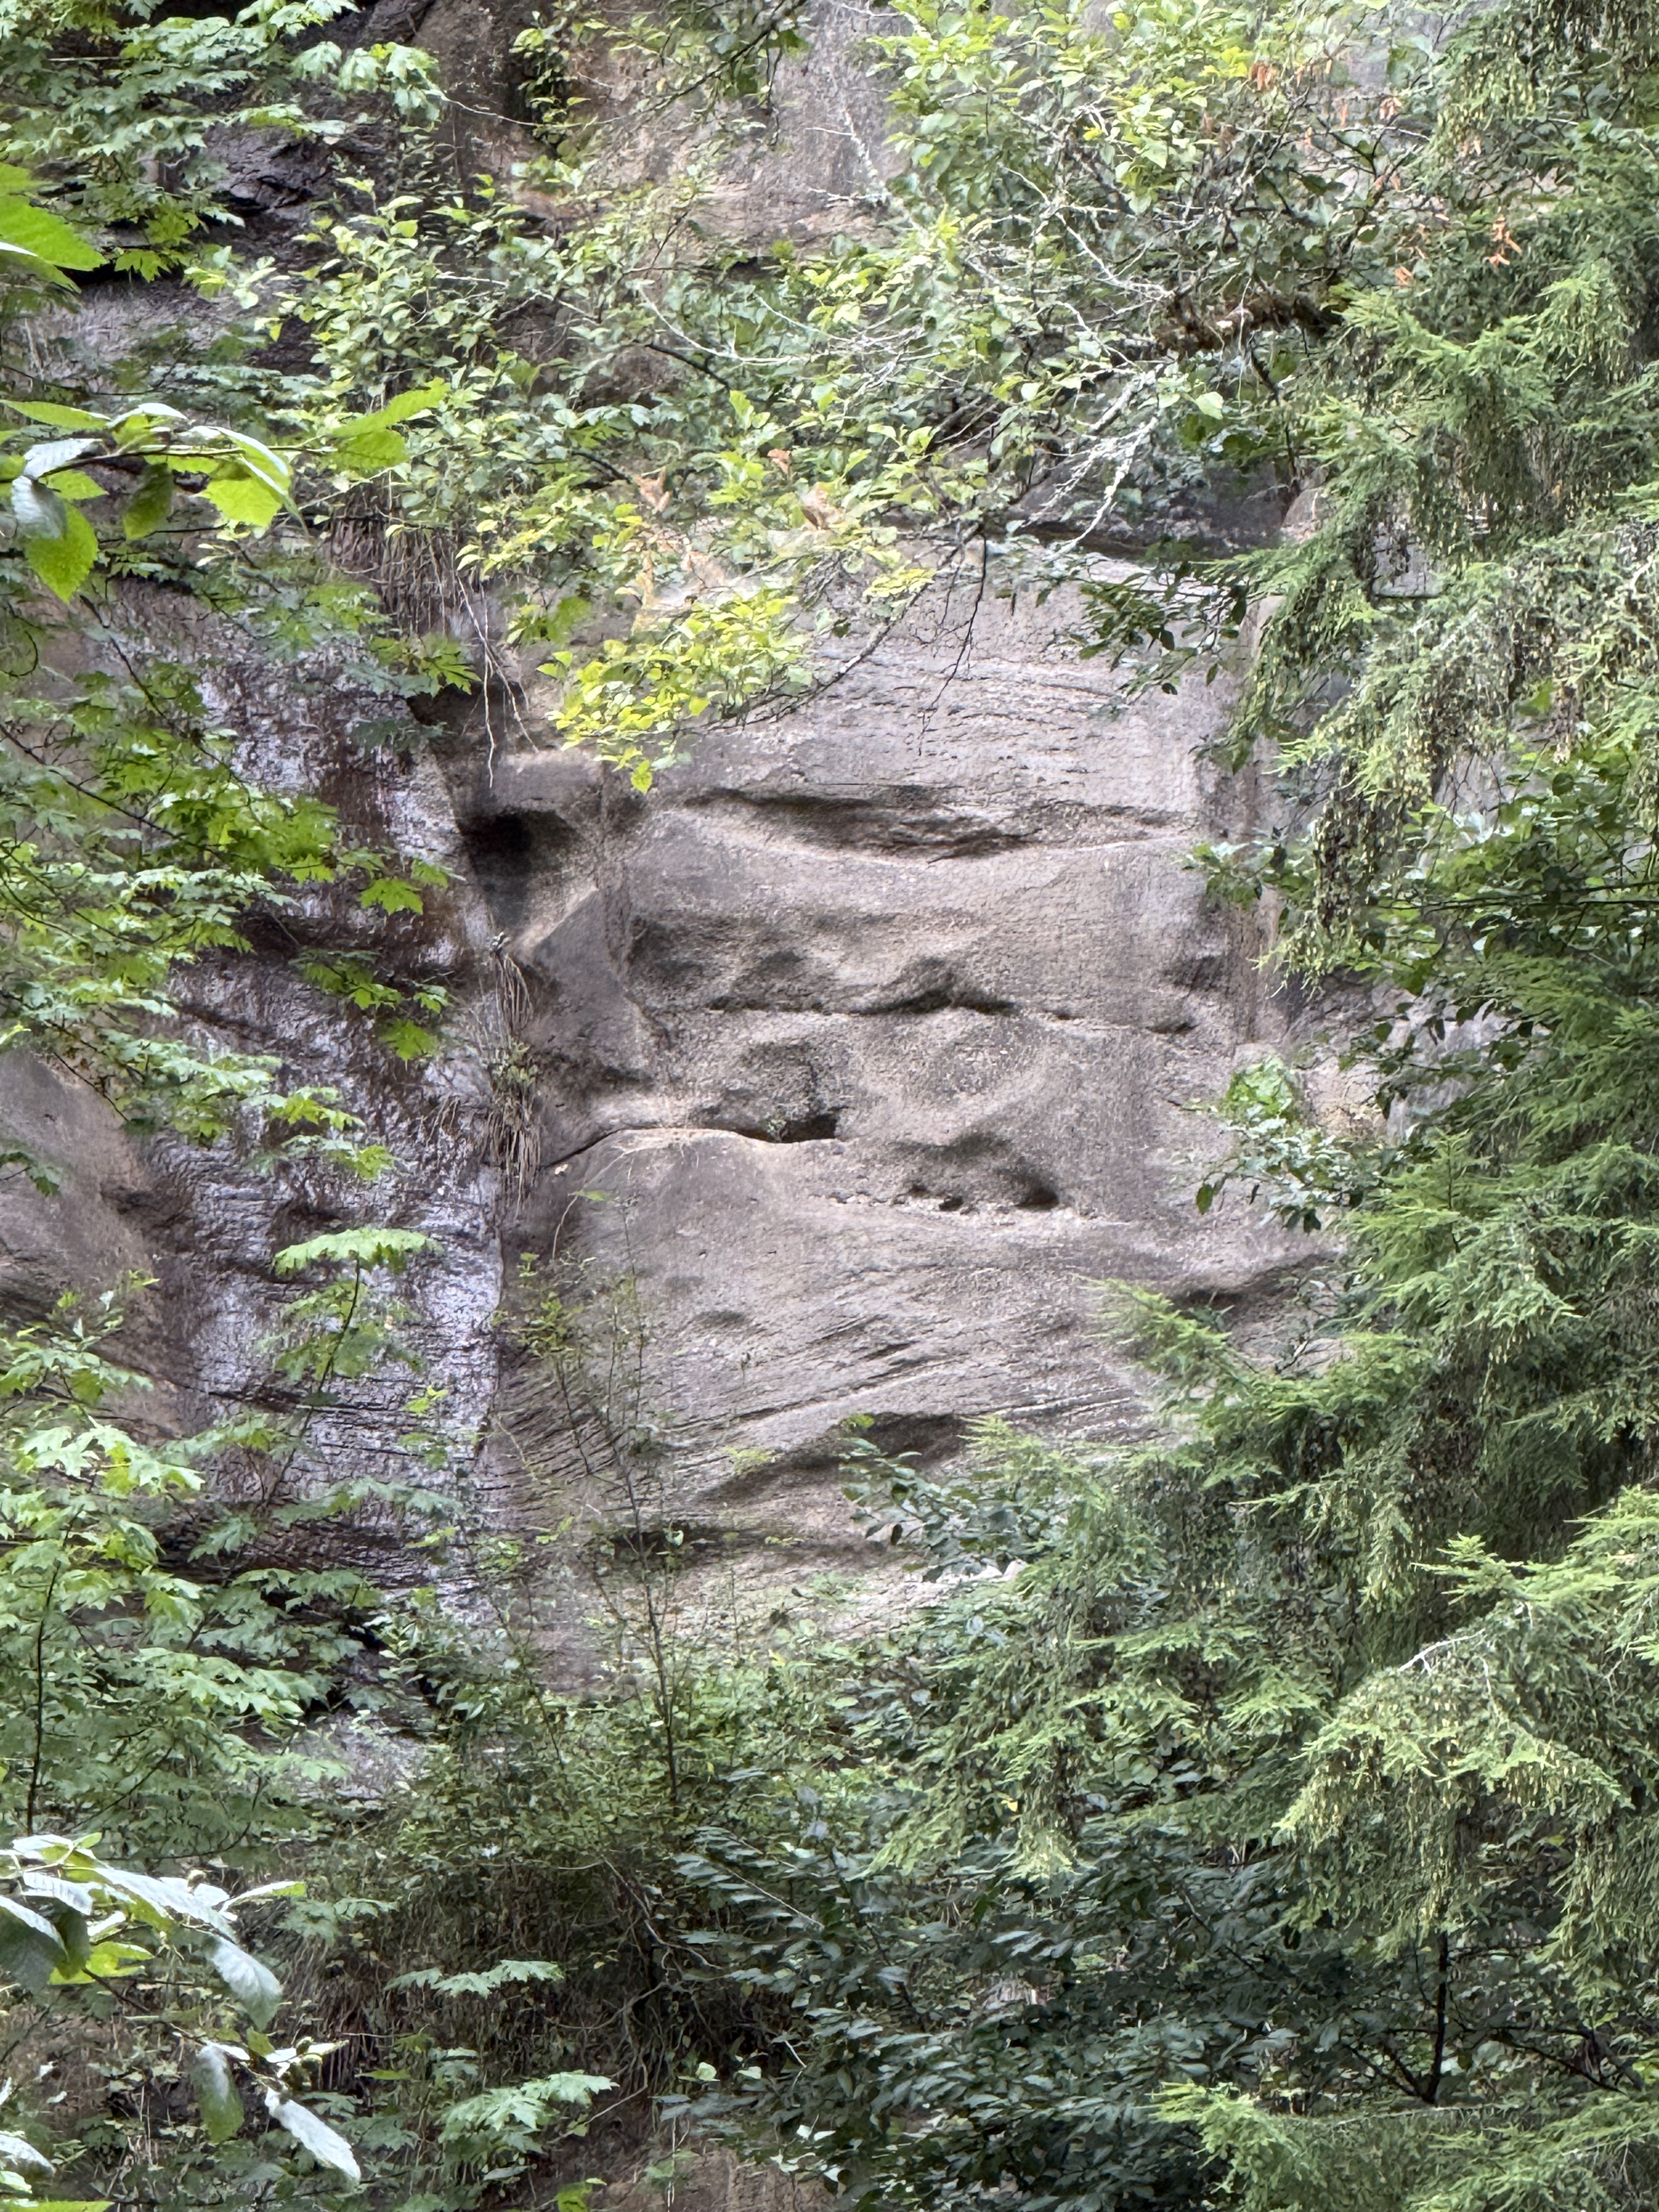
Figure 5. This photo reveals a cliff of Eocene sedimentary rocks across the river, probably 100 yards distant. I zoomed in to reveal the bedding. I estimate the height of the gray rock visible through the foliage to be at least thirty feet. The lower section contains two sets of cross-bedding, separated by an erosional surface, brought into relief by differential weathering. These large bed forms were created by water, probably in braided rivers or high-energy channels. The flow was to the left, westward in general.
This environment persisted for a long time although these rocks can’t be dated (no fossils or organic material); if we assume either a deposition rate of 1/8 inch per year (that’s a lot of sand), or a subsidence rate of similar magnitude (to make room for this stack of sand), we can estimate how long it took for 30 feet of sand dunes to accumulate. When we do the math, we see that this section could have been created in about 3000 years. This calculation is for illustration only. We don’t know the actual sedimentation rate here during the Eocene, nor do we know the amount of erosion.
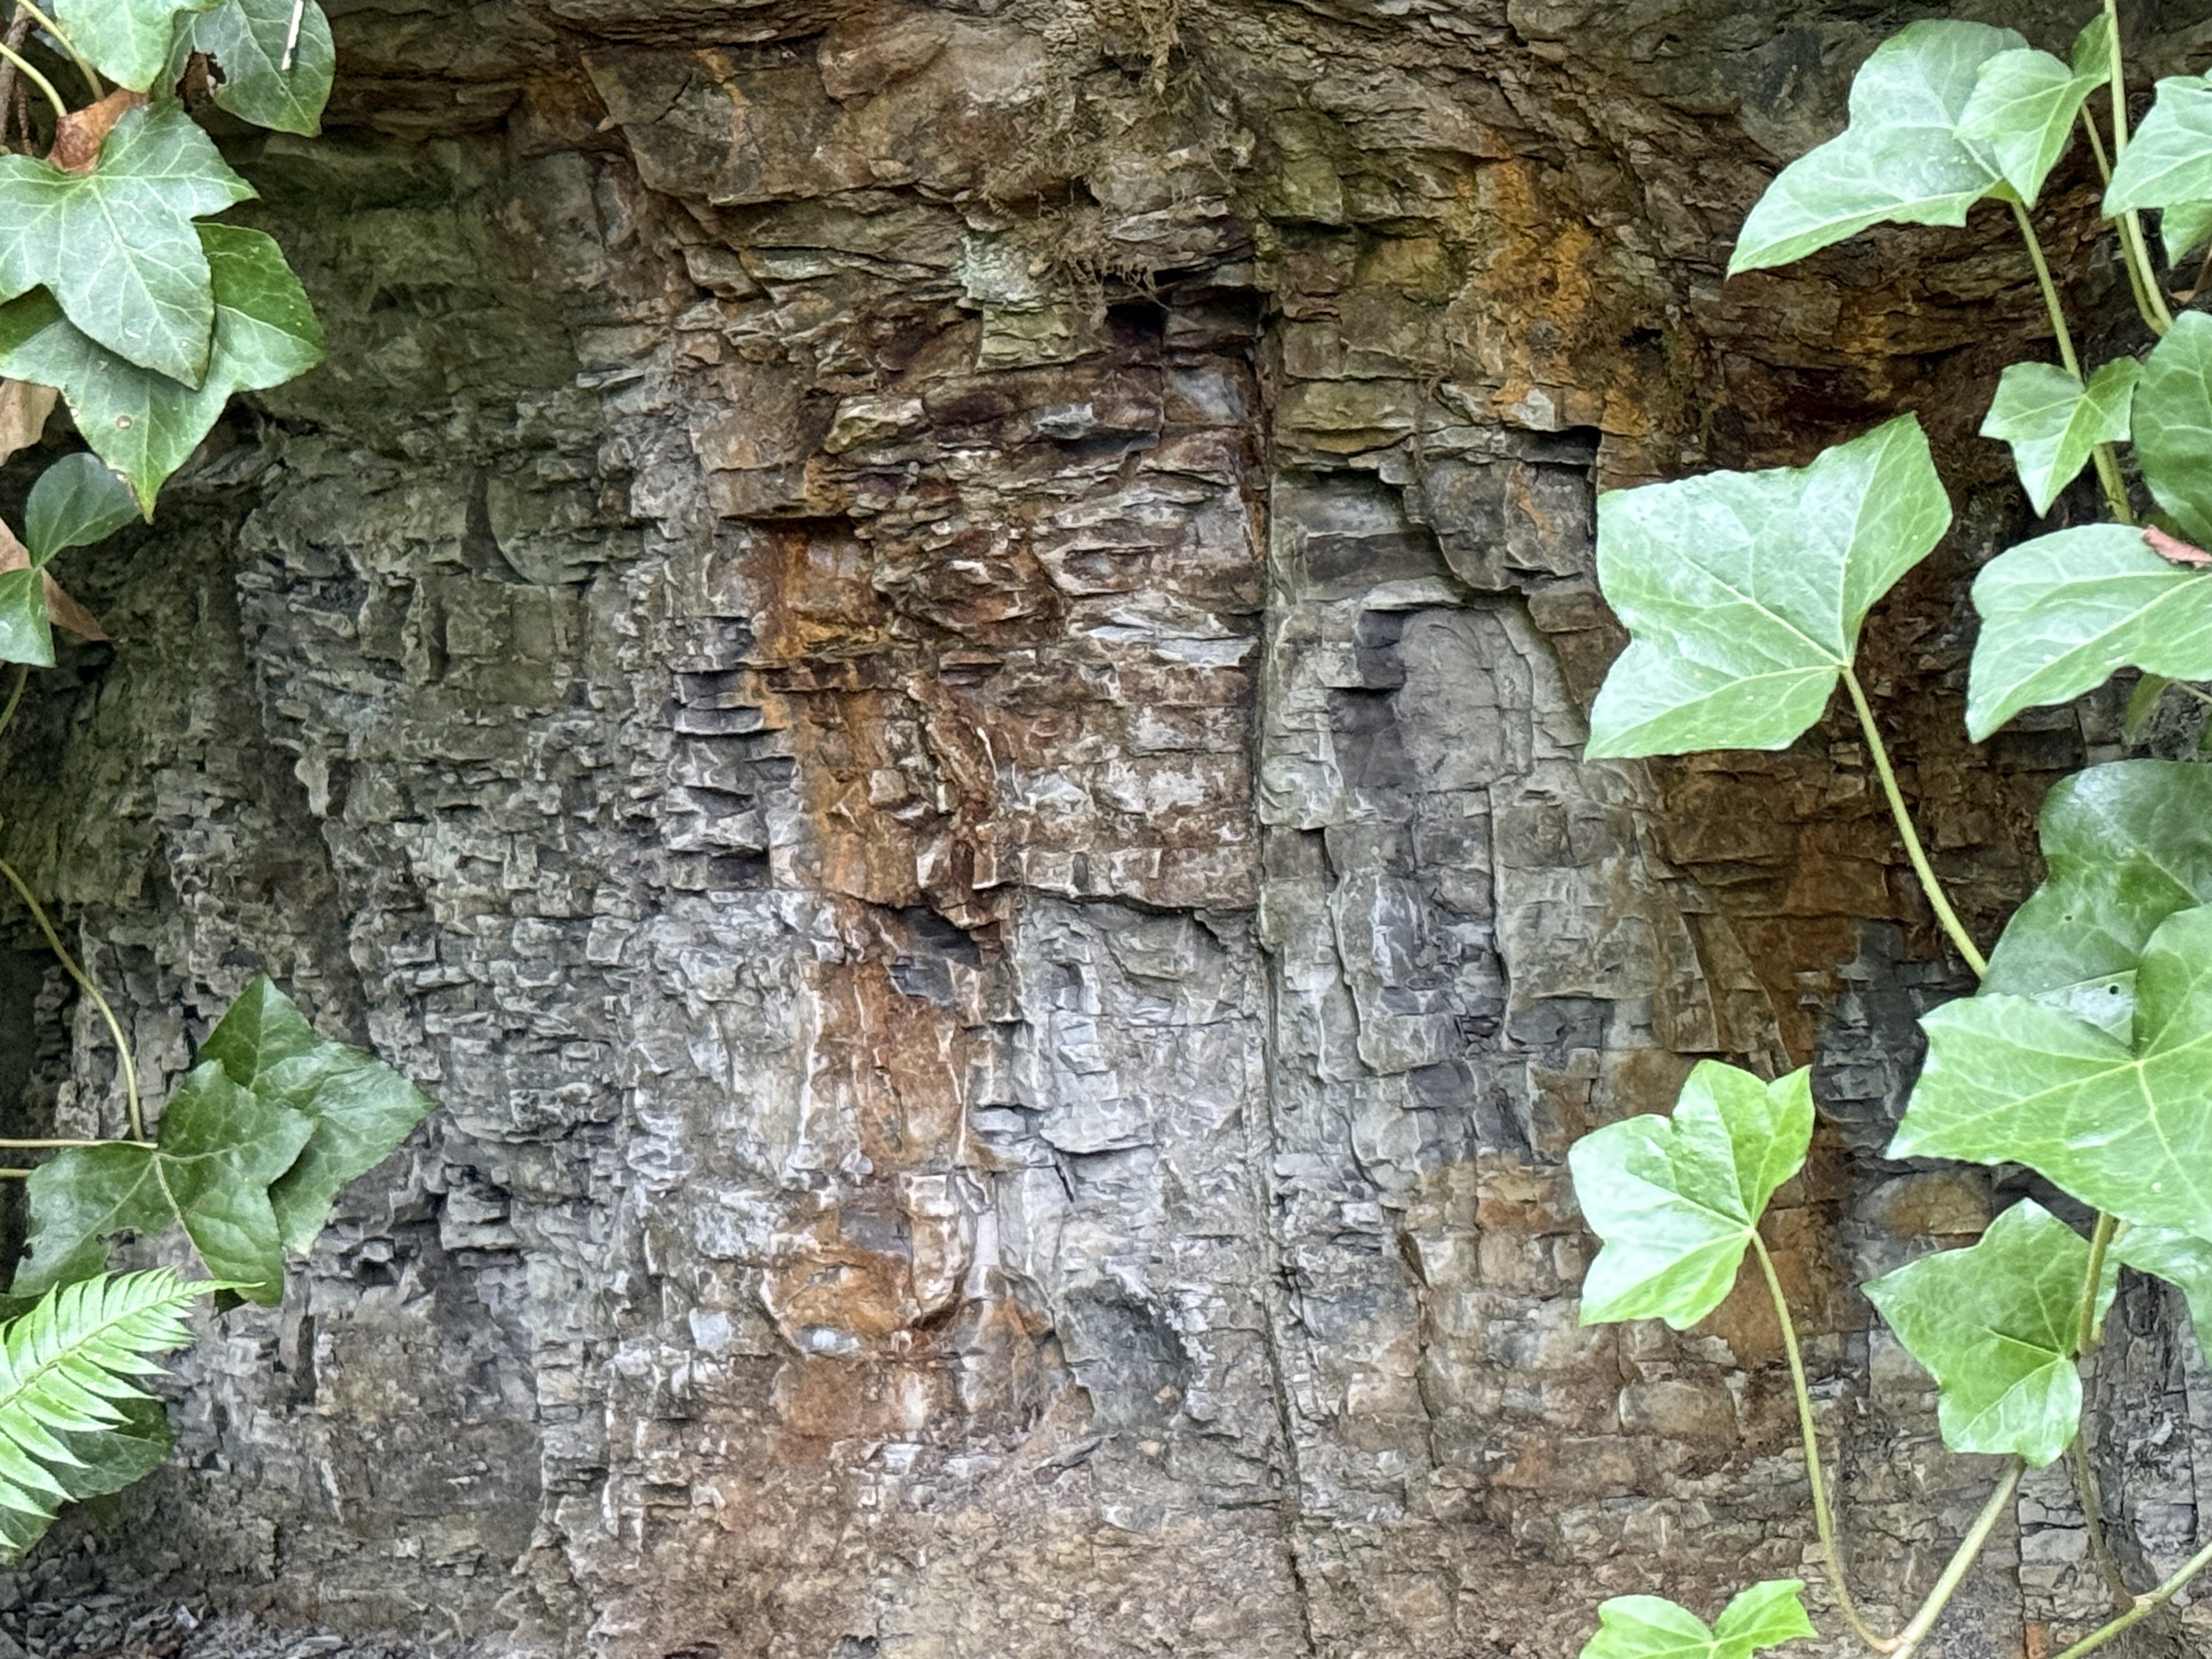
Figure 6. This photo from the south side of Green River shows some highly fractured rock beneath a stronger layer that forms a one-foot overhang. The overlying rock is staining the subjacent layers with a rust-colored material, probably from weathering of iron-containing minerals. Are these beds equivalent to those from Fig. 3?
I don’t know the answer, but the contact revealed in this photo is similar to that between the massive, cliff-forming rock from the rightmost exposure in Fig. 3, and the lower, gray layers. I wouldn’t be surprised if this rock is similar in age and environment as the gray rocks across the river.
Final Thoughts
Sometime, more than thirty-million years ago, large rivers drained the Cascades, depositing vast quantities of sand in braided rivers many miles from the coast, where finer sands and silt slid down submarine canyons and fans to be deposited as turbidites. I talked about those rocks in a previous post. Comparison of these rocks and those along the Olympic Peninsula coast allow us to reconstruct this small part of the world from a bygone age.
These Eocene sediments are similar to those we discovered a few miles to the south, along the Carbon River. This sedimentary environment wasn’t a local event, but rather part of a regional system that continuously removed the volcanoes and older rocks that were exposed by the upward pressure of the Pacific Ocean’s subducting slab. This was not an intermediate environment.
The wide range in dates for these rocks doesn’t allow geologists to be more specific than a few million years, but the earth doesn’t act very quickly, especially when the subduction zone that determines the geology of the PNW has been active for almost 200 million years.
We can afford uncertainties of a few tens of millions of years…
Geology of Carbon River Canyon, Pierce County, Washington
Today’s post reports on a brief survey of various geological features and processes that are revealed in a river that originates on the NW flank of Mt. Rainier. We’ll look at the types of rock found along its course, morphologic features, and discuss the processes that have created this natural area. We’ll also see some unintended consequences of deforestation.
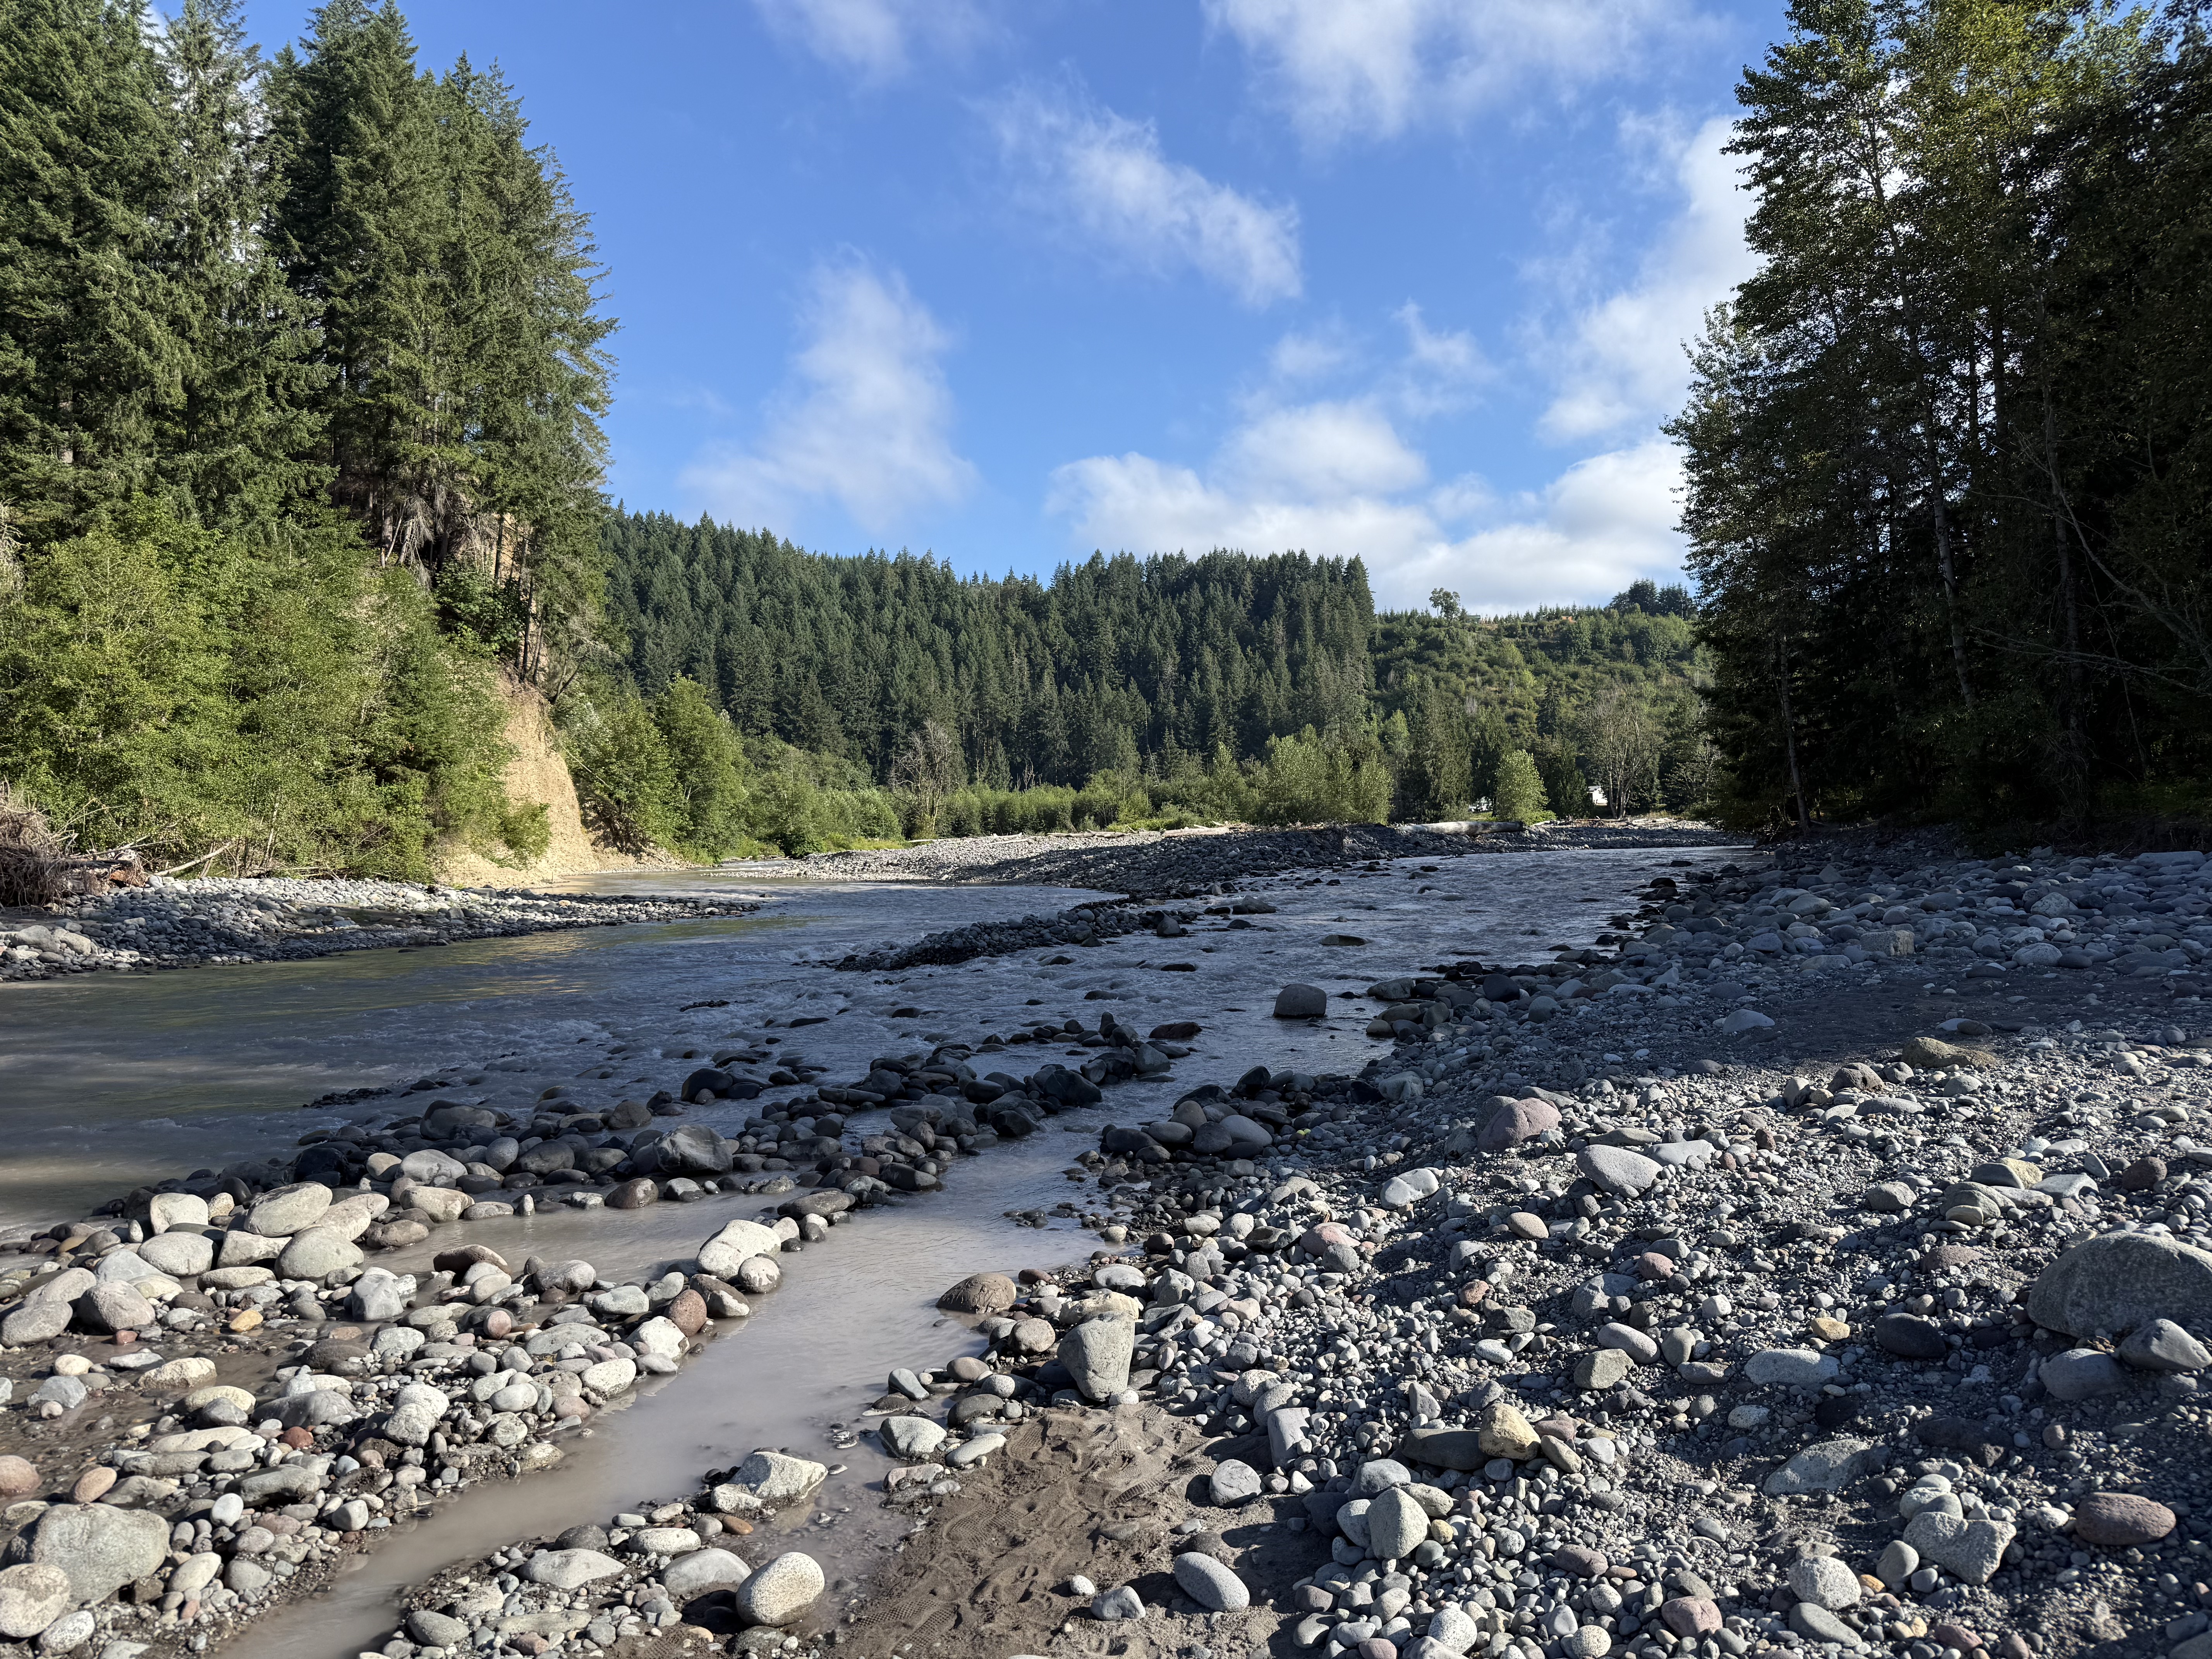
Figure 1. Carbon River flows northerly before joining the Puyallup River and emptying into Commencement Bay, in Tacoma. This stretch is dominated by boulders up to a foot in diameter. However, the water is unusually muddy; we’ll find out why during our walk three-miles up the canyon that contains the stream.
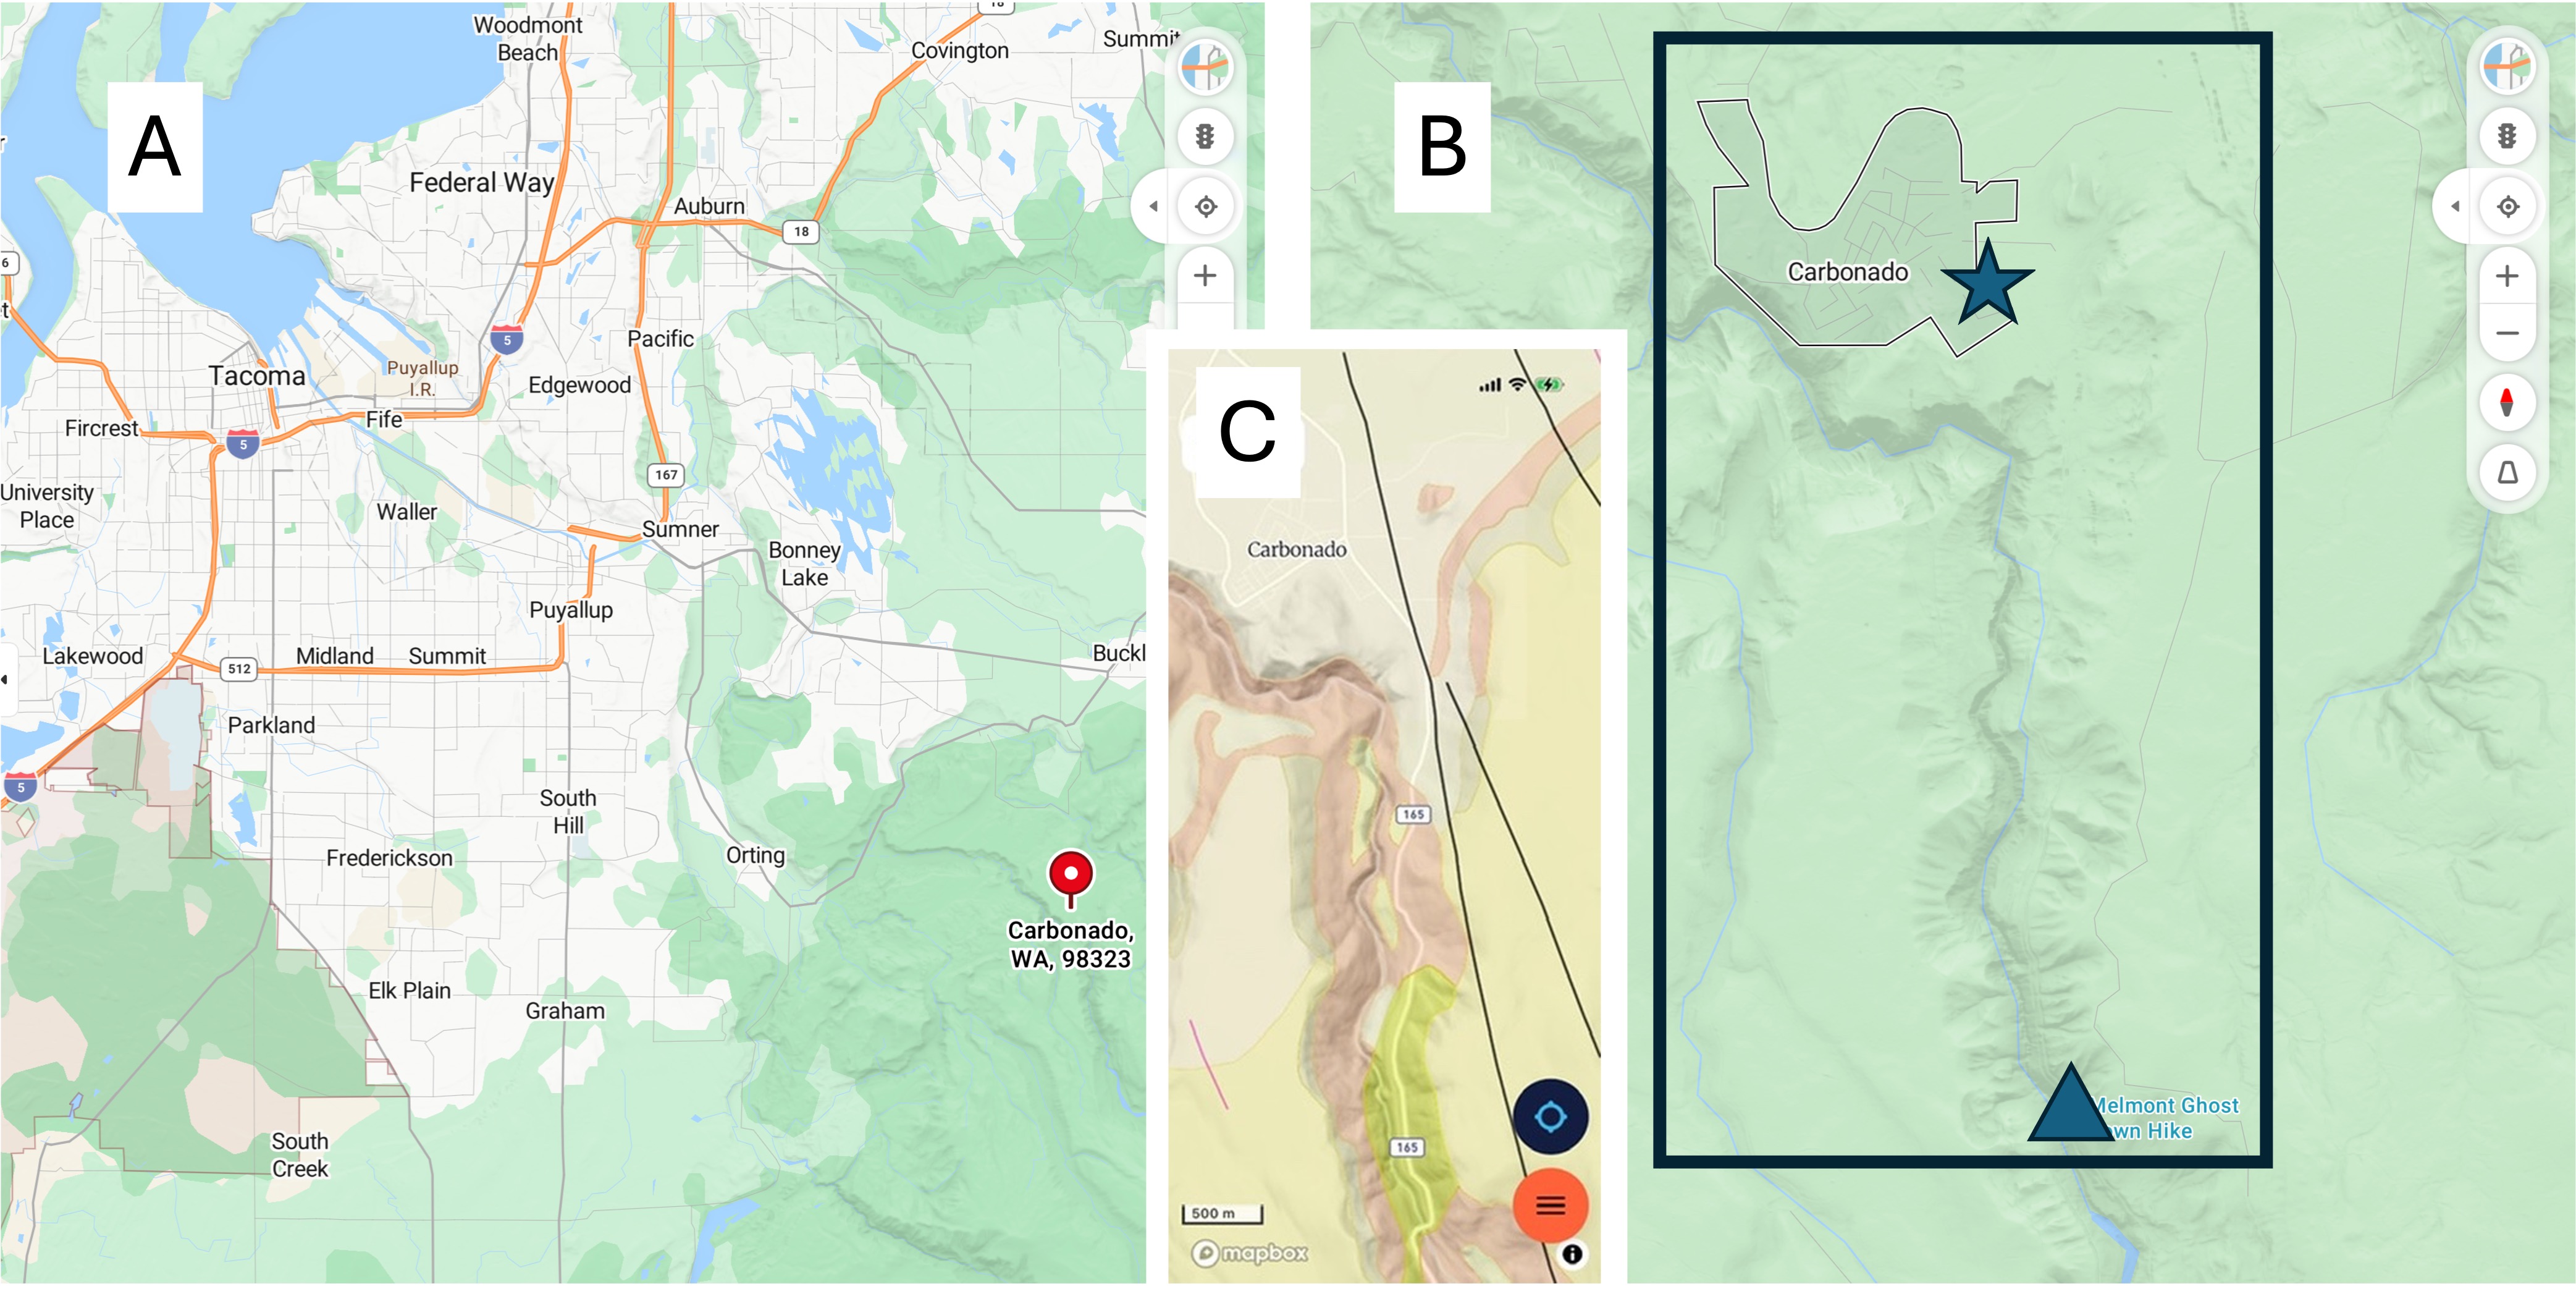
Figure 2. (A) Regional map, showing Carbonado (pinned), a forty-five minute drive from North Tacoma. (B) Local map showing the Carbon River, which we followed for three miles. The river has cut a gorge that begins at Carbonado (star) and deepens to 250-300 feet at Fairfax bridge (triangle). (C) The geologic map from RockD reveals four major rock formations: the tan, which dominates around Carbonado is glacial drift, mostly sand and gravel; The pink outlining the river is Eocene (56-33.9 Ma) sedimentary rocks of terrestrial origin – rivers, lakes, etc; the yellow is Miocene-Oligocene (~23 Ma) fine-grained andesite. Additionally, the yellowish unit on both sides of the river is Pleistocene (2.5 Ma to 12 Ka) glacial drift. We didn’t see any of that today.
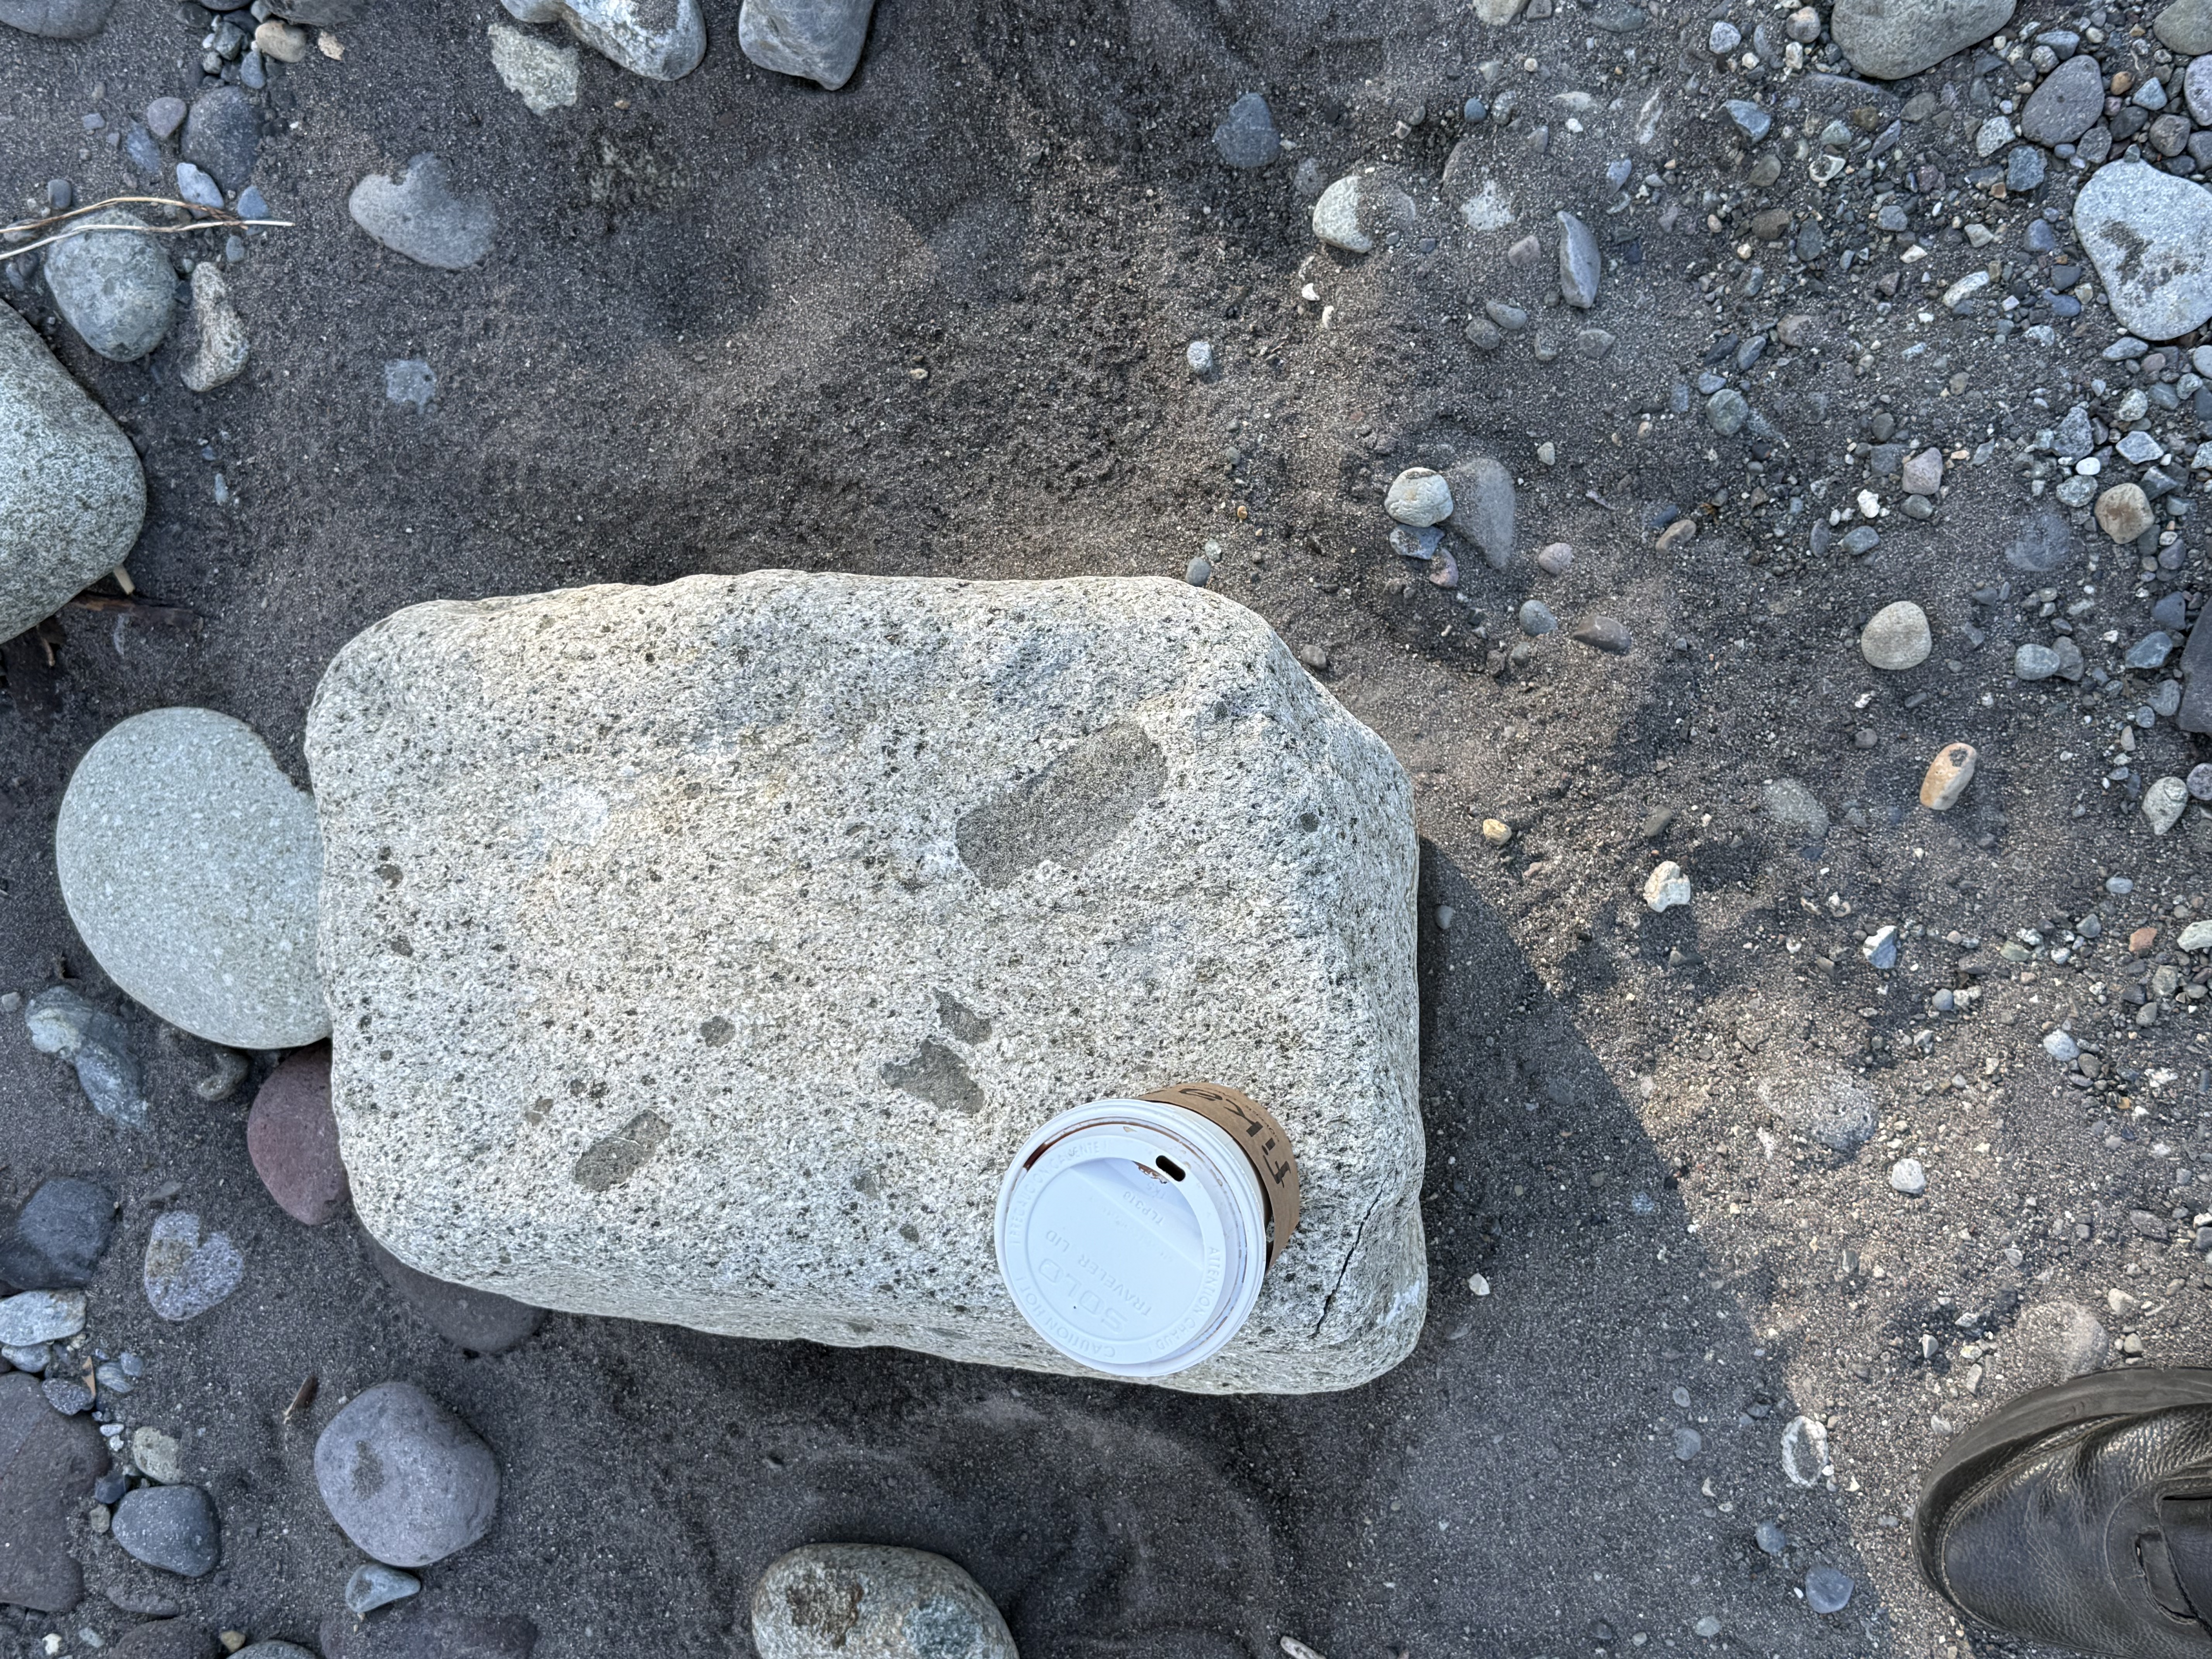
Figure 2. Our first stop was along the Carbon River near Orting (see Fig. 1A for location). River beds can be an excellent source of regional geology if they contain cobbles or boulders, which are good samples of source rock that may not be exposed.
This sample is of an intrusive igneous rock that contains lithic fragments (xenocrysts) of what looks like a darker, fine-grained rock. As magma moves upward through the crust, pieces of country rock are entrained, sometimes partially melting, but more often simple being captured by the cooling magma. This sample contains pieces of what I think is andesite. The host rock itself is probably also andesite, but its surface has been chemically weathered to form a white layer; this is a chemical process that involves the alteration of dark minerals like pyroxene and plagioclase into clays like kaolinite, which are light colored. Surface weathering also leeches out iron and magnesium, which darken a rock. This surface layer is usually only a few millimeters thick.
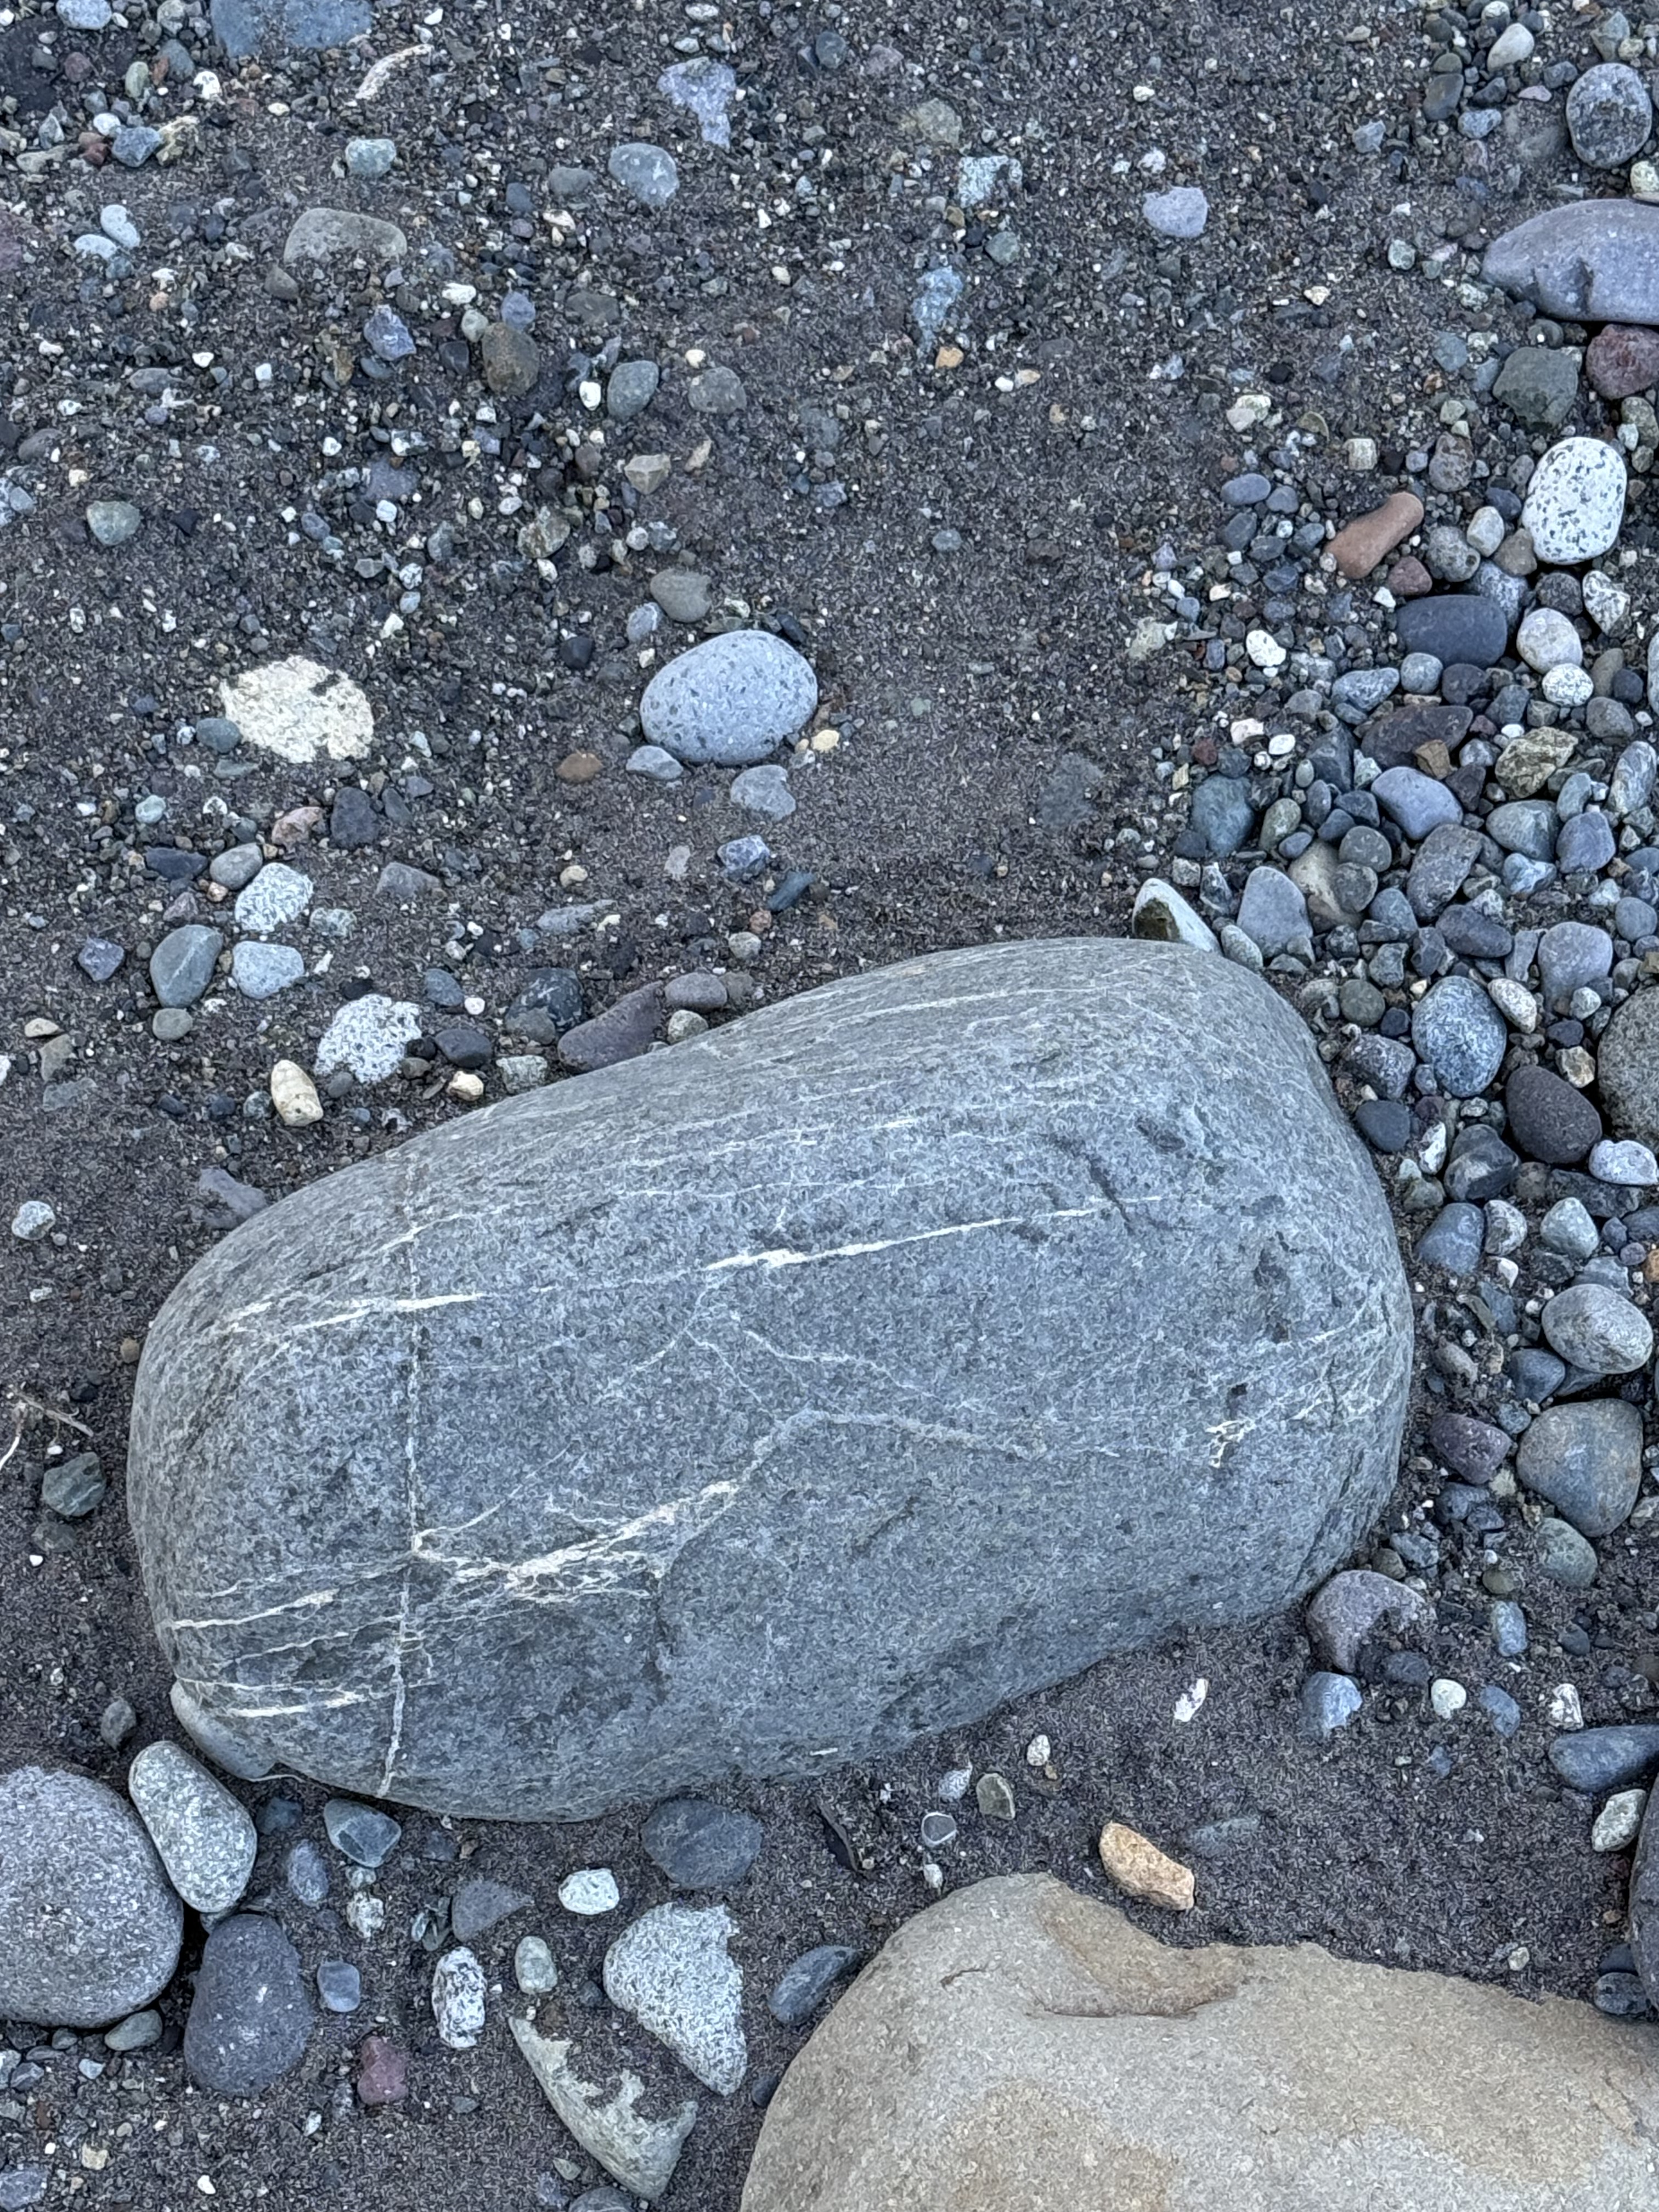
Figure 3. This sample tells a complex story. This is andesite (extrusive rock common to subduction zones), but any fractures within it were filled with magmatic fluids rich in Na, Ca and silica, by a later eruption. The result of this hydrothermal circulation is rocks that are neither extrusive nor intrusive; they are chemically altered by subsequent injections of magma at depths less than 1 mile, often even shallower.
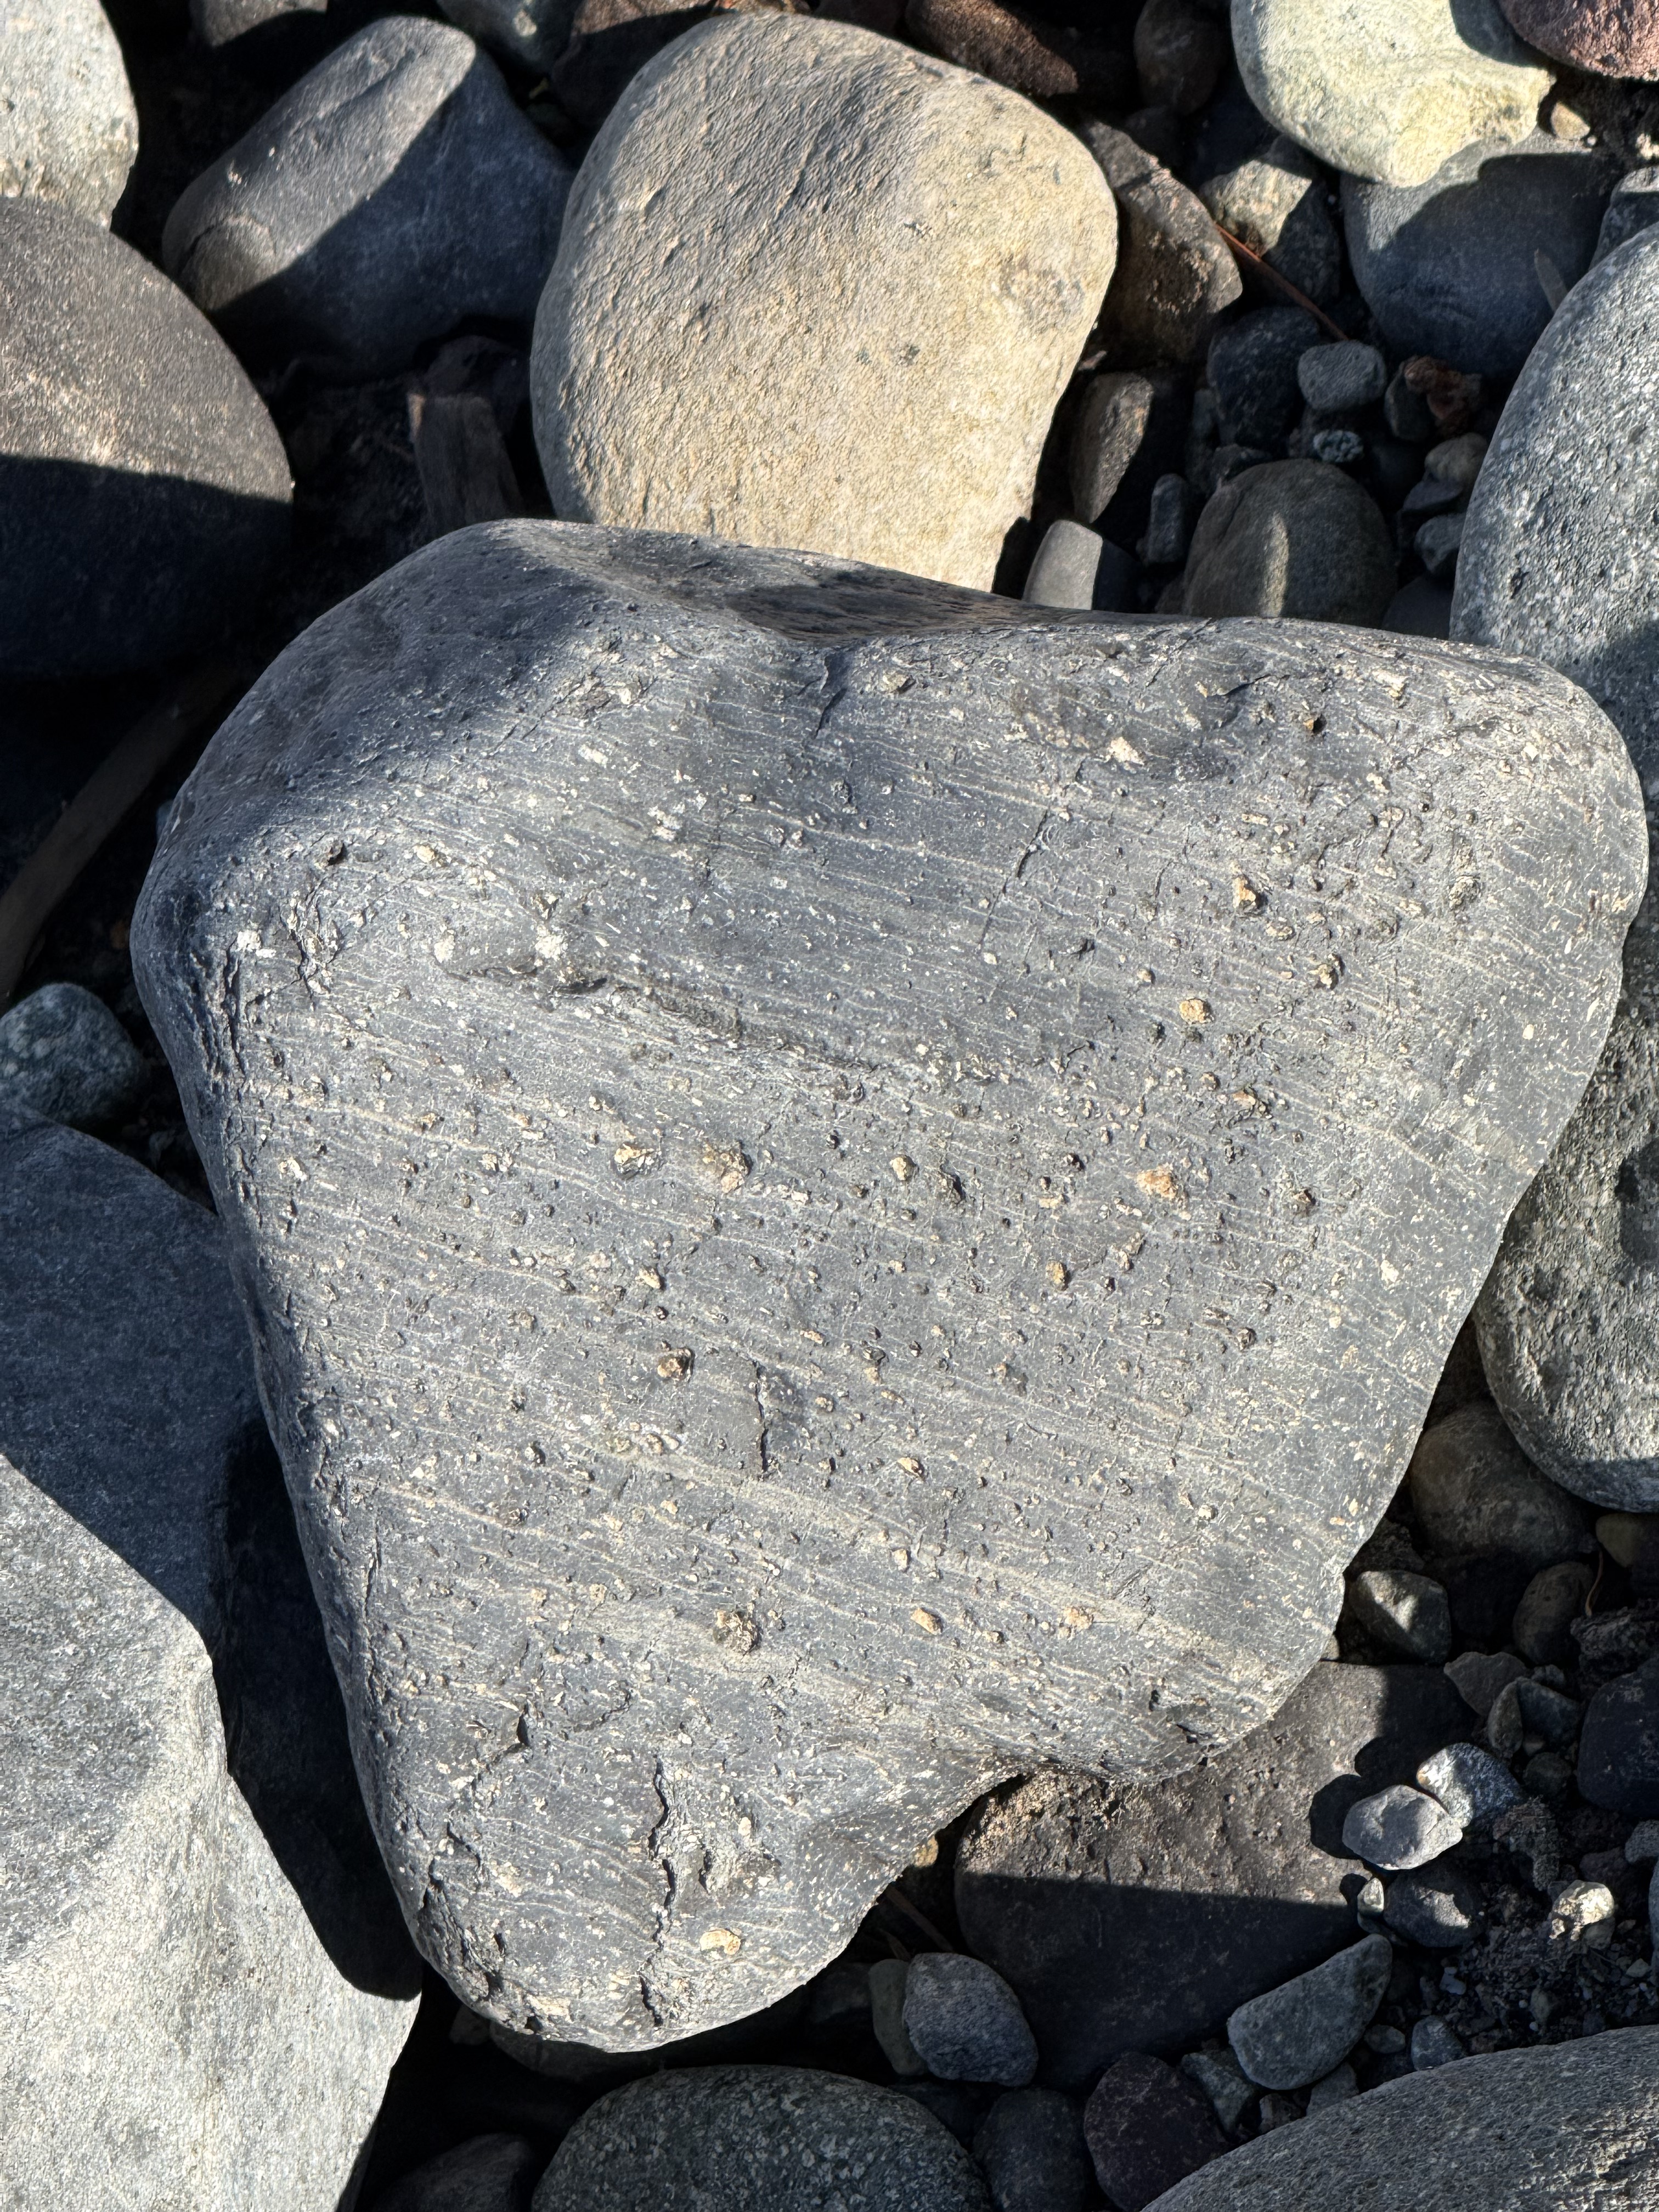
Figure 4. Another fascinating example, which tells a different tale. This andesite block wasn’t injected with magmatic fluids beneath the surface; this sample is the result of gaseous magma erupting within a few hundred yards of a vent. The laminae tell us that the composition was changing subtly on short time scales; this was the top of the boiling magma, and thus there was a lot of trapped gas (e.g. CO2, H2S) that formed the vesicles after the lava had settled–but not yet solidified.
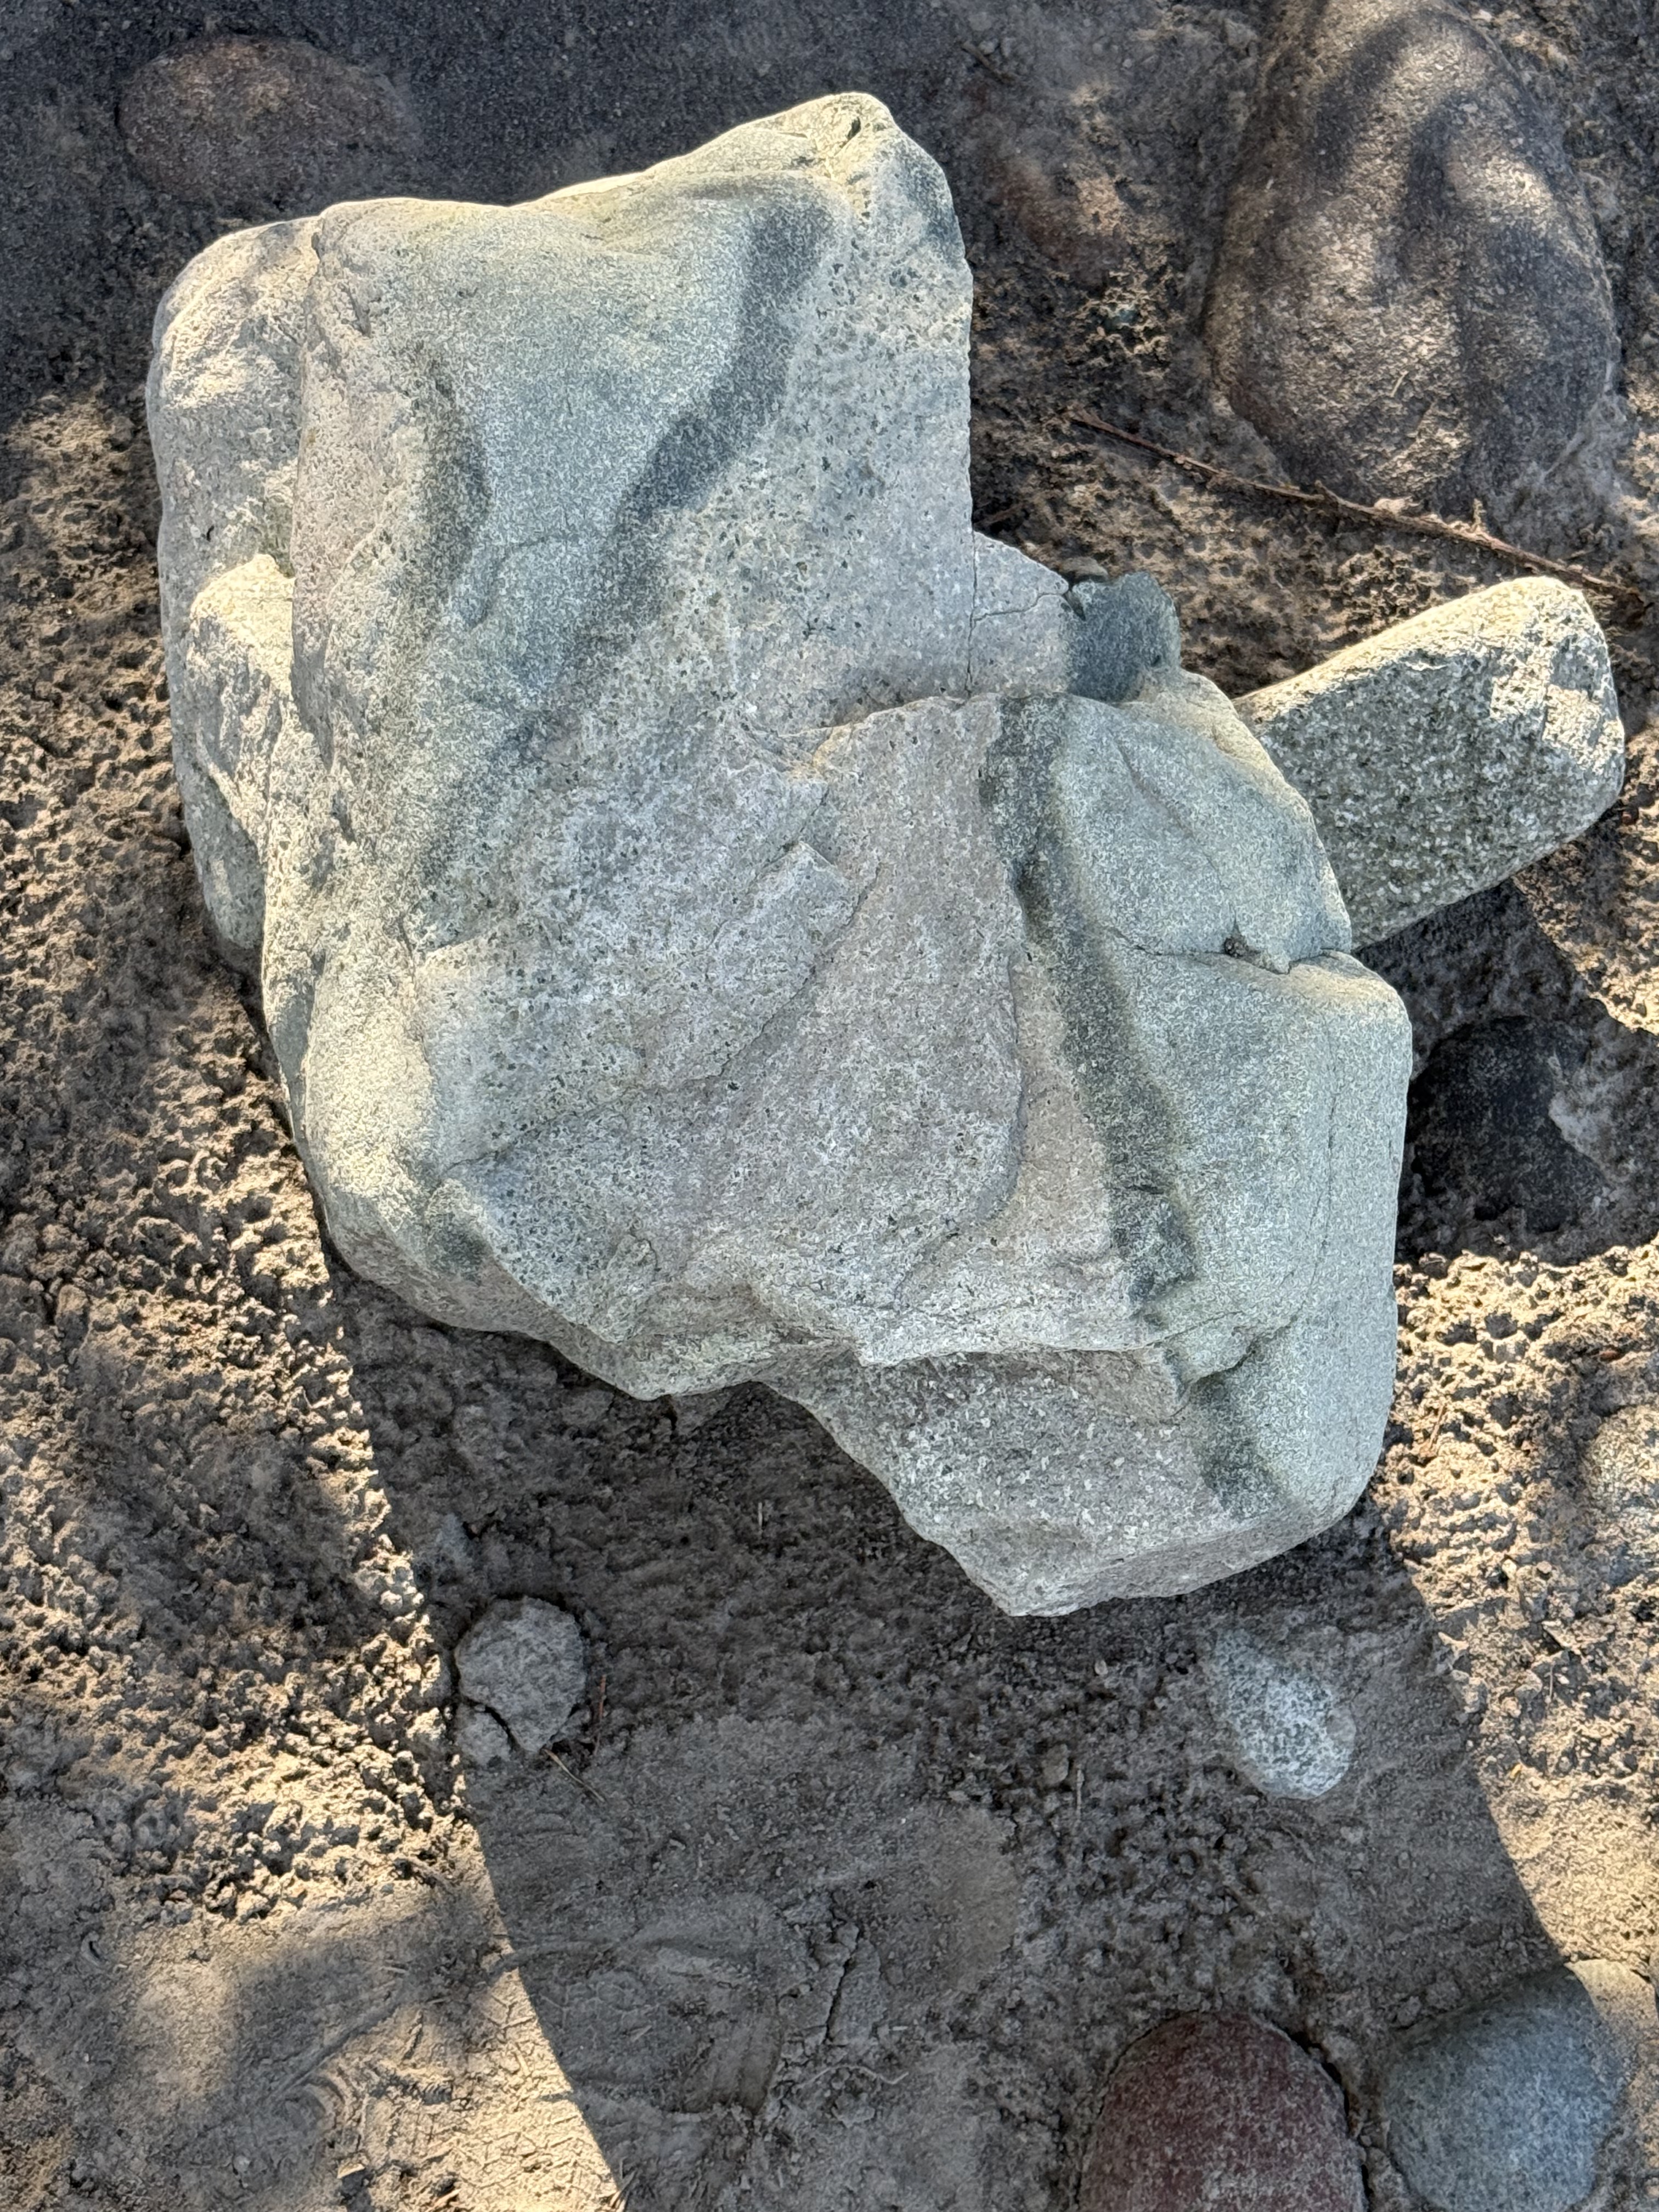
Figure 5. This irregular sample of andesite tells two stories: 1) The presence of phenocrysts (small white blebs at the bottom of the sample) implies slow cooling whereas the dark streaks imply a later stage of fast cooling, so that magmatic fluids with slightly different composition intermingled with the already hardening earlier stage. Imagine making taffy. 2) This sample wasn’t transported in the Carbon River more than a few miles. It would have broken along internal planes of weakness and become more like those we saw above. We aren’t far from the source.
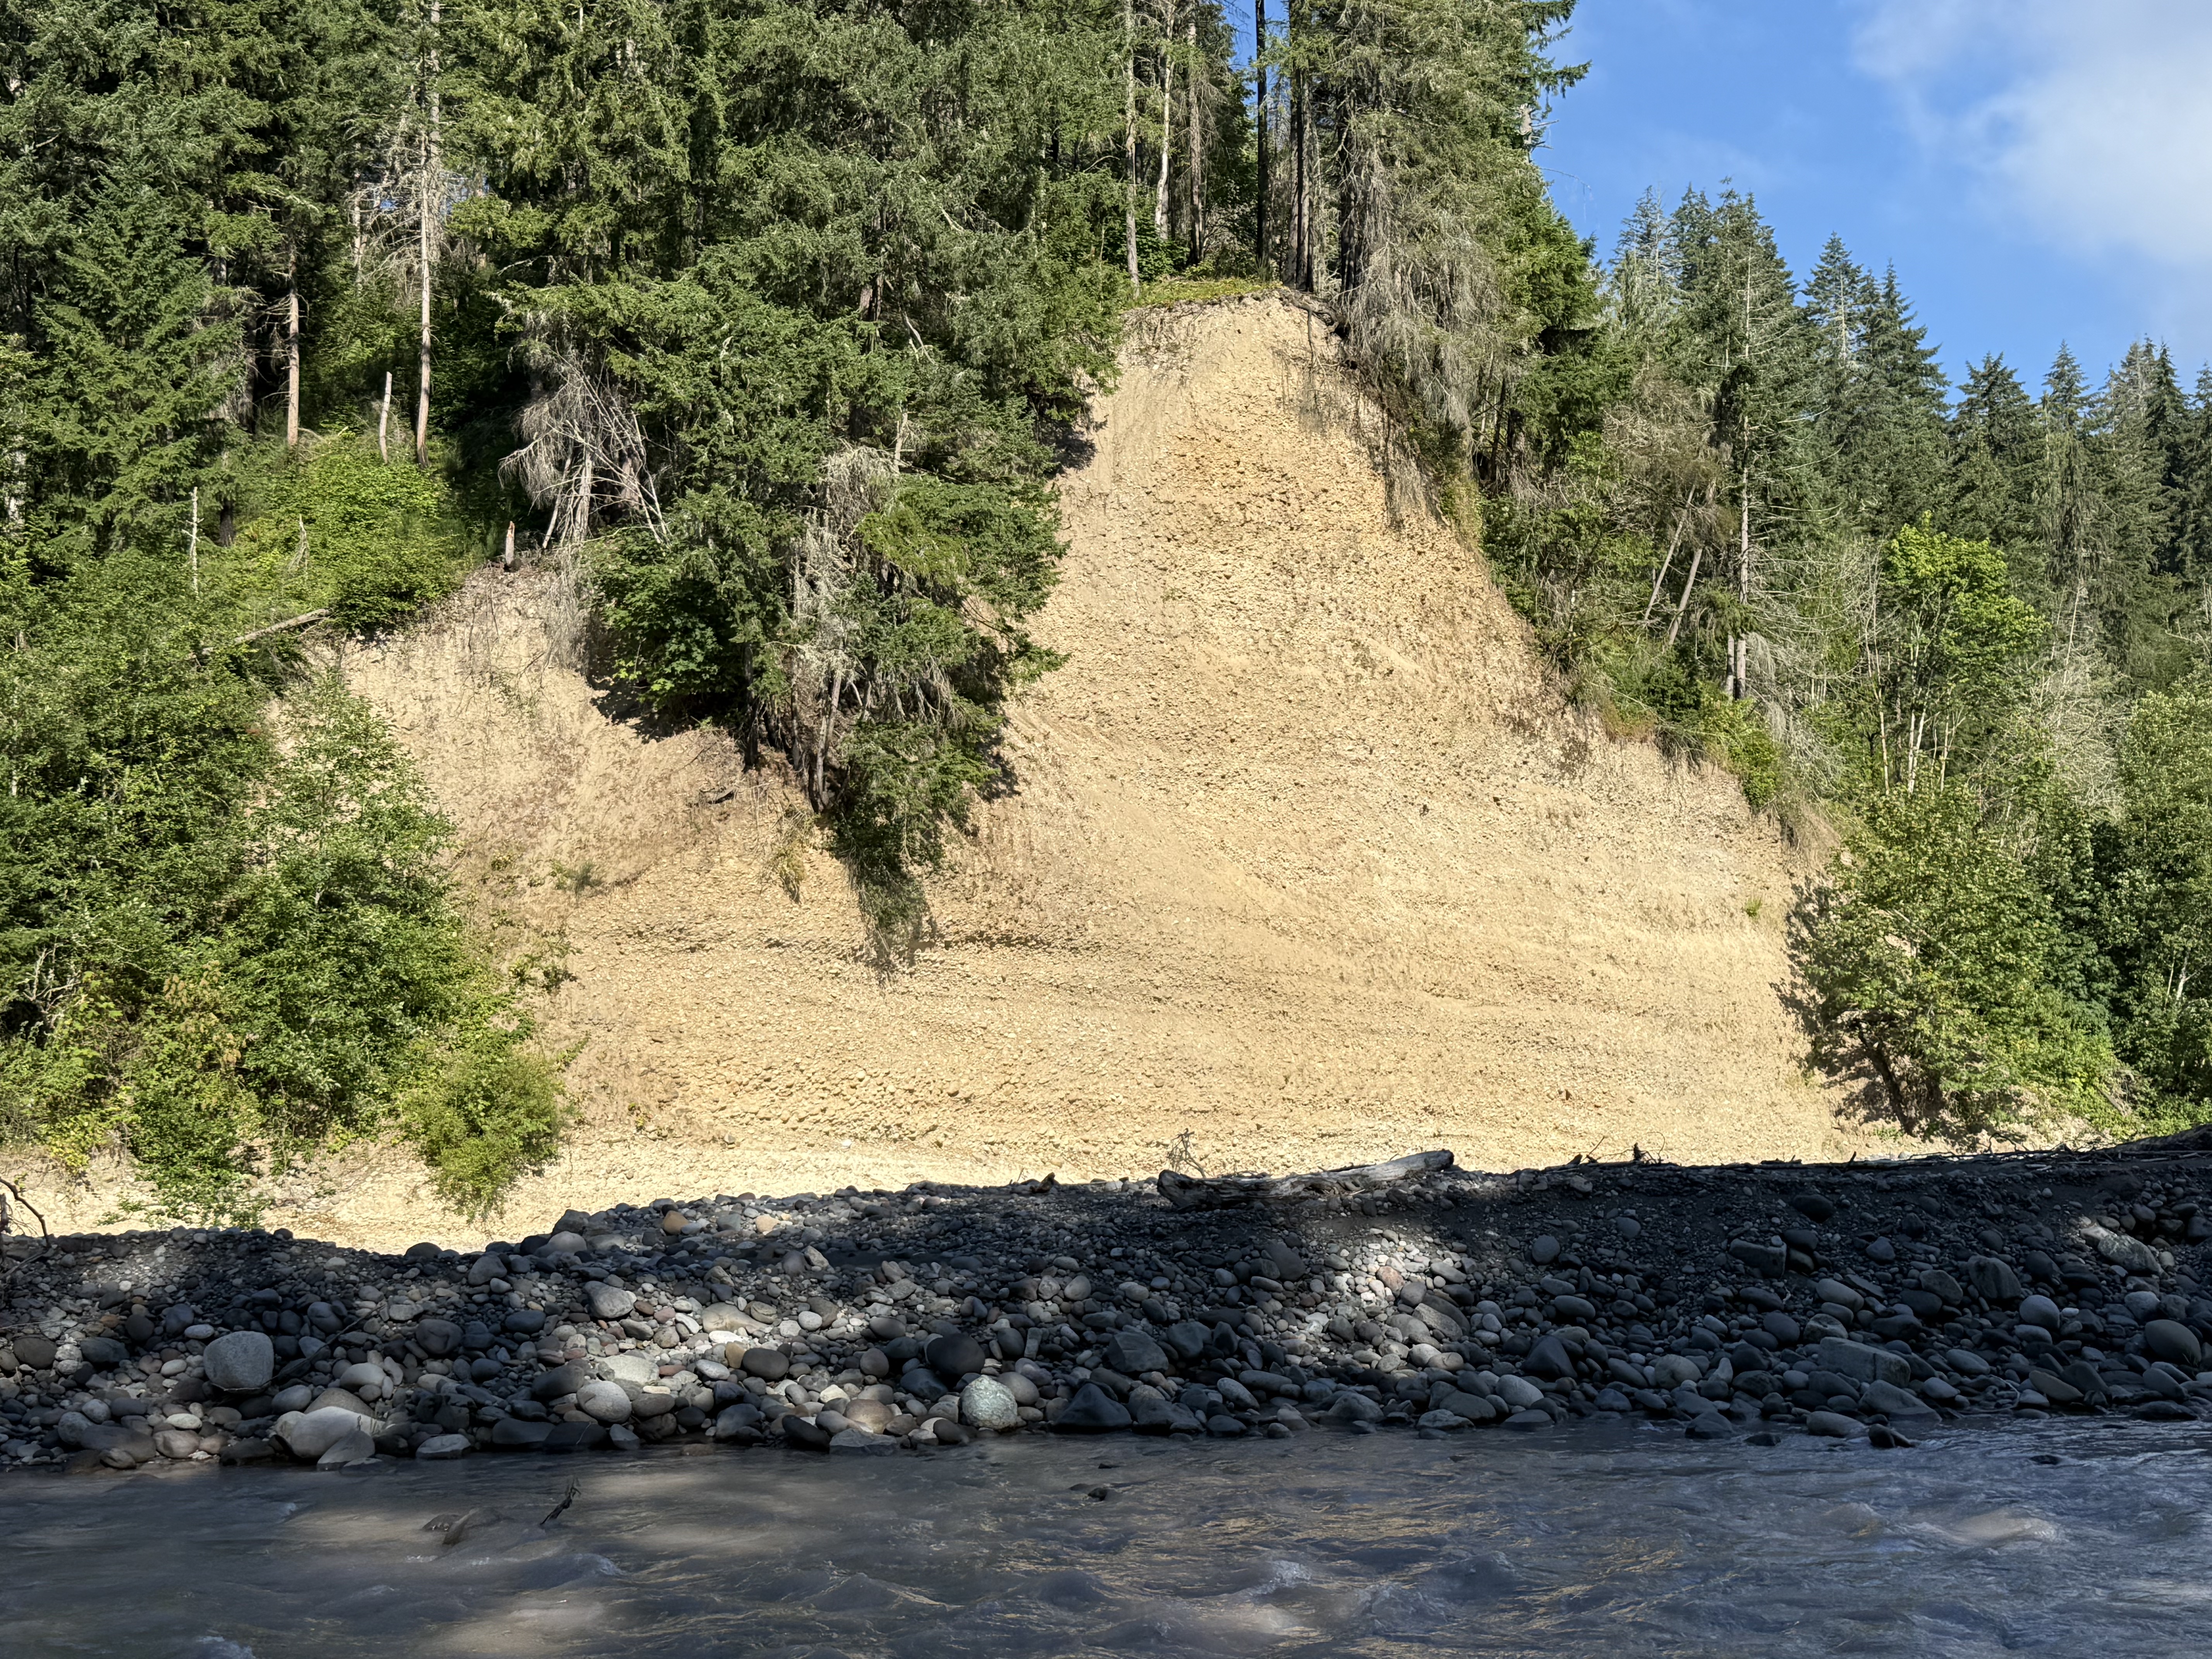
Figure 6. This is an excellent exposure in a cliff cut by the Carbon River. It could be dismissed as undifferentiated glacial till, but I’d like to give it a second thought: What if this location records the movement of continental glaciers through Puget Sound (i.e. the Vashon till), in addition to alpine glaciers moving down from the Cascades? Could we even tell the difference?
The bottom of this section contains cobbles in a sandy matrix deposited horizontally. The middle part is finer, as seen in the absence of large cobbles, but a channel containing larger clasts is visible in the center of the photo, forming a “V” that points towards the bright spot in the modern channel, slightly right of the center of the photo. The depositional environment must have changed quickly to produce such a contrast in lithology.
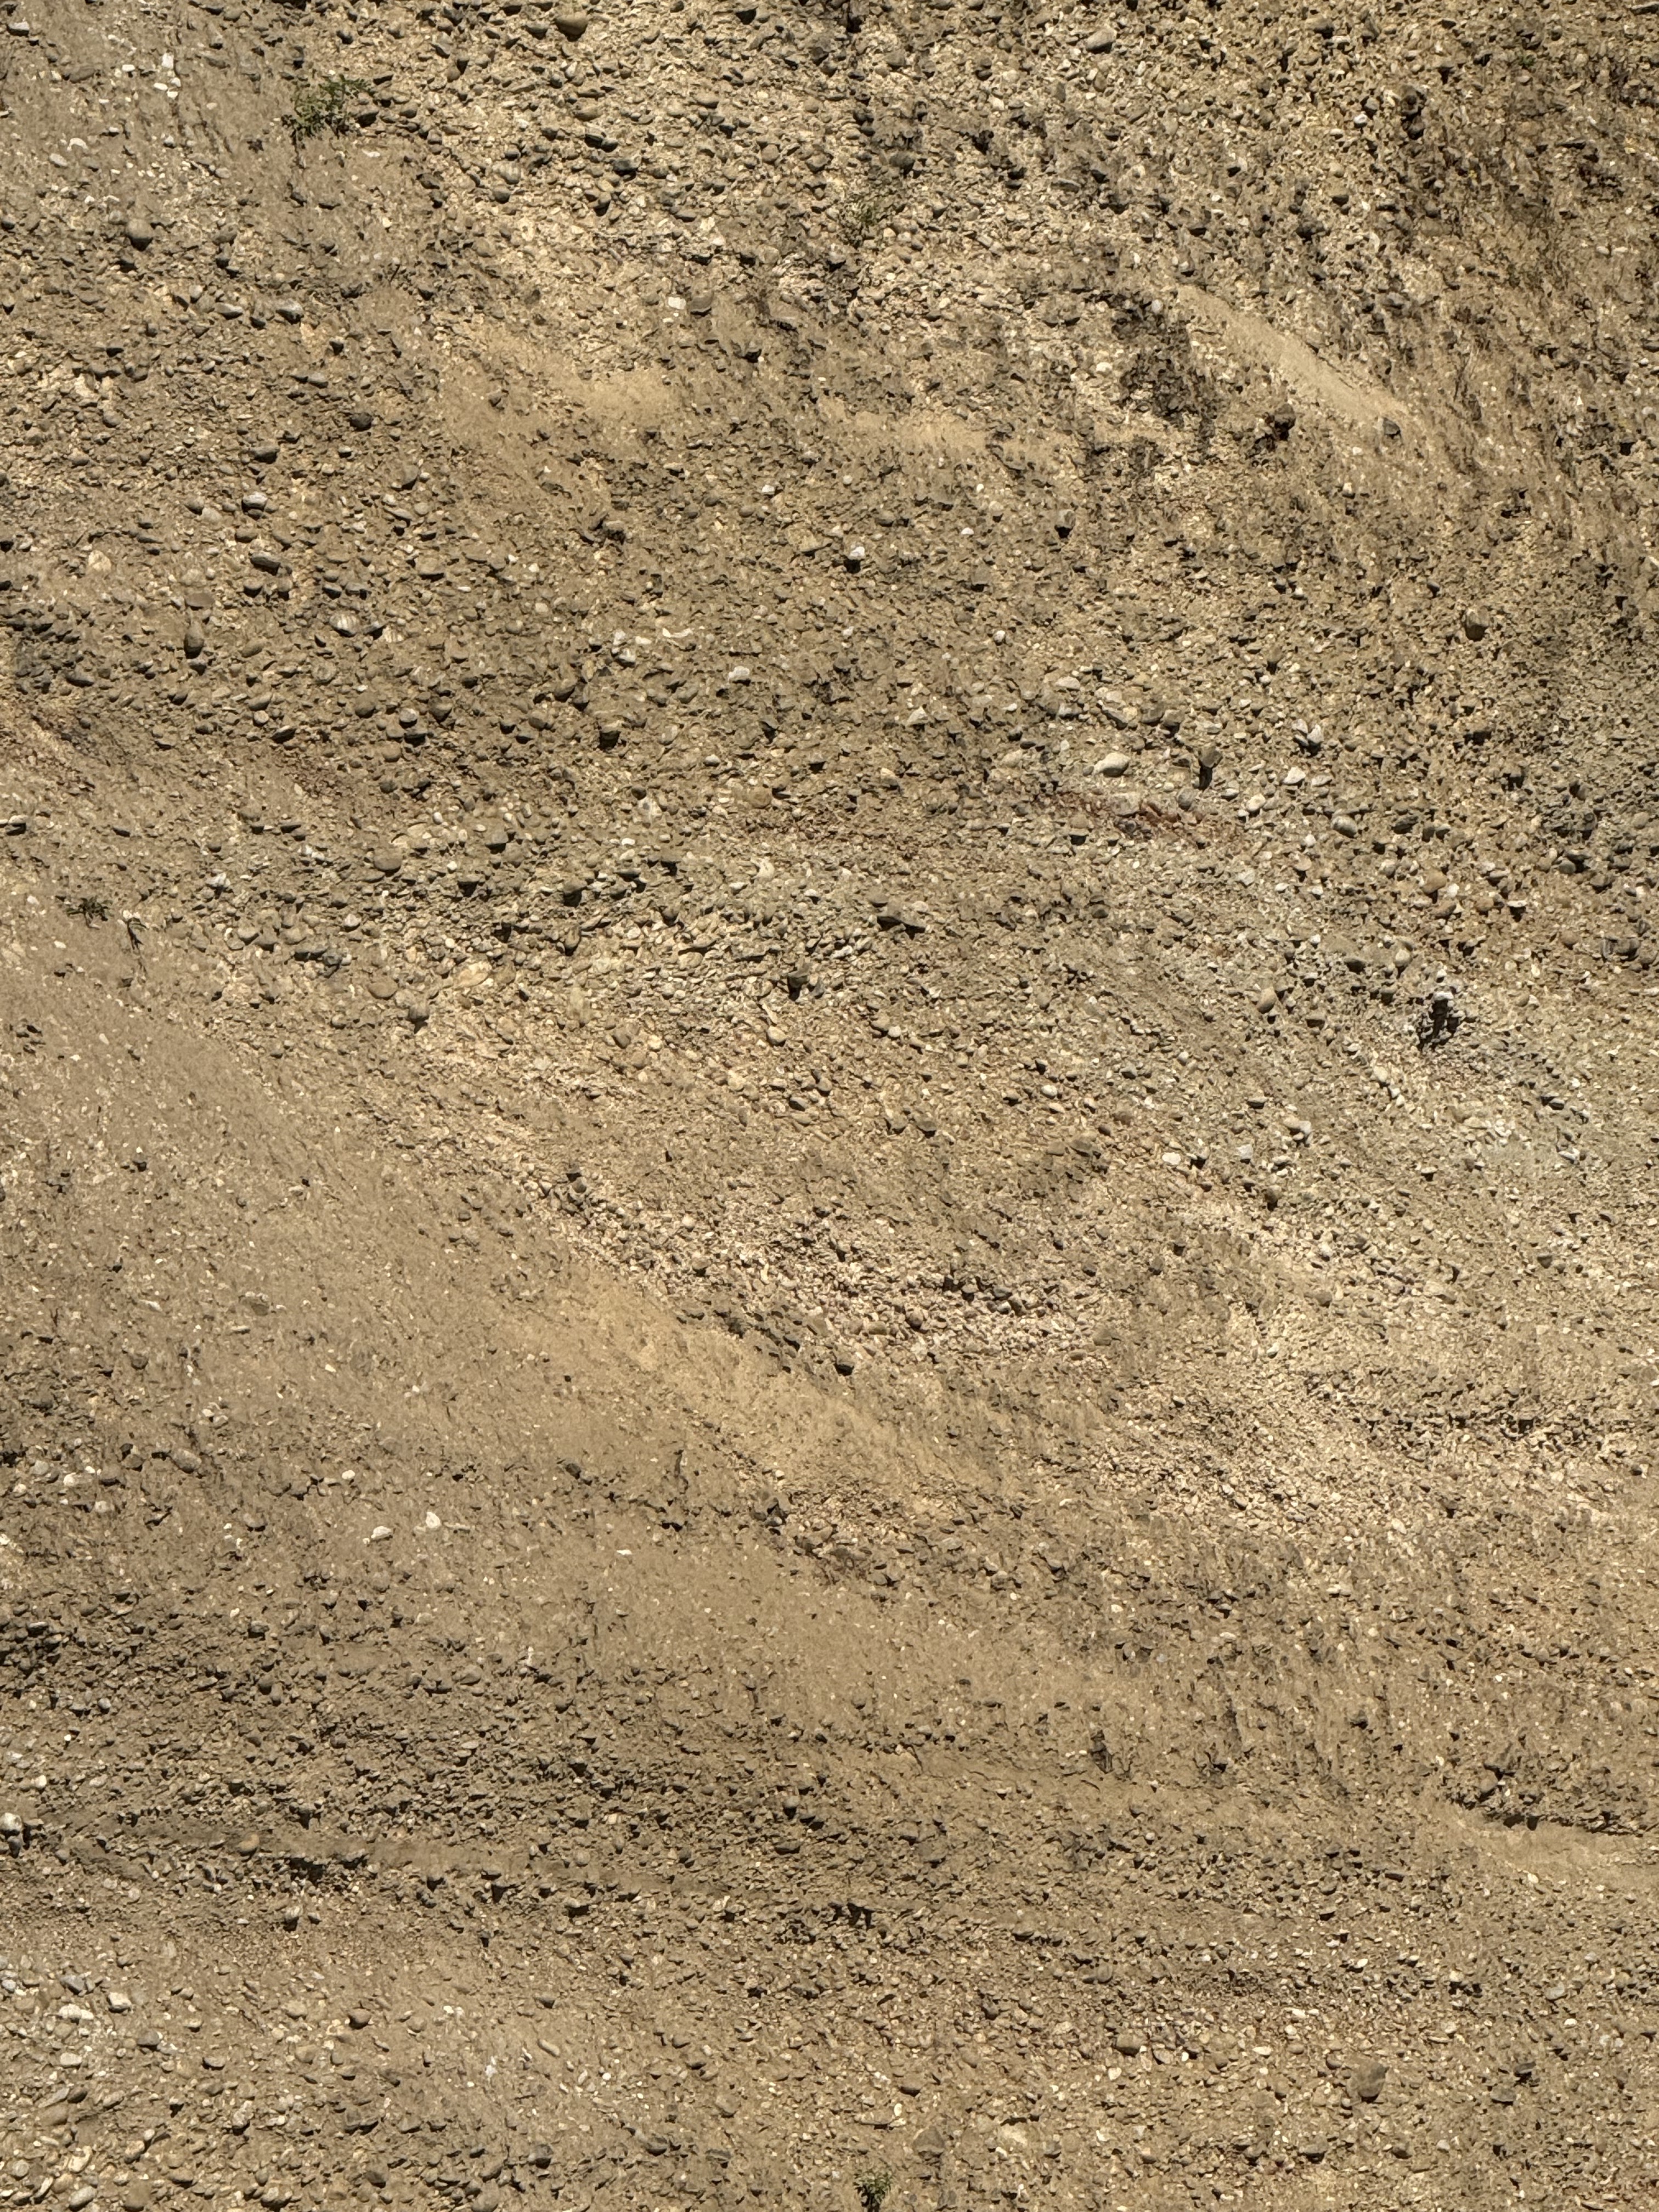
Figure 7. This is a close-up of the center of the cliff in Fig. 6, focusing on the contact between finer, sandier sediment to the left, and coarse material in the upper right. The unconformity contact between them was created by erosion, either by a glacier or a river like the modern Carbon River. Note the change in bedding between the lower part of the exposure and the irregular layers above the unconformity. The lower section reveals a fining-upward sequence; but this was partially removed and the entire upper part of the section is dominated by conglomerate.
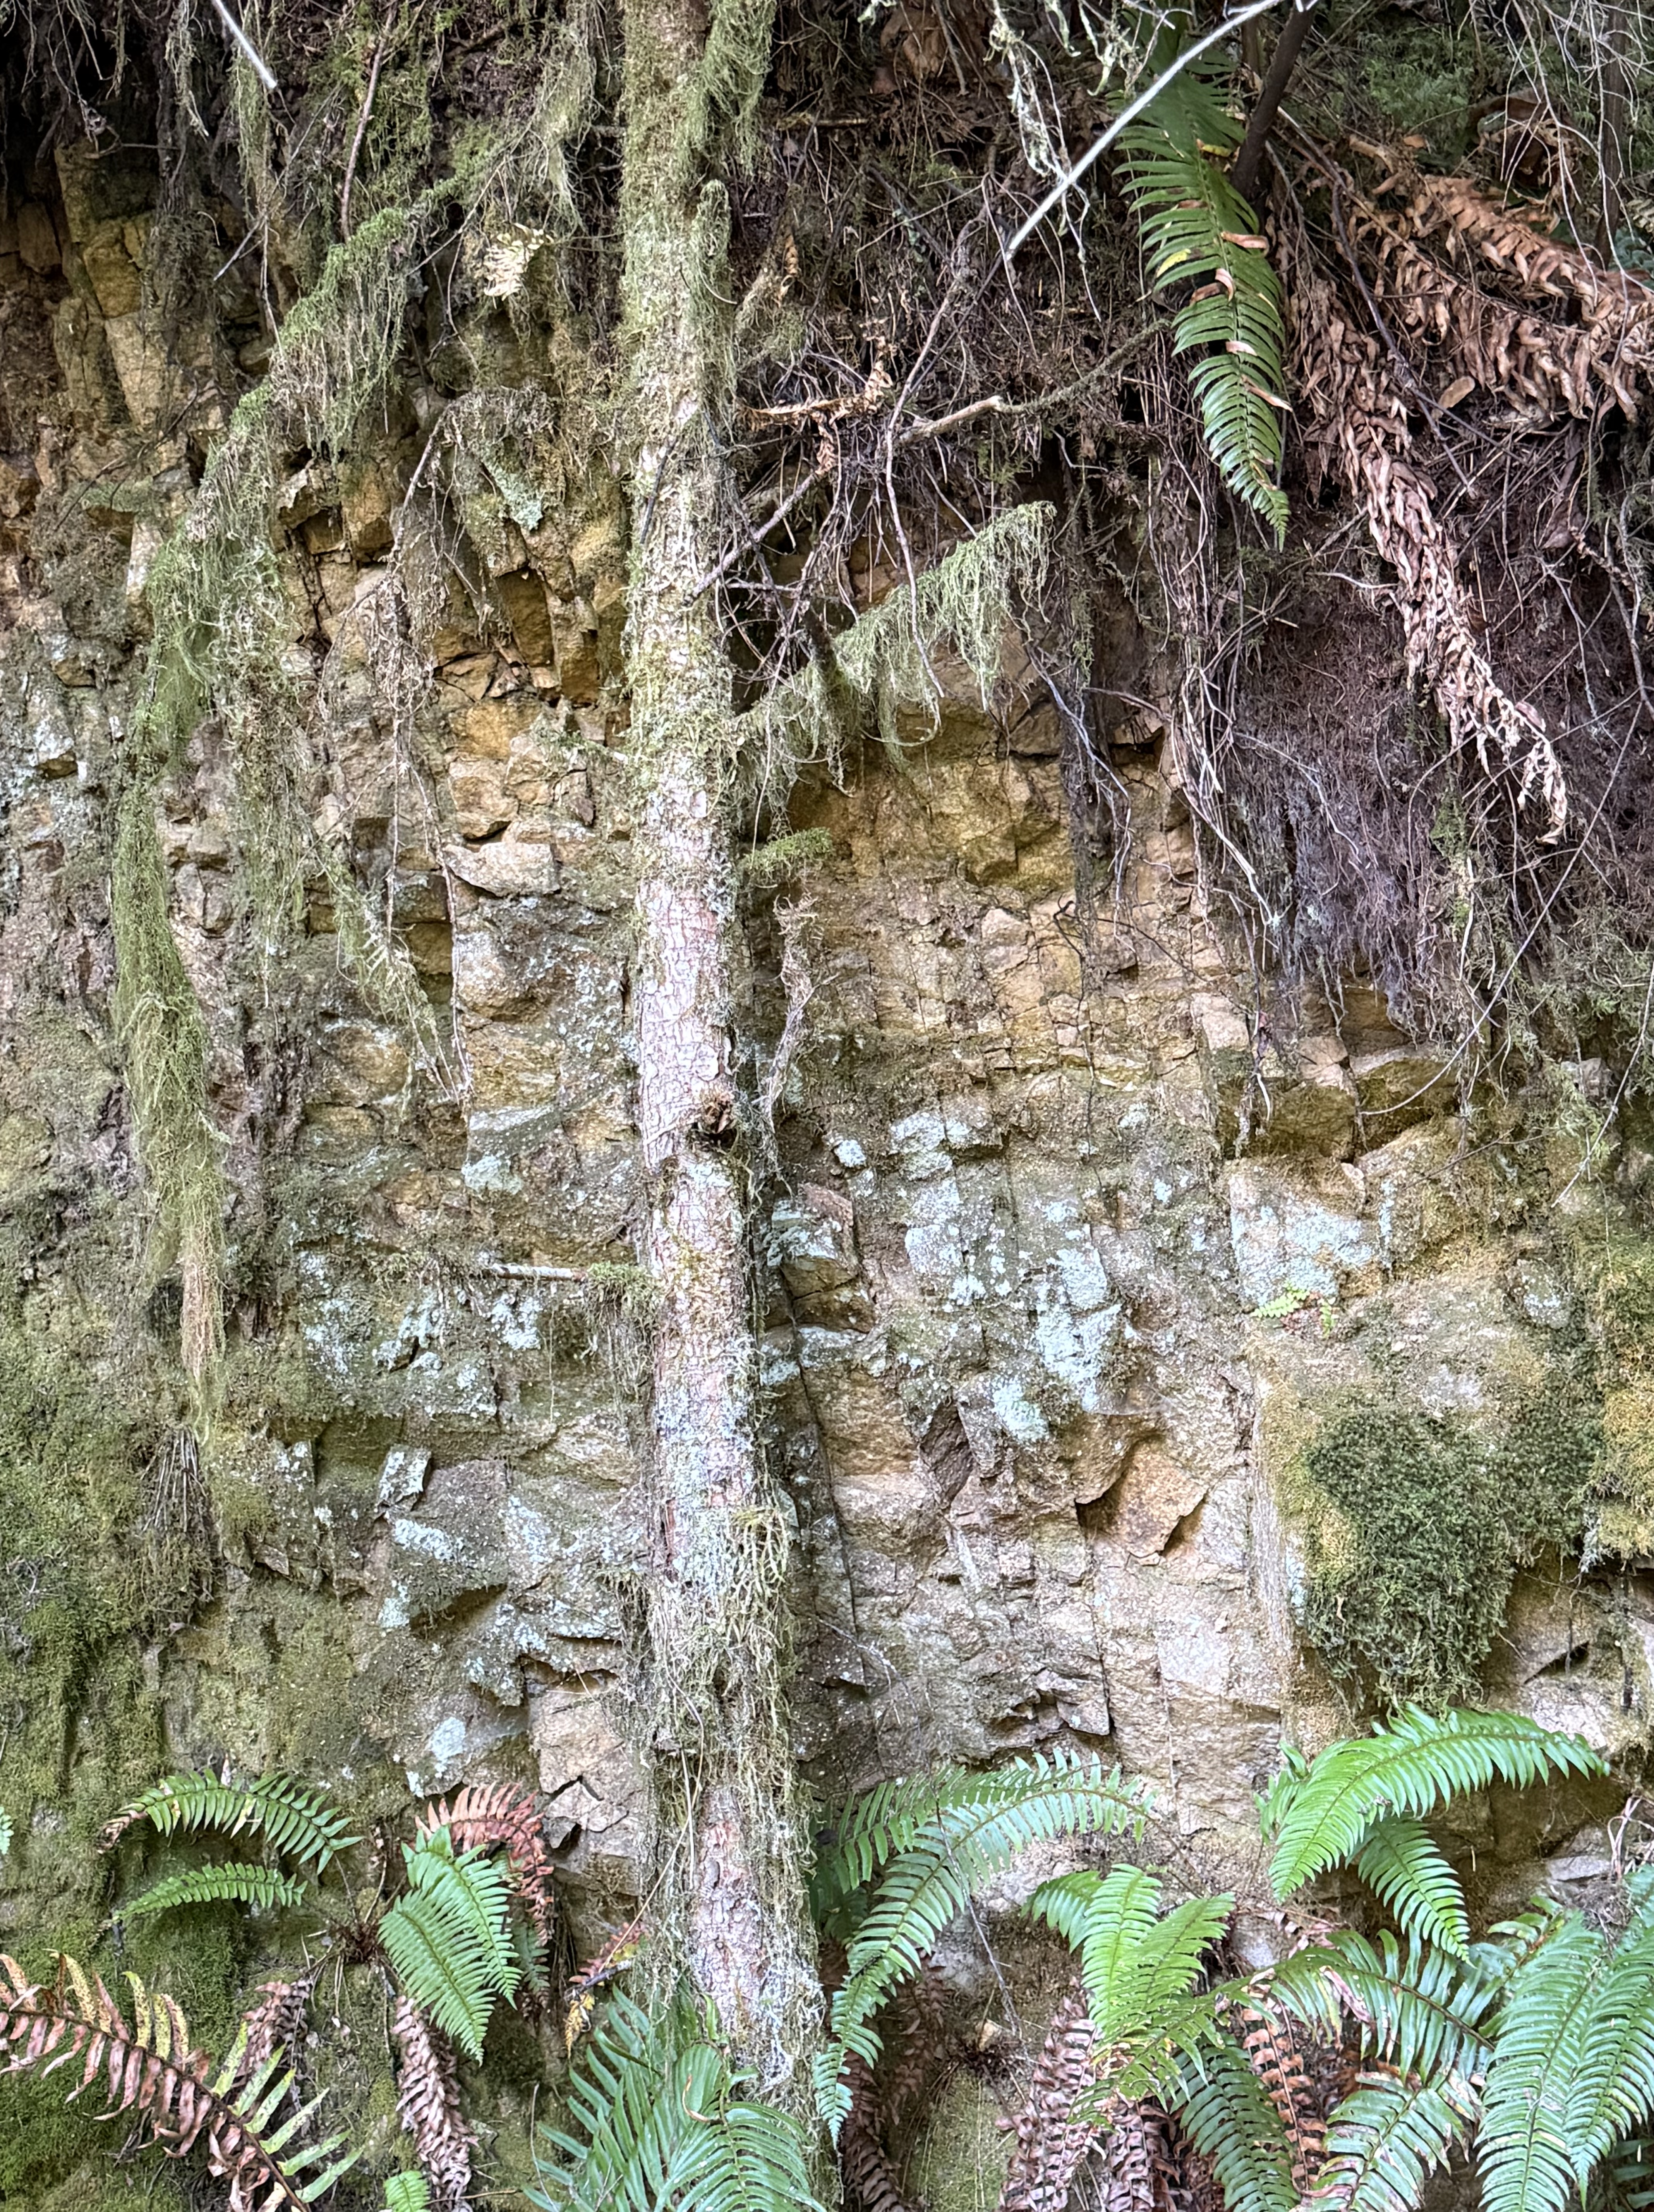
Figure 8. This photo was taken about halfway between Carbonado and the bridge (the star and triangle in Fig. 2B, respectively). The river was about 100 feet lower than the trail at this point. These bedded rocks are nearly vertical, as indicated by the dark, nearly vertical lines. They are Eocene terrestrial sediments that have been faulted and folded into their current orientation. They were probably deformed when the faults seen in Fig. 2C (thin lines on the geological map) were active.
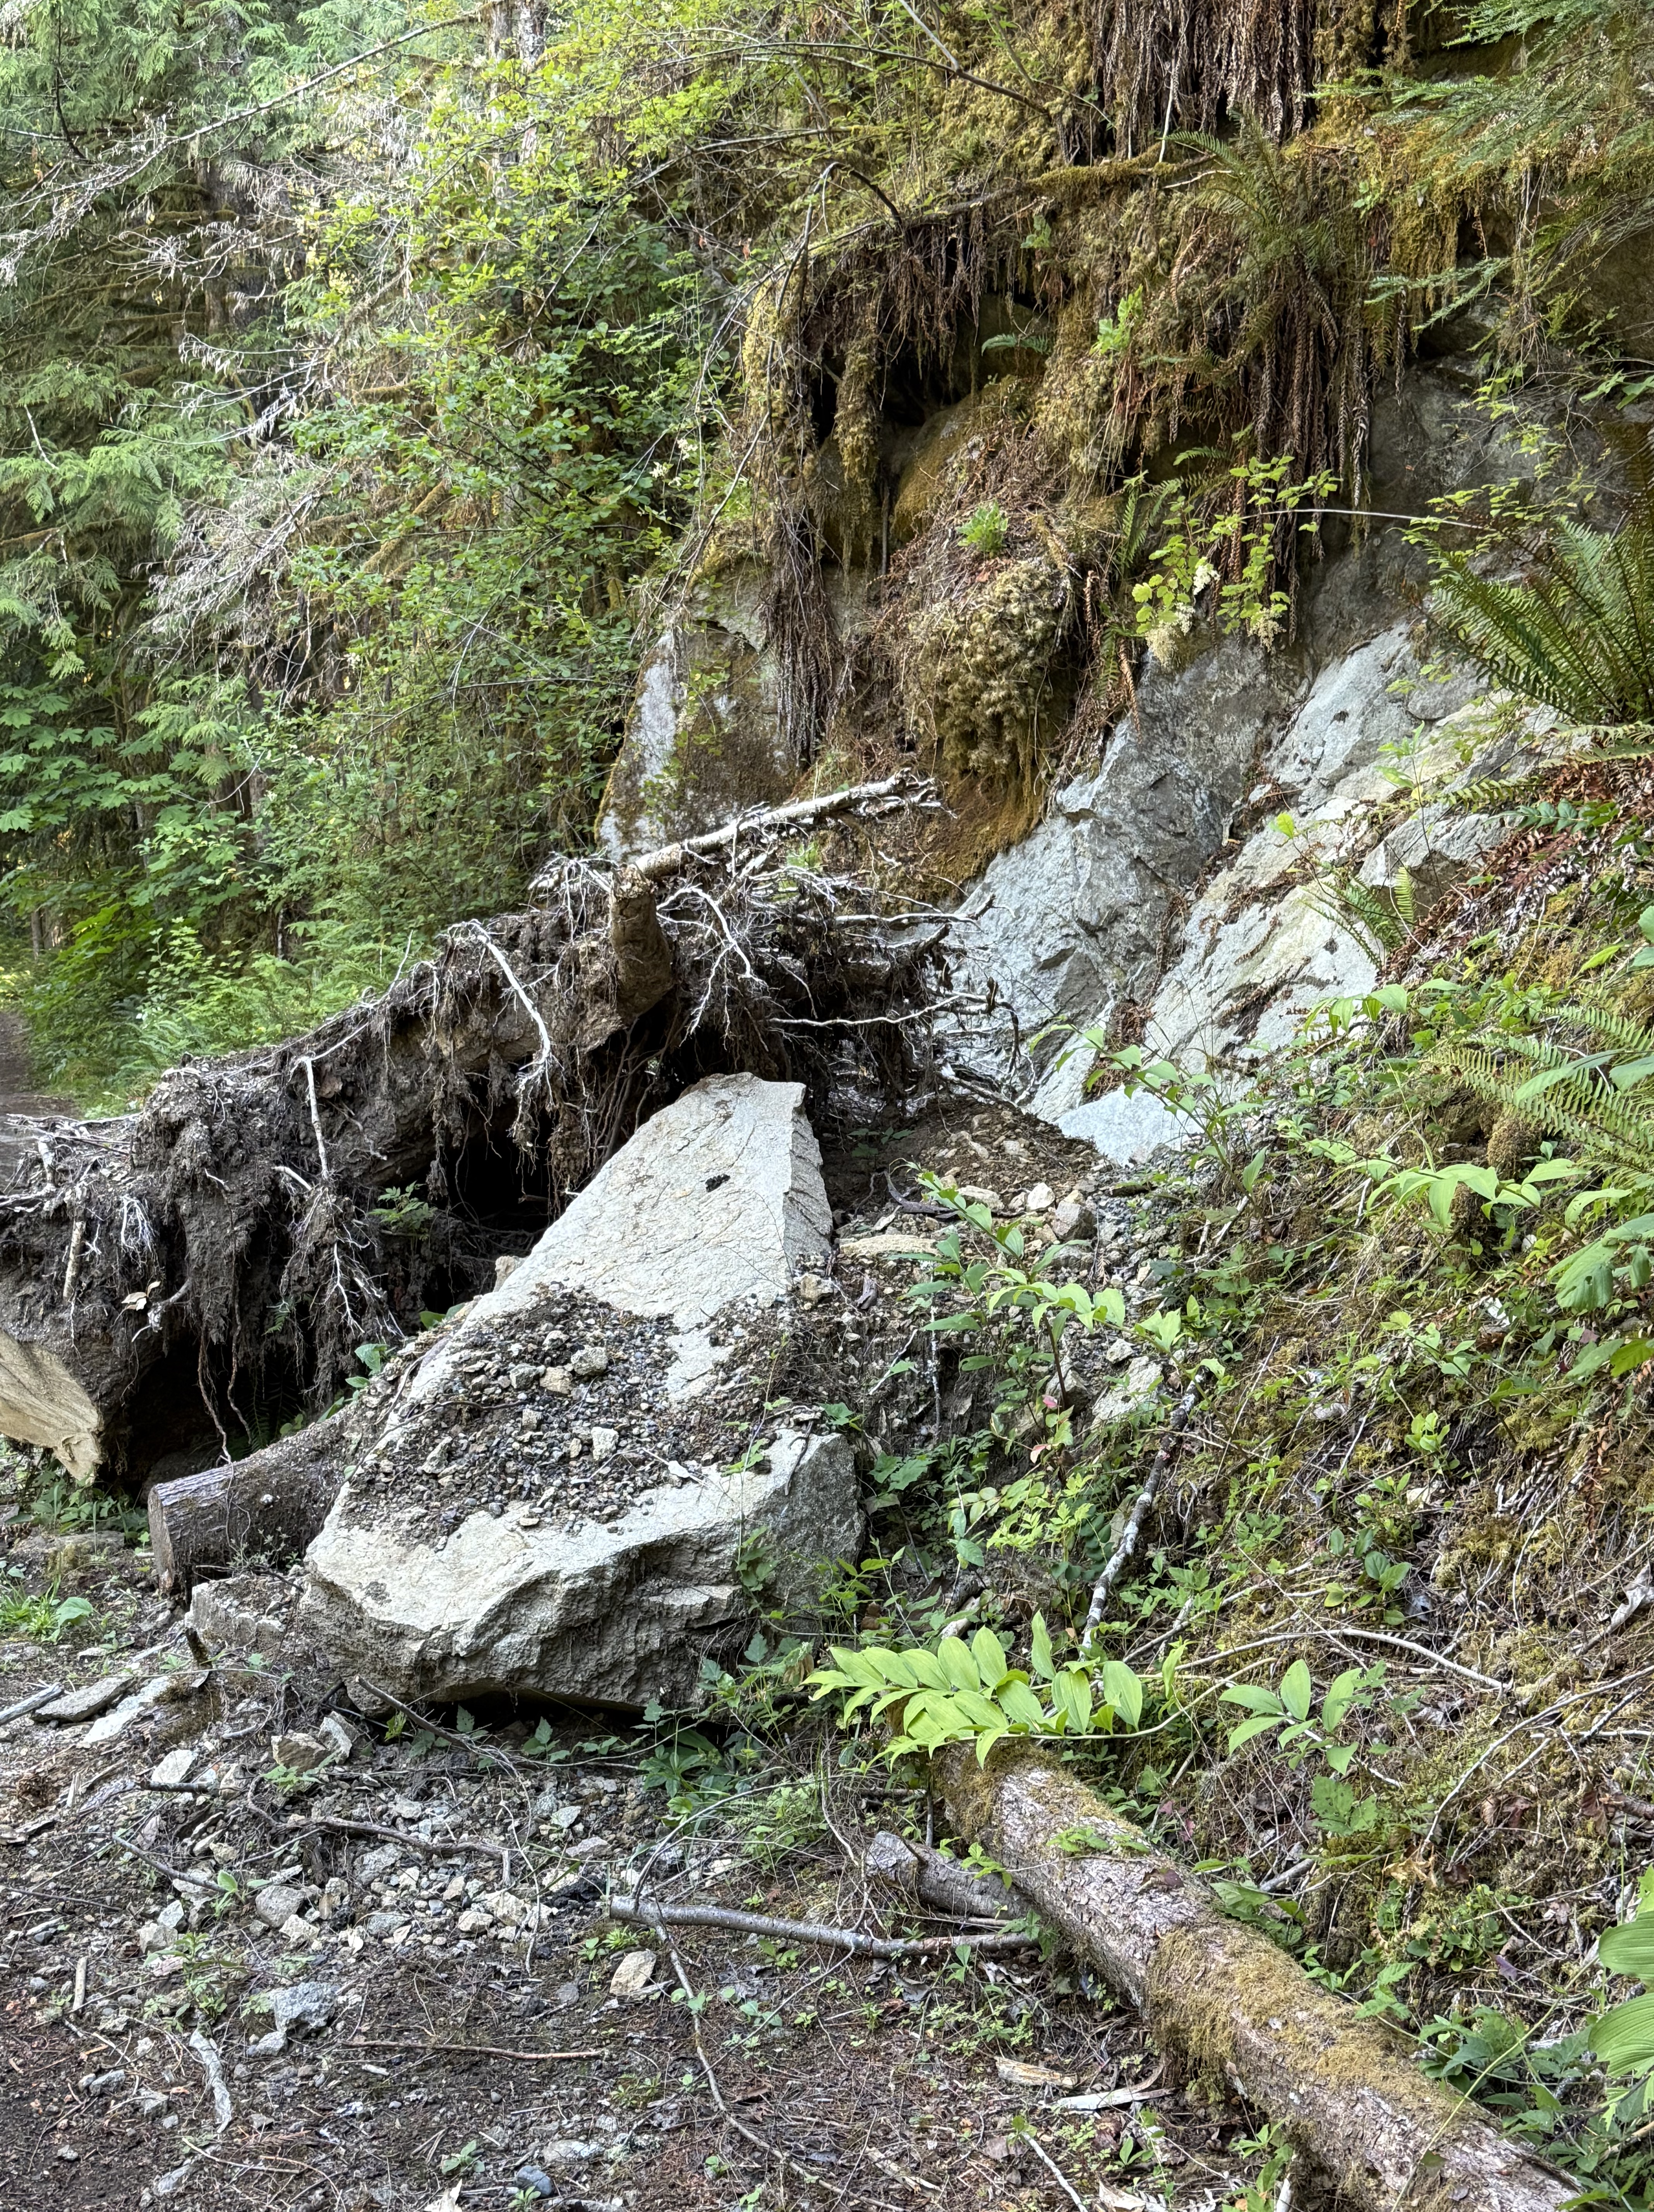
Figure 9. Further along the trail we encountered this small landslide. A tree that had rooted in cracks within the sedimentary rocks fell along with a piece (about 10 feet long) of rock. This is a great example of how erosion is a continuous process that never rests, inexorably removing mountains and transporting them to the sea.
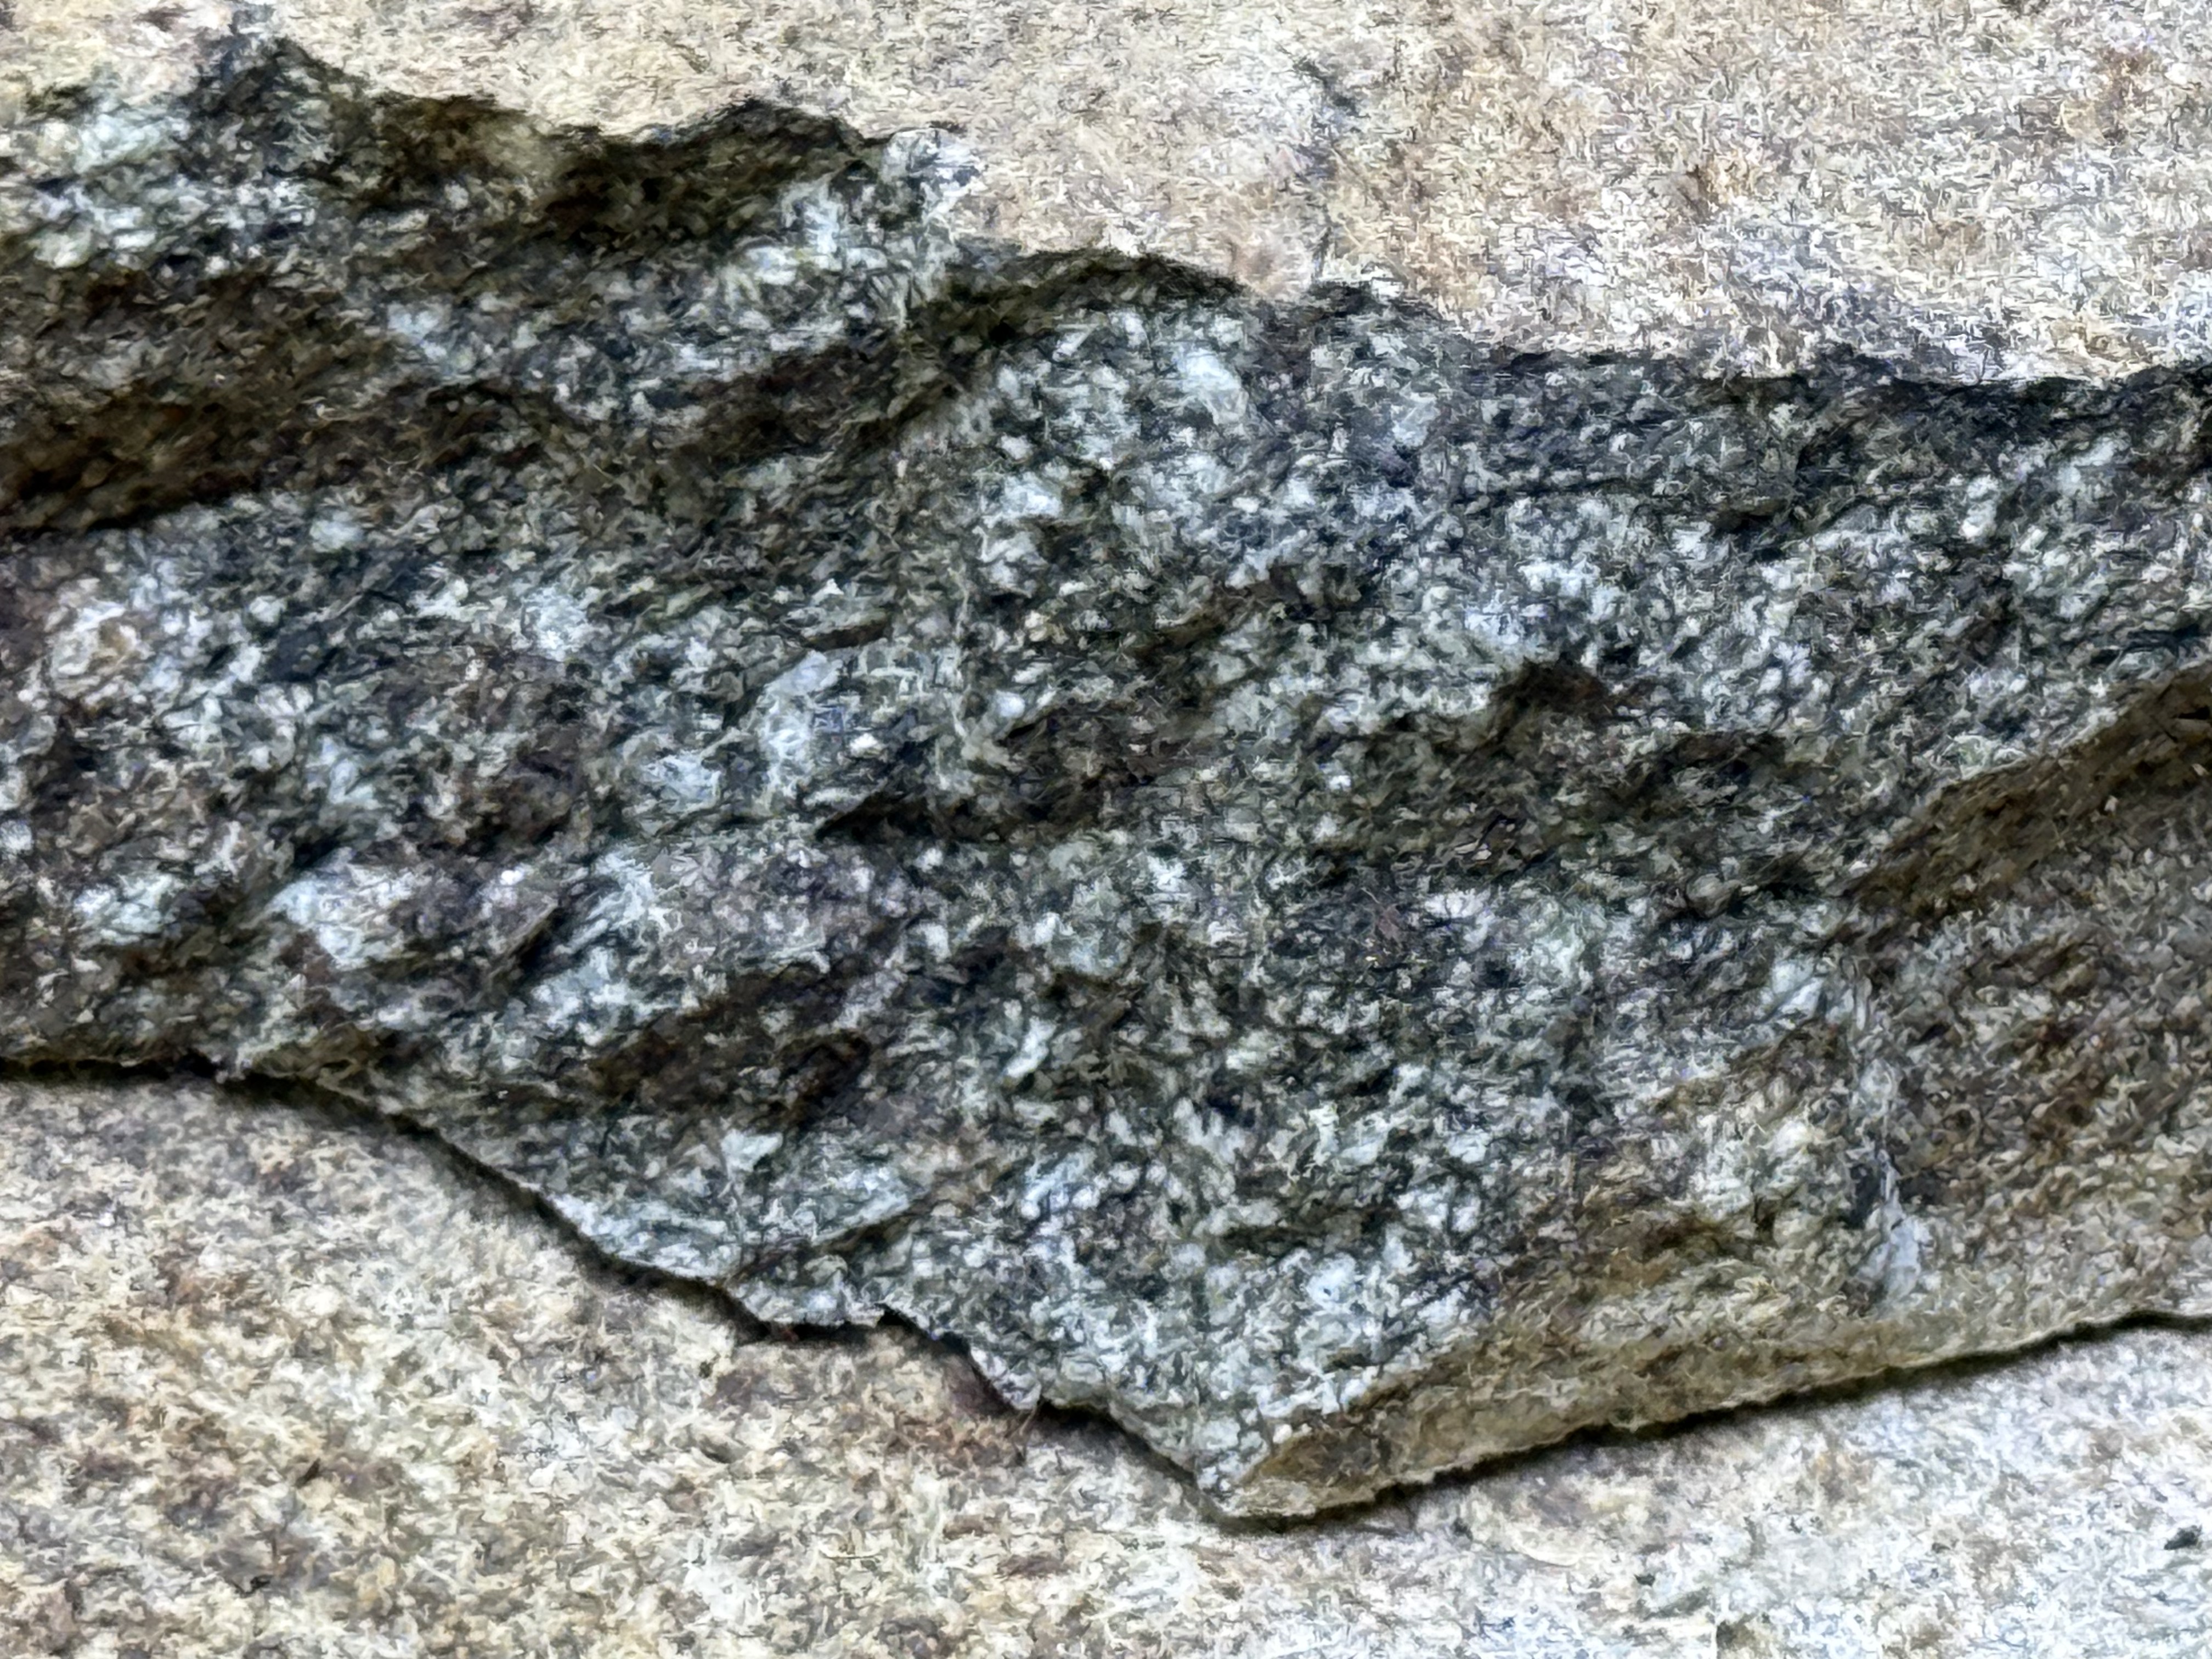
Figure 10. To the naked eye, this close-up of a recently broken piece of the slab in Fig. 9 looks like an intrusive, igneous rock, but it absolutely is not! Ignoring the dark coloration, which is either an organic stain or weathering product, I would say this is probably a coarse sandstone, possibly even a breccia or conglomerate. Breaking it with a rock hammer, to produce a fresh surface, would make identification easy; but we don’t do that in Rocks and (no) Roads. We use the geologic map instead.
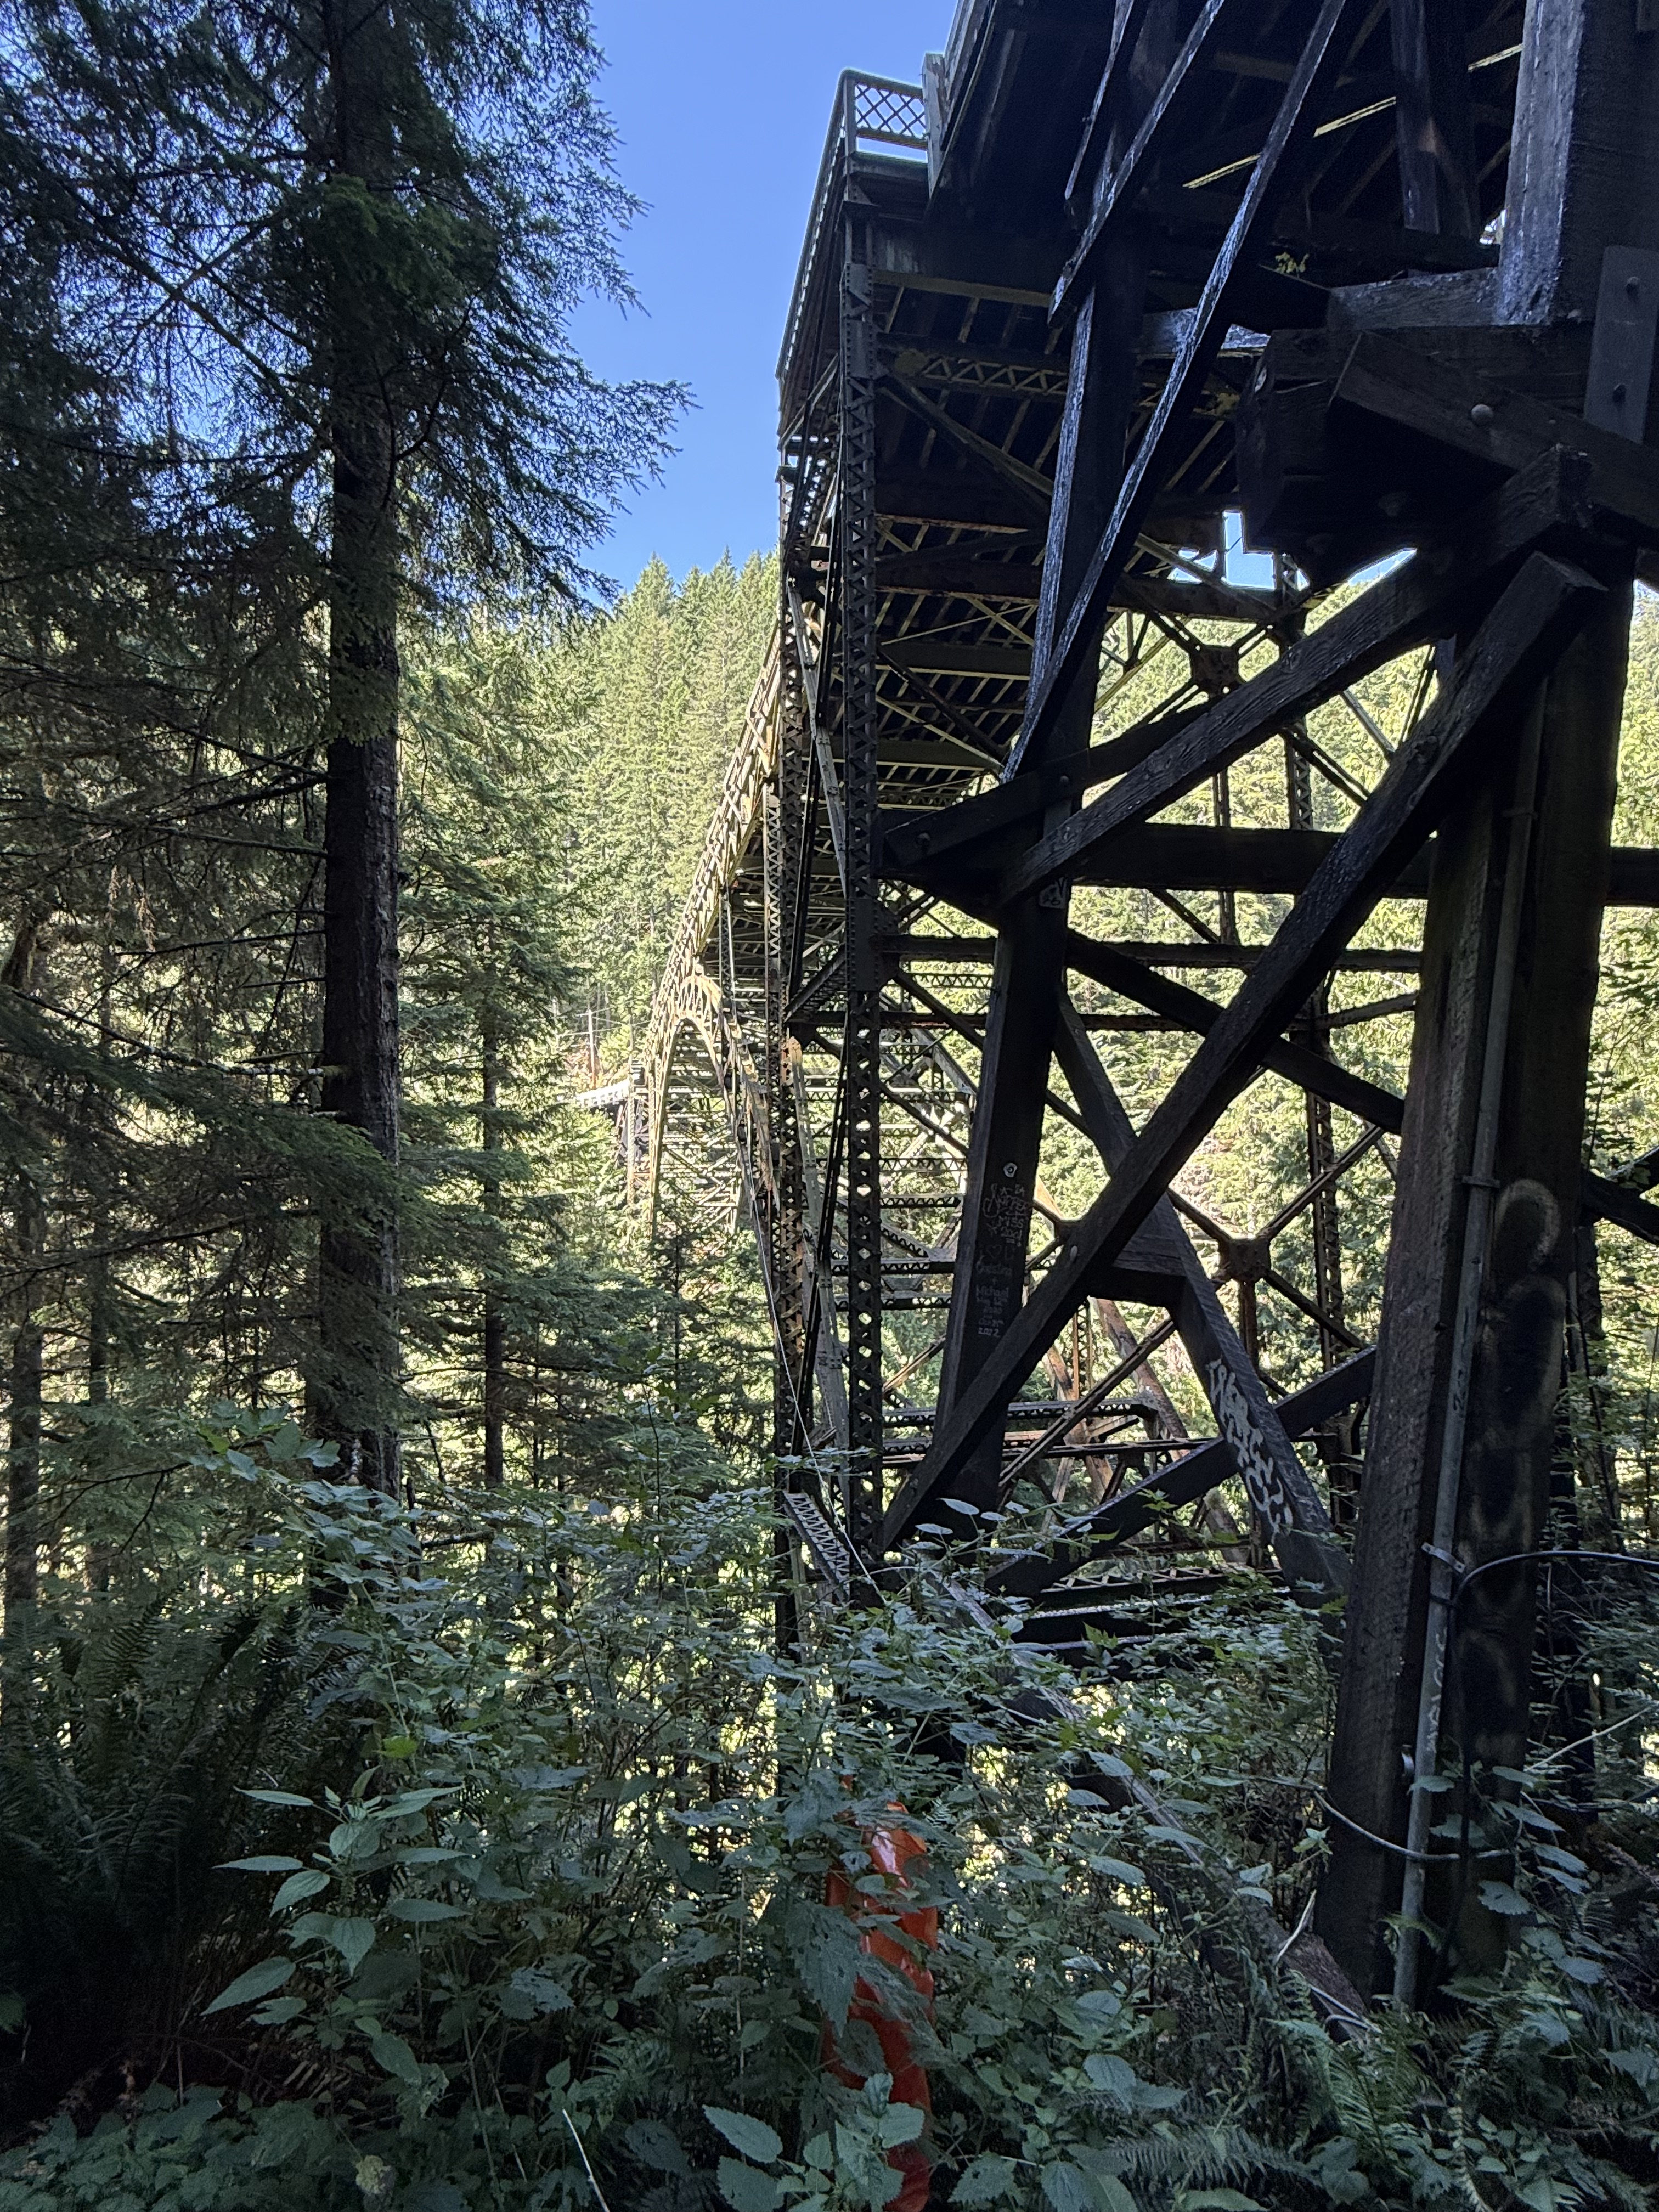
Figure 11. This is the end of the trail, where the road crosses Carbon River across the condemned Fairfax Bridge — closed even to pedestrian traffic. The canyon is 250-300 feet deep here. We climbed a trail to the bridge before we saw the signs on the highway declaring it unsafe for men or beasts.
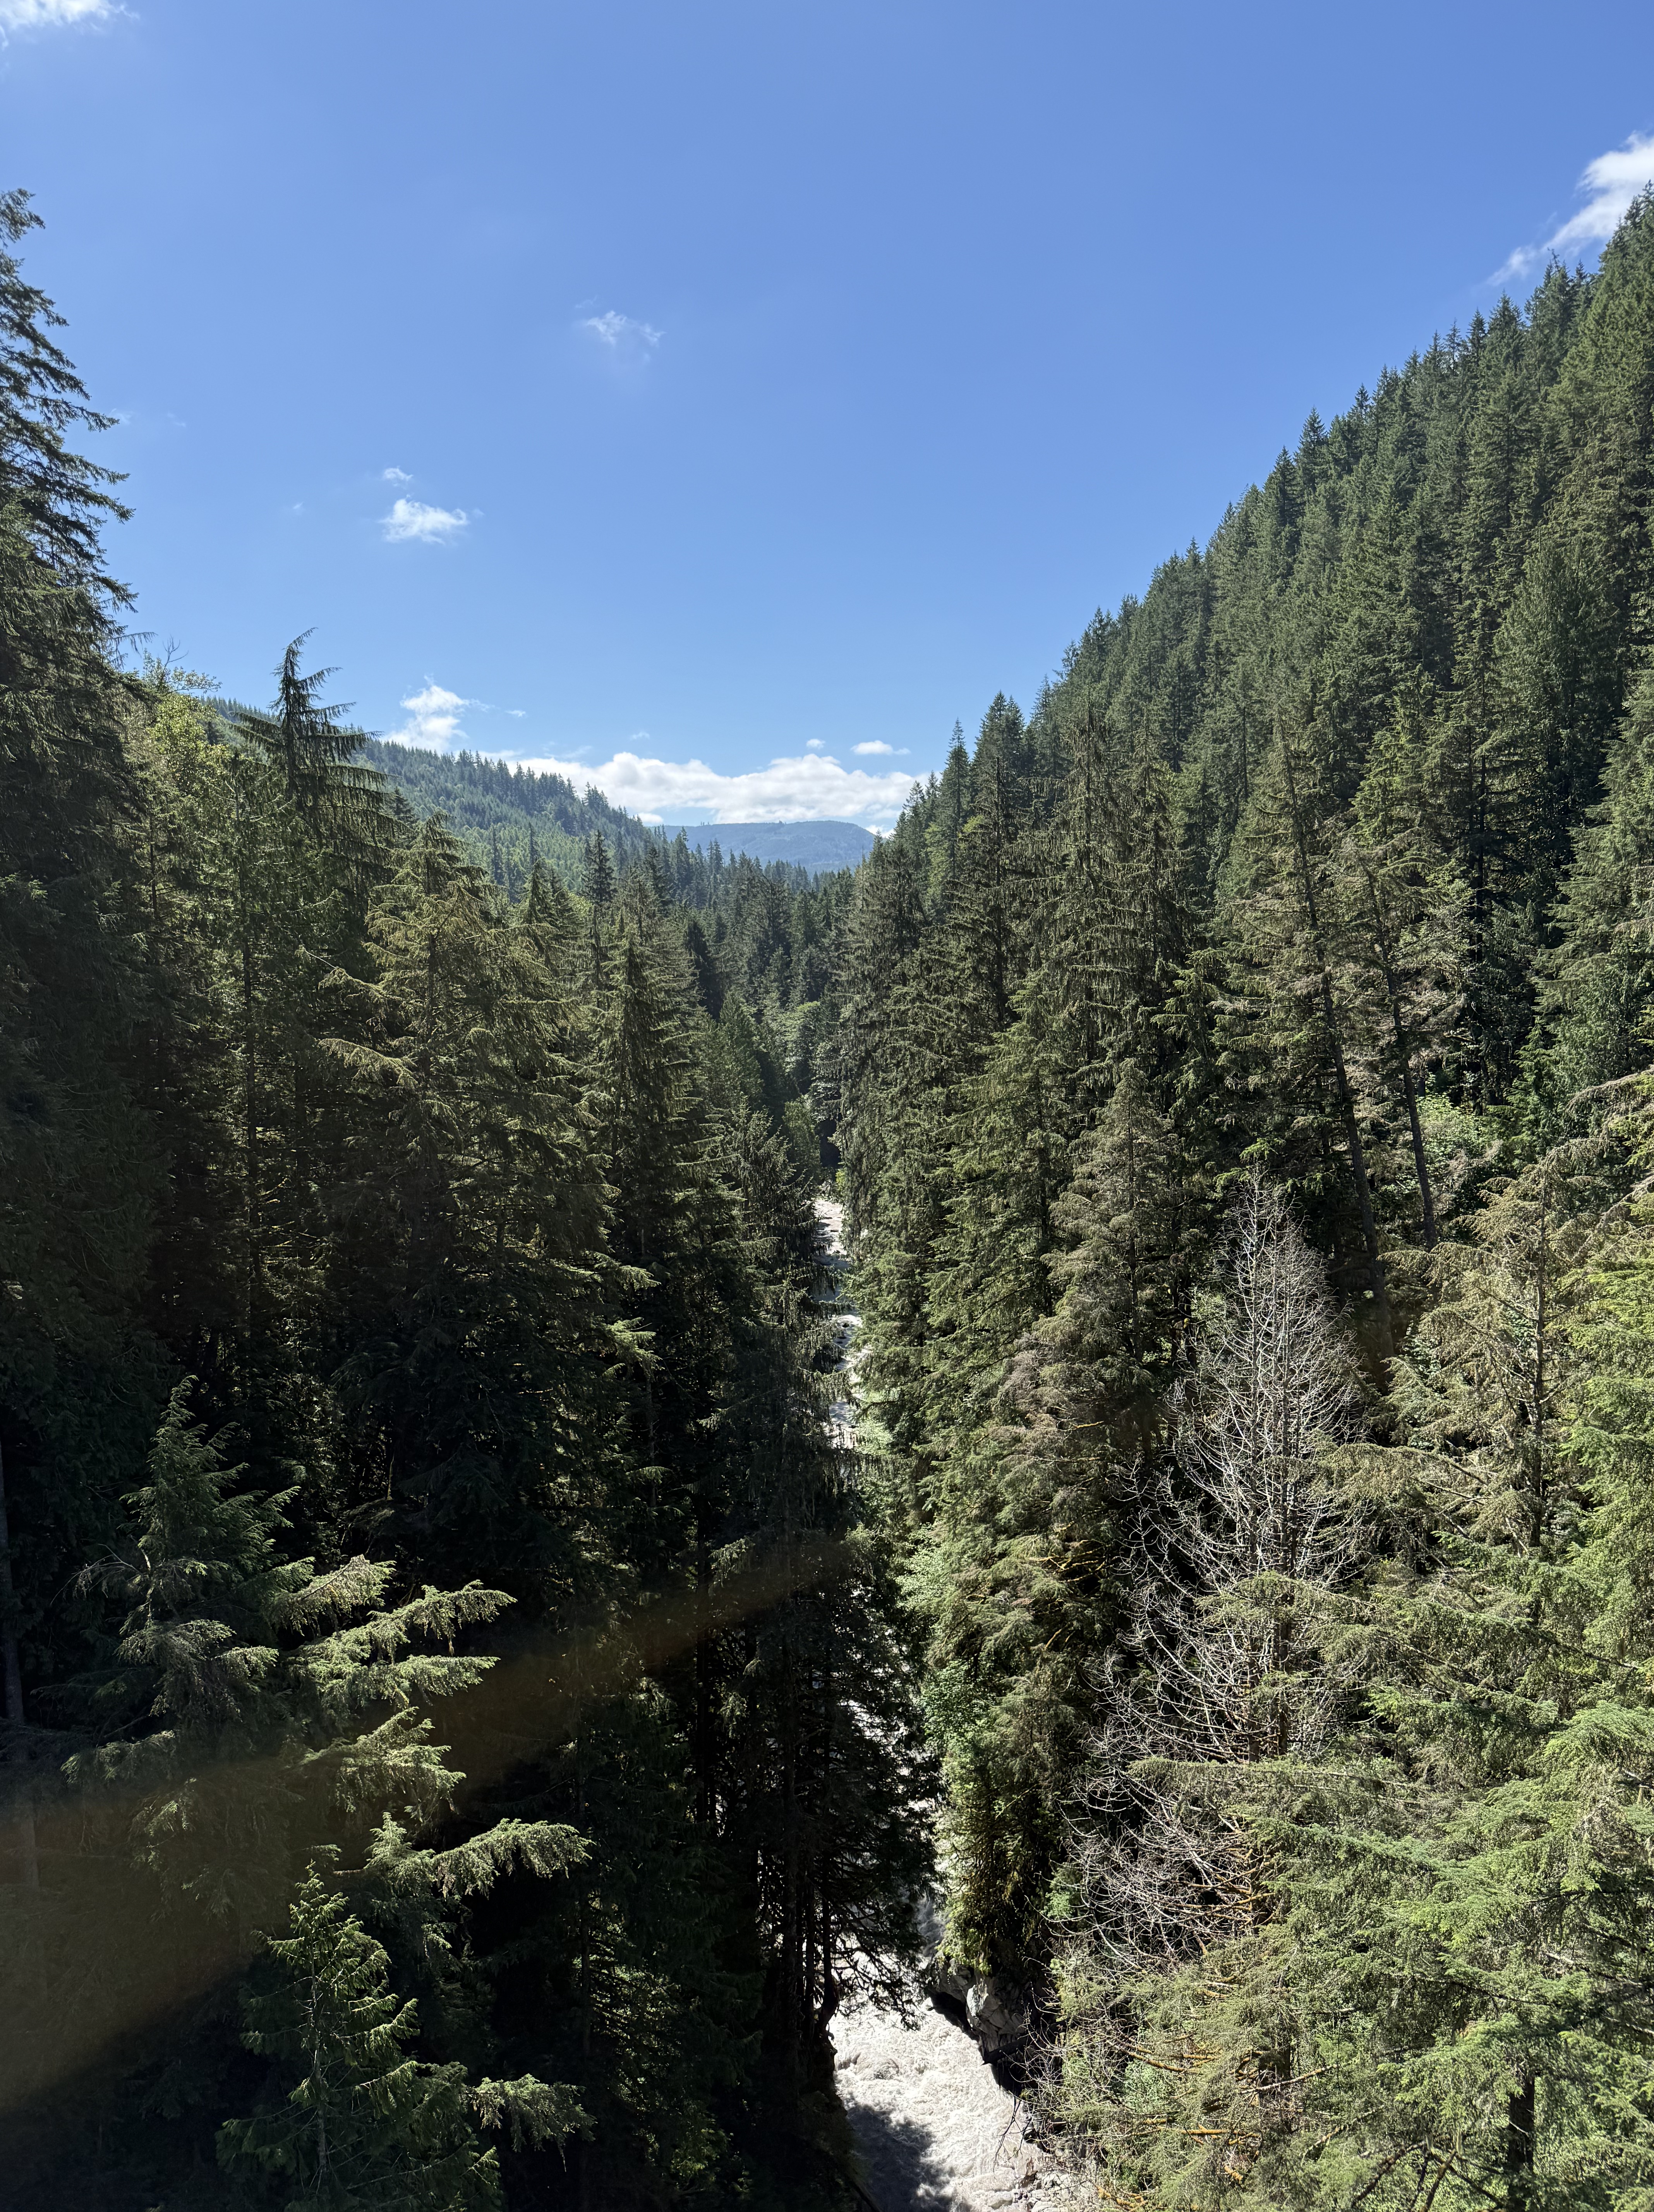
Figure 12. The canyon is very narrow at Fairfax Bridge, and Carbon River is forced into a bottleneck where it drops precipitously from the core of the Cascades. This entire canyon would have been filled with ice during the most recent glacial period. Compare this image, looking upstream, to those from the Nisqually glacier on Mount Rainier. That ice would have melted and advanced, pushing its way downstream, where it would have met the continental glacier covering Puget Sound.
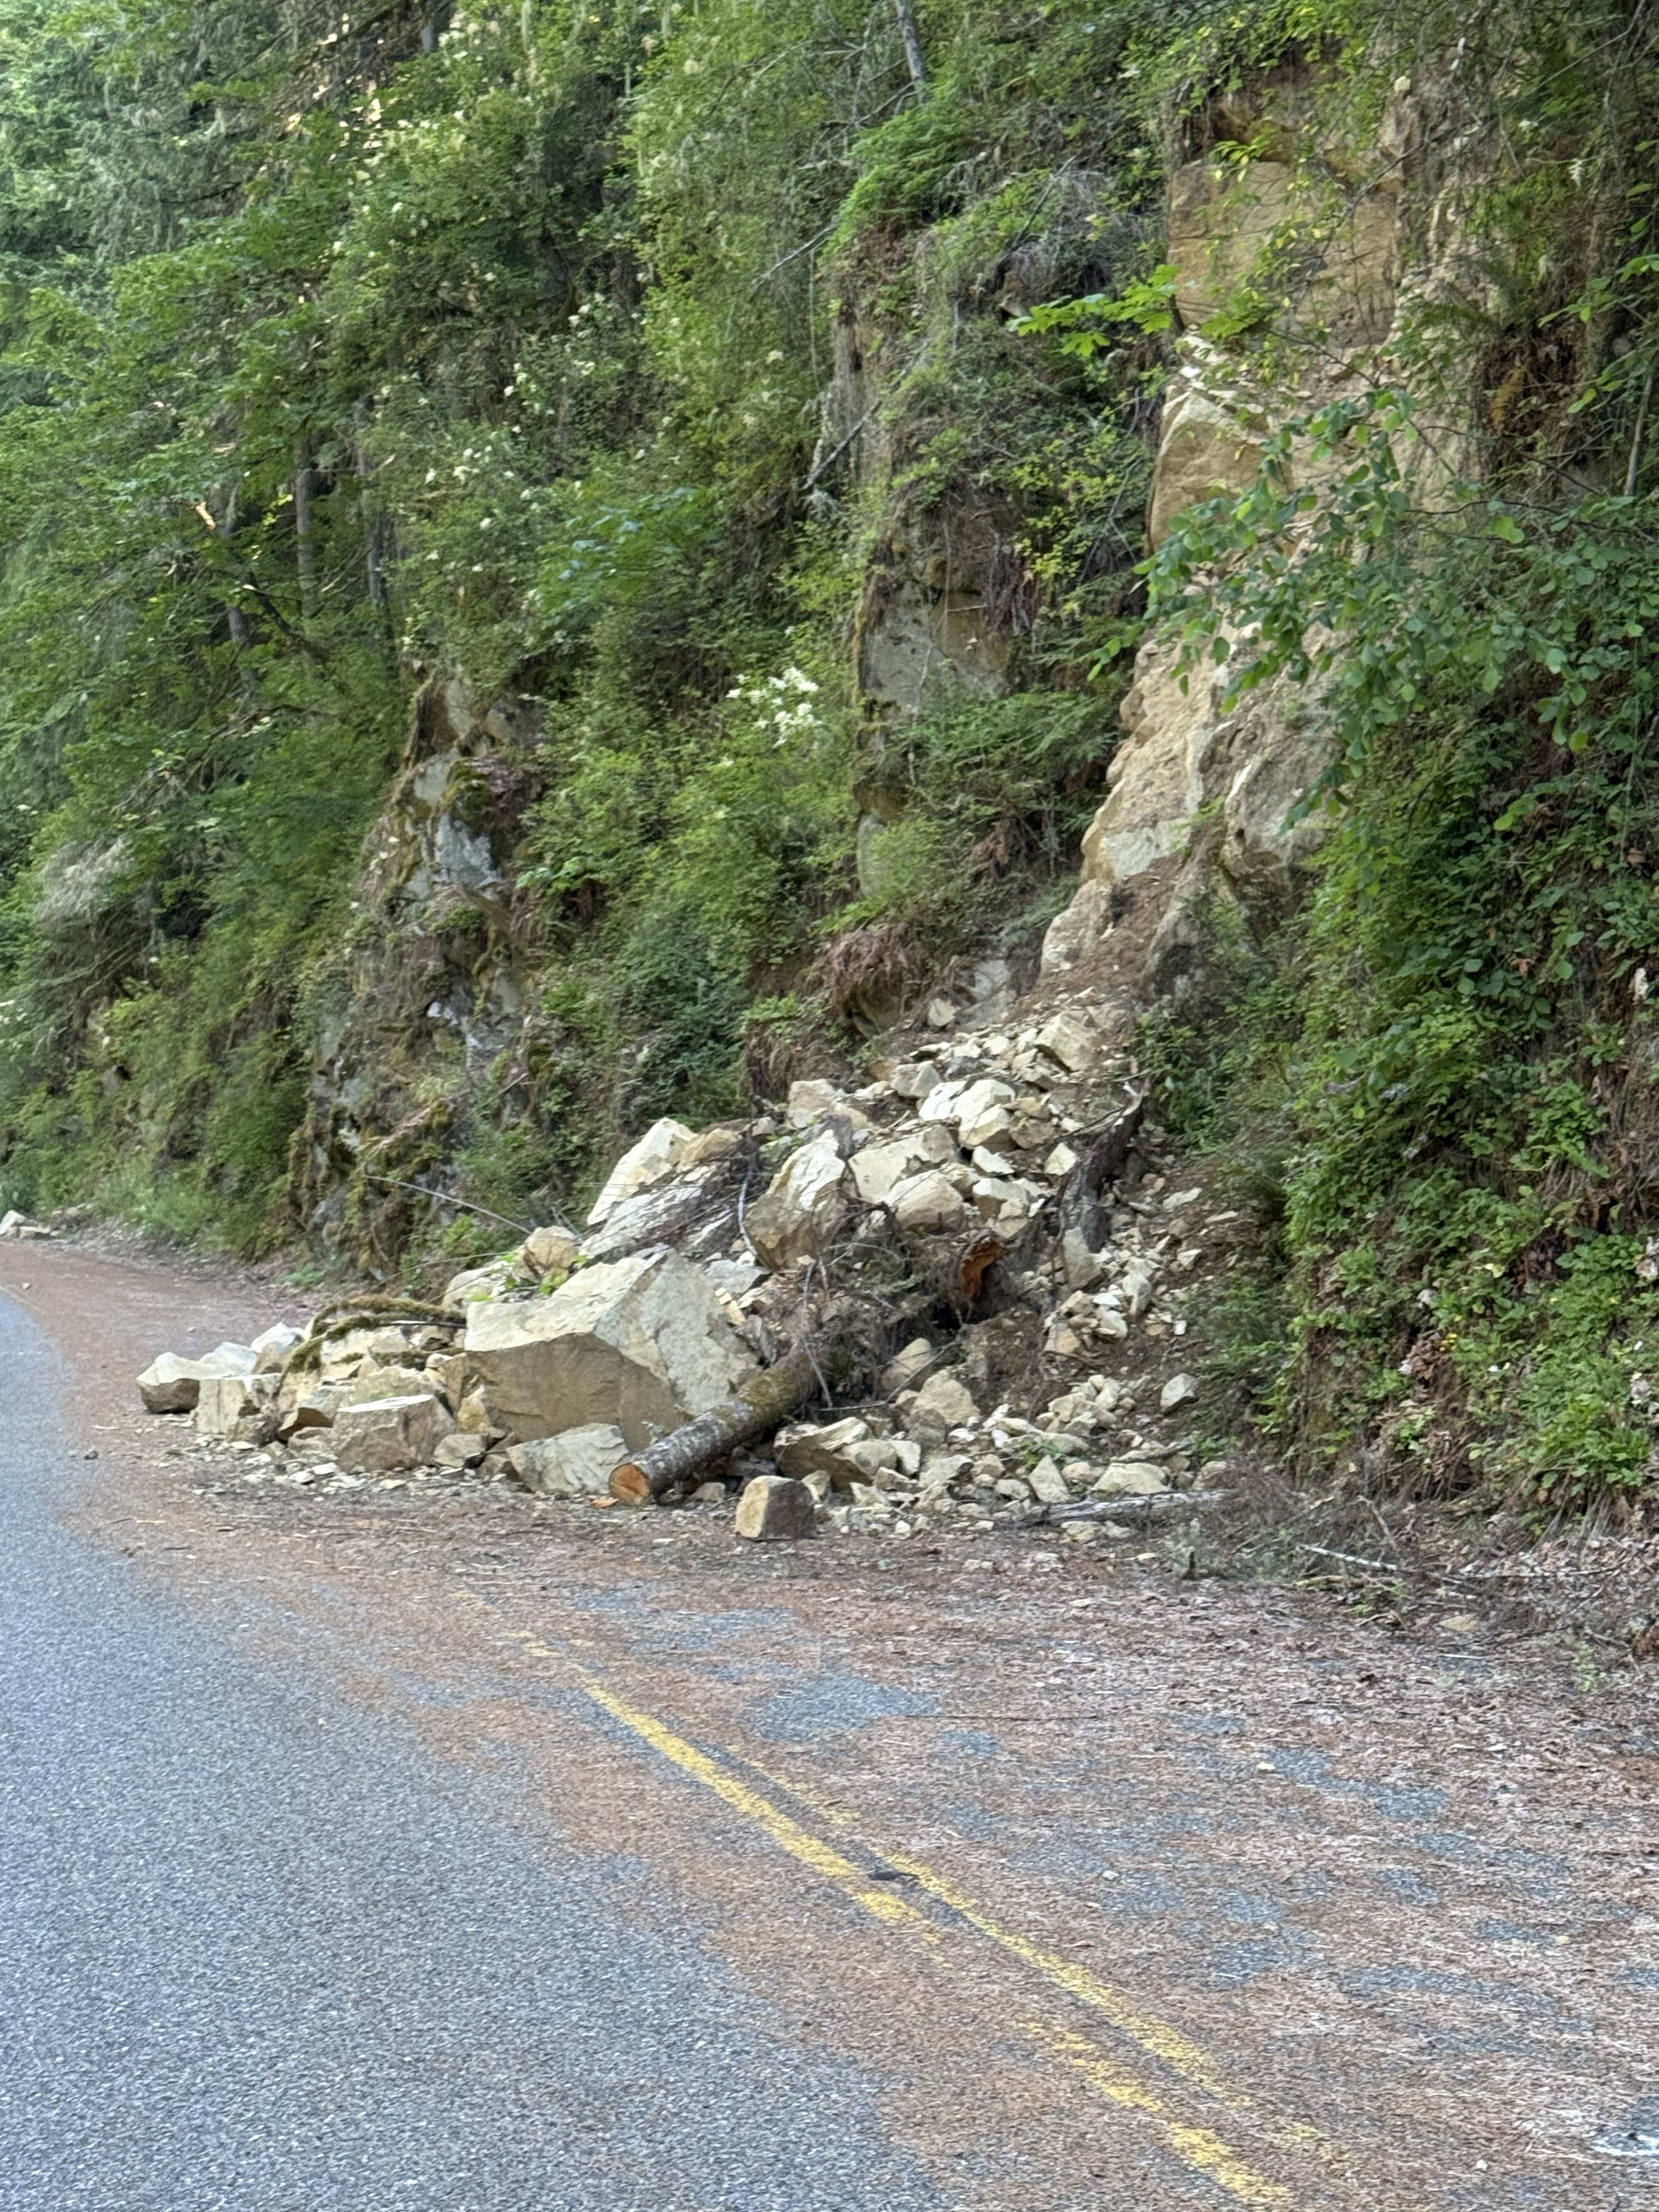
Figure 13. We took the highway back to Carbondale. However, Route 165 is closed and the highway department isn’t maintaining it, so slides like this one are left for geologists to examine. This block is, according to RockD’s geologic map, sedimentary; it looks like sandstone and I didn’t examine it at the time. Note the reddish face on the large block facing the camera; red means this rock was deposited with a lot of oxygen, which means it was in a river and not the ocean, which has a much lower concentration of oxygen.
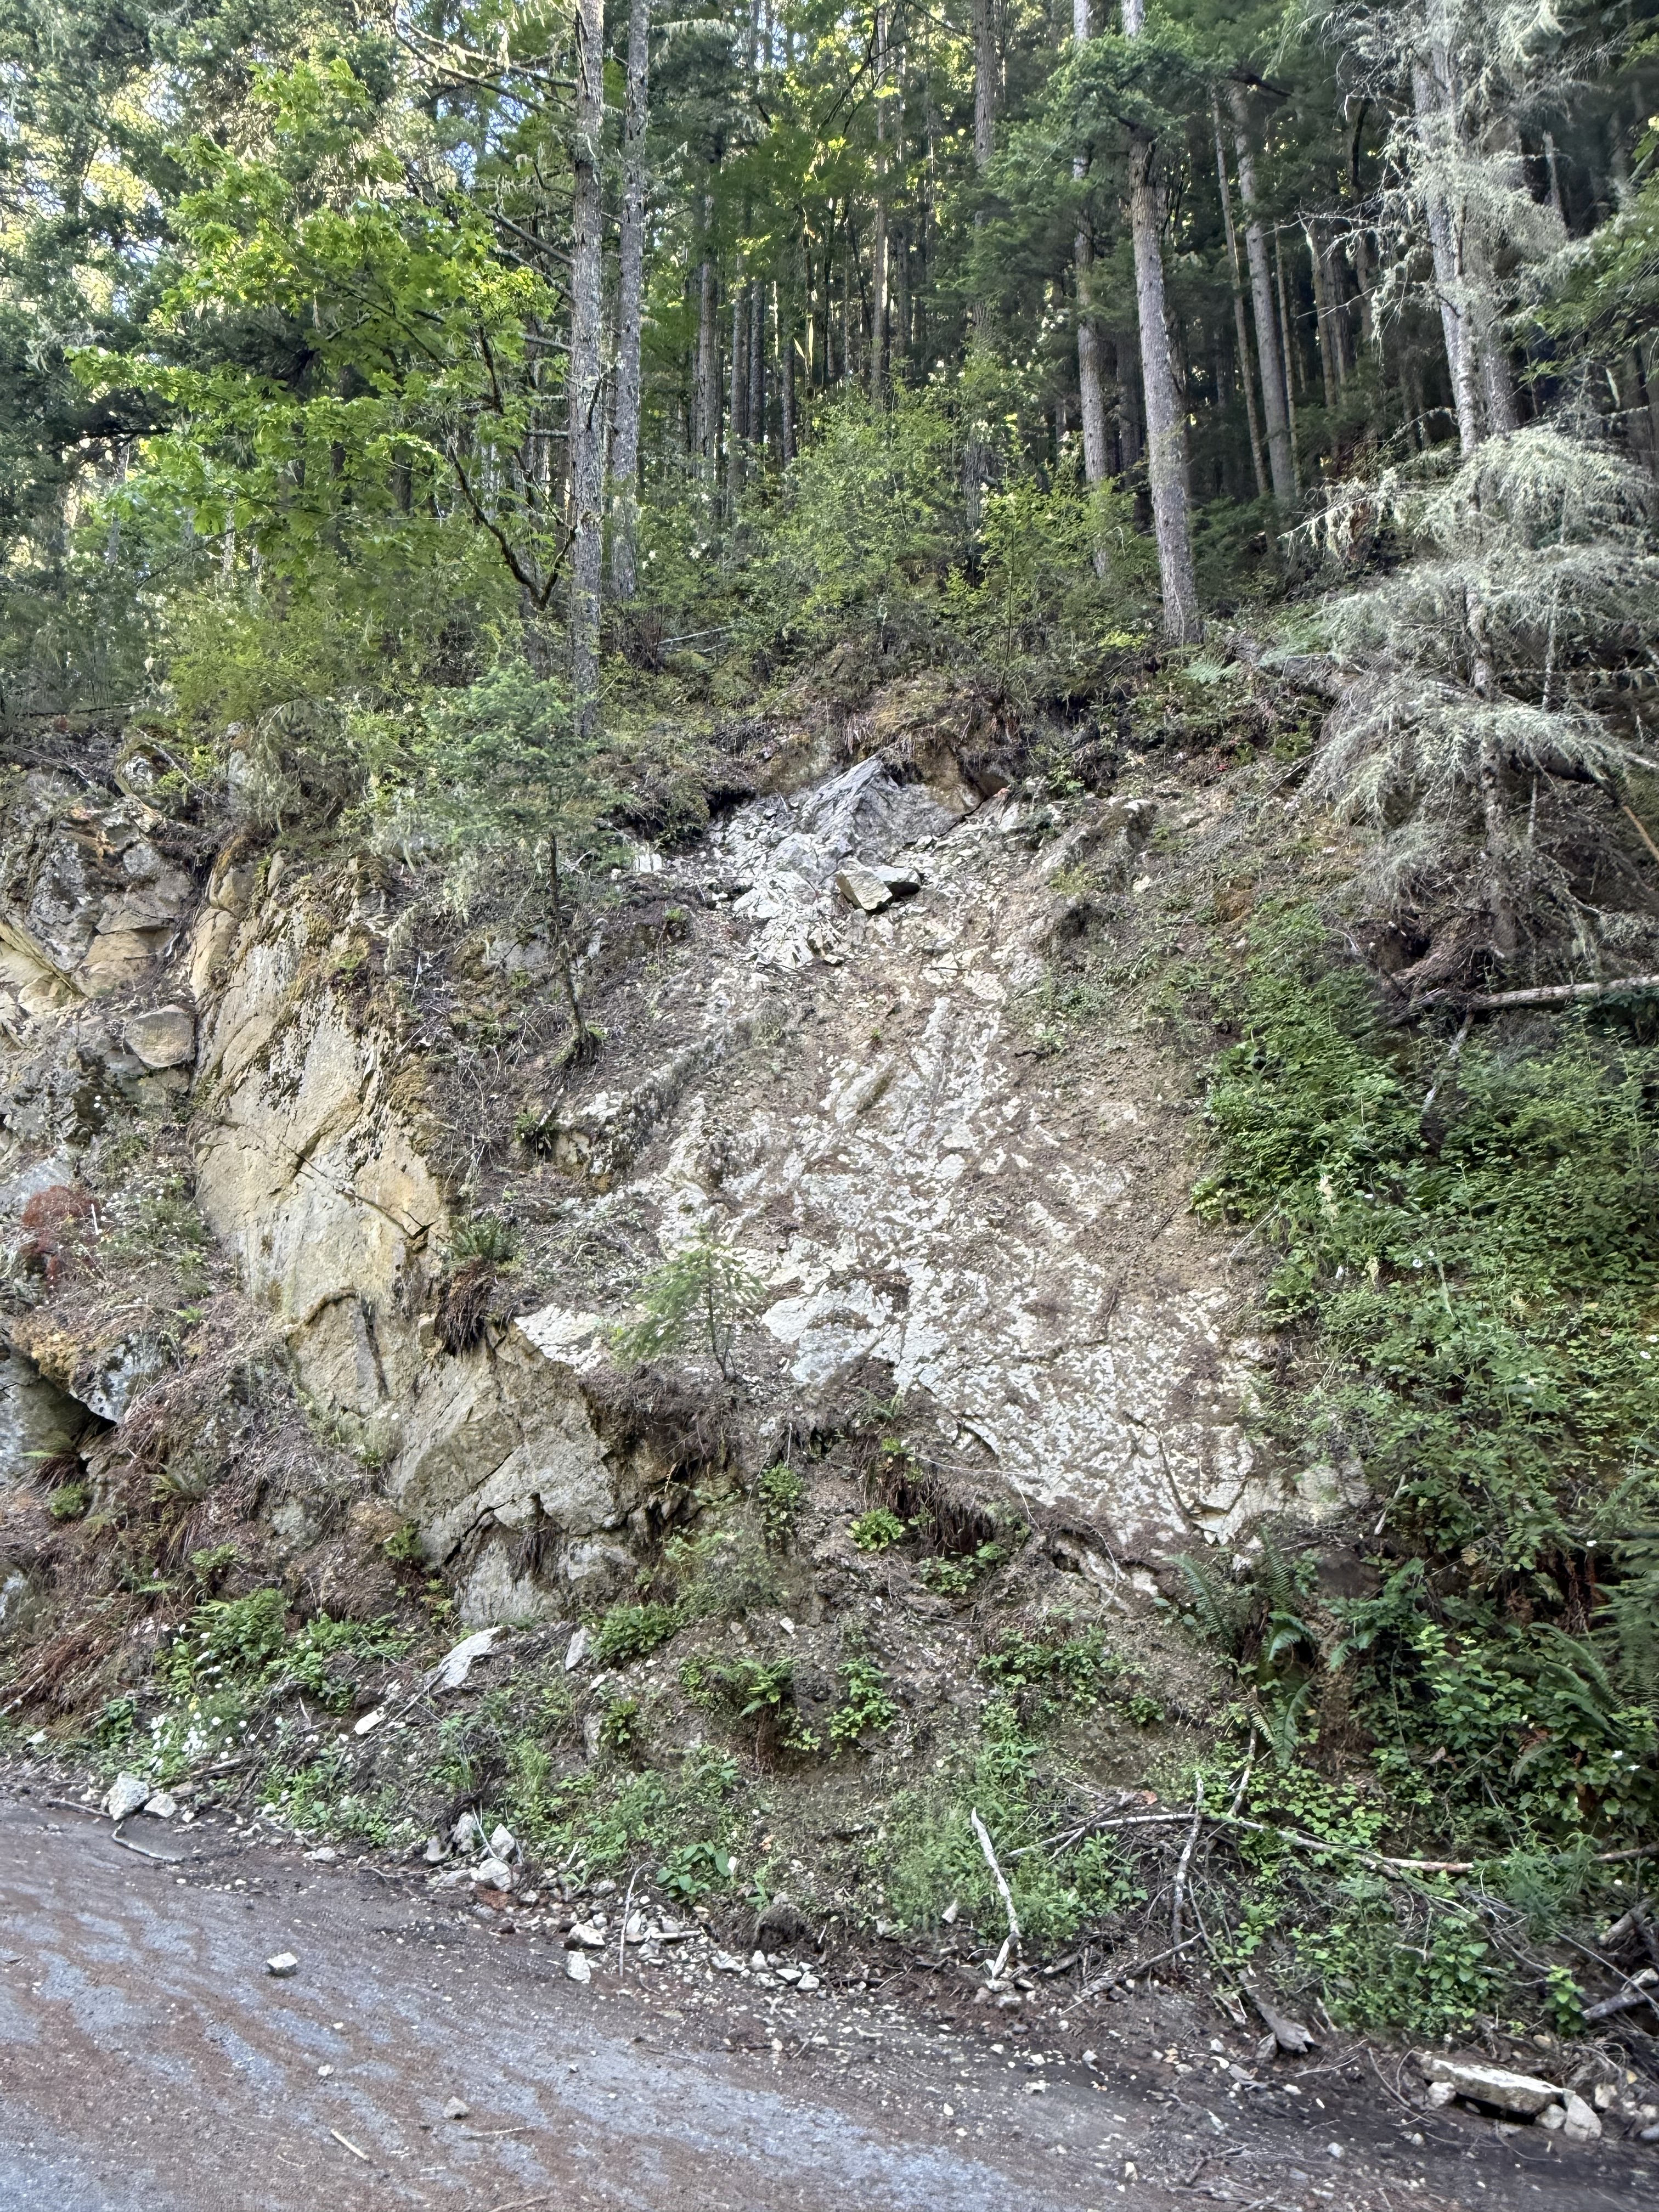
Figure 14. This photo presents a bizarre juxtaposition of geologic features. It was taken a few hundred yards downstream of Fairfax Bridge. The thick layer of sandstone to the left represents the unaltered strata, which has been tilted towards the NE, but not as much as the strata seen in Fig. 8. Such a sudden (spatially) change in orientation is probably why the geologic map (Fig. 2C) shows a fault along the river canyon.
Another interesting feature is the white patch in the center of the photo. I had several hypotheses about this but, after discussing it with CoPilot (aka ChatGPT), I’m going to go with the most plausible scenario: I think this is a layer of shale within the Carbonado Formation, which is both more easily weathered than sandstone, and a surface that can accommodate slippage on a fault more readily. The apparent bedding plane (i.e. the white surface) is an illusion, created by uneven weathering and the constant flow of water down an established channel.
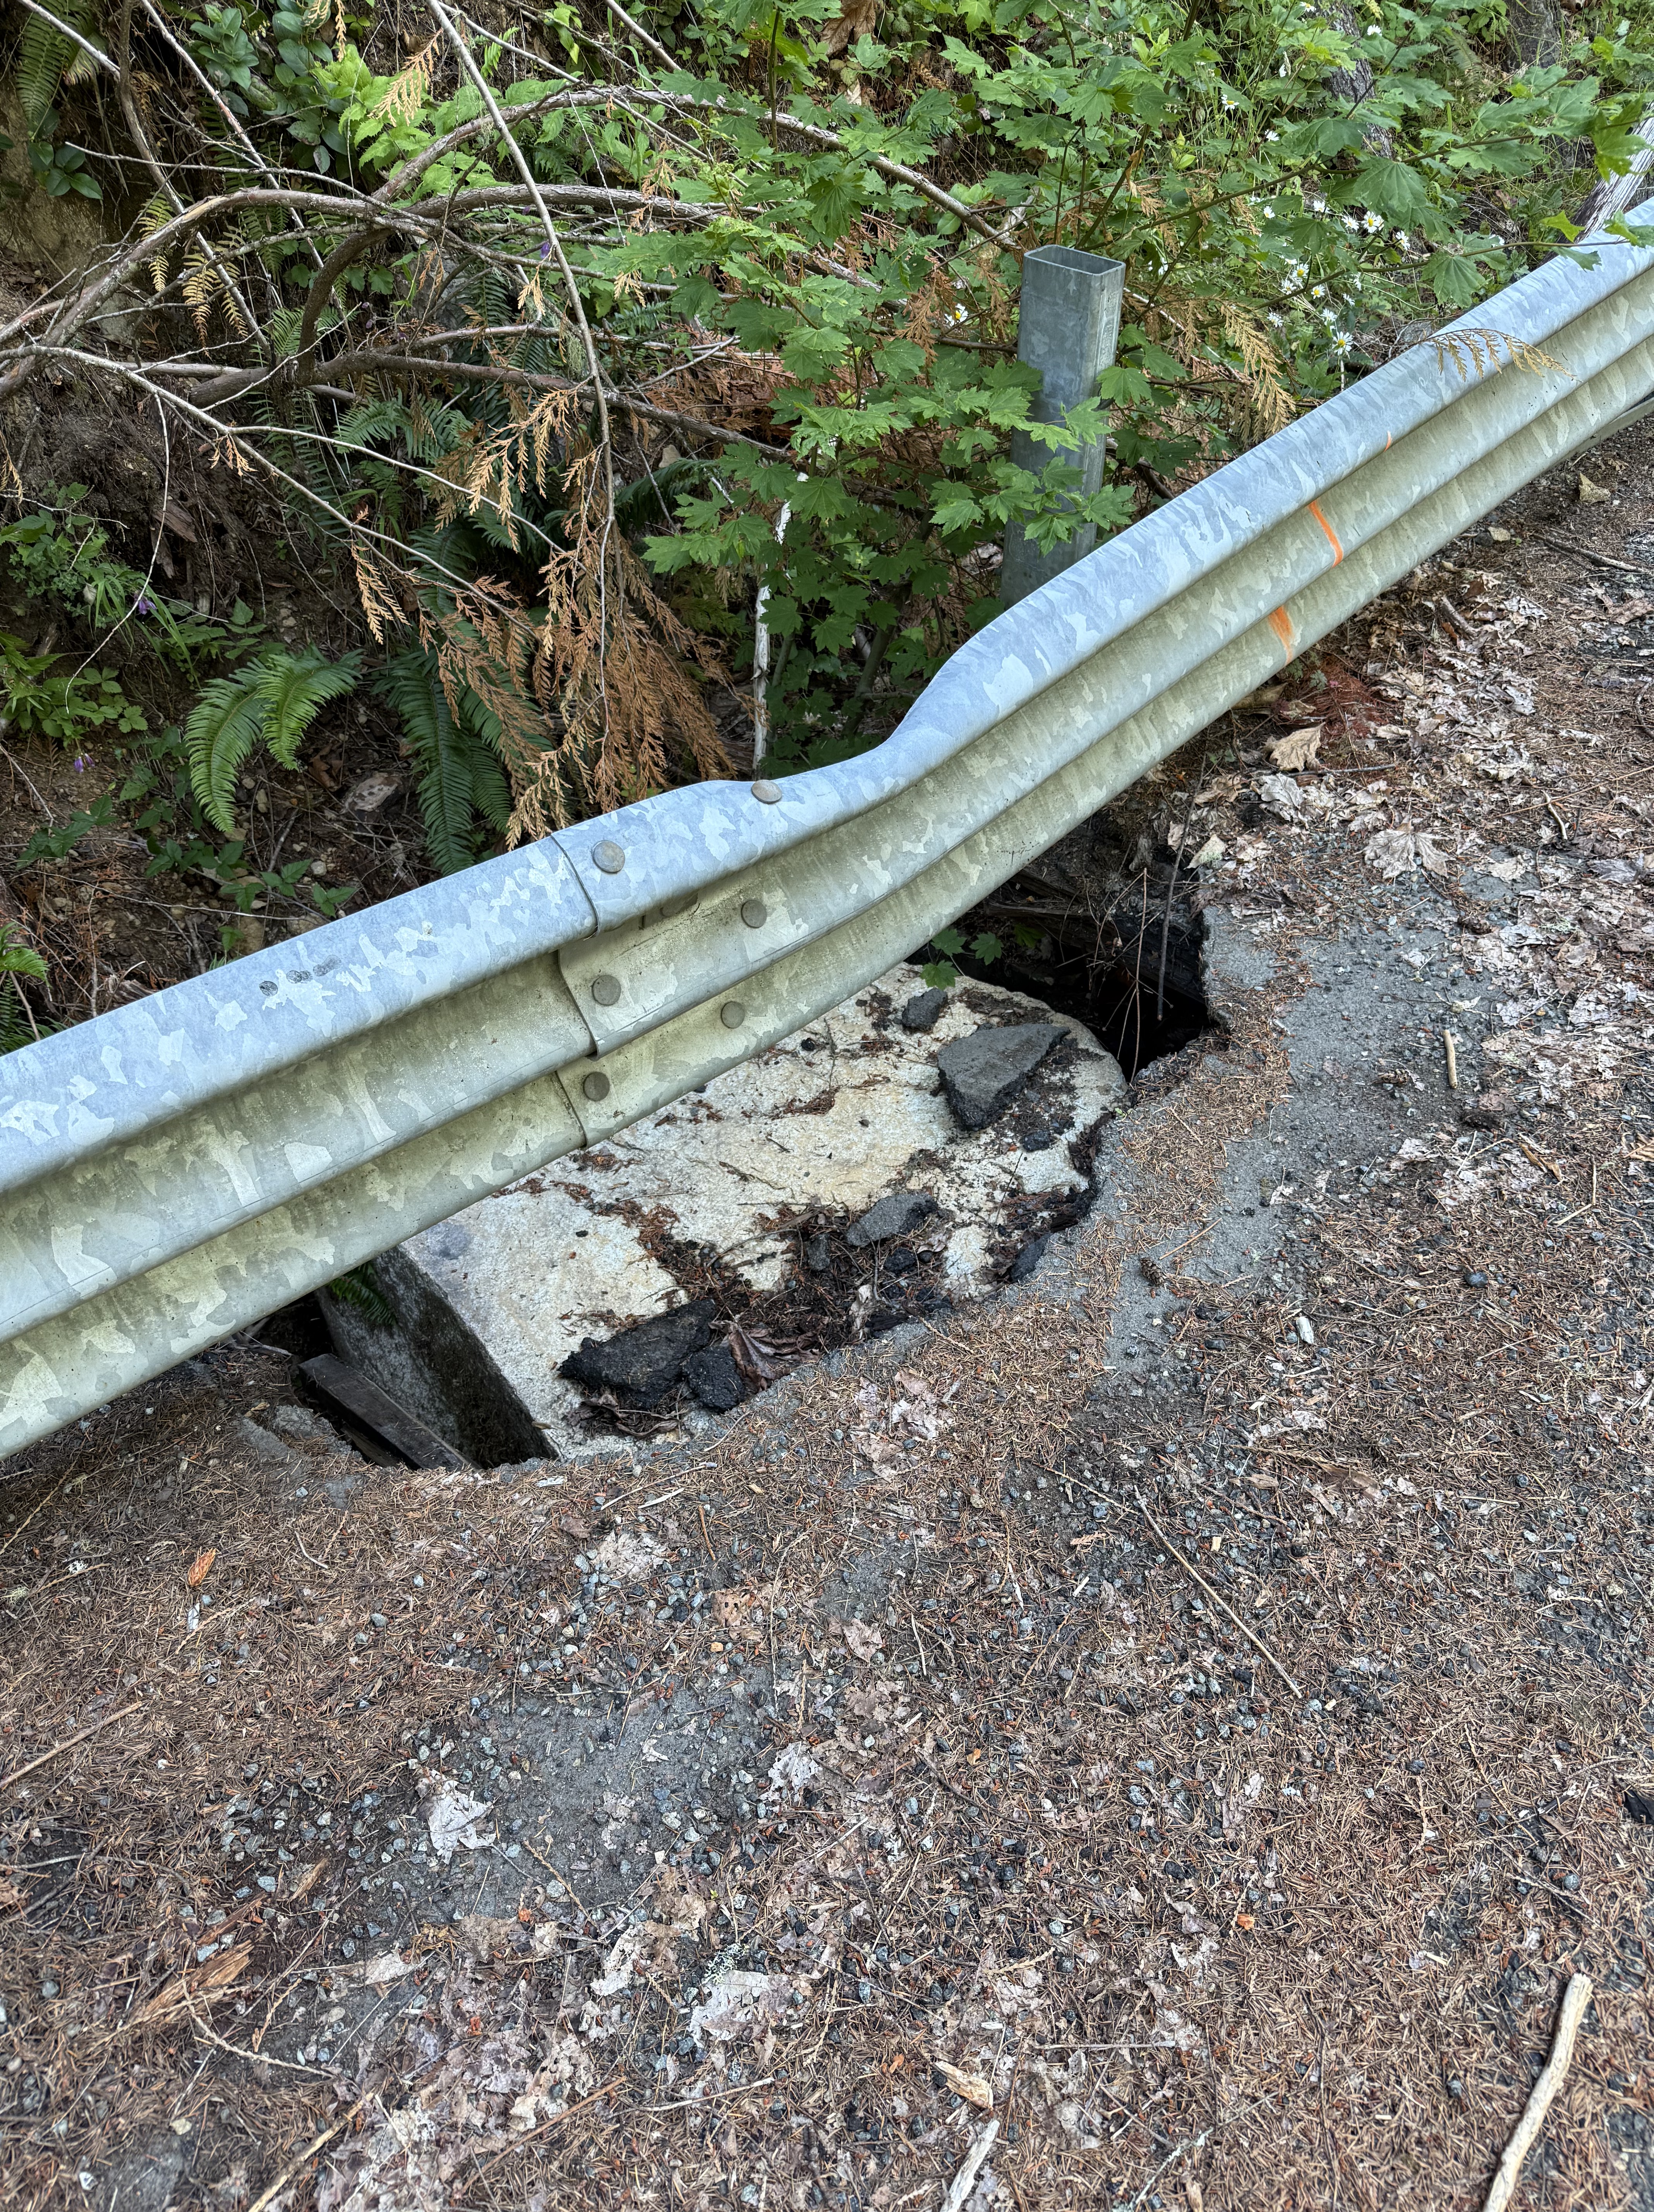
Figure 15. I had to include this image. A block of sandstone, weighing more than a ton, rolled down the steep slope, hit the guardrail, bending it, before slamming into the asphalt road that was weakened by erosion, and smashing into the underlying, water-saturated ground. We noticed several spots where the culverts draining the road were insufficient, allowing water to collect and weaken the roadbed.
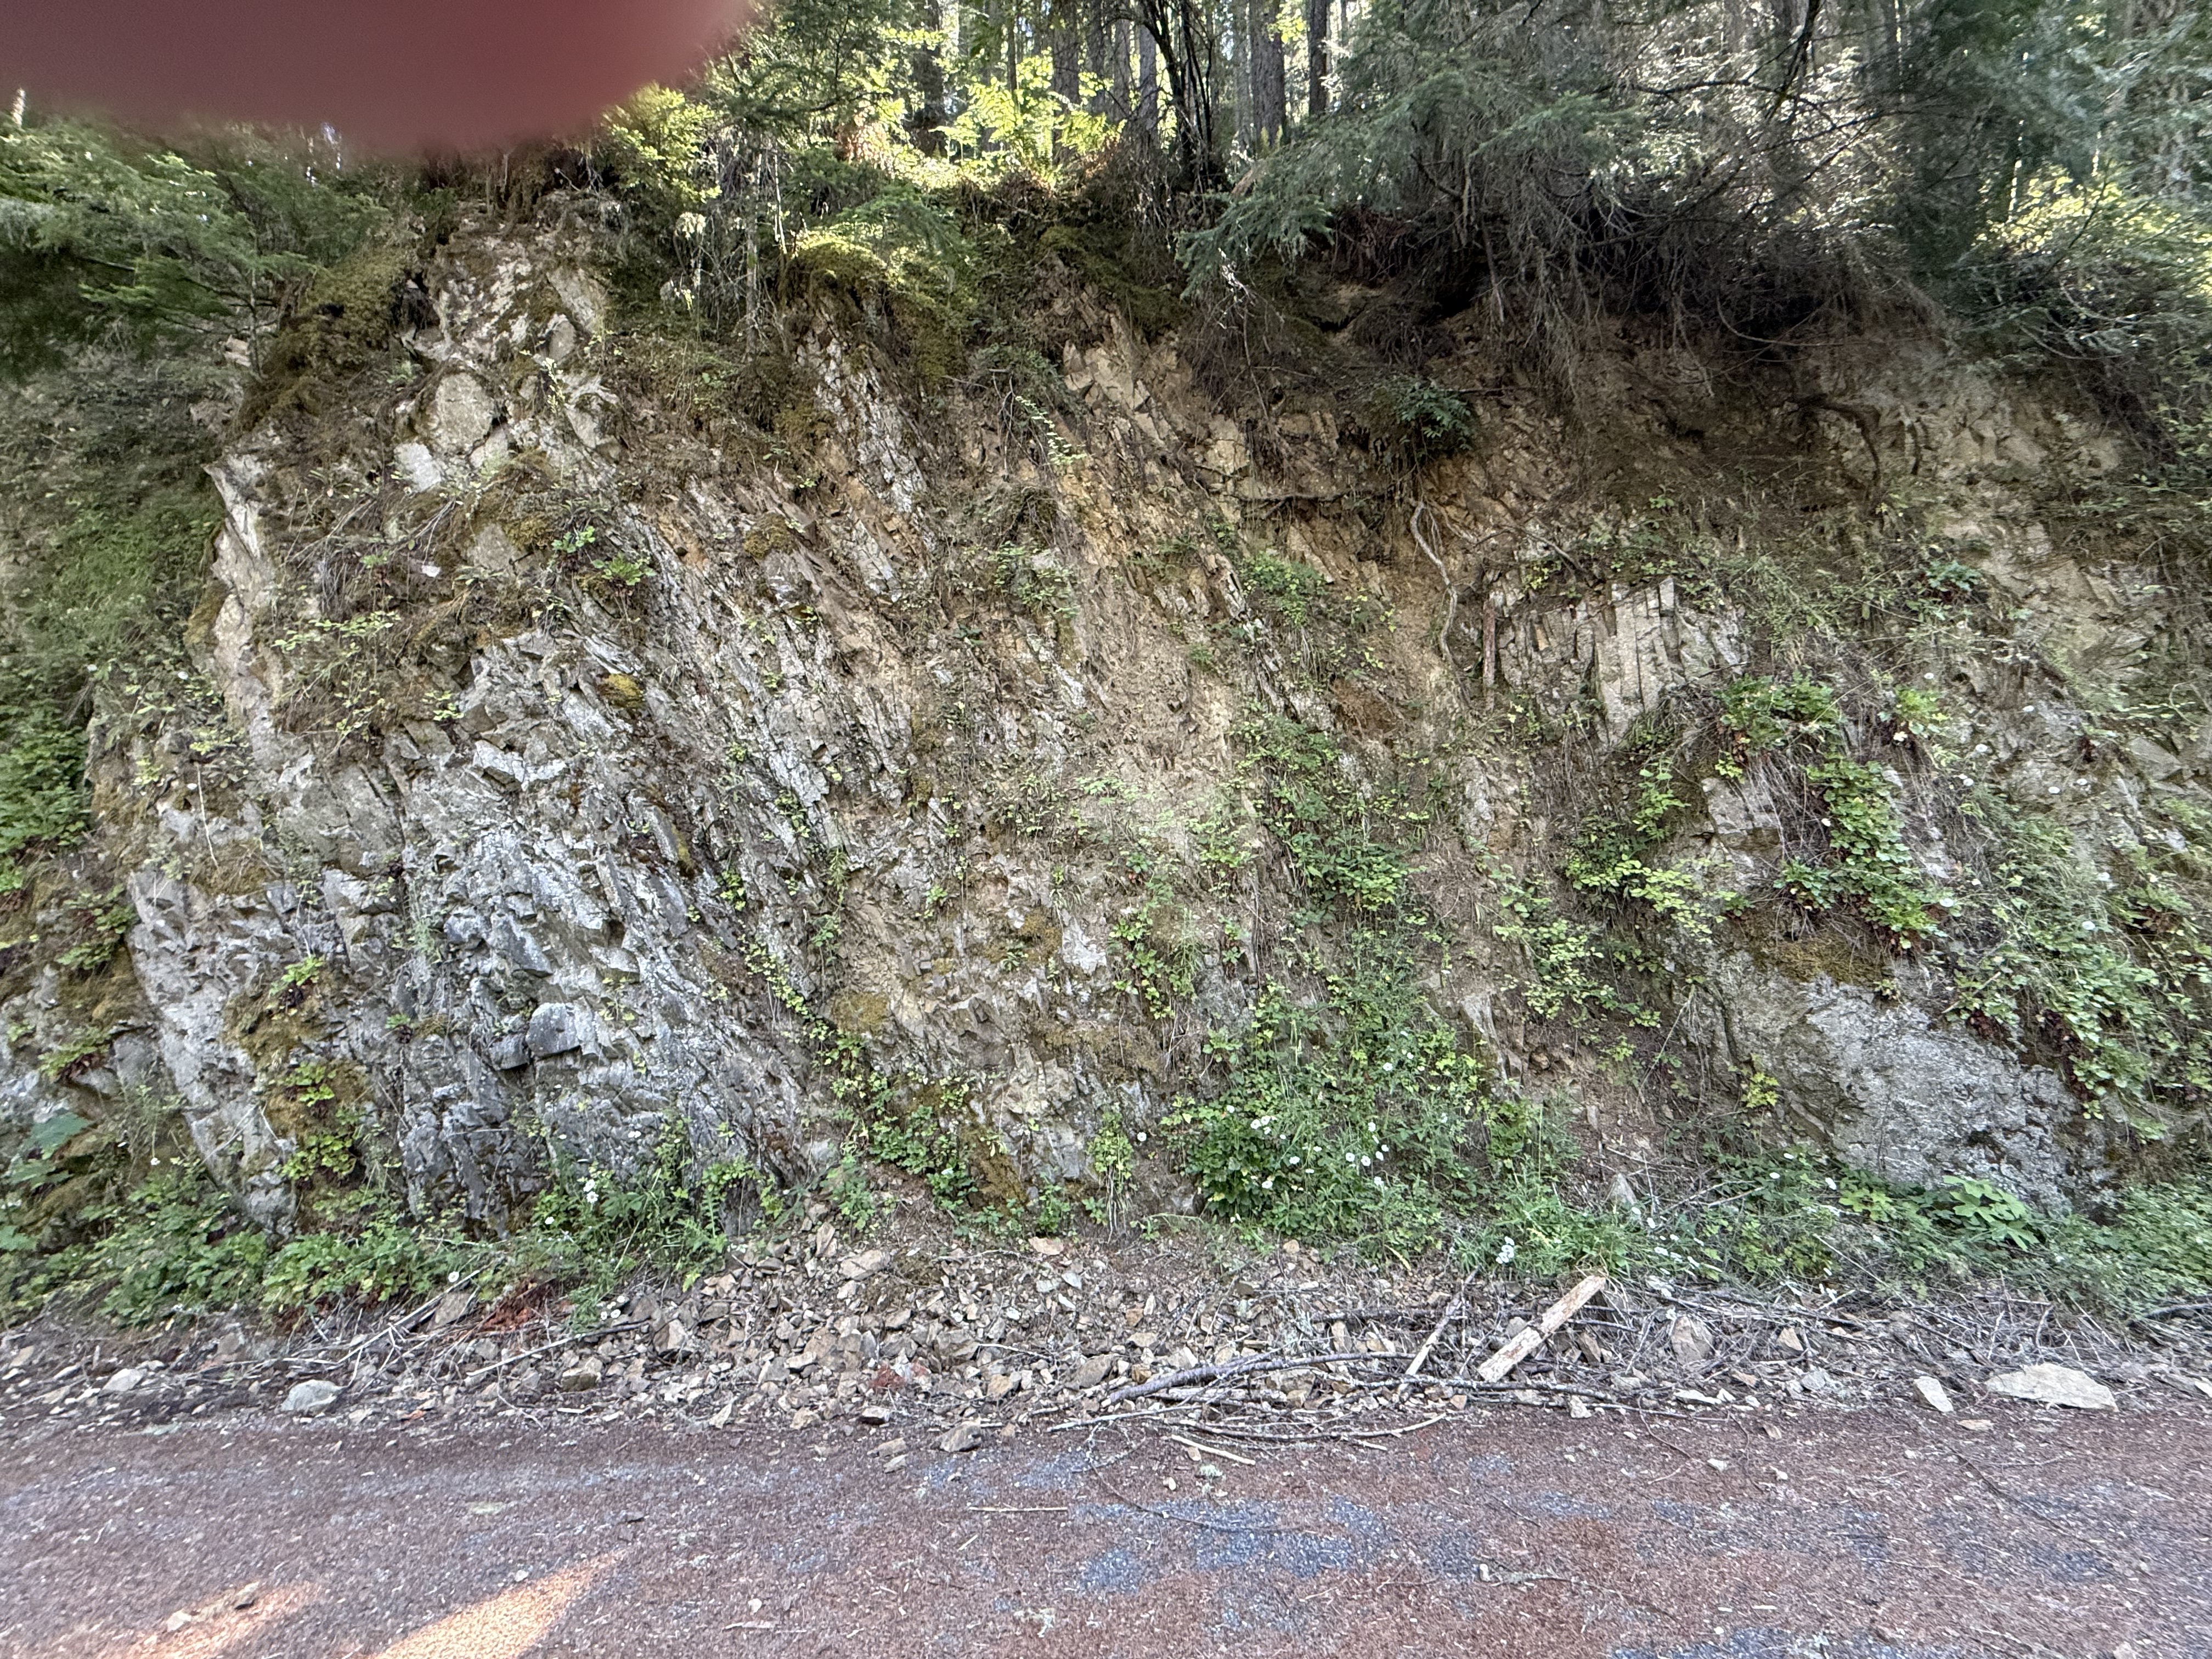
Figure 16. Another couple hundred yards further downstream (towards Carbonado in Fig. 2B), and we find thin layers of shale/sandstone nearly vertical, just like in Fig. 8. I didn’t measure my location precisely, but I wouldn’t be surprised if this is just above (uphill) the earlier observation. Note the layers of mud that resulted from differential weathering of clay layers within the Carbonado Formation.
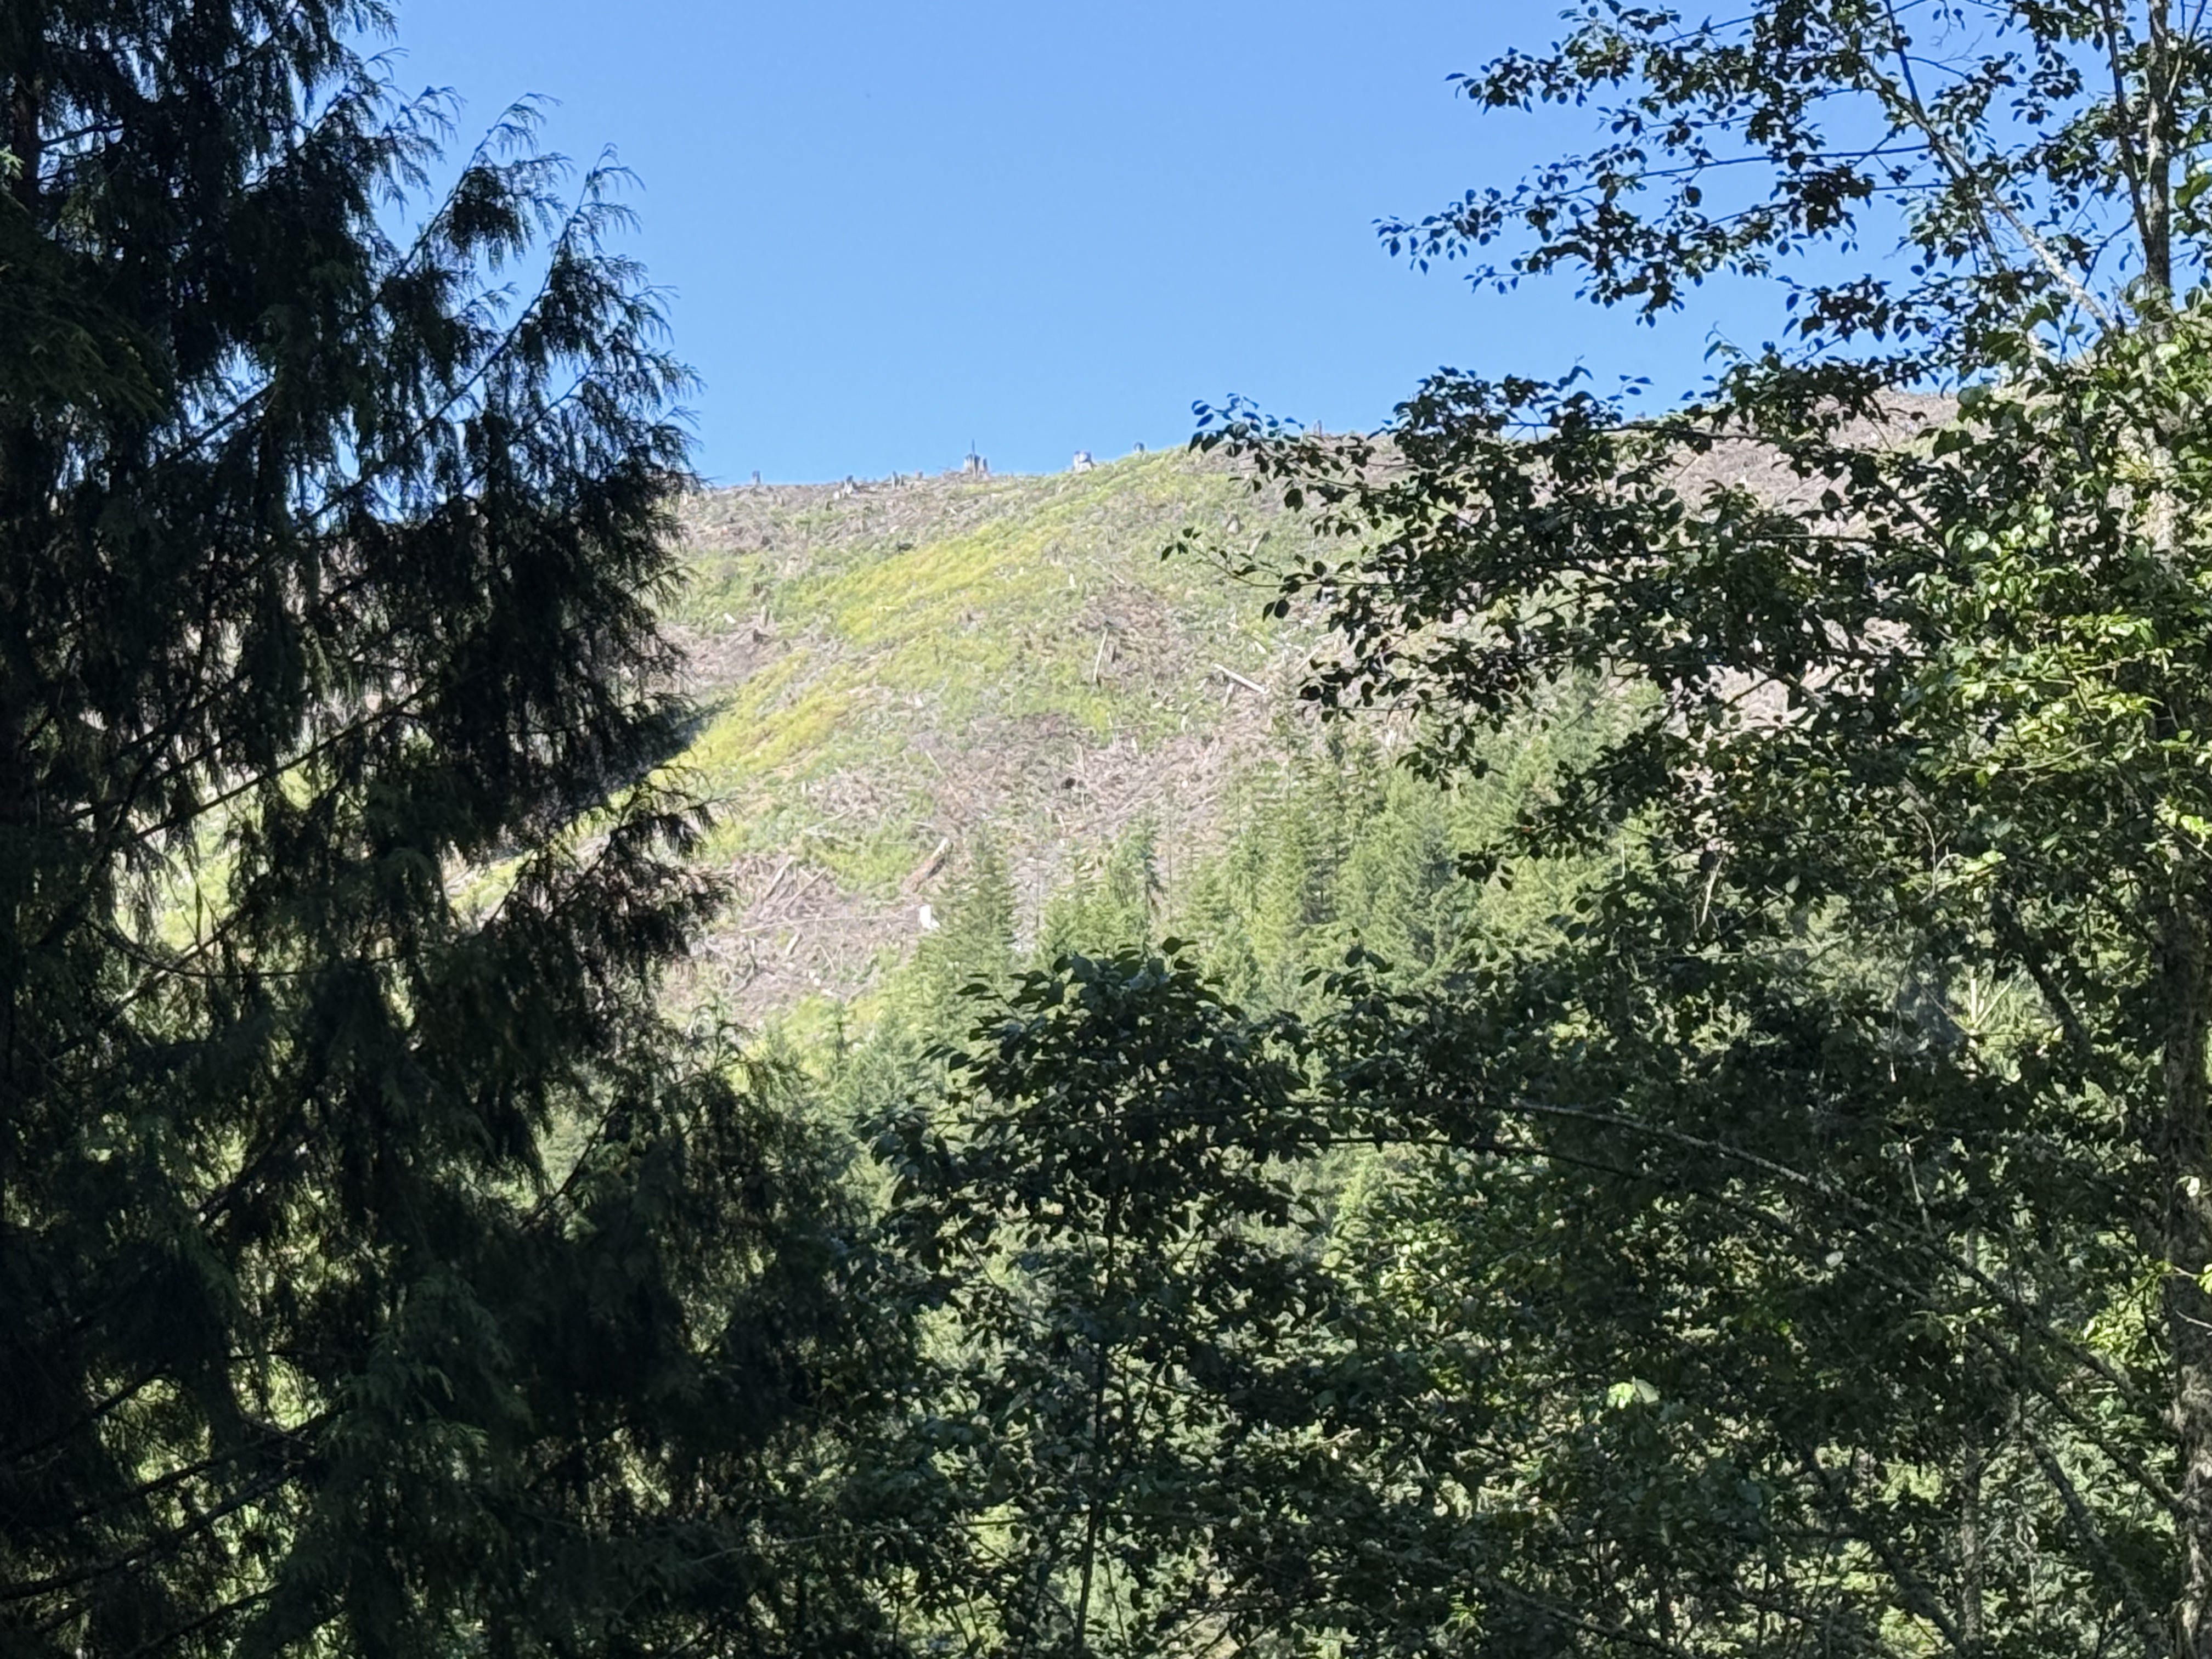
Figure 17. I included this image to explain why the Carbon River was so muddy a few miles downstream (Fig. 1). The canyon wall to the west has been clear cut recently, allowing massive erosion of soil into the Carbon River. This is an ongoing practice in Washington with no attempts to rein in such destructive deforestation — all for the sake of profits. It just pisses me off!
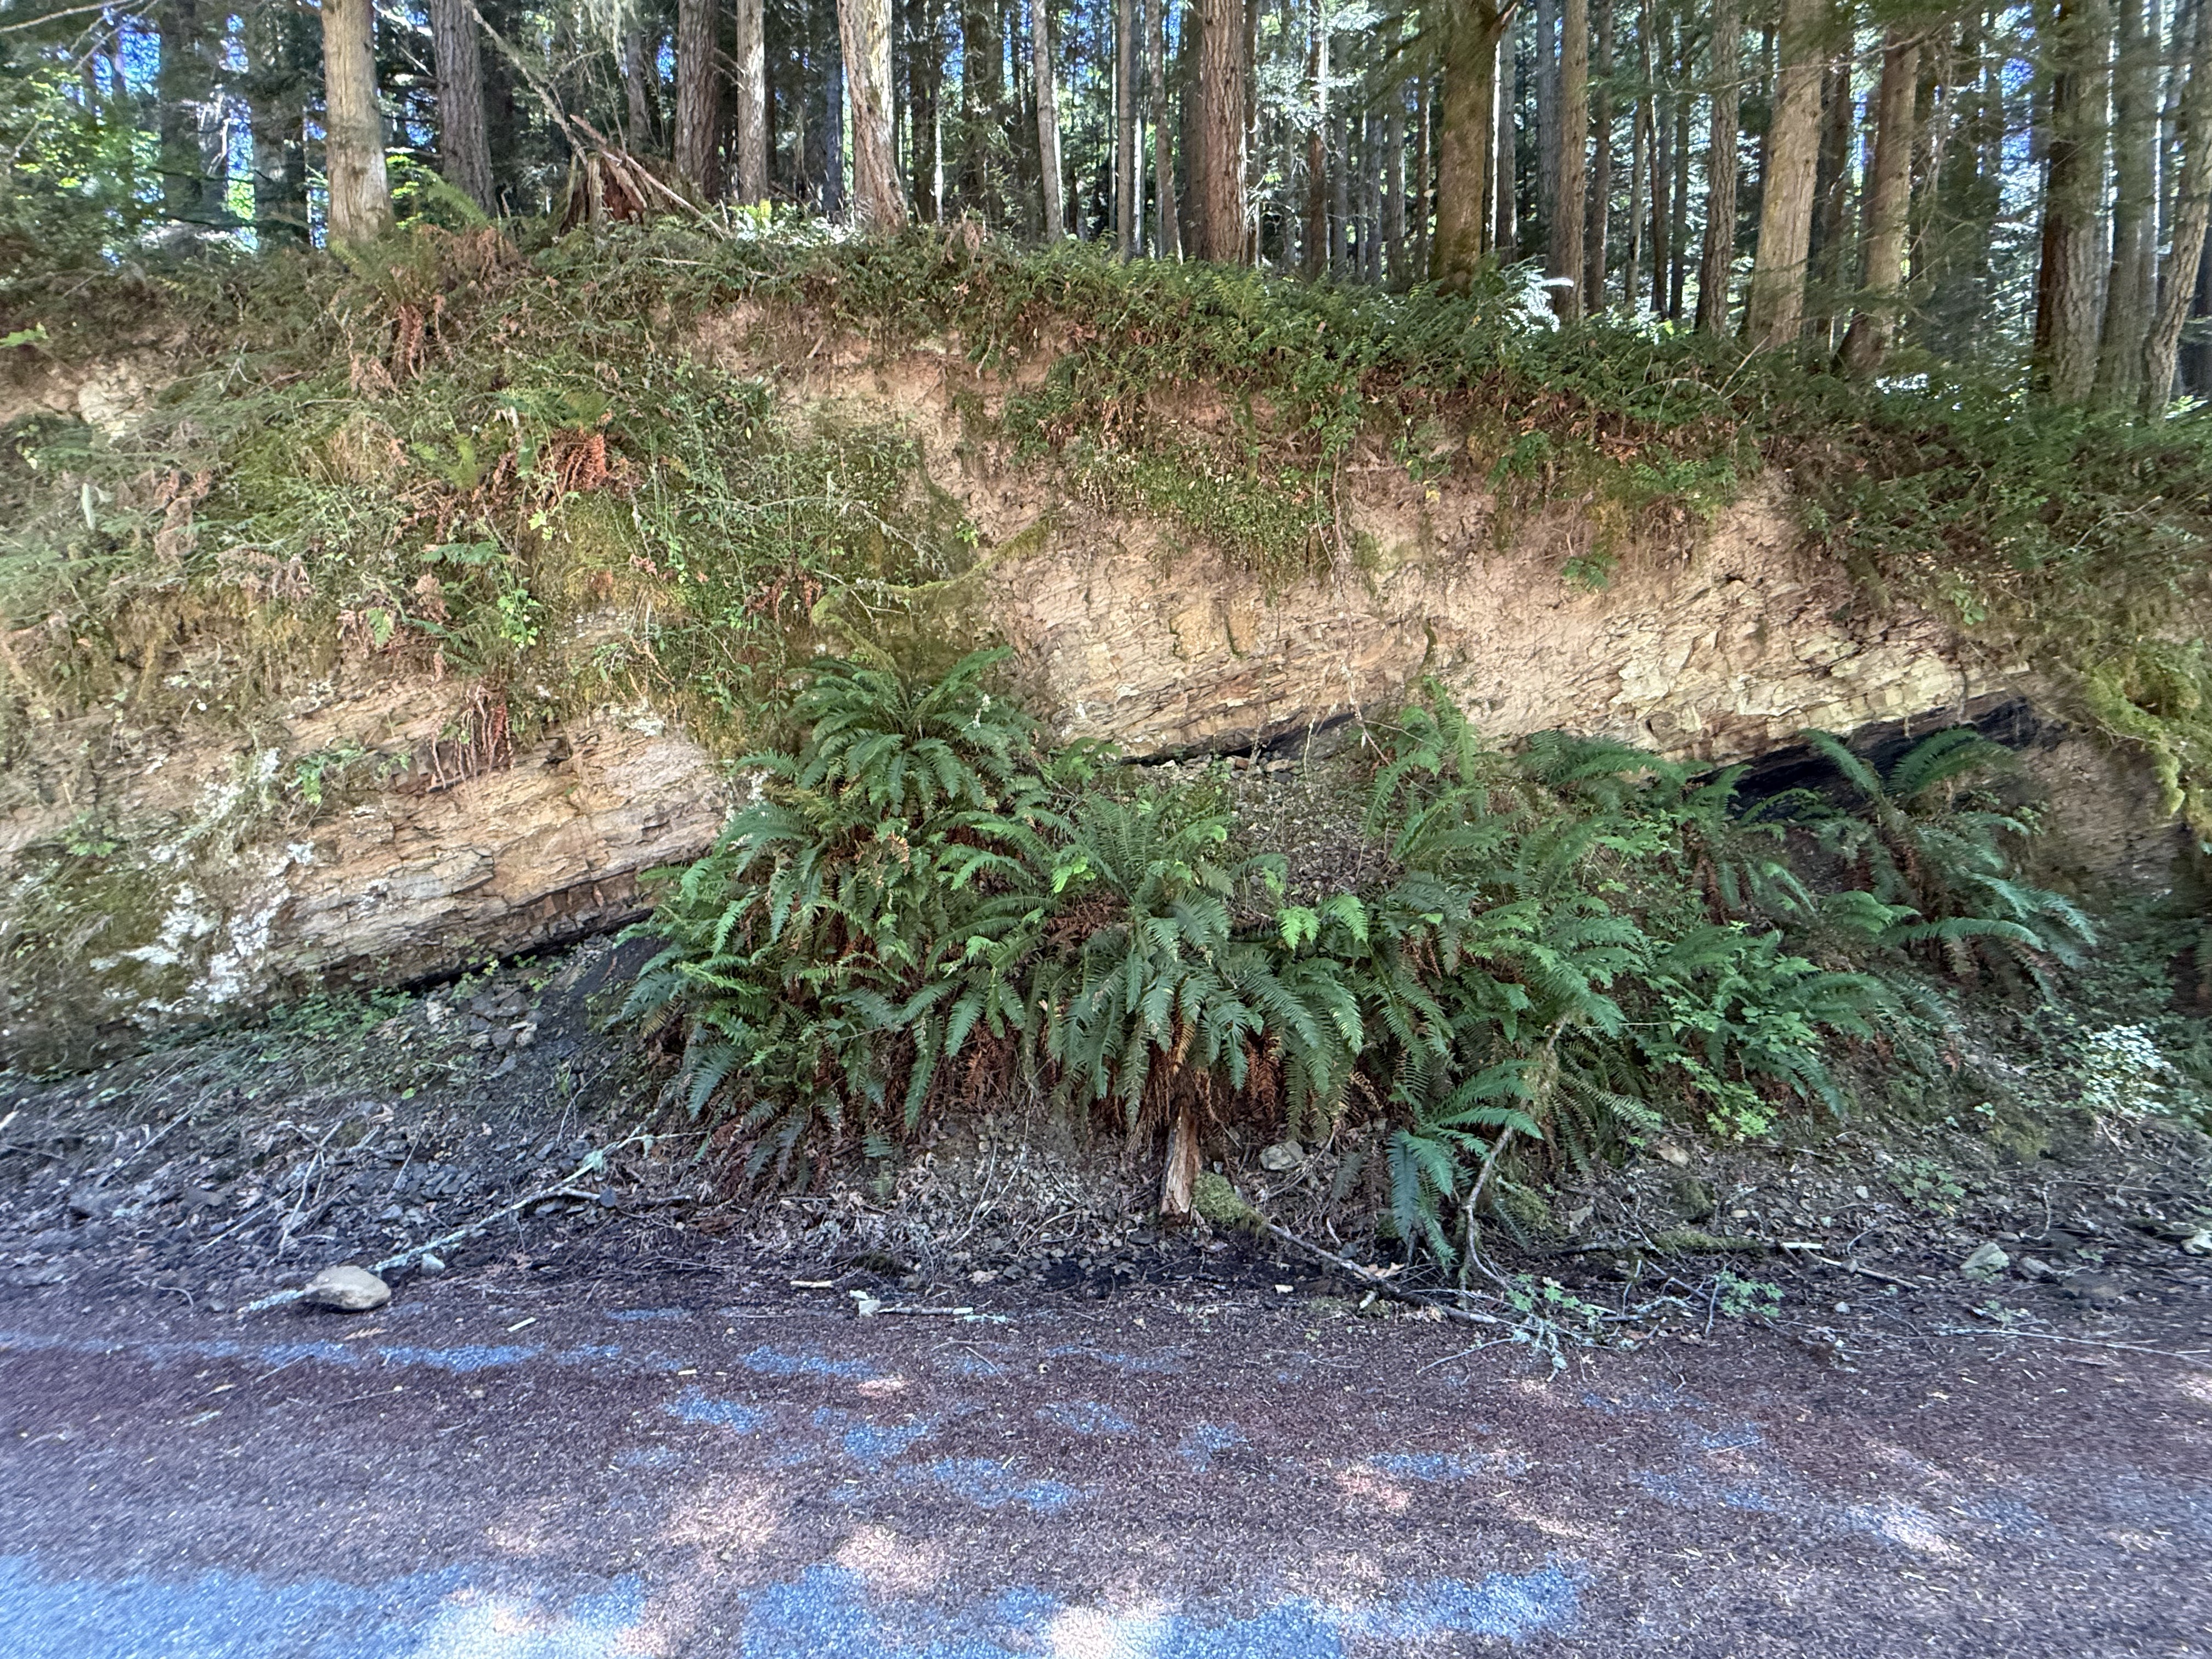
Figure 18. The main point of interest in this photo is that the Eocene sedimentary rocks are oriented differently from those in Figs. 14 and 16; these rock strata are dipping WNW(I didn’t measure strike and dip), rather than vertical or ENE. Faults don’t occur at the surface, but only shallow enough for the rock layers to break rather than bend. Identifying and mapping crustal faults is as much an art as a science because we don’t have the remote-sensing tools to see what lies beneath the surface, whether it is glacial till or bedrock.
Summary
We saw a lot more on this trip than I’d imagined during the 45 minute drive to Carbonado. I’ll put it all together into a chronology and try to relate it to other nearby locations we’ve visited. Let’s start as far back as the rocks will take us.
During the Eocene epoch, about 50 million-years ago, this area was covered with streams, lakes, and, presumably, forests. There were no rivers like the Carbon back then — the sediment consisted primarily of sand and silt, with a smattering of clay. These sediments were eroded from an active volcanic complex. Further west, along the Pacific coast of the Olympic Peninsula, contemporary rocks include turbidites deposited in deep water, probably submarine fans, and tectonic breccias. This tectonic environment has persisted to the present day. We examined one of these volcanoes, from the Miocene (~23-5 Ma), at Pinnacle Peak. We didn’t see any evidence of a nearby volcano today; instead, we saw several boulders that revealed what was going on within the magma chambers beneath the Cascades volcanoes.
Subduction didn’t end during the ensuing millions of years, but the earth changed. Ice sheets appeared during the Pleistocene (~2.4 Ma), covering the PNW while alpine glaciers formed in the valleys dissecting the volcanoes. Finally, about 500 thousand years ago, a really big magma chamber constructed Mt. Rainier; and Carbon River began to wind its way from the flanks of this monstrous volcano to the Puget Sound trough during interglacial periods. This entire canyon would have been filled with ice during cold periods. It was during this period that Carbon River would have emerged from the eroding, ice-covered terrain. It didn’t cut its canyon but inherited it, and transported the remnants of a permanently altered terrain.
During glacial retreat, thick blankets of sediment were deposited by rapidly flowing rivers fed by the glaciers. This occurred repeatedly for two million years, culminating in the most recent glacial deposits seen in Fig. 6. However, this process of glacial advance and retreat occurred within both the vast continental glacier and the alpine glaciers, resulting in overlapping layers of poorly sorted sediment.
One final word: the muddy water we saw in the Carbon River is probably caused by the clear-cutting of the steep slopes defining its canyon; however, glacial melt during the summer transports a lot of fine material from beneath the glaciers covering Mt. Rainier. When we visited the Nisqually glacier and viewed the headwaters of Nisqually River in December, the water was crystal clear. Maybe the water turns opaque every summer.
It has been a wild ride through the last 50 million years along the modern Carbon River.
The Geology of Franklin Falls
Washington has more than 3000 catalogued waterfalls, so we stumble onto them regularly. Waterfalls form wherever there is a change in the lithology of the crustal rocks: along crustal faults, which naturally create vertical planes; where weaker rocks lie beneath strong ones and are reached by a downcutting river; and of course where glaciers have sculpted the land. These natural features create spectacular views as well as revealing glimpses of deep time.

Plate 1. Franklin Falls is about 70 feet high. The reddish rocks forming the cliff are Eocene sandstones and volcanic rocks (56 – 34 Ma). The park follows the South Fork of the Snoqualmie River along I-90. The parking lot is quite large and we found a parking space, even though it was great weather; more than one million people visited the site in June.
The rocks in this photo don’t reveal well-defined bedding although there is a suggestion of bedding to the right side of the image. However, I think the bedding marker is the vertical, dark streak that is slightly wavy. This curvature suggests that these rocks were deformed while ductile (buried deep enough to bend rather than break). The geologic map identifies an anticline in the area, and I think I found it.

Plate 2. Franklin Falls is located just west of Snoqualmie Pass, at an elevation of about 3000 feet. The Northern Cascades are very rugged and access is limited, especially in the winter. The topography shown in this map reveals steep slopes, especially through this pass, which I assume is the easiest route through this rugged terrain.

Plate 3. The geologic map from Rock D shows three distinct rock units, which reveal the general geological history of this area. The oldest rocks are part of the Jurassic melange belt (201 Ma), comprising metasedimentary and metavolcanic rocks that were originally deposited in deep water, possibly on a submarine fan. These sediments were buried and then scraped off the subducting ocean plate. This process deformed them as if they were put in a blender; hence the name, melange.
Almost 150 million years are missing before Eocene volcanic and sedimentary rocks were deposited in a continental setting, possibly a river or lake not too close to mountains; the rocks seen in Plate 1 don’t contain any large boulders like we see in the modern river bed below them.
Granodiorite is an intrusive igneous rock containing light-colored feldspars like albite, and slightly less quartz than granite. This batholith was emplaced during the Miocene (23-5.3 Ma) into rocks much like the Eocene rocks exposed along the river (Plate 1). However, granodiorite magma does not produce andesite, which is the most common volcanic rock in the Cascades. All those plutons being shoved into the upper crust exhibit a lot of chemical variety because the magma mixes with continental crust as it rises.
The final piece of the puzzle is the normal fault shown on the geologic map. The NW block of melange is labeled with a “U” to indicate that it moved upwards relative to the SE block of sandstone/volcanics. This displacement brought the older (Jurassic) rocks upward, eroding the rocks that were deposited above them. The fault isn’t shown as extending into the granodiorite, however; it is very difficult to identify a fault (usually by displaced stratigraphic units) in relatively uniform intrusive rocks, which contain no layering. If the field geologist saw evidence of this fault extending into the granodiorite, they would have used a dash line to indicate uncertainty. This line stops cold…

Plate 4. This photo is looking NW, across the fault, towards the melange. This peak is a block of Jurassic rock that was once tumbled in the accretionary wedge after it was scraped off the subducting ocean crust. The peak further back is Denny Mountain, Oligocene (34-23 Ma) volcaniclastic deposits. They are older than the granodiorite. We couldn’t hike around these mountains to see the rocks up close, but fortunately, gravity has made our job easier.

Plate 5. These are small boulders of the Jurassic Melange that rolled down the steep slope (i.e. face of the fault) and landed in the river bed (see Plate 1). (A) Mud deposited in the deep-sea trench was buried deeply enough to squeeze quartz and feldspar into veins (thin white lines in the image). However, it is probable that the thick layer of light-colored minerals were injected along weak points when the Miocene granodiorite was emplaced. Note that the vein becomes more orange to the right of the sample; this is probably a local concentration of K-feldspar (e.g. sanidine). (B) This sample looks like it was spun in a blender because the thin layers of light-colored minerals are twisted rather than approximately following original bedding (which has been obliterated).

Plate 6. This rounded boulder of granodiorite is about 18 inches in diameter. The large, white phenocrysts are plagioclase feldspar with a low Ca content whereas the darker ones with blurred sides are hornblende. The matrix is fine-grained plagioclase with a higher Ca content (feldspar composition varies with potassium-sodium-calcium). Calcium is associated with dark, potassium with pink, and sodium with white-colored crystals.
Summary
Today’s field trip was a unique opportunity to integrate the large scale observations (Plates 1 and 4) with hand samples (Plates 5 and 6) using a geologic map (Plate 3) as a guide to understanding the geologic history of the Cascades Range. Let’s try to create a simple, plausible geological history from what we know.
I’m going to list a series of geologic events because I don’t feel like finding/creating schematic cross-sections to pictorially demonstrate what I’m saying. I’ll start from oldest and proceed to the youngest.
- About 200 Ma: Muddy sediments were deposited in a subduction trench, which was approximately aligned N-S along the axis of the later Cascades range. Over the next 10-20 Ma these sediments were buried miles beneath younger erosional debris, until they were snagged by the overlying NA tectonic plate and deformed like putty.
- Between 120 and 60 Ma: It is unclear exactly what occurred, but subduction ceased, probably because several large crustal blocks slid to the NW along a series of transform faults. The melange we see in Plates 4 and 5 missed the boat and remained buried, slowly inching their way to the surface.
- About 60 Ma: Subduction resumed and a series of volcanoes produced lava, which mixed with sandy sediments in a continental environment. Volcanism continued for 30 Ma, creating a mixture of fresh lava and sandy sediments, which were buried while erosion continued — a delicate balance of tectonic uplift and isostatic sinking.
- Between ~30 and 23 Ma: Tectonic uplift increased, bringing the Jurassic melange and Eocene rocks (Plate 3) into the crust’s brittle fracture zone, driven by a combination of subducting plate dynamics and upwelling magma, as the ocean plate melted. This agglomeration of different rock types began to fracture along contacts, while still deforming plastically internally. The normal fault seen in Plate 3 would have occurred along such a seam during this complex exhumation process.
- A series of hot, rising plumes of magma originating at the top of the subducting ocean slab eventually reached these rocks, possibly within a few miles of the surface, between 23 and 5 Ma. The granodiorite filled every fracture and fault, creating the complex pattern seen in Plate 3. The thick veins of quartz/feldspar seen in Plate 5A would have been injected during this interval.
- Exhumation has continued, from 5 Ma to the present, modified by glacial scouring of the ancestral Snoqualmie River canyon. Today we see these rocks conveniently frozen in time, from our perspective.
Identifying the contacts between these many rock facies is a laborious task that will take decades, if not centuries, to complete. Nevertheless, it is obvious that a lot has occurred in the last few million years. The earth’s surface is a conveyor belt on which the pile of soil/rock is constantly removed by wind/rain/snow/ice…
That’s my story…
Geological Survey of the Columbia River Gorge
The popular route east from Portland, Oregon, is I84 following the Columbia River, which cuts across the Cascades range. There are plenty of scenic views and geology to examine, but few safe places to stop. Thus we followed the Washington shoreline along state route 14.
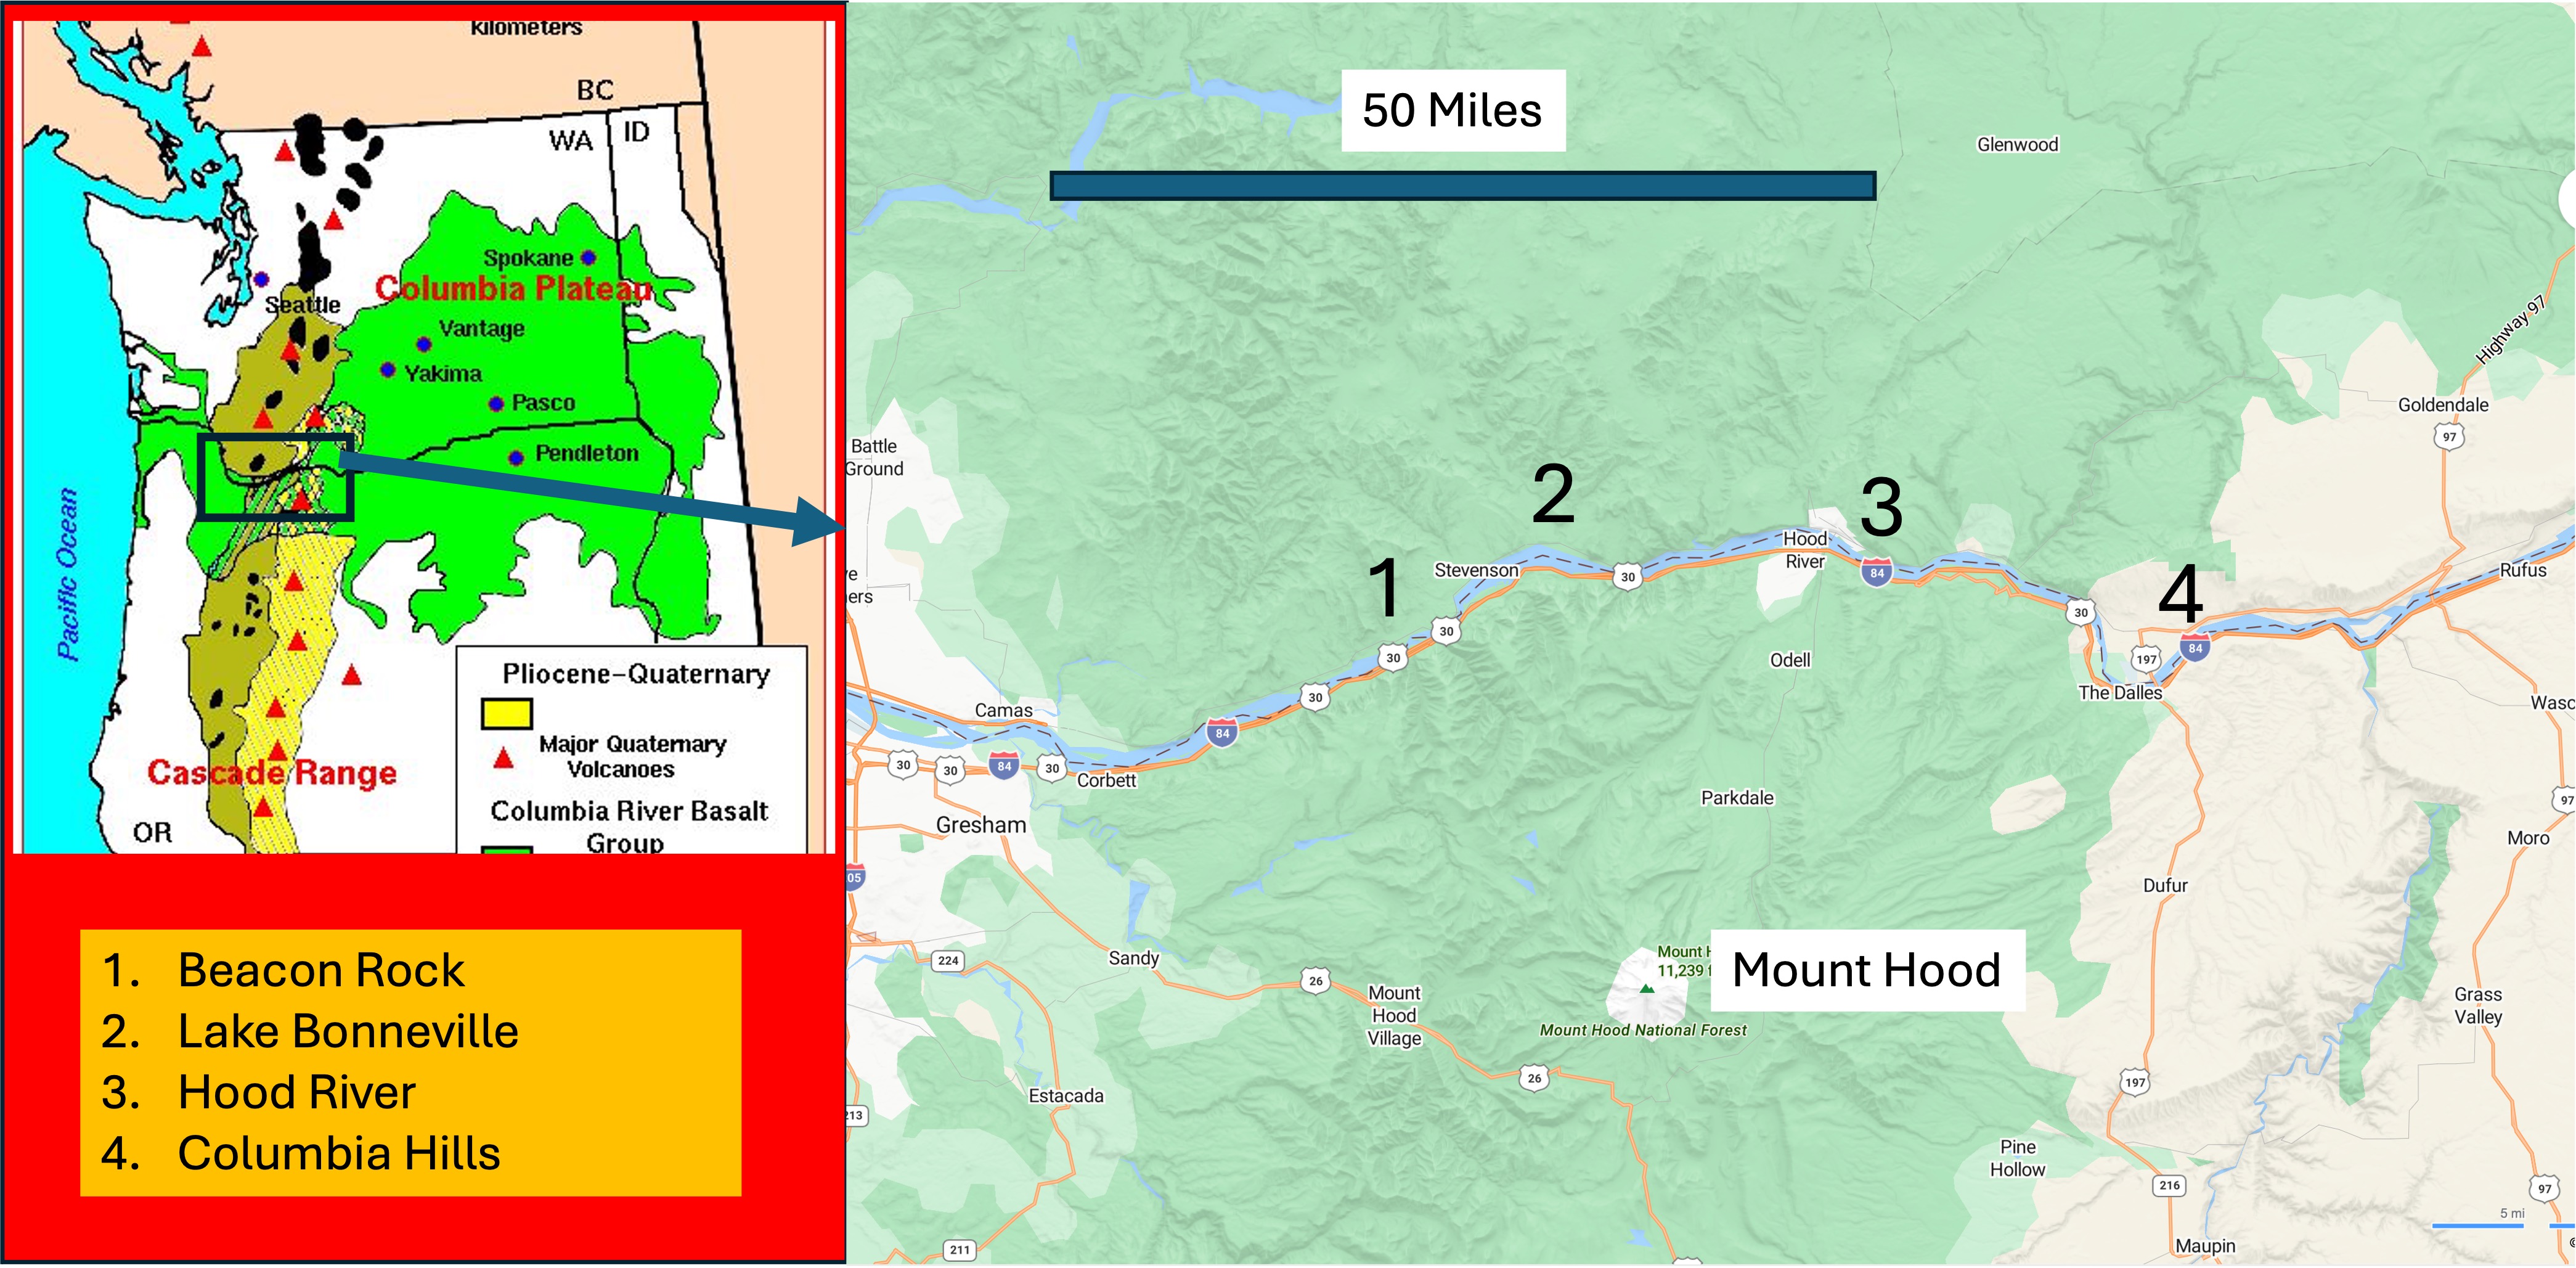
The inset map shows the distribution of volcanic rocks within Washington and Oregon. The oldest are predominantly andesites erupted from volcanoes (triangles) within the Cascades between about fifty and five million years ago (Ma), shown in light brown. The bright green represents the Columbia River Basalt Group, which flowed from fissures between seventeen and five Ma. The youngest rocks are primarily andesite erupted from volcanoes within the last million years (e.g. Rainier, St. Helens, Hood, Baker). The rectangle shows the area we are traversing, which contains a mixture of these rocks.
We stopped frequently, but I’ve lumped the photographs into four areas: 1) Beacon Rock is near the beginning of Columbia River Gorge; 2) Lake Bonneville and 3) Hood River give a good picture of the central canyon; and 4) Columbia Hills is where the river enters the gorge before cutting through the thickest section of volcanic rocks.
1. Beacon Rock
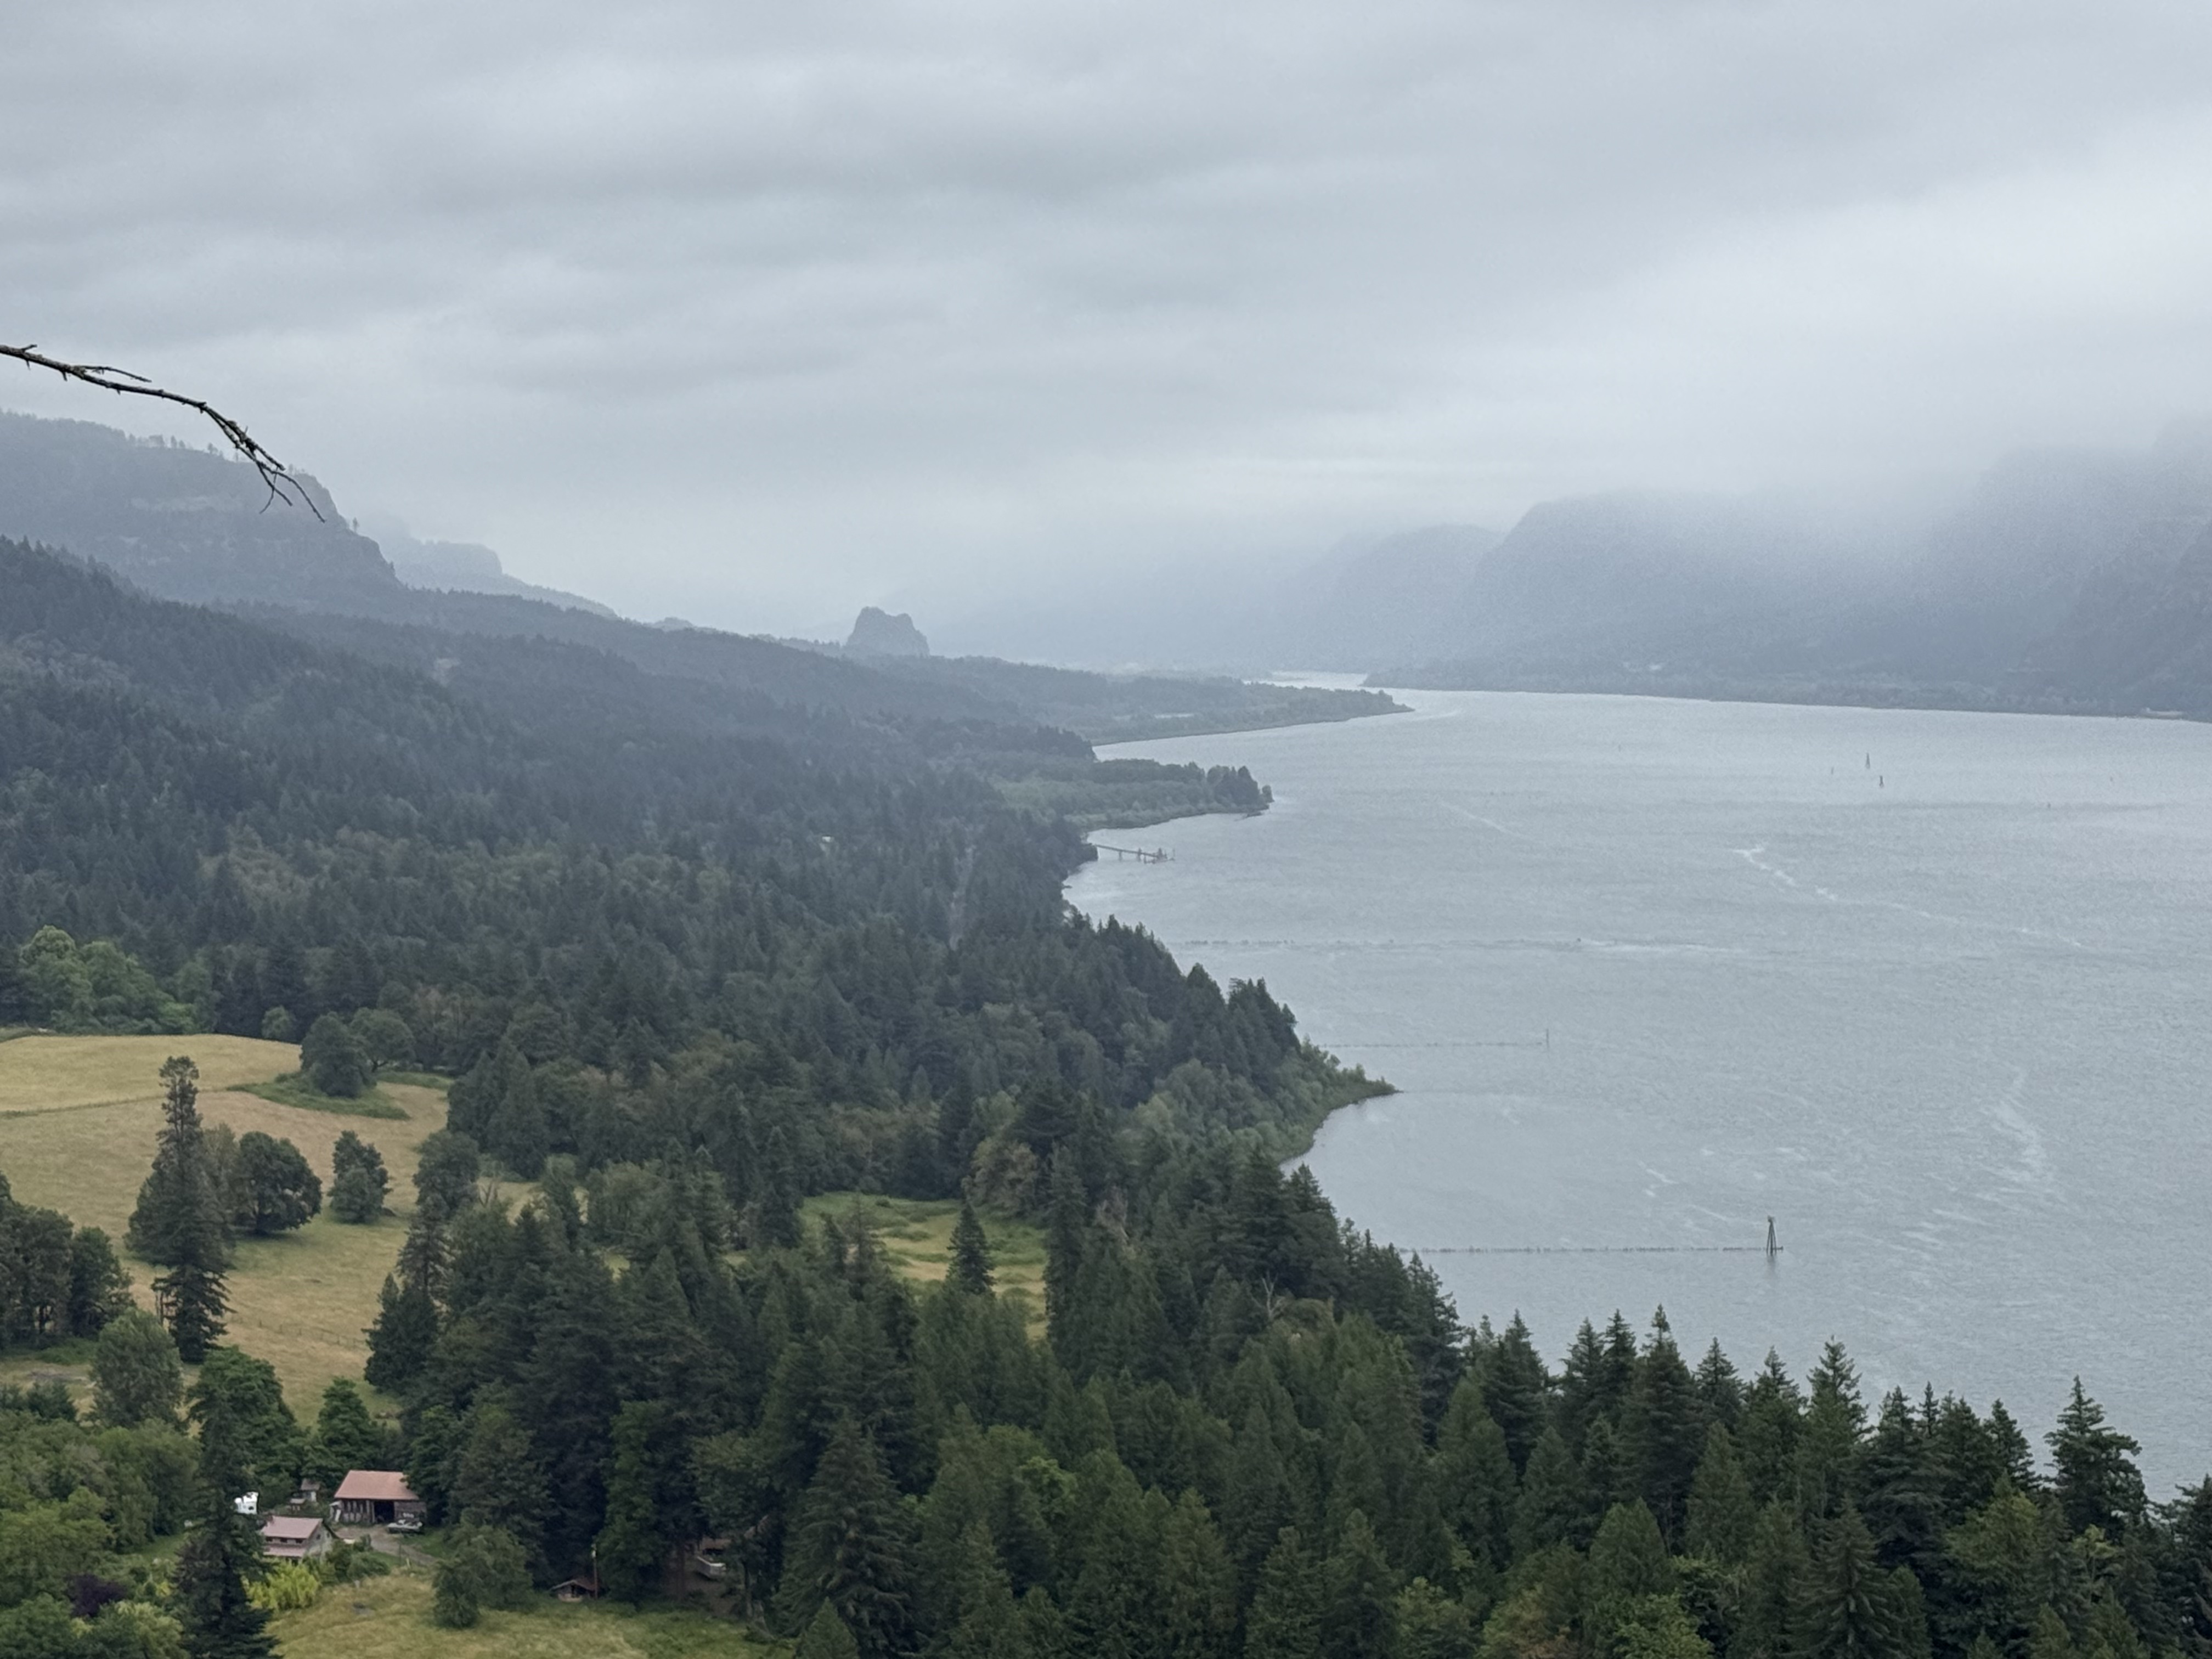
This photograph looks east towards Beacon Rock, which has an interesting origin. It was originally injected into a cinder cone volcano about 60 thousand years ago (Ka). Subsequent, multiple glacial floods eroded the loose material away, leaving the core, which is called a neck. This region was never covered by continental glaciers, although there is evidence of alpine glaciers like those still existing on the high volcanoes (e.g. Rainier or Hood). During numerous advances and retreats of continental glaciers into Canada, large lakes formed and periodically drained catastrophically. These floods, which were as deep as 1000 feet, naturally followed the Columbia River to the Pacific Ocean.
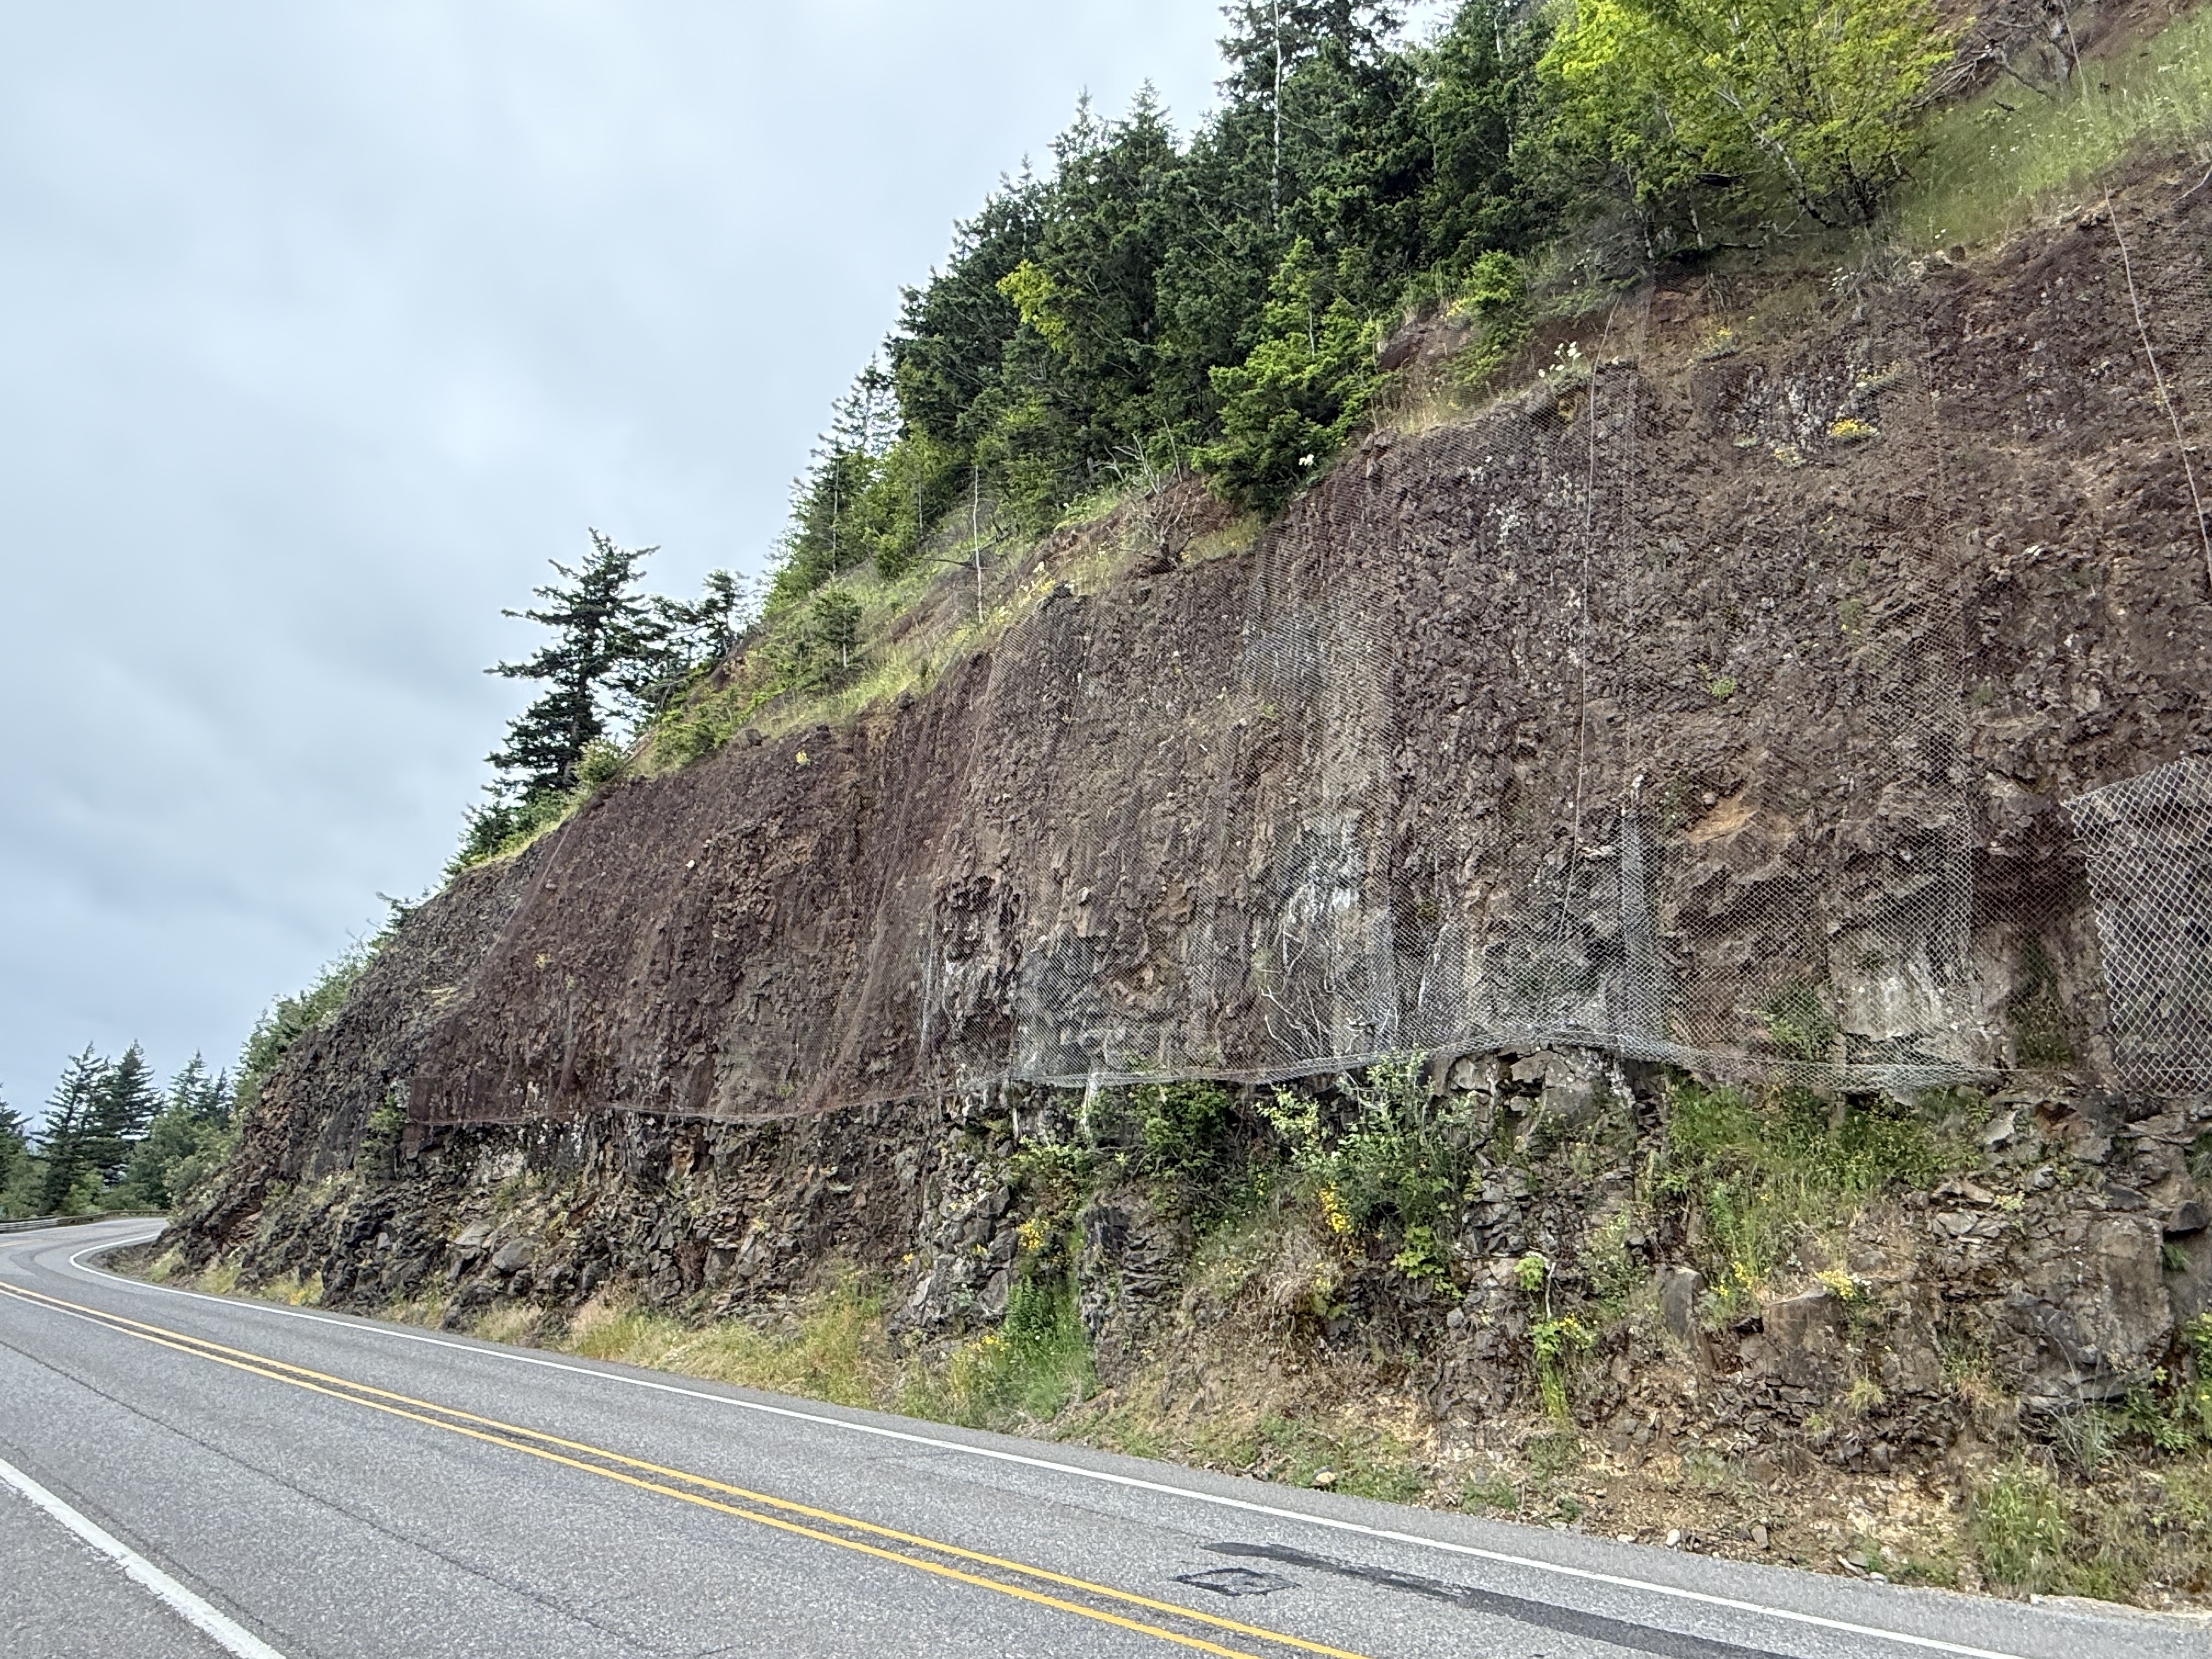
This low road cut reveals a thick layer of volcanic rock (basalt, according to Wikipedia) overlain by volcaniclastic rocks, which are loosely cemented. That’s why the DOT placed netting over the friable layer. These are sedimentary rocks consisting of volcanic ejecta as well as material transported by water.
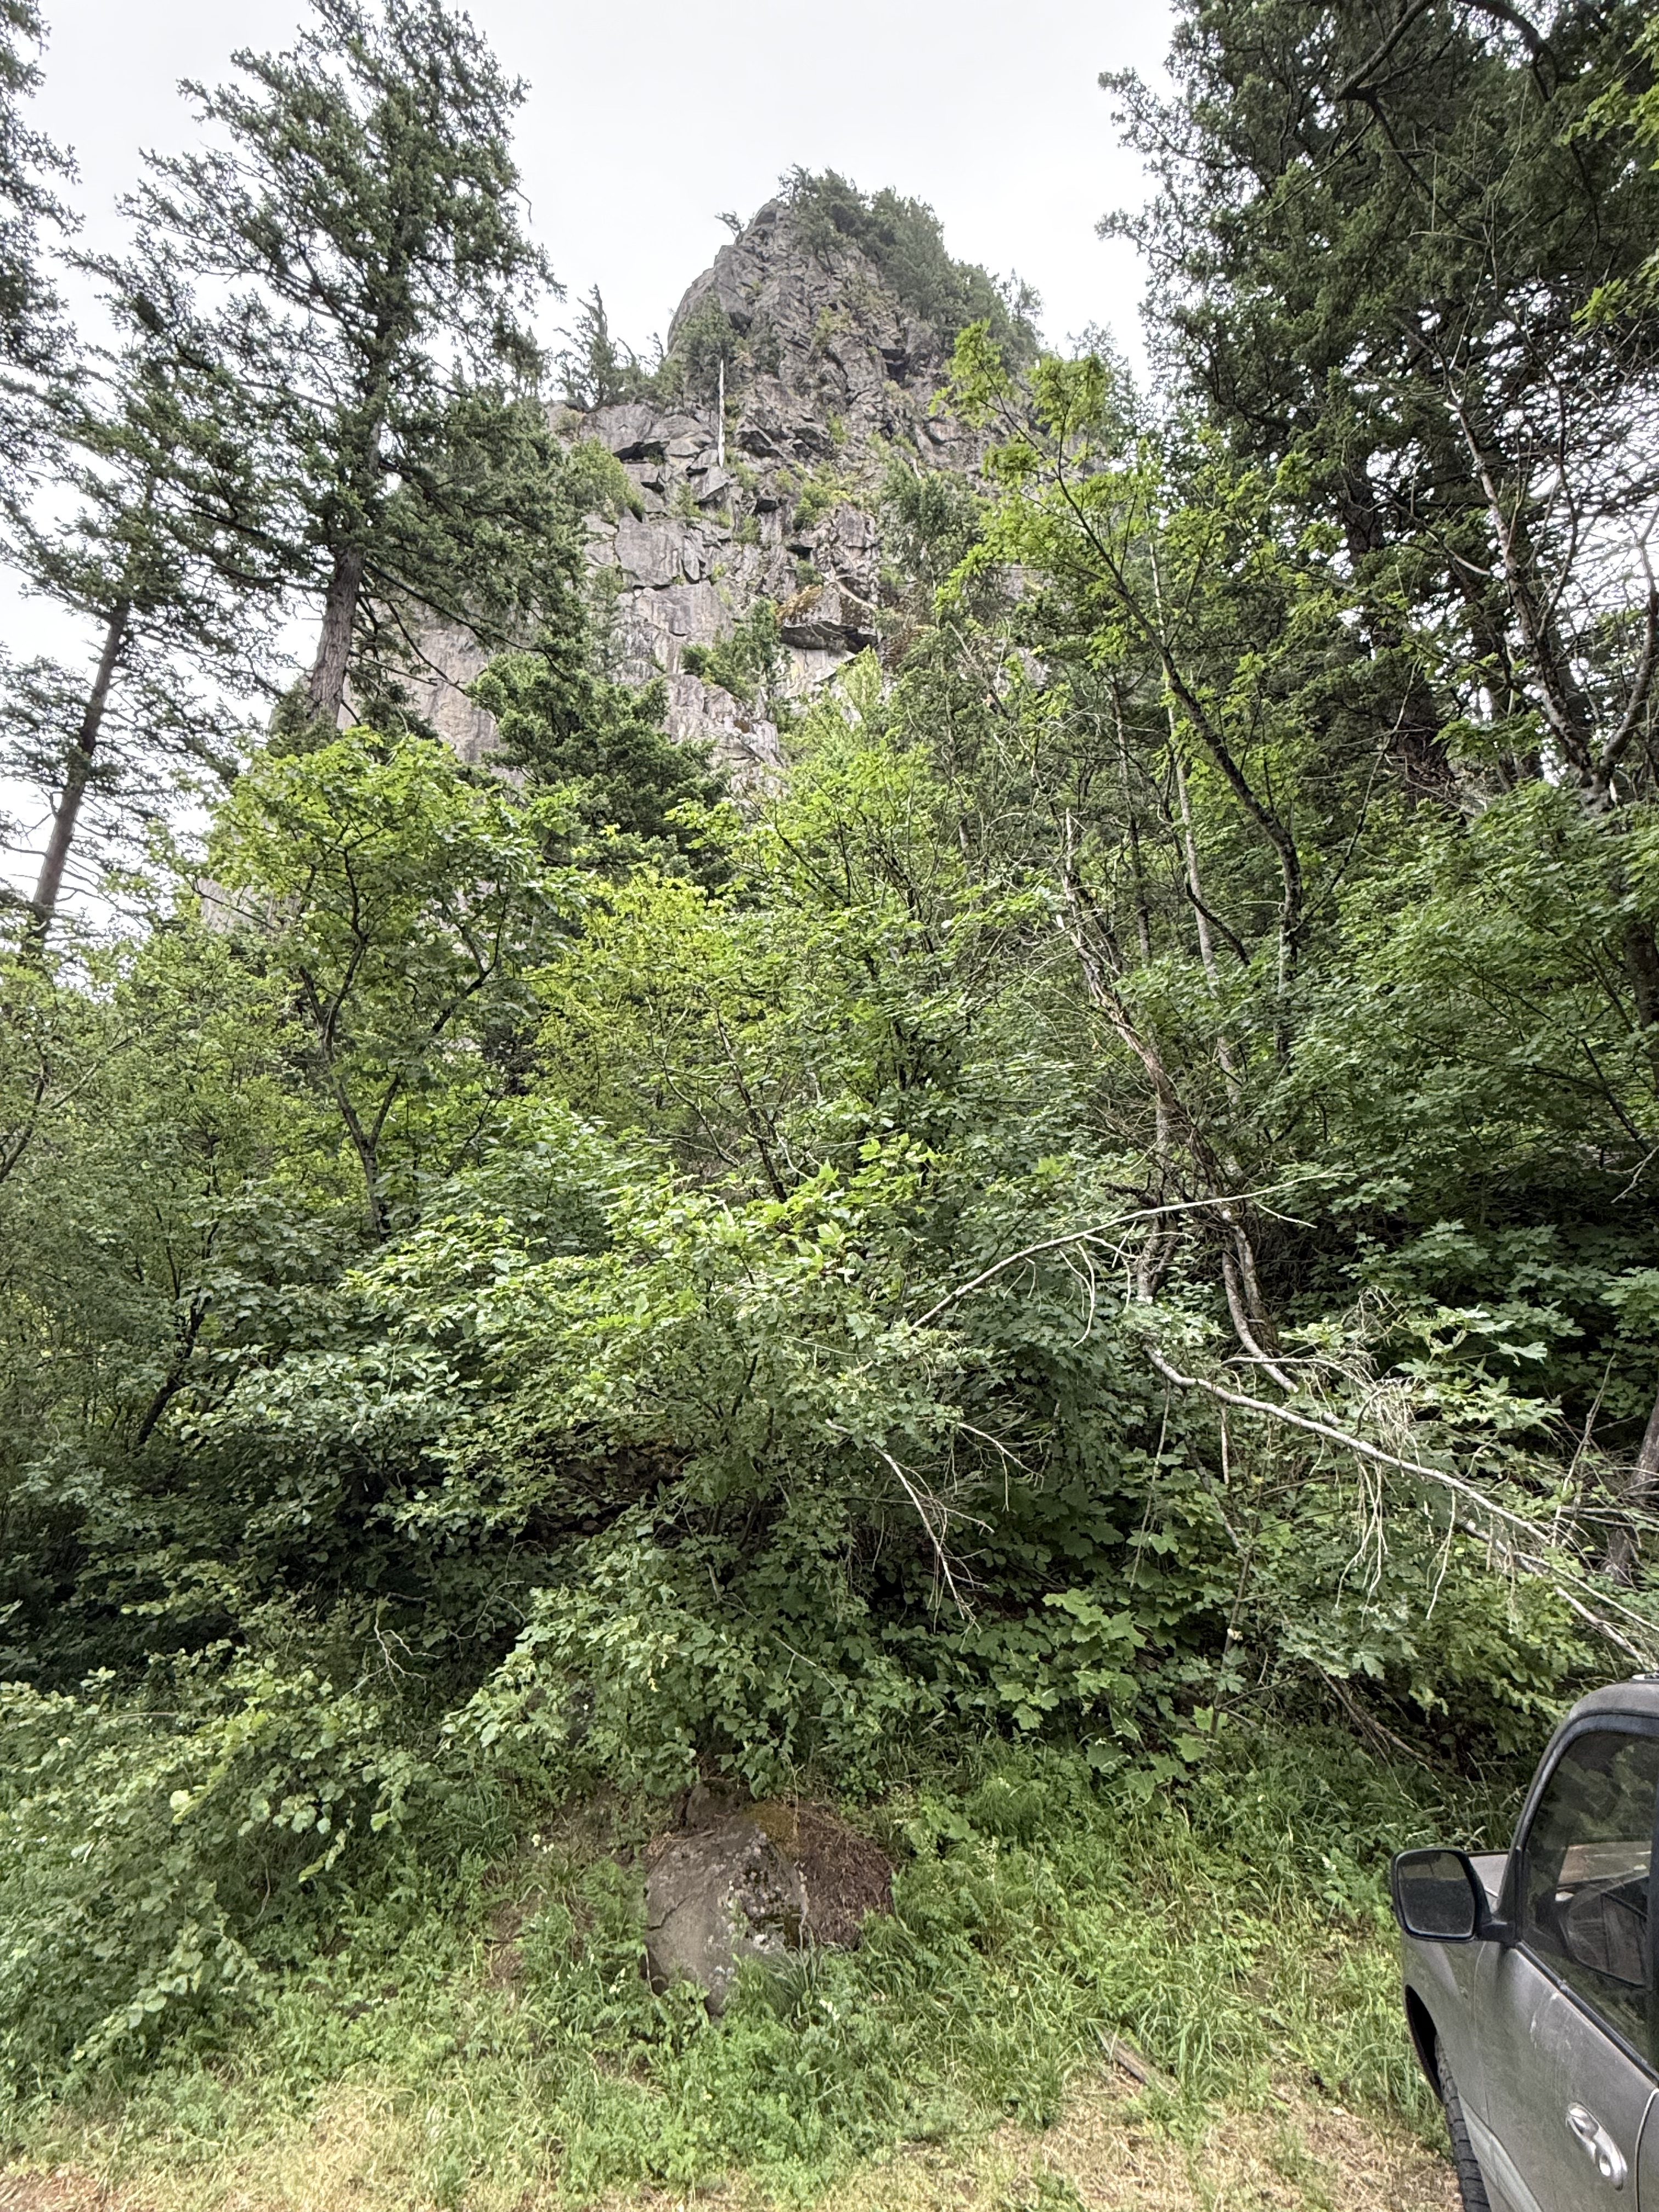
According to Wikipedia, Beacon Rock is 848 feet tall and there is a trail to the top that is popular with hikers. It doesn’t look that high from the bottom, but I’m glad I didn’t trust my first impression and climb it; as stubborn as I am, I would have made it–and wished I hadn’t for the next week. It looks a little pale to be basalt, including the boulder visible at the bottom of the image; in a terrain with continuous volcanism, spanning the gamut from rhyolite to basalt, for 50 Ma, you just can’t tell from surface features. Some basalt is a little lighter colored and some andesite is darker–it’s a spectrum based on mineralogy, not color.
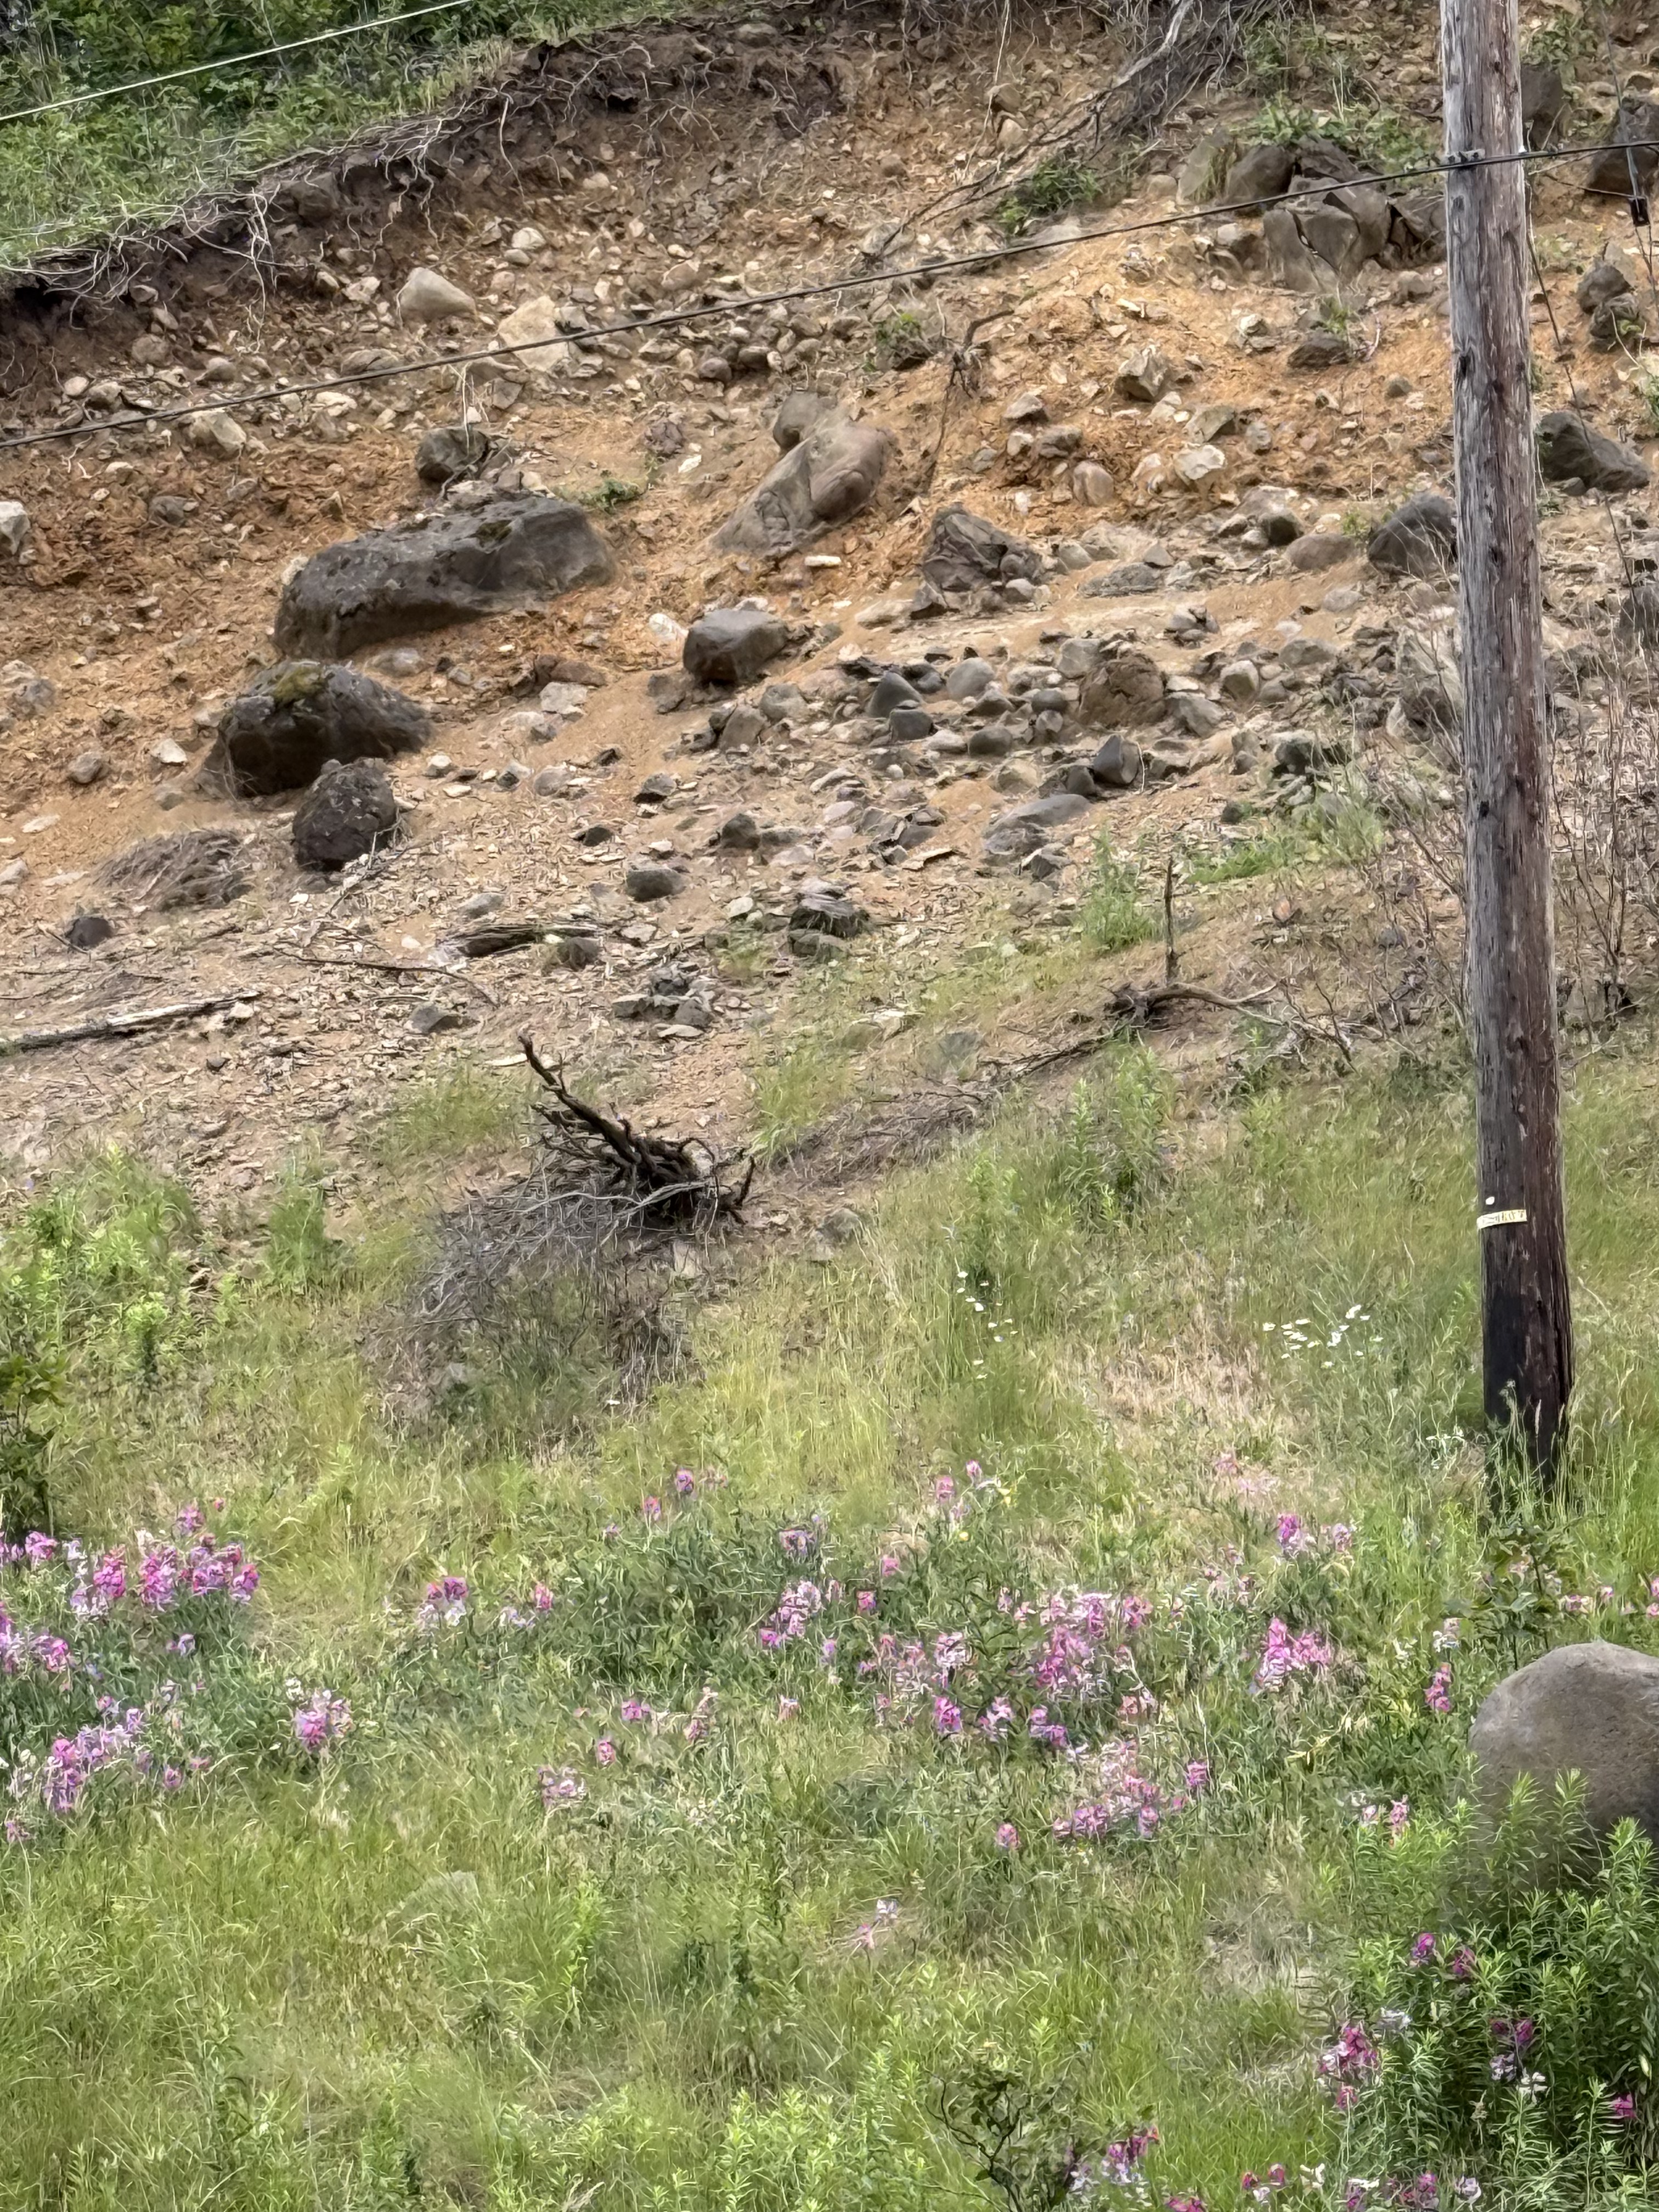
This eroded slope got my attention because it reveals an interesting juxtaposition of an exposed basalt outcrop that is rounded (unlike the earlier exposures we saw) and light-colored boulders of much smaller size (less than three feet). These rocks are too uniformly light in color to be weathering of basalt or andesite. There is some rhyolite (a leucocratic extrusive rock found within the Cascades) in the region, but an alternative explanation is that these are flood deposits from the aforementioned glacial lakes. There are many deposits from these mega floods within the gorge, but I couldn’t (easily) find a map of them. Anyway, this is what I would expect to find in such a sedimentary deposit–mixed rock types that are rounded by transport tens, if not hundreds, of miles during flooding episode. The bedrock would be rounded by collisions with these boulders. If the shoe fits…
2. Lake Bonneville
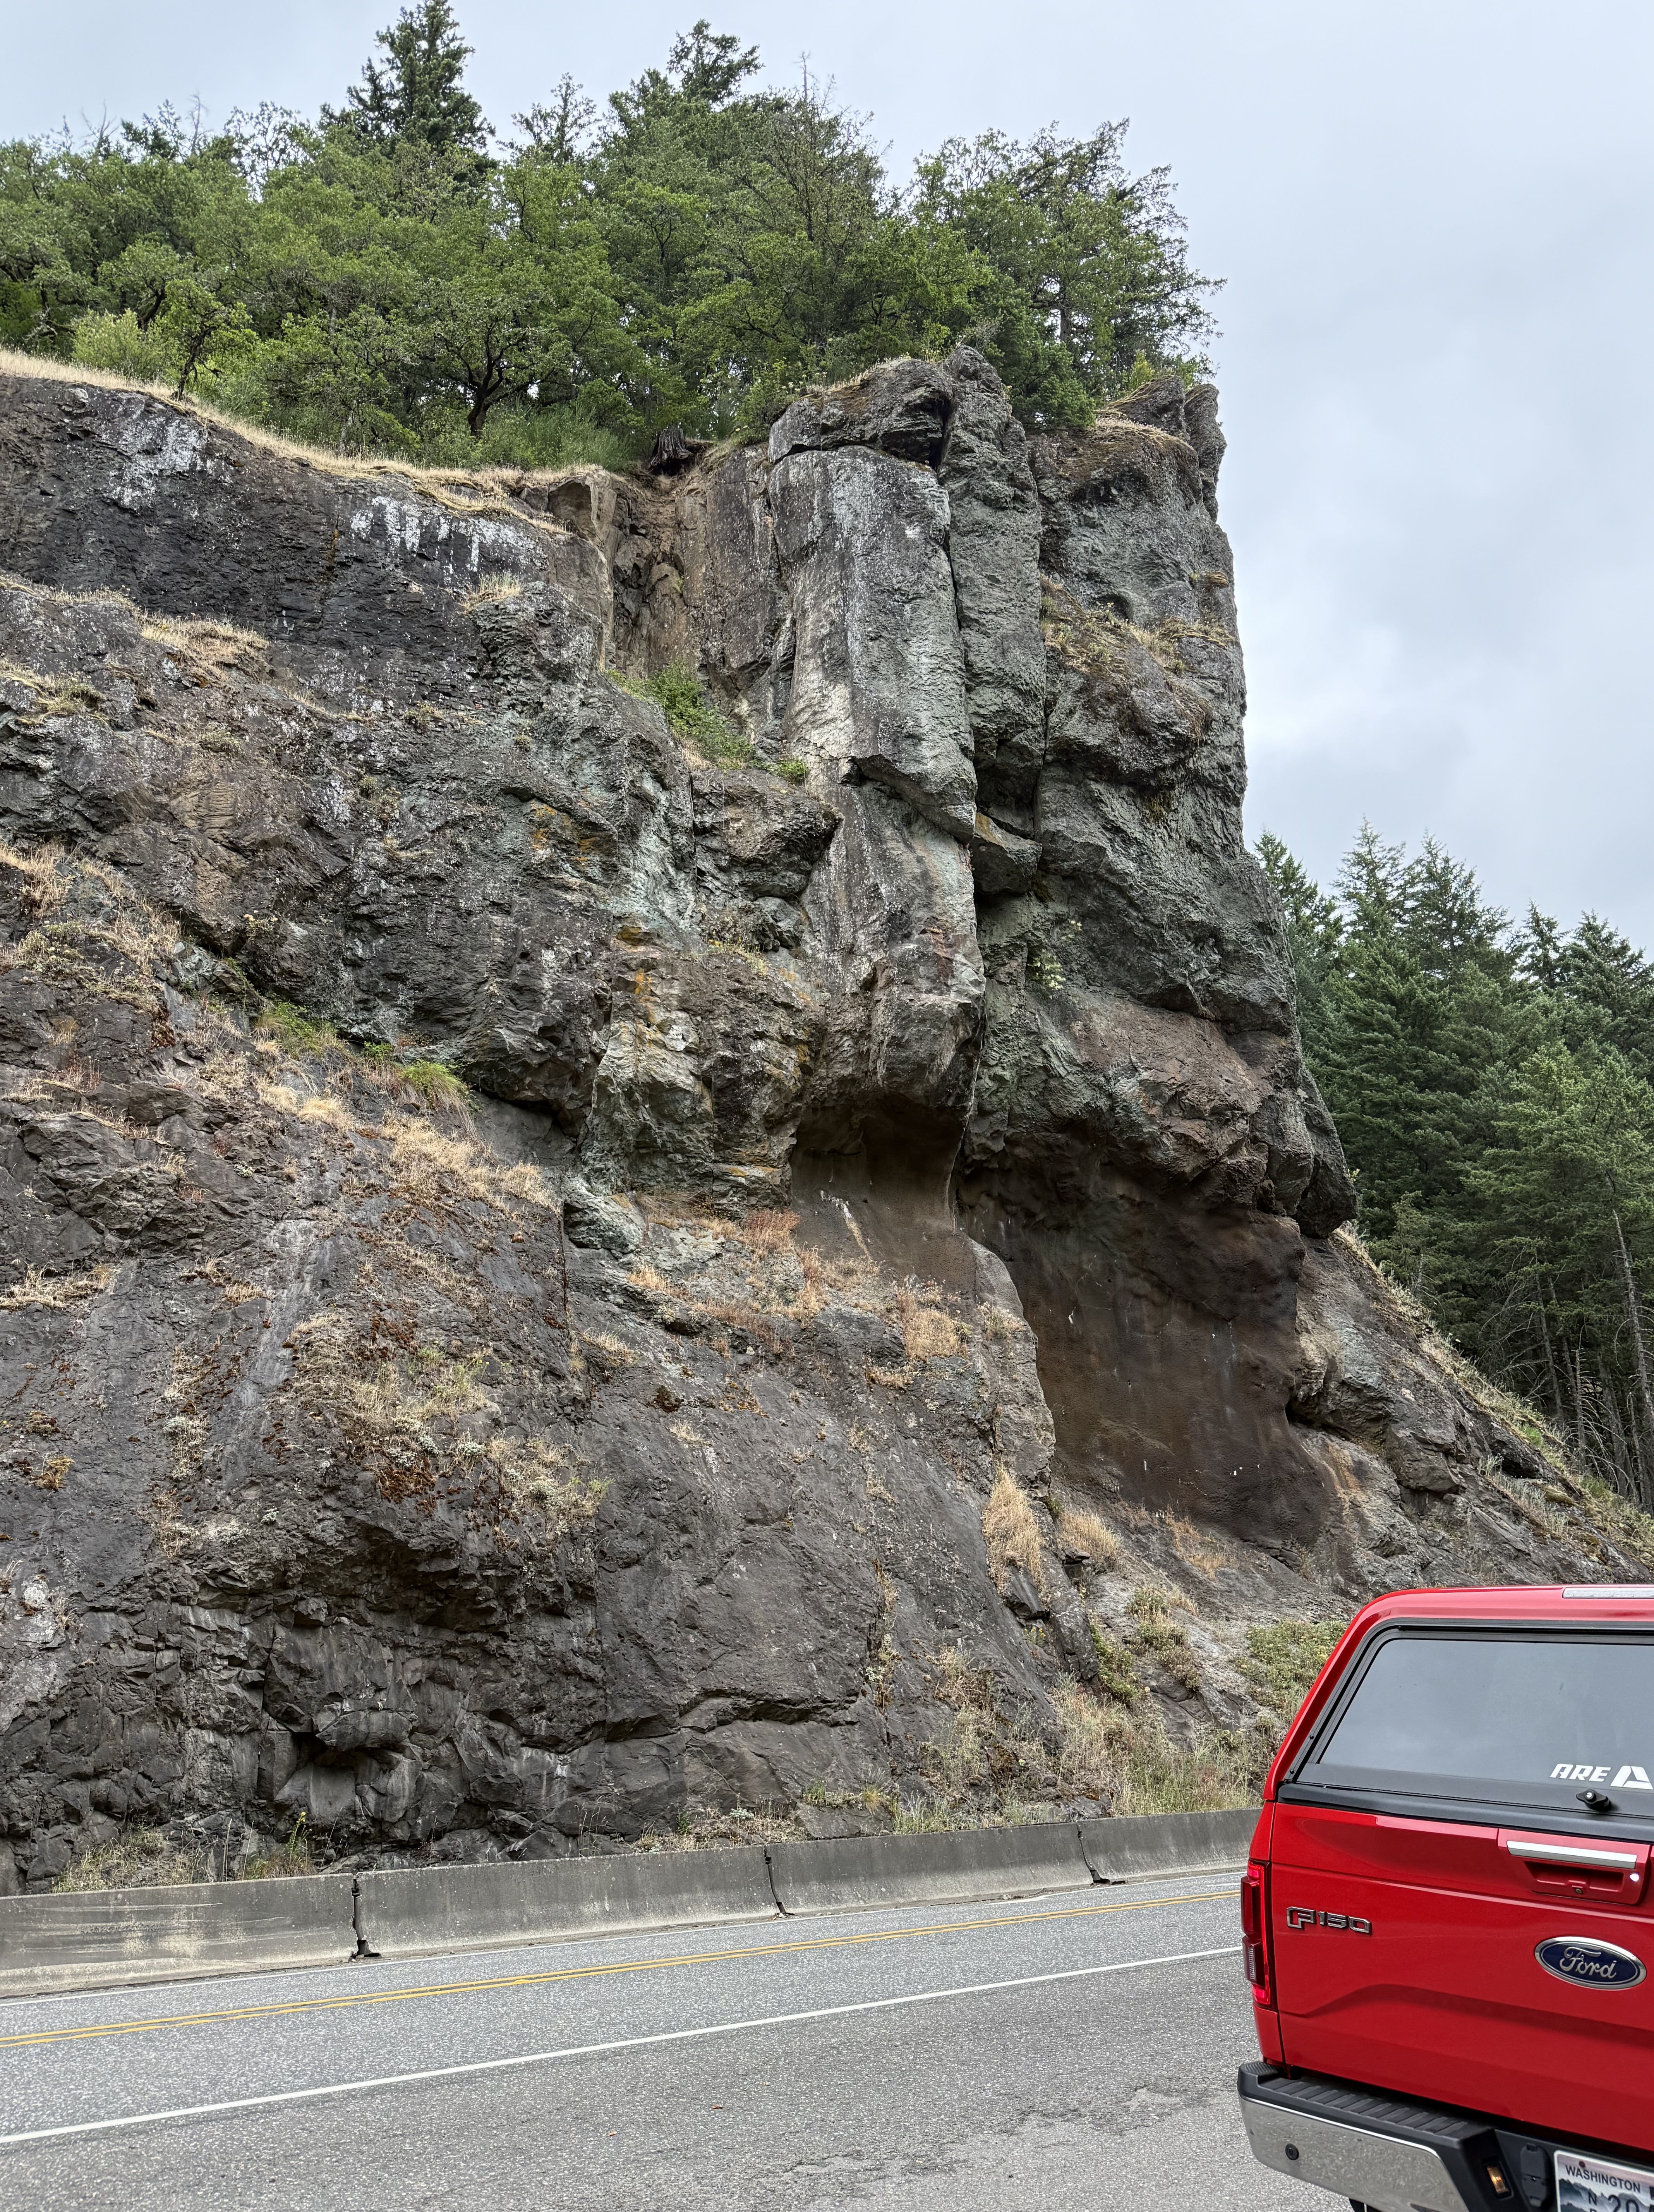
The central part of Columbia River Gorge is characterized by several broad valleys with sediments filling the margins of the canyon. This is a typical exposure from this area. The rock looks like basalt to me; the map (see first plate) shows a mingling of volcanic rocks along the river, which would have been a low point for lava to flow towards. However, this is not a volcaniclastic deposit as we saw before; instead, there are several, heavily weathered (i.e. smooth) flows of lava (3-10 feet thick). The lowest layer seems to be dipping towards the camera as if flowing down a steep slope. Maybe…
3. Hood River
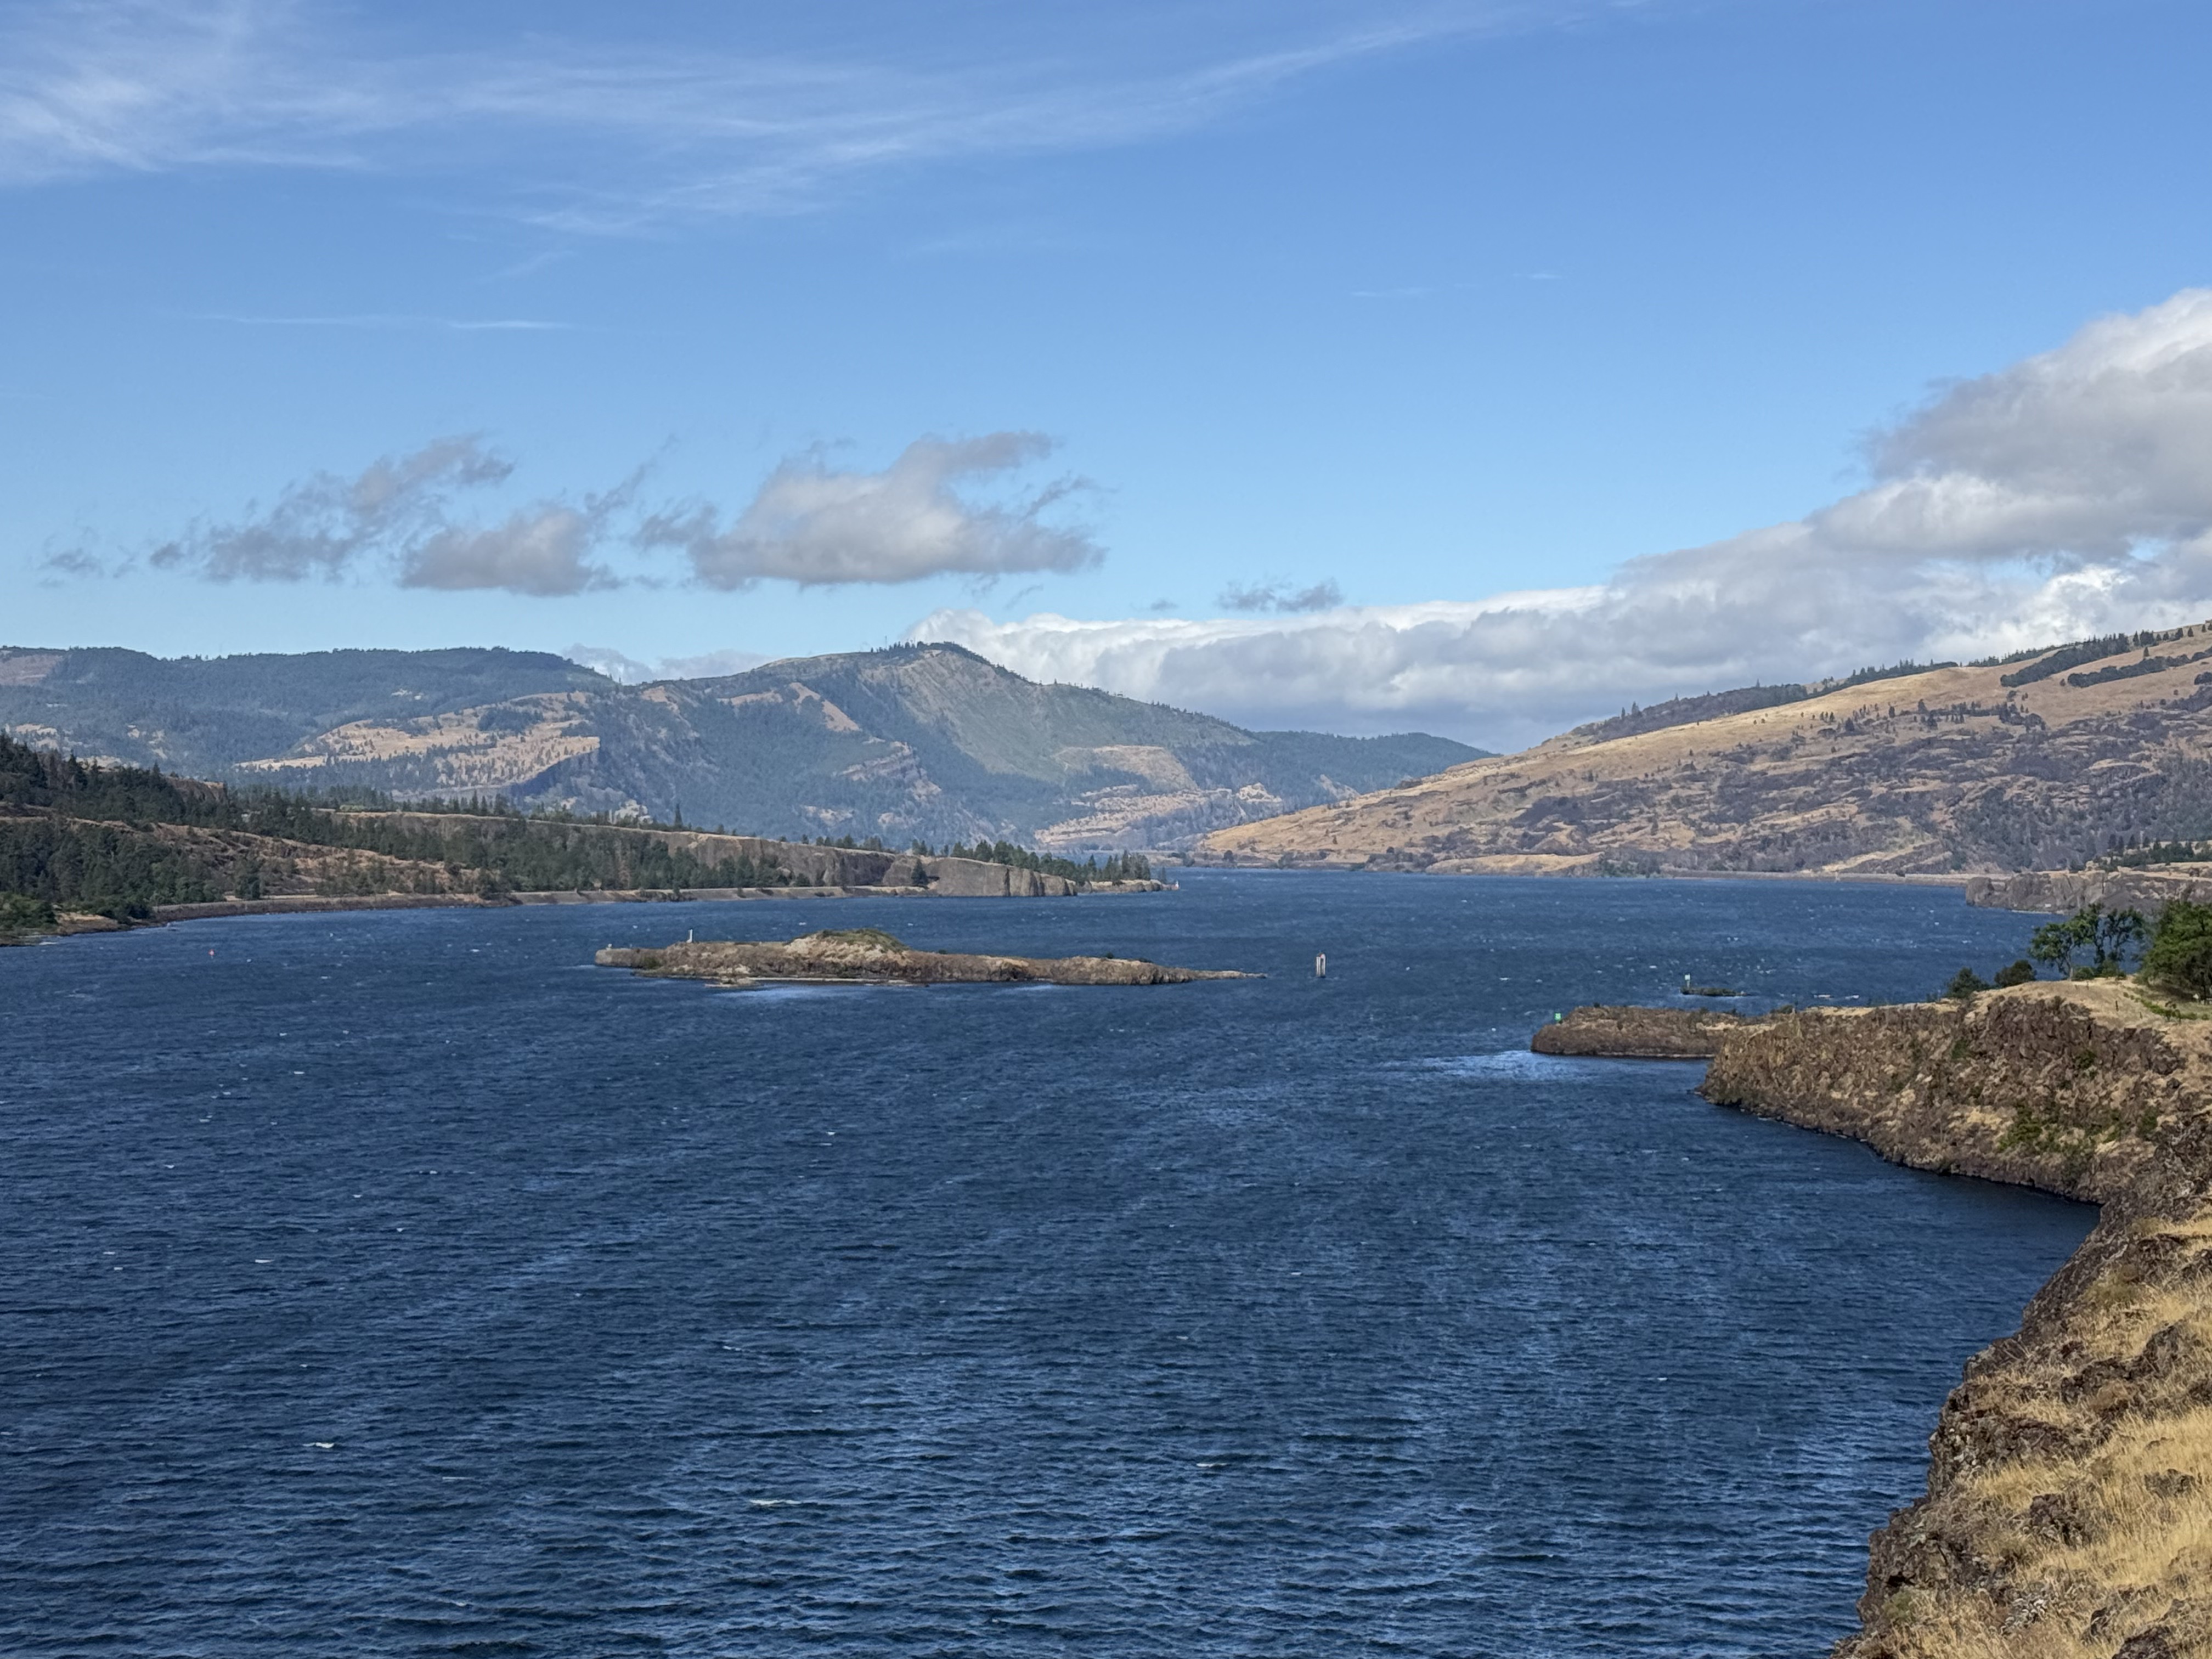
This location is close to the eastern entrance to Columbia River Gorge, where flood basalts erupted from multiple fissures in the crust. In other words, there are no nearby volcanoes and steep slopes; thus, the basalt flowed over a relatively flat landscape, forming rolling hills. This photo reveals basalt flows that gently slope to the left, as seen in the middle-right and background of the image. These massive flows partially blocked the river many times–long before glaciers dominated the landscape. The island in the center of the channel is a remnant of one. I haven’t heard of any glacial lakes in this area, however, so the blockage must have been partial–these thick sequences of basalt didn’t occur at one time, but over millions of years, giving the ancient Columbia River time to erode passages through them.
4. Columbia Hills
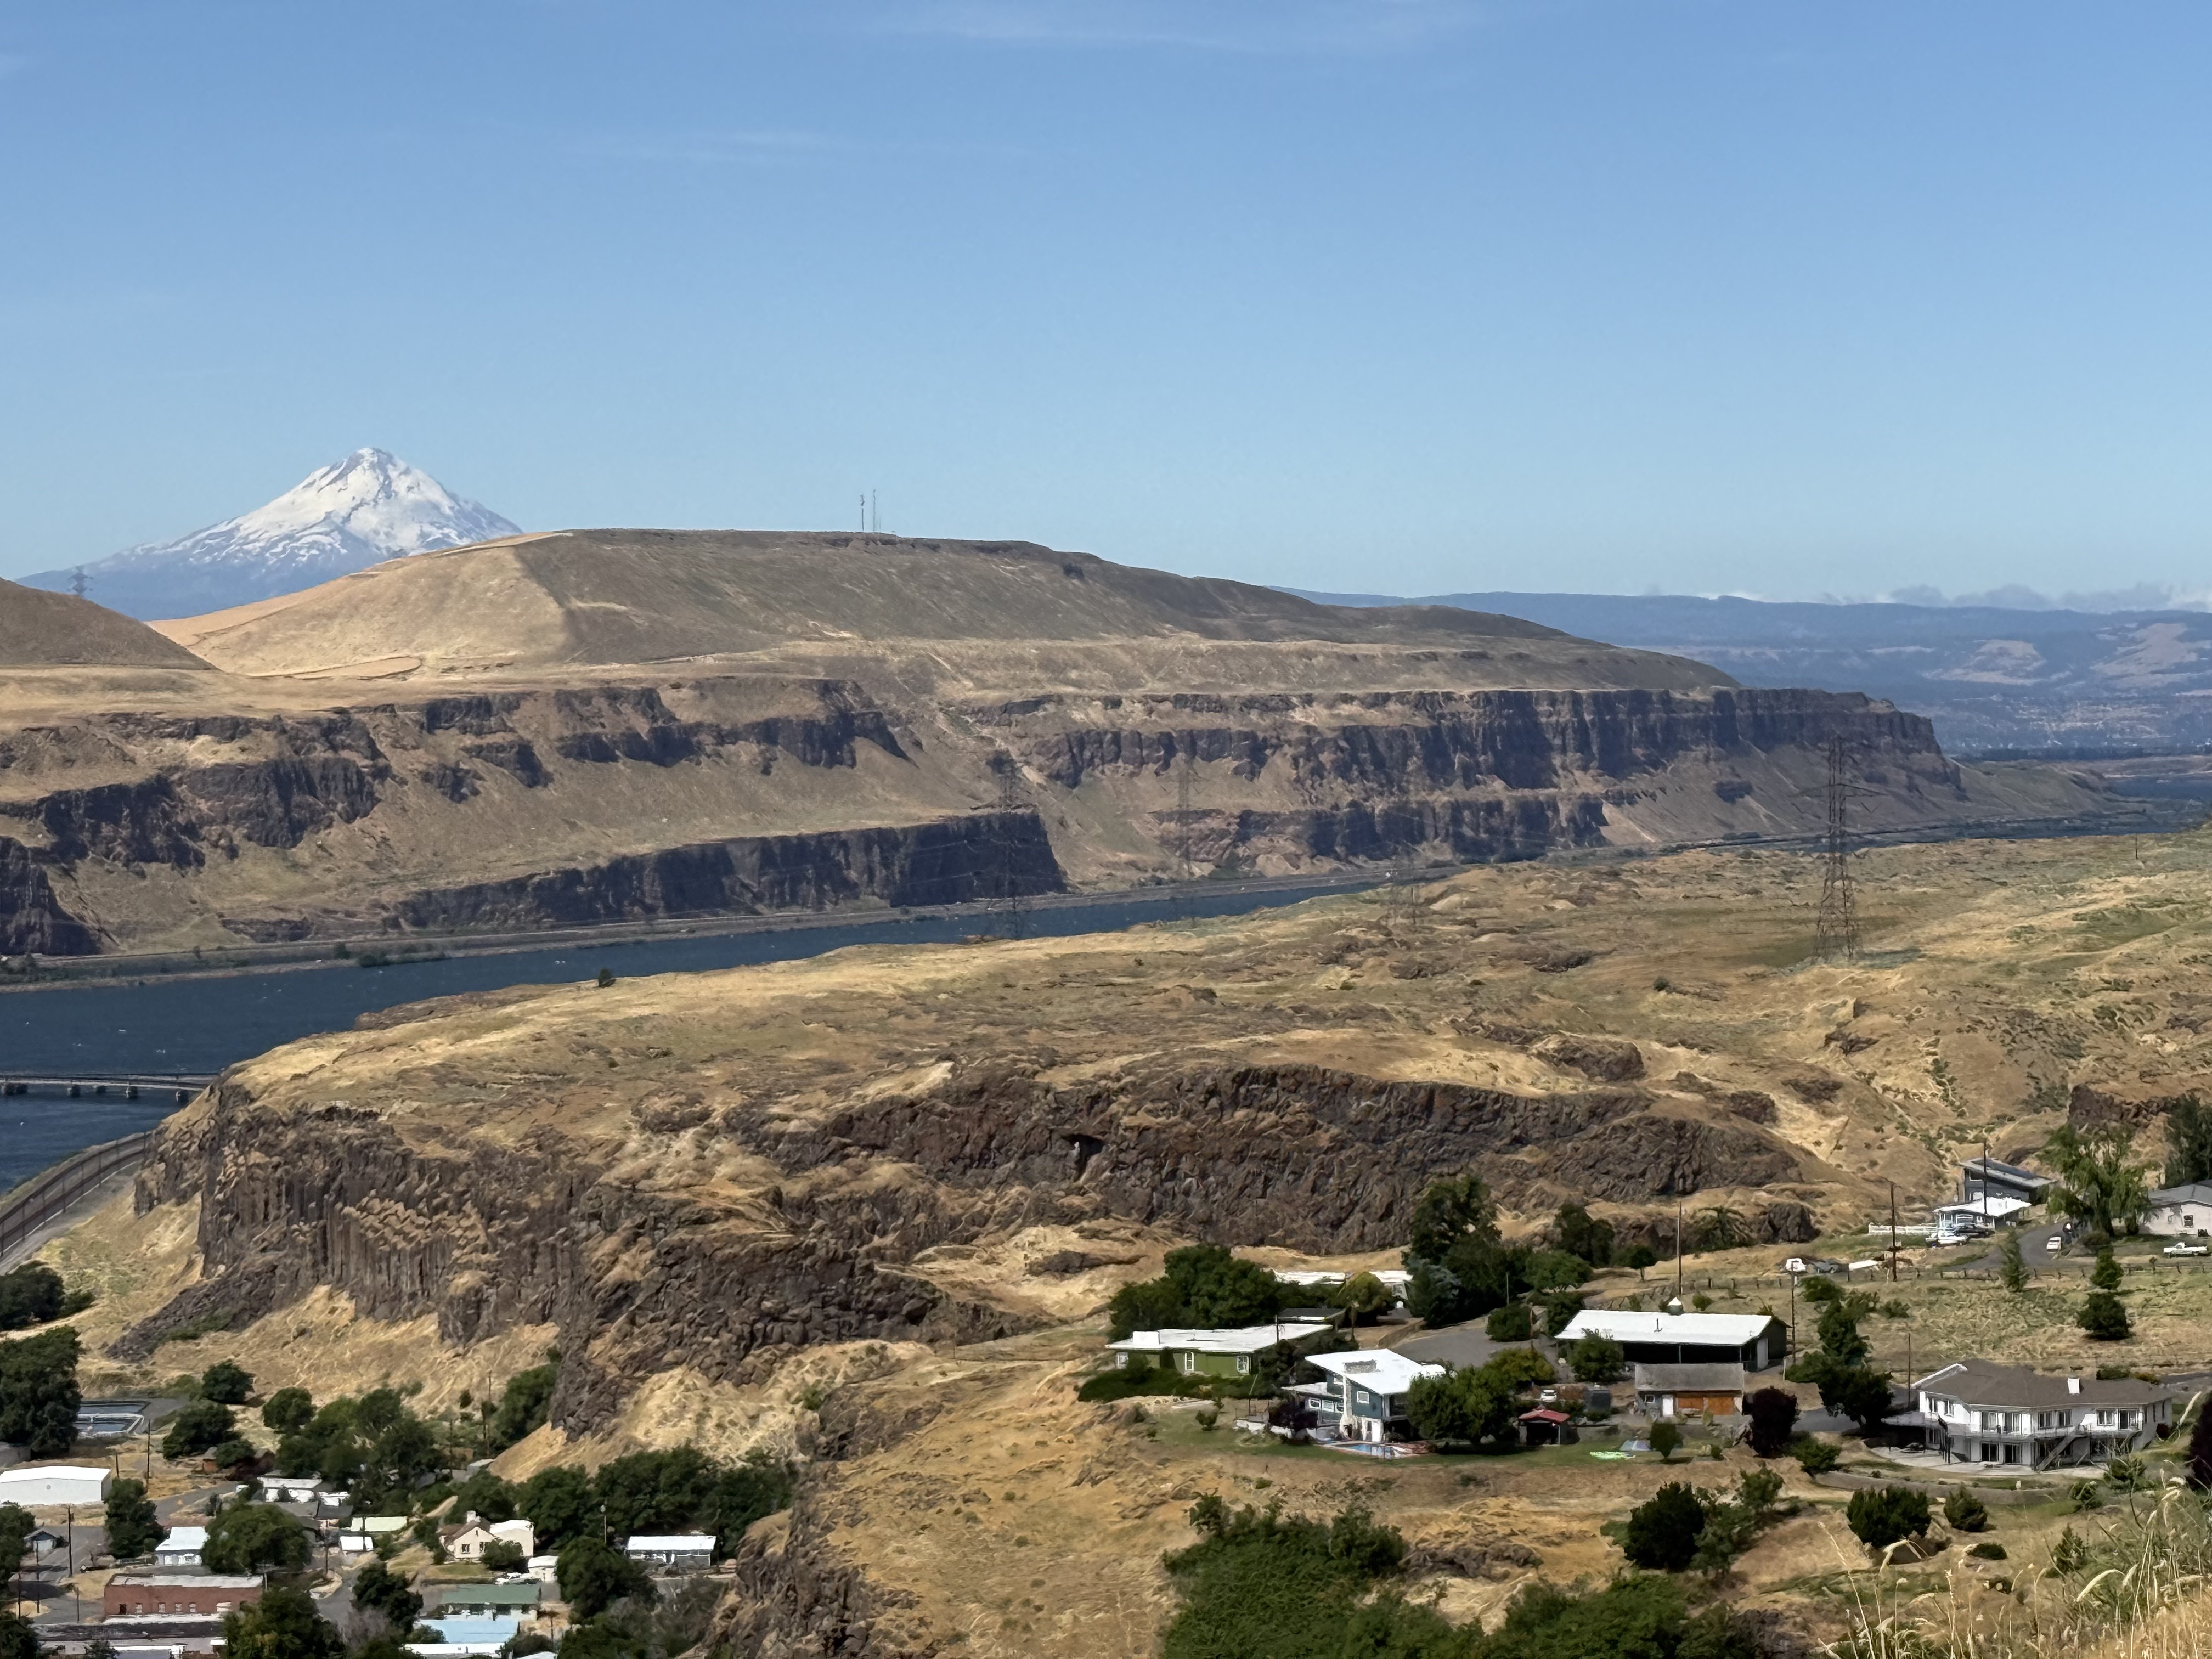
Columbia Hills is the eastern end of the gorge, where the Columbia River ends its meandering path to the Pacific. The rocks are basalts erupted from many fissures between 17 and 5 Ma. According to the latest interpretation, these rocks were ejected from the same mantle plume that now underlies the Yellowstone caldera in NW Wyoming. They have nothing to do with subduction or the Cascades volcanic belt, even though the much younger Mt. Hood (in the background) towers over them.
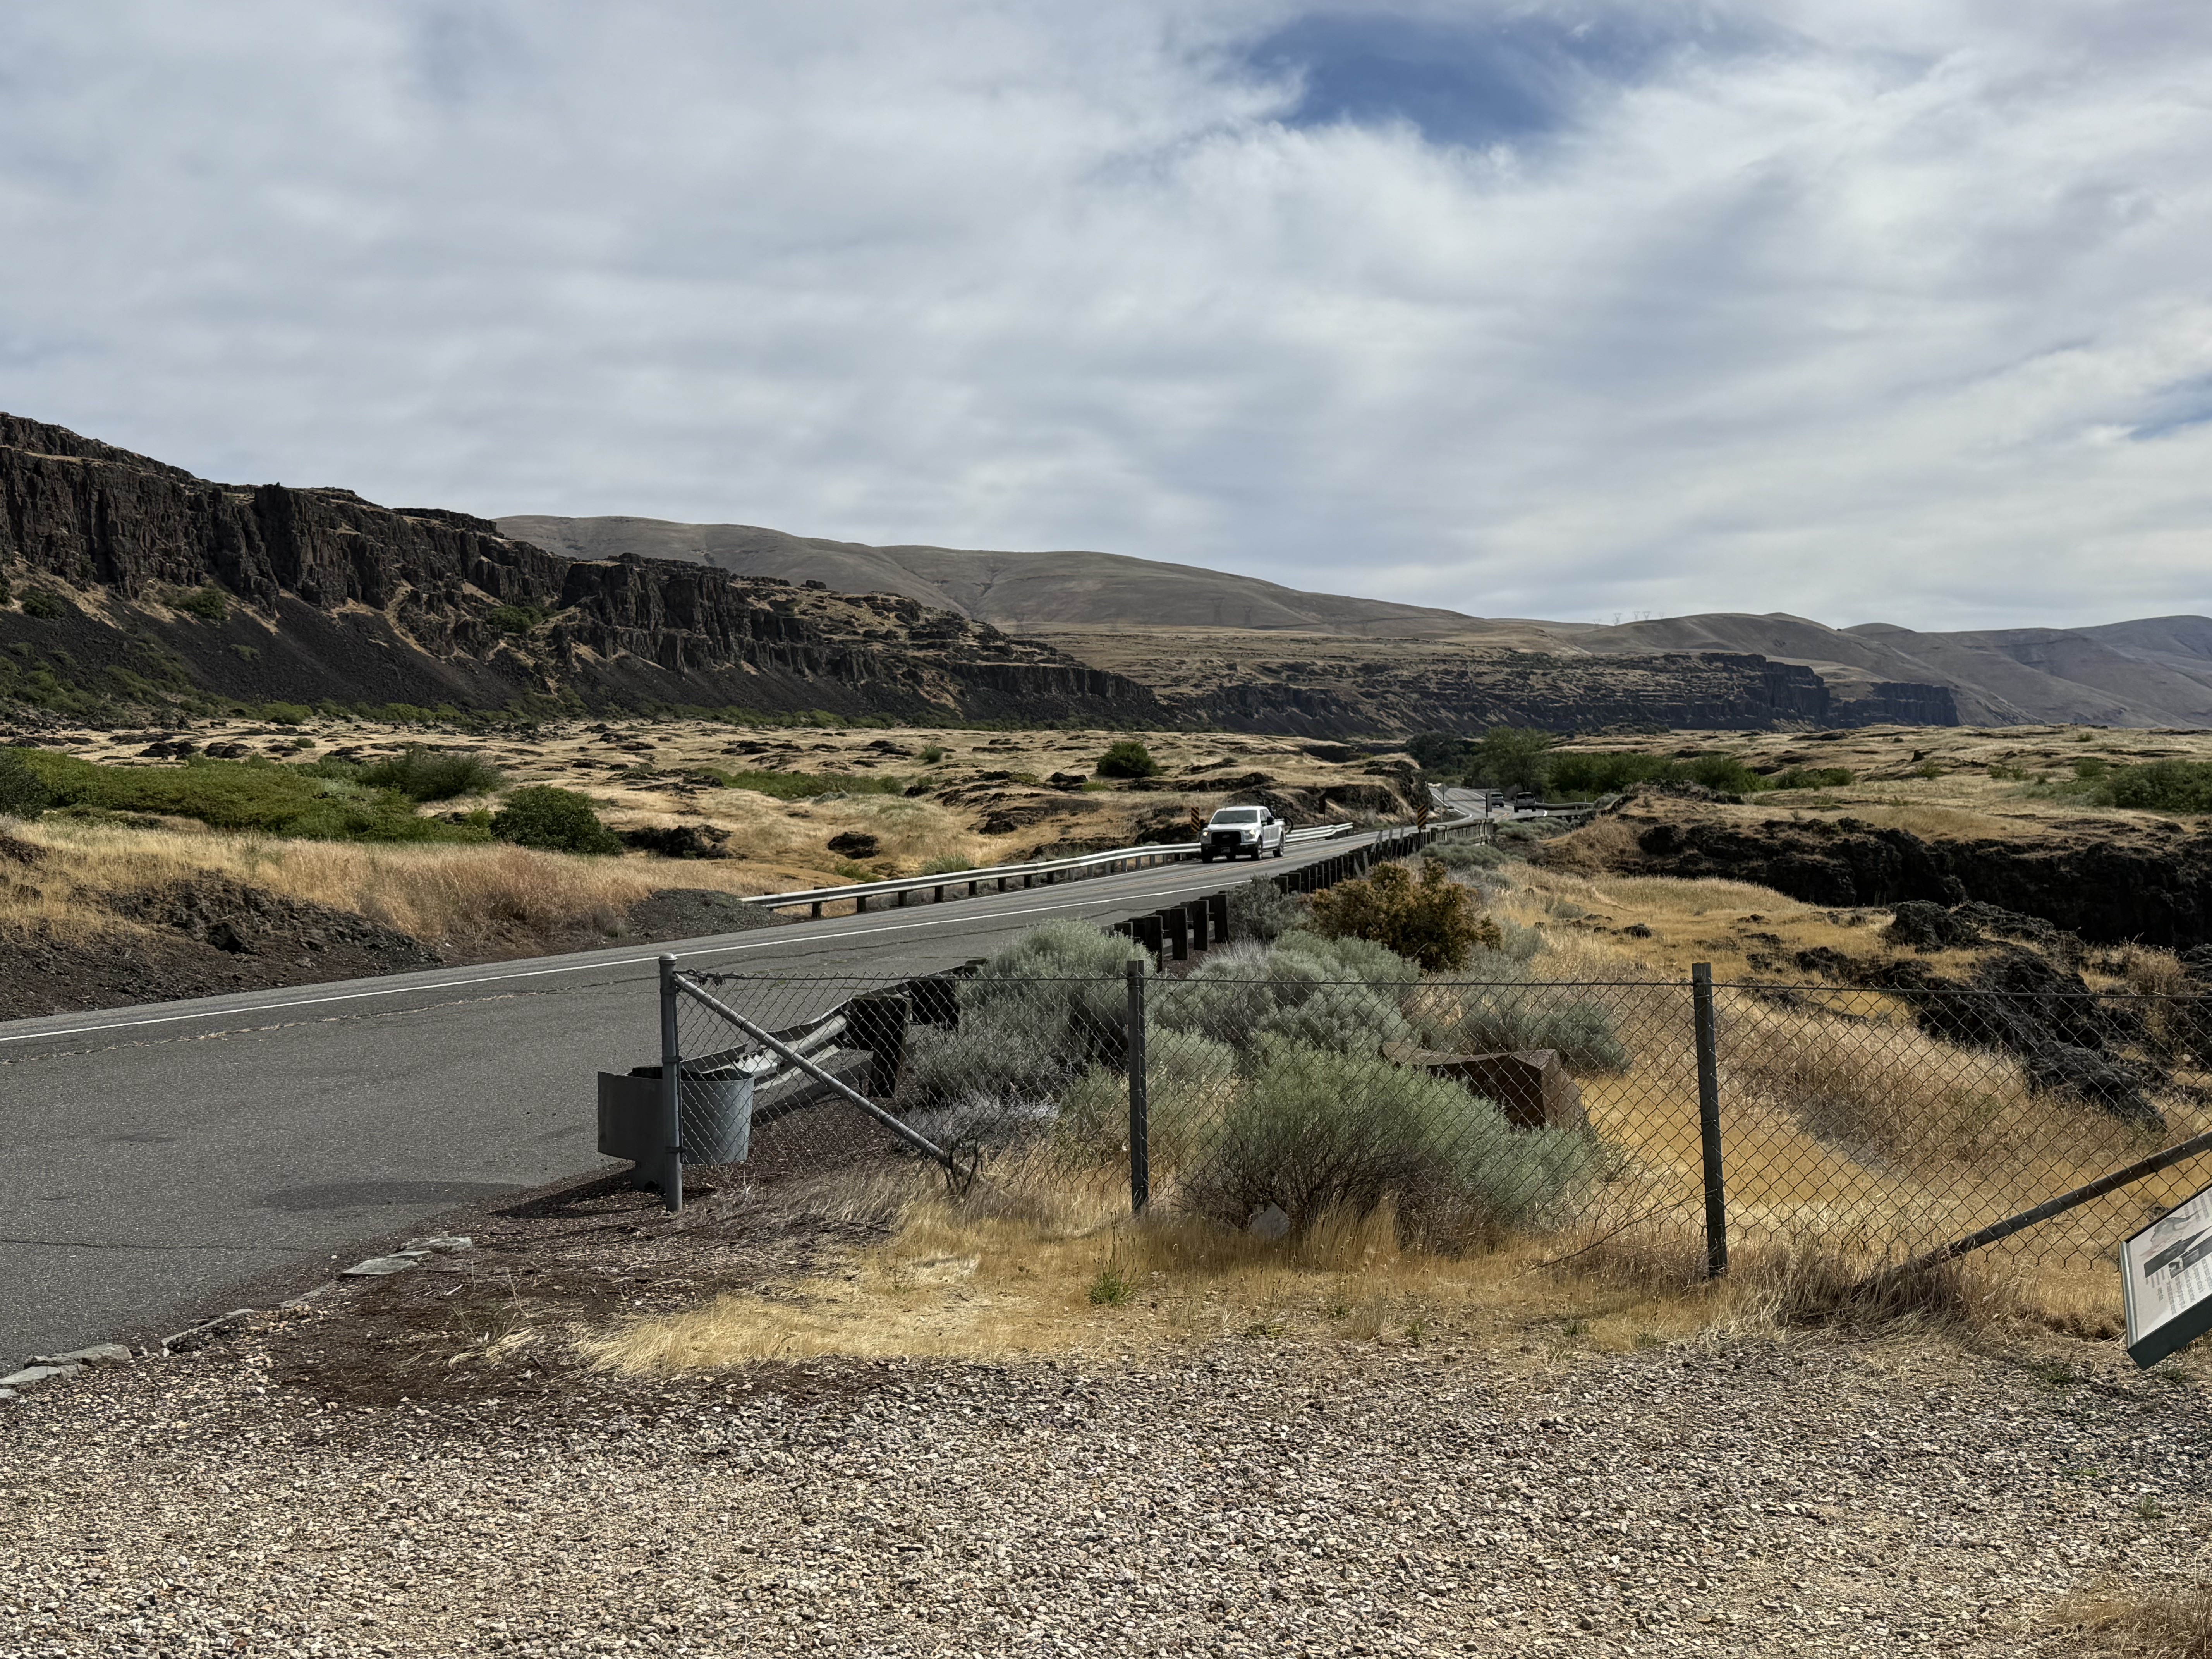
We are now in Eastern Washington, a climatic zone with completely different characteristics than west of the Cascades. This volcanic range creates a rain shadow and resulting precipitation is less than 20 inches here; and it shows in the scrubland ecosystem. These extensive basalt flows are no longer covered by younger andesites from the high Cascades (the young volcanoes like Mt. Hood).
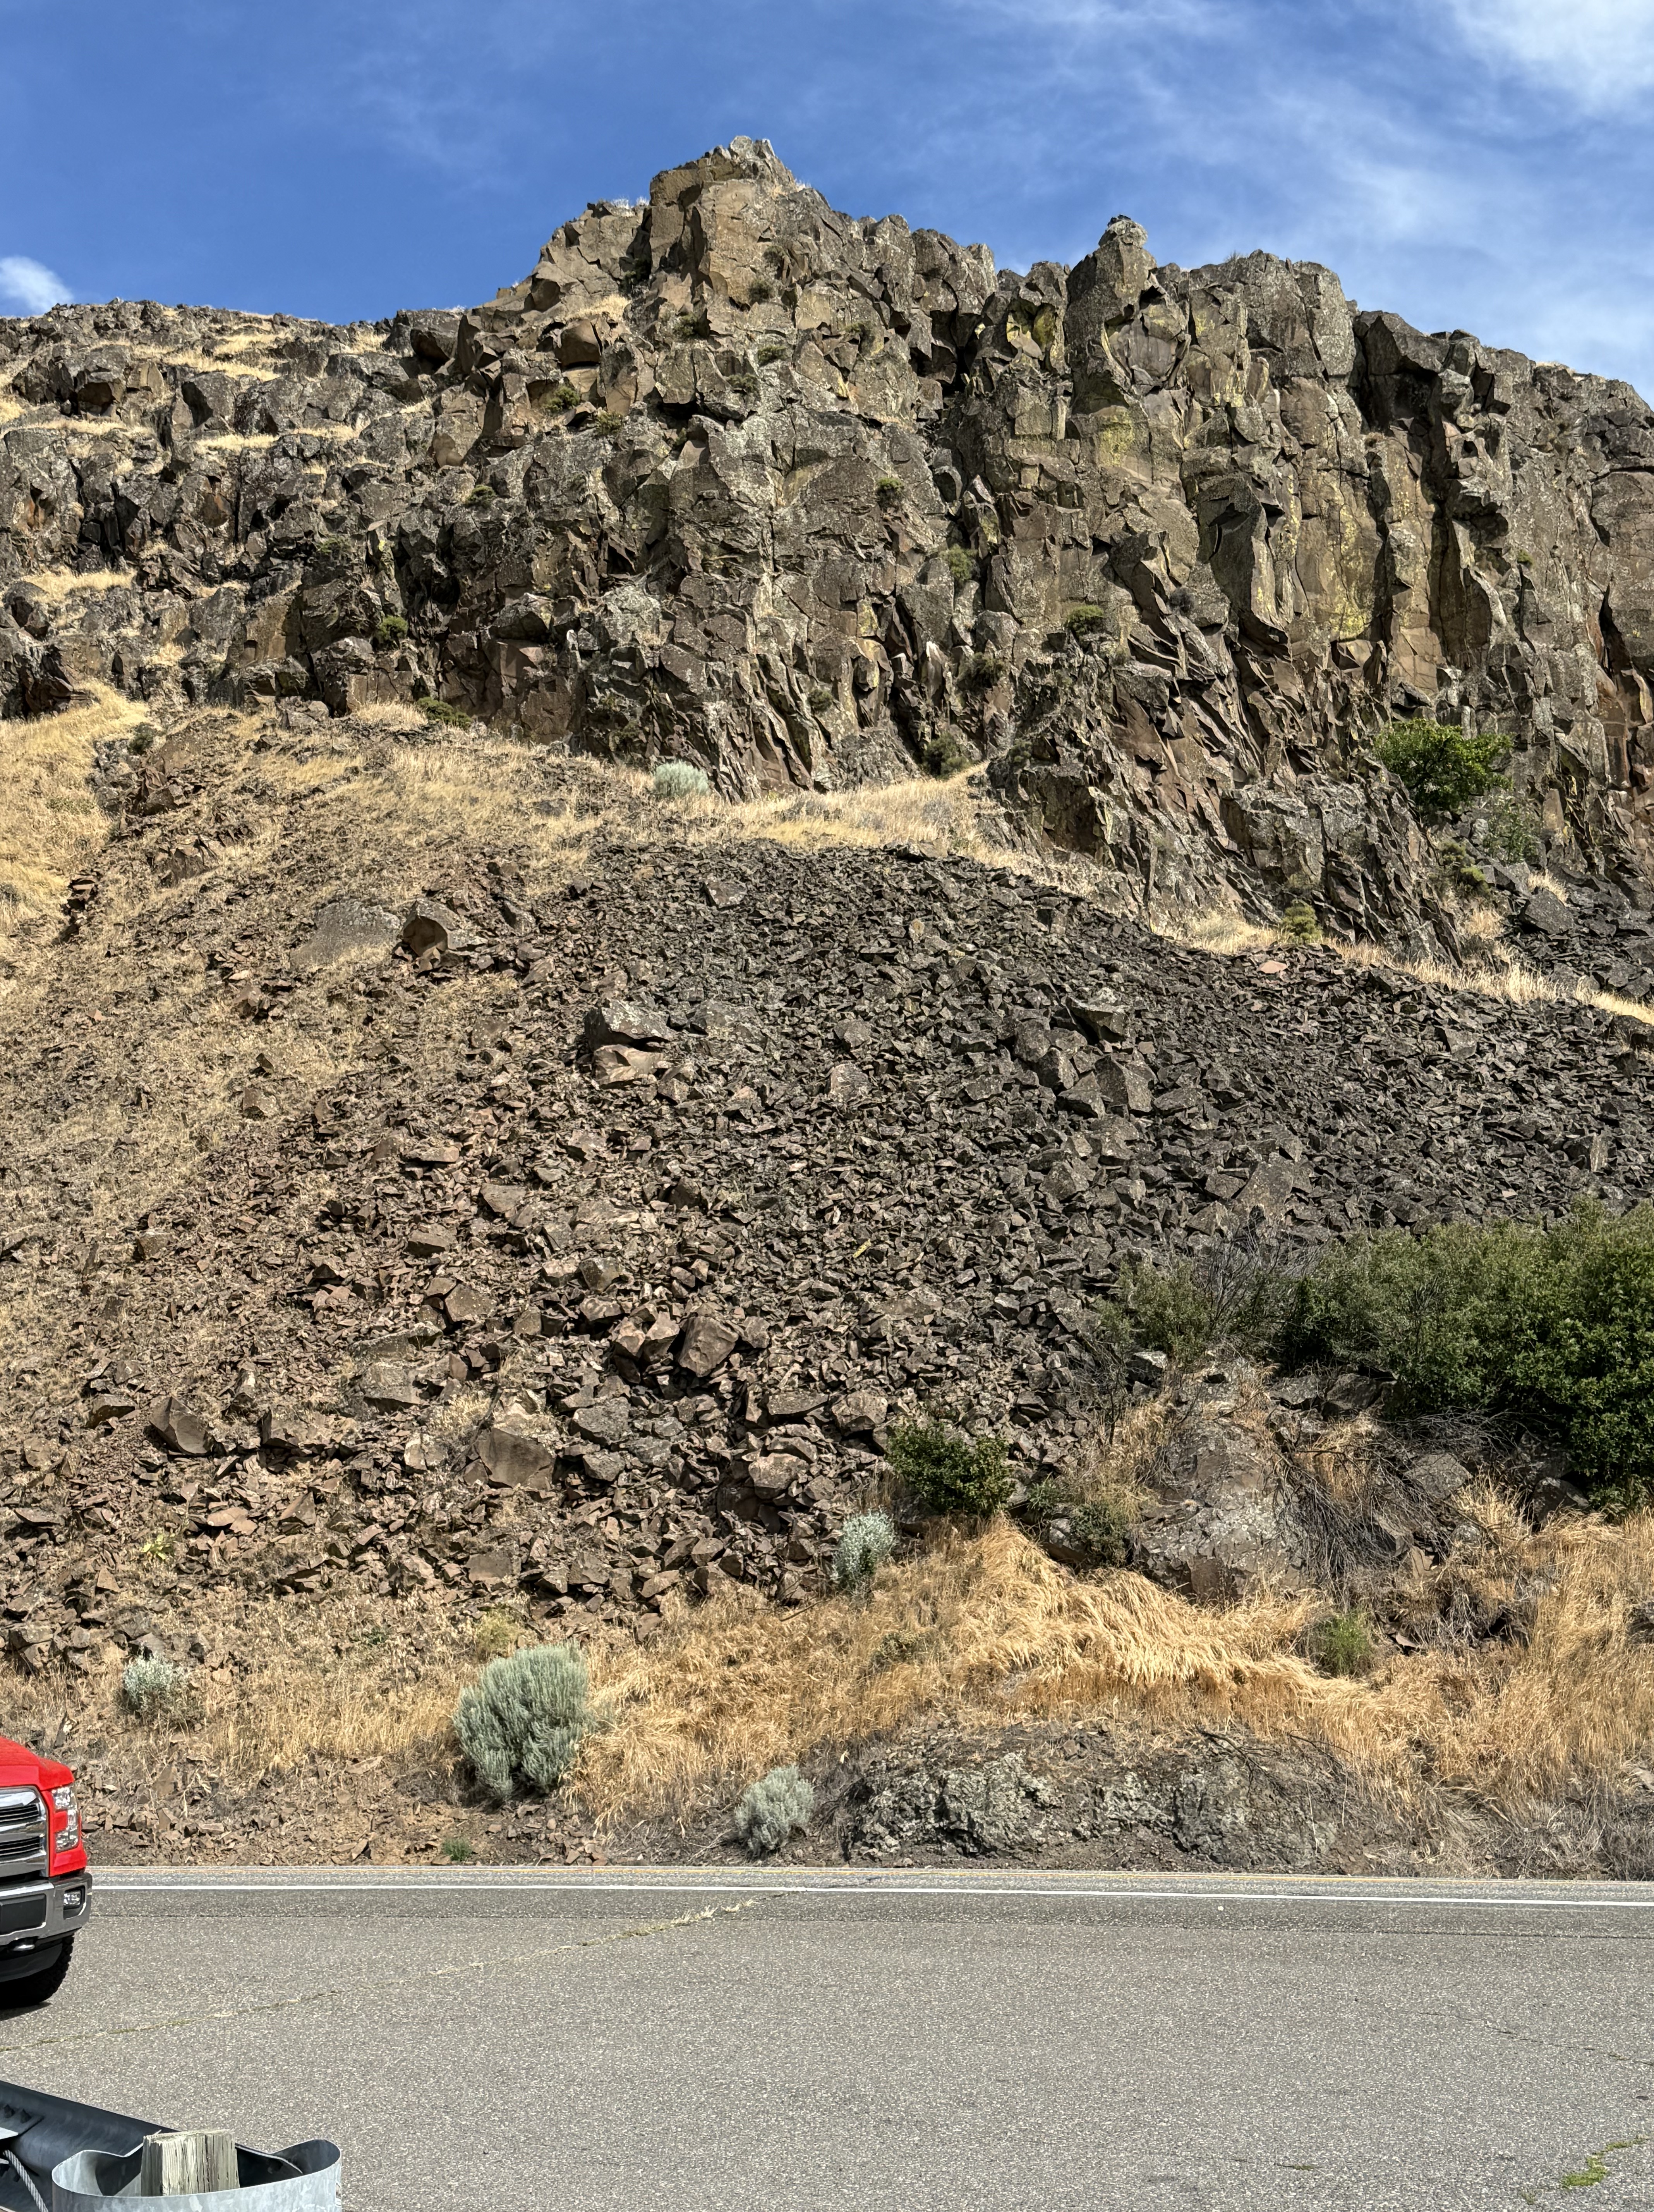
The volcanic layers are thin and extensive (see the map at the beginning of this post). They include columnar joints as I described in a previous post. The textures seen in this photo reveal the variability of lava coming from a single source; for example, individual, blocky layers cap this exposure whereas the rock presents a ropy texture lower down (middle-right of the photo).
Summary
The Pacific Northwest (PNW) didn’t exist before the Tertiary period, which began at 65.5 Ma. However, Pangea began to split apart at about 200 Ma, which should have created plate collisions here because the N American plate would have necessarily overrun the plates comprising the ancient Pacific Ocean. The west coast of N America was located approximately at the WA-ID boundary. So why don’t we see Jurassic and Cretaceous volcanoes and their associated volcanic deposits in the PNW?
This question has perplexed geologists for decades. After carefully collecting data from far and wide, a still-controversial theory has evolved: For more than 100 million years, this tectonic collision was accommodated by transform faults (e.g. the San Andreas fault system in California). A tectonic plate collision is not a conveyer belt as shown in schematic representations.
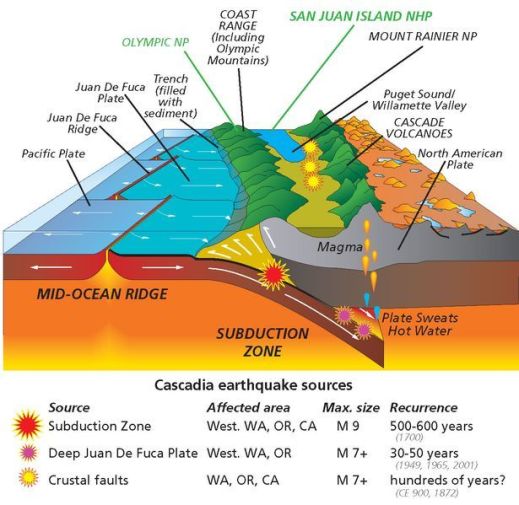
This schematic profile of the PNW shows several transform faults, which misalign the Pacific mid-ocean ridge (note the misalignment of the dark, Juan De Fuca Ridge. This tectonic scenario didn’t develop until those transform faults, which were not perpendicular to the mid-ocean ridge, could no longer accommodate the displacement of these microplates with N America. That apparently happened about sixty-million years ago. Some of these slivers of volcanic terrain have probably become exotic terranes that are now part of Alaska.
That is probably why we didn’t encounter any Mesozoic ((251-65.5 Ma) volcanic rocks within the Columbia River Gorge. Instead, we discovered a Tertiary volcanic landscape dominated by andesite/basalt lava flows, preserved because the transform faults had stopped absorbing the collisional, crustal tectonics. A real subduction zone emerged from this chaos and created the Cacades.
Superimposed on this was the unexpected (tectonically speaking) effusion of basalts as the westward-propagating N American plate rode over a mantle plume, which buried the evidence for this slipping history beneath miles of volcanic rocks. I can’t say anything else about this because I’m not actively researching the PNW’s geologic history.
My last word is that I can’t wait to see what new discoveries the PNW holds for me.
Volcanic Rocks at Cowiche Canyon
Introduction
Burlington-Northern Railroad built a line through Cowiche Canyon in 1913 to transport apples, but it was abandoned in 1984 and the land was acquired by the Cowiche Canyon Conservancy for a non-motorized vehicle trail system. The main trail extends 2.9 miles along the South Fork Cowiche Creek, crossing the 11 bridges constructed for the railroad line.
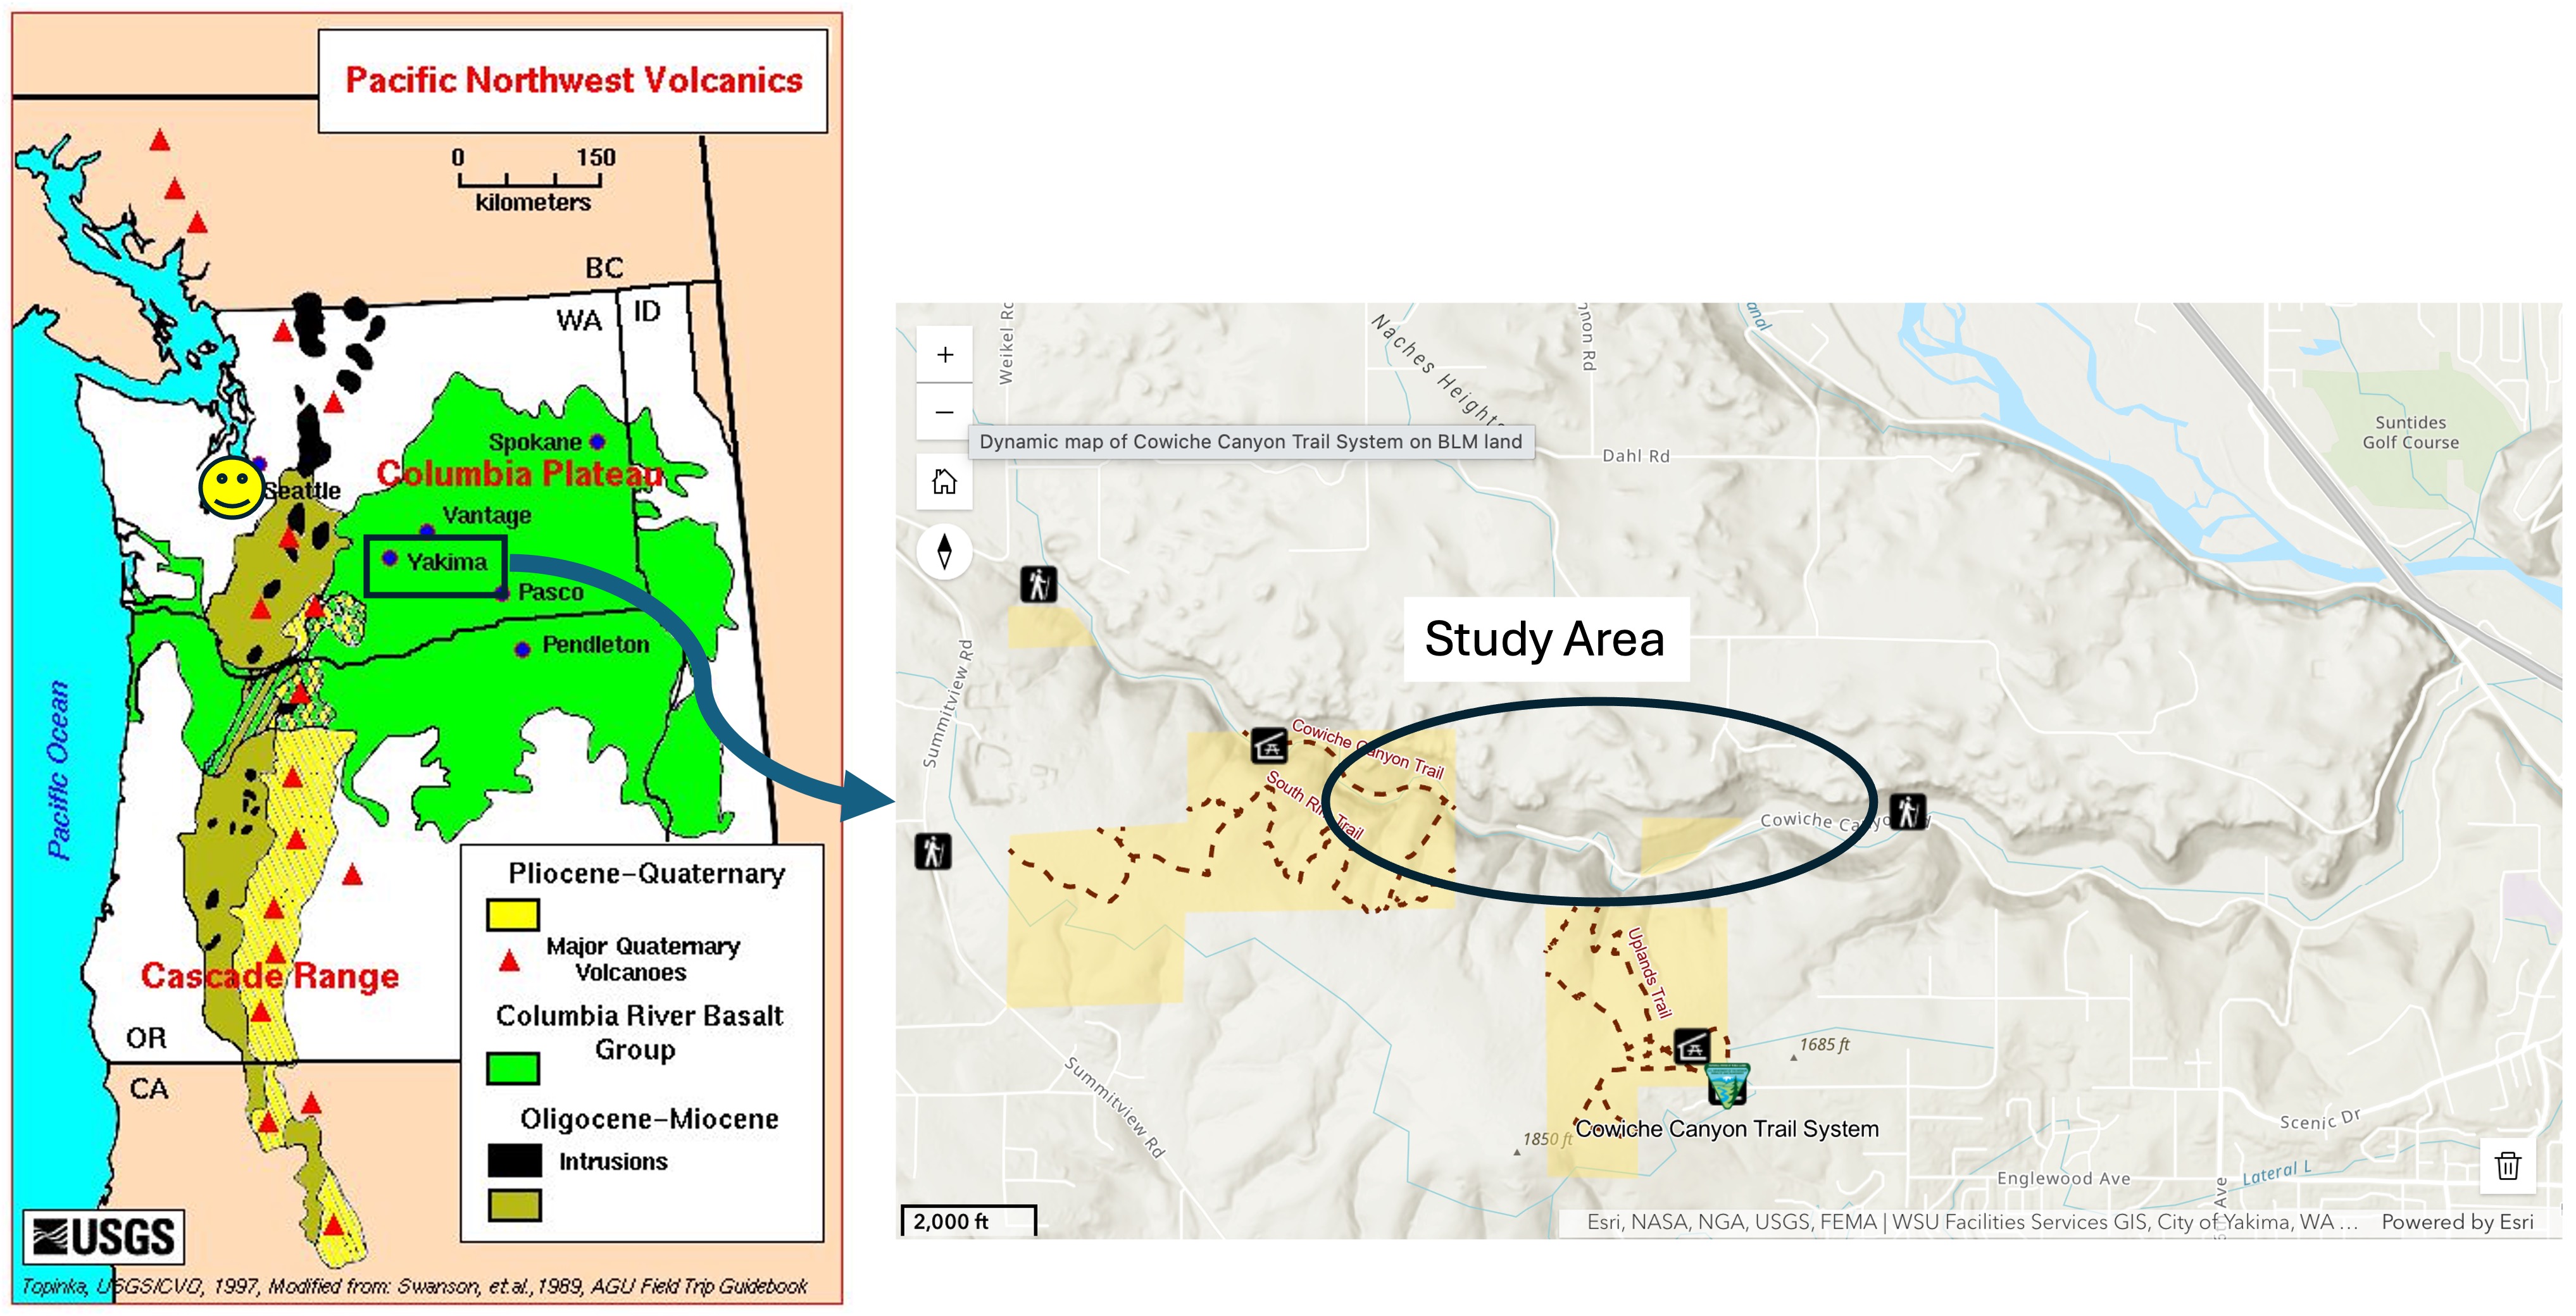
The left panel shows the distribution of Columbia River flood basalts, deposited between 16 and 6 Ma. Yakima and Cowiche Canyon are outlined by a rectangle. These volcanic rocks were erupted in overlapping flows with erosion and landslides occurring between individual layers, which are irregular and not shown in this map. The ages from the USGS national geologic map are Tertiary (66-2.6 Ma). Tacoma is marked by a smiley face.
The right panel shows the Cowiche Canyon trail system and the specific area discussed in this post. The stream itself hosts a riparian habitat whereas the uplands comprise a shrub-steppe environment.
Observations
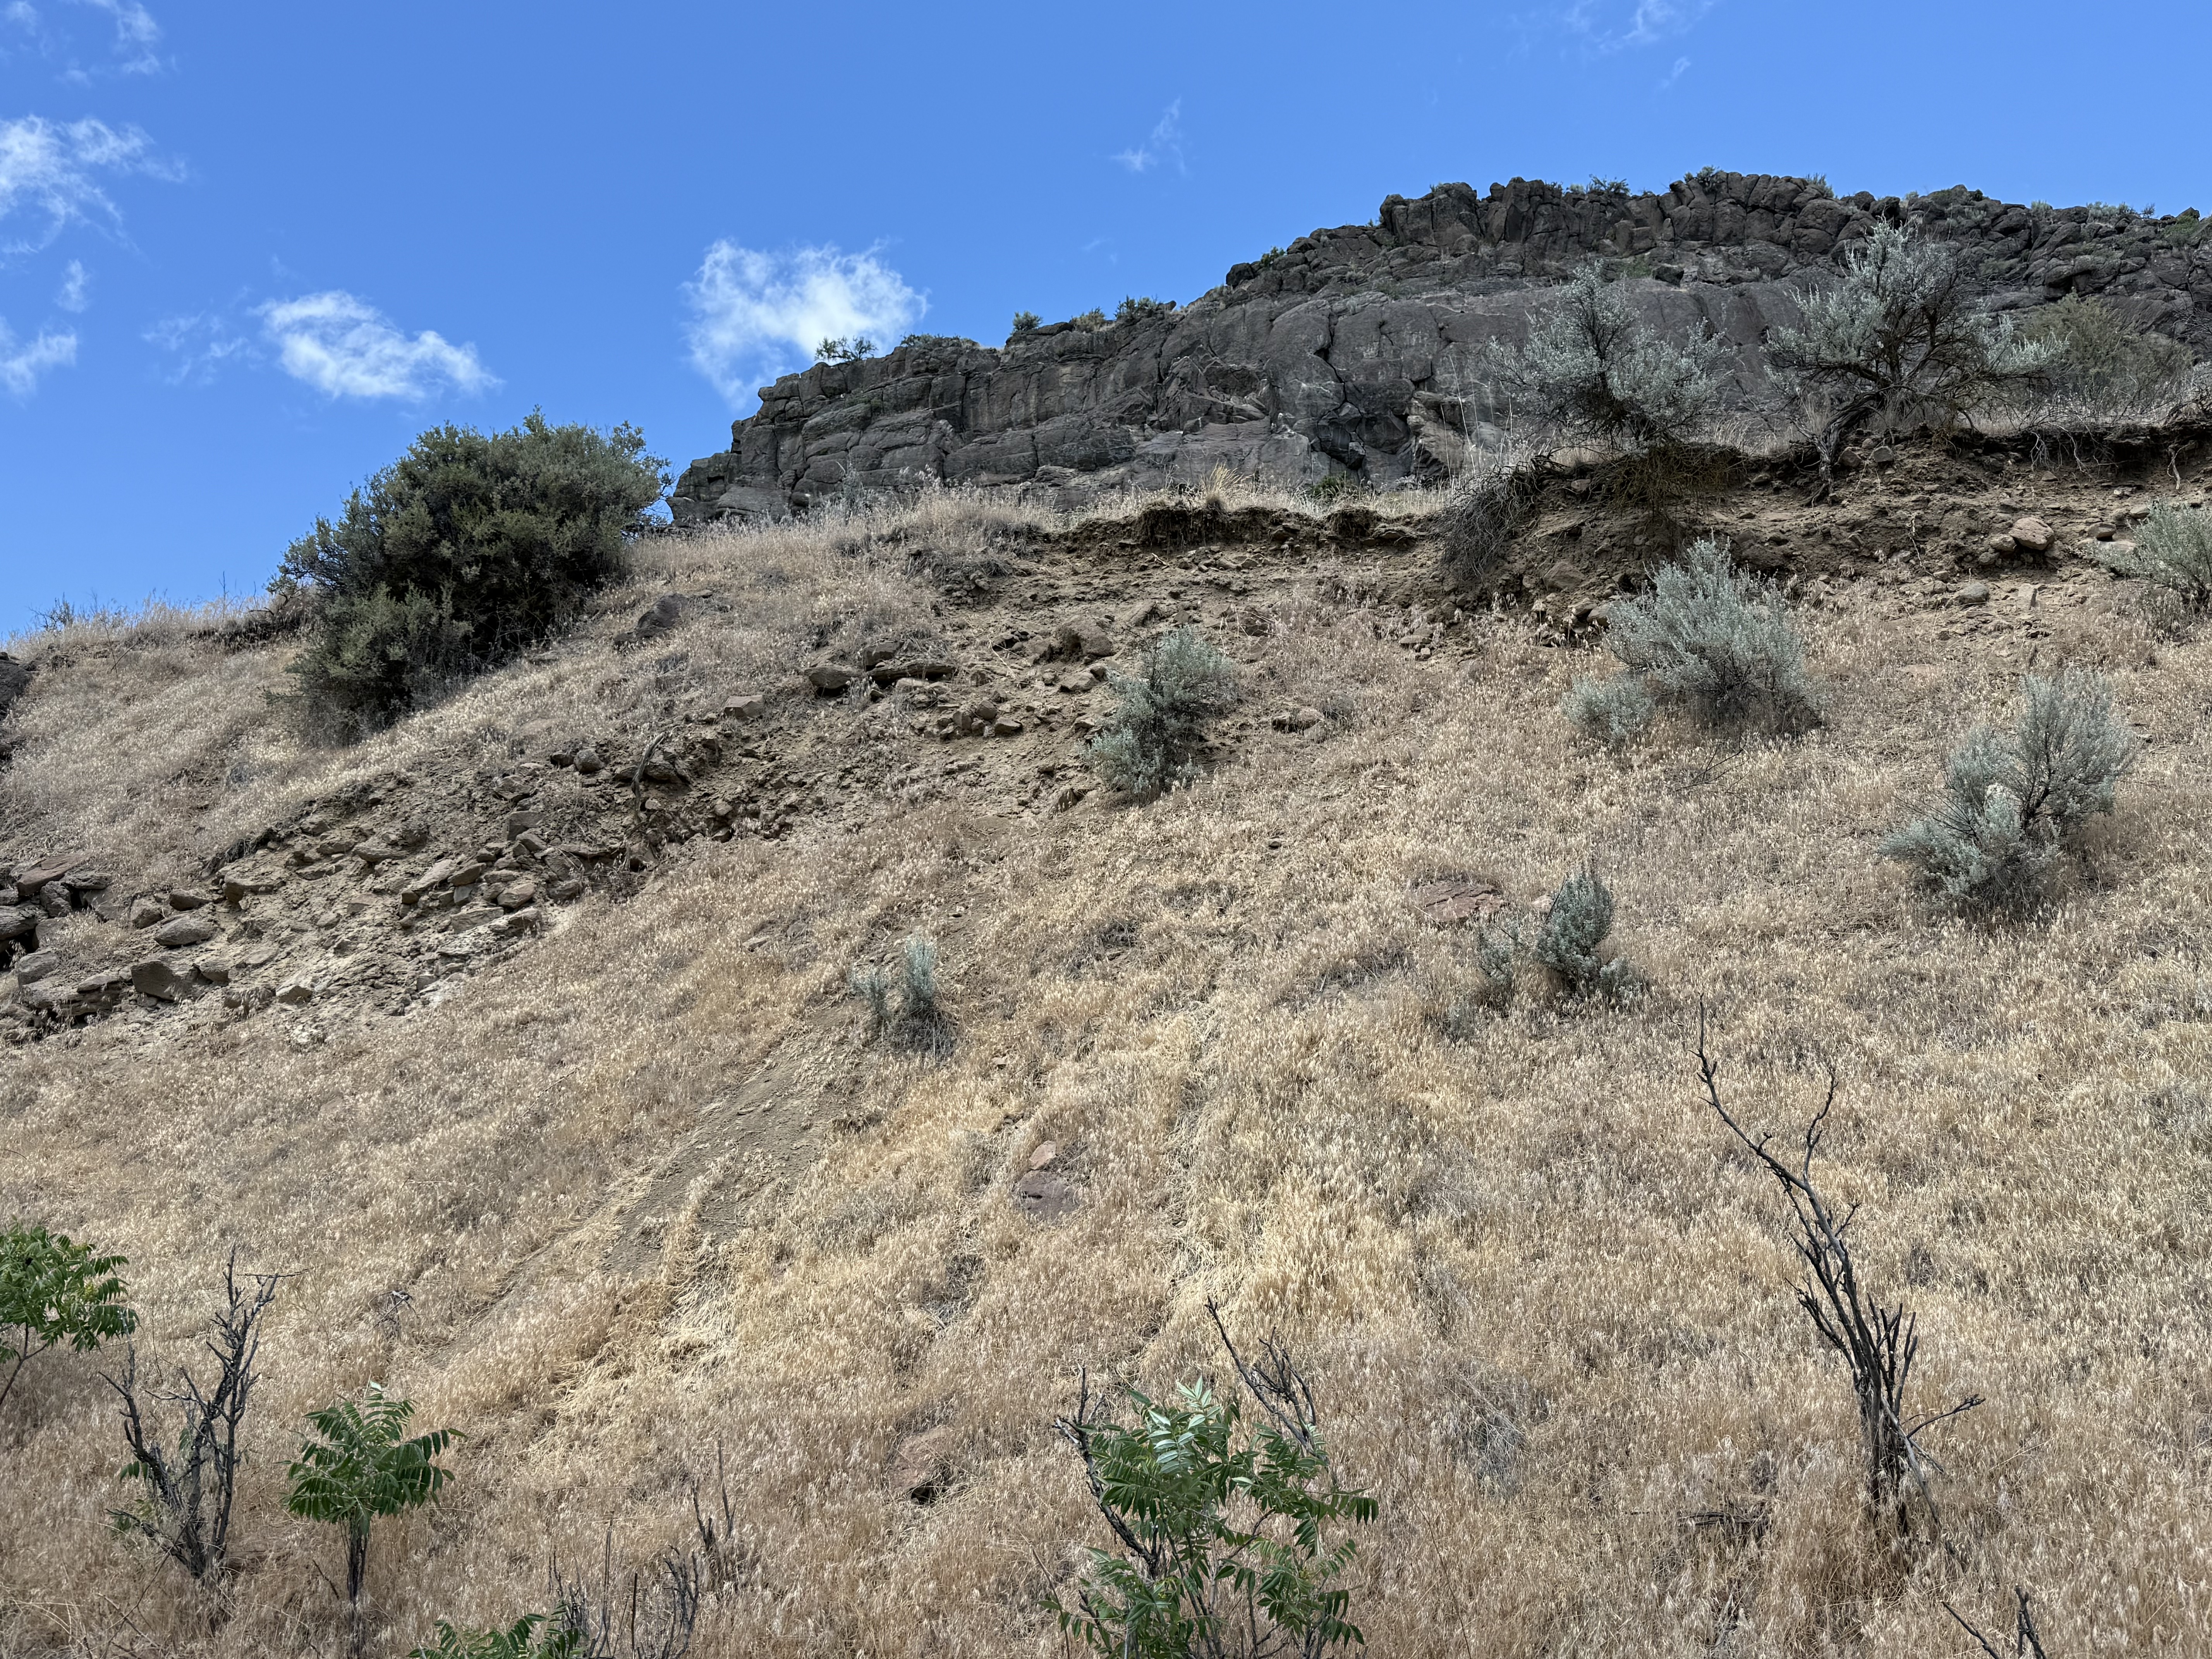
The canyon walls consist of a series of ledges like this with eroded slopes between them. The ledges are erosional margins of basalt flows and the slopes consist of talus and fine sediments weathered from the mafic rocks.
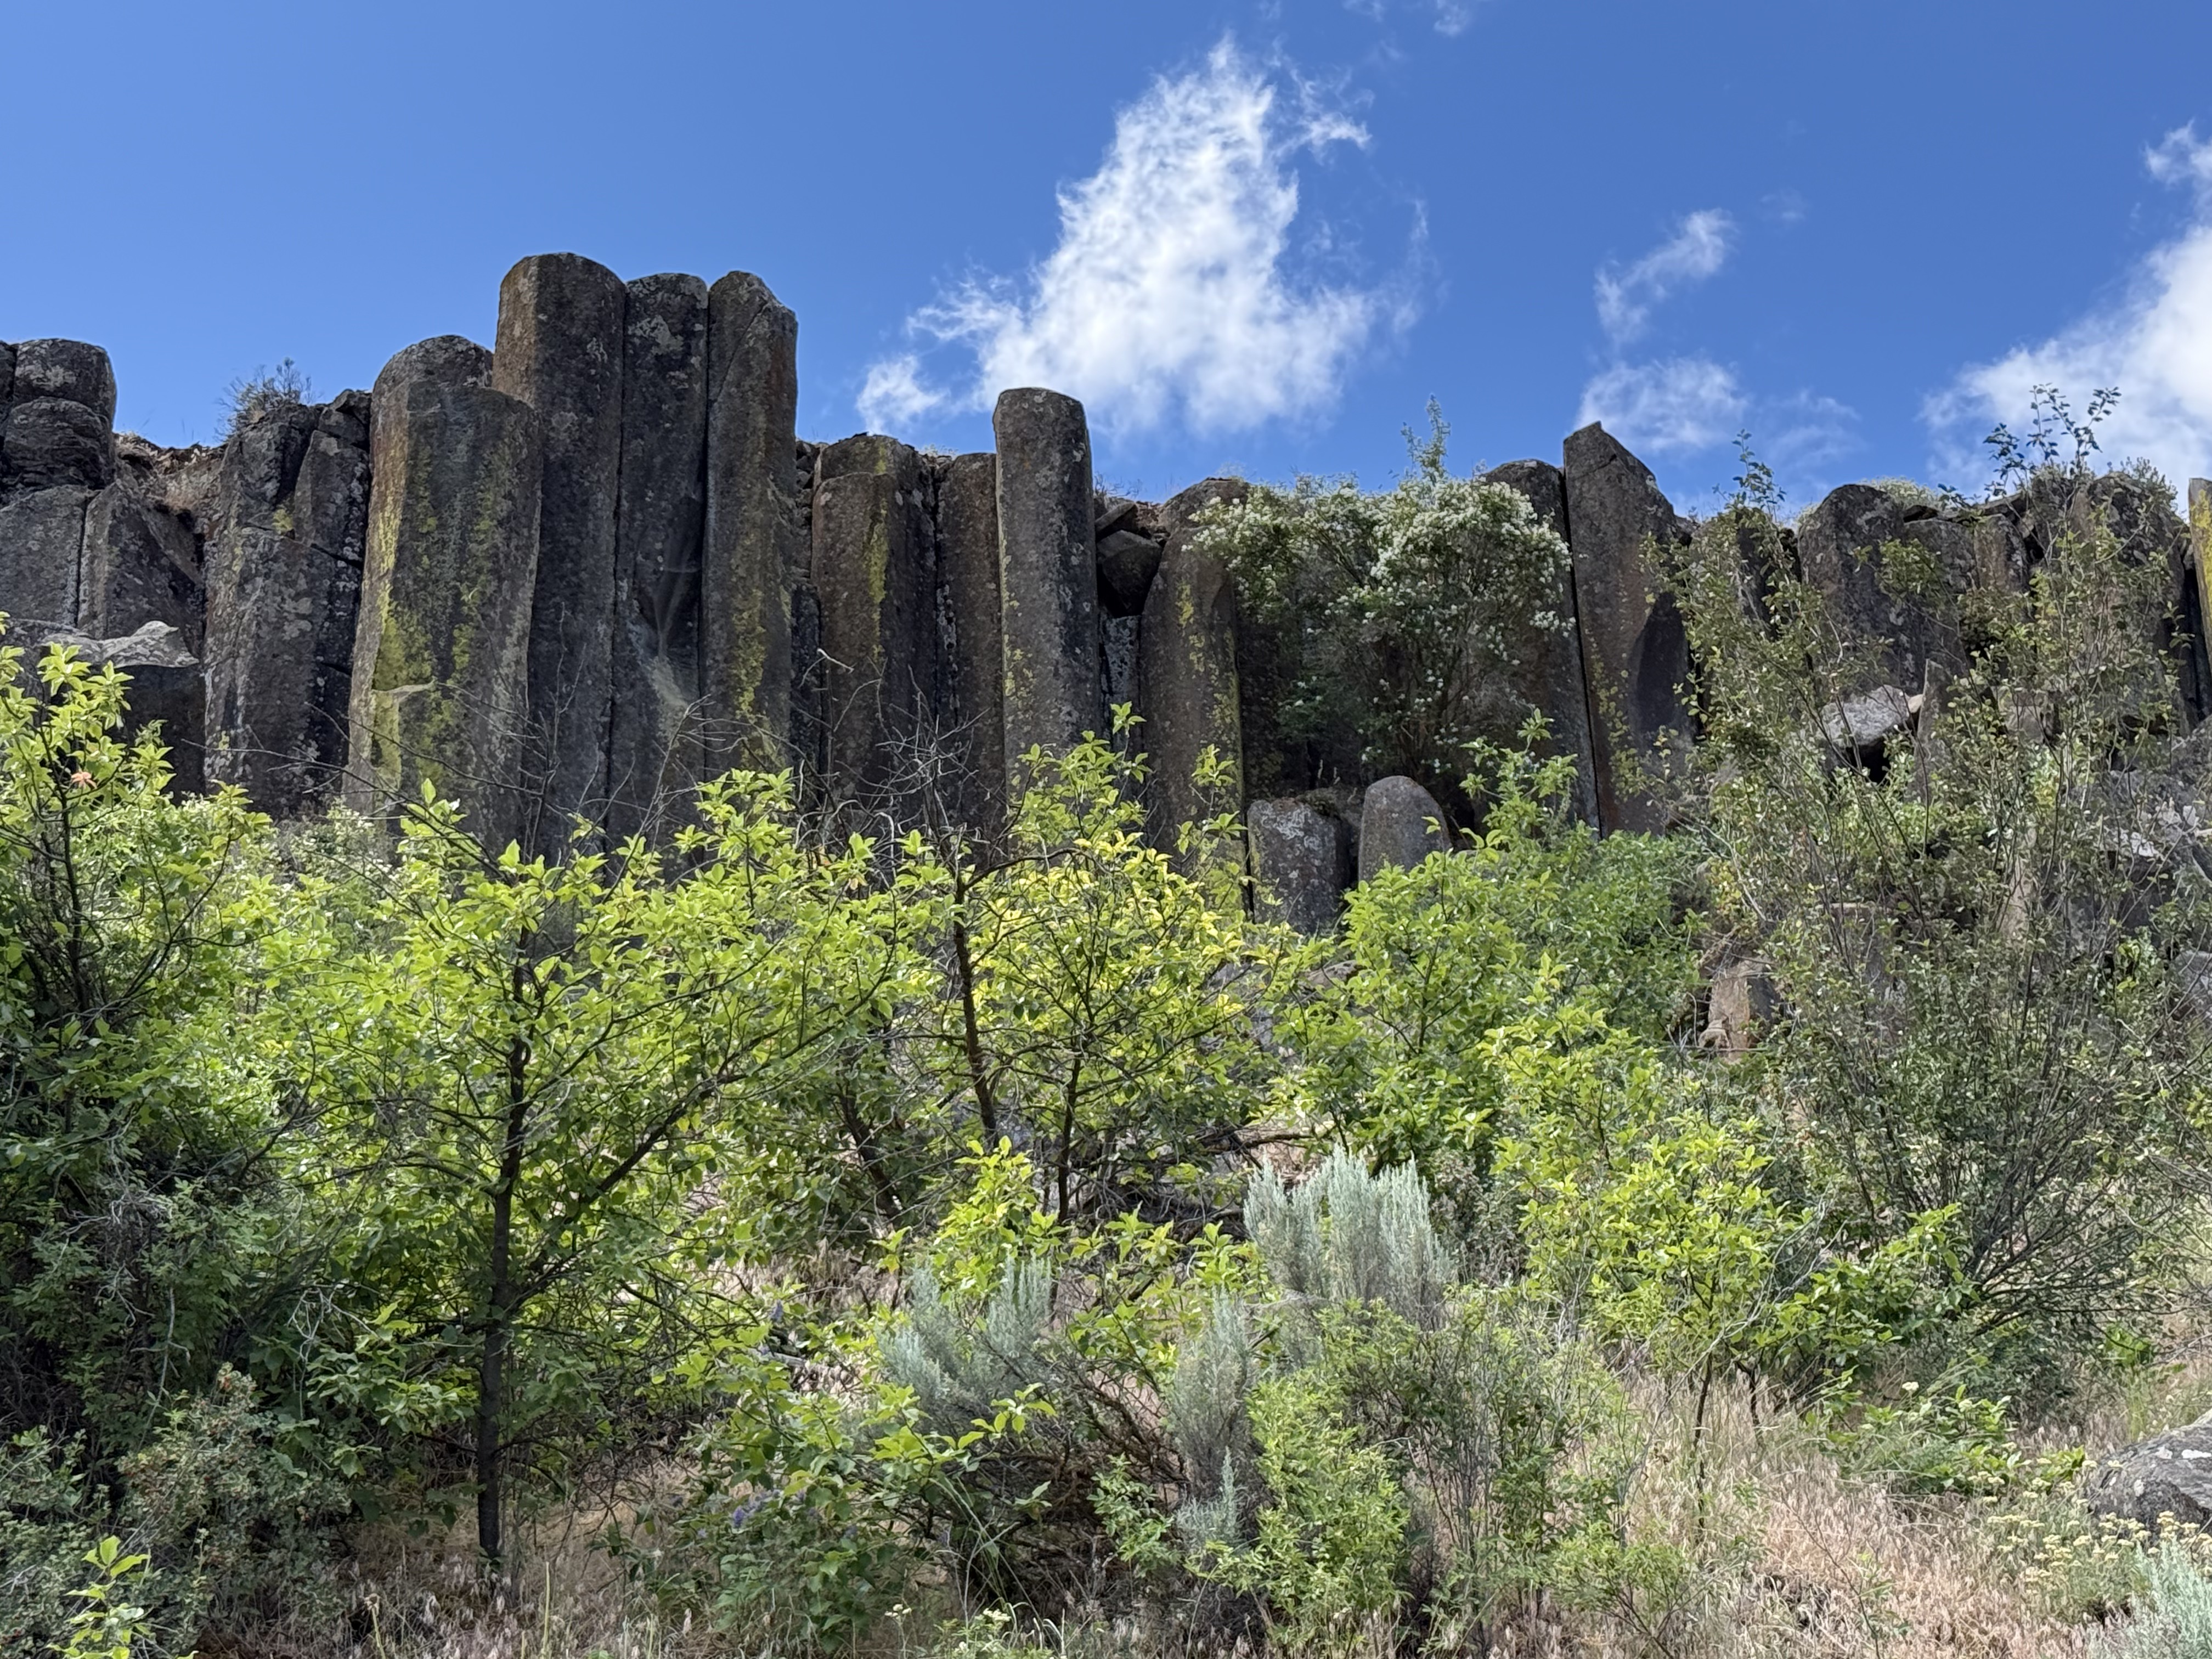
As we traveled west up the canyon, columnar-jointed basalt began to appear in the ledges overlooking the trail. Several pieces had rolled down the slope into the stream bed; these were about three-feet in diameter. Columnar jointing results from slow cooling of a uniform basalt flow, which causes joints to form hexagonal blocks like these because of thermo-mechanical failure during a decrease in volume.
These semi-circular blocks got my attention because, if you look closely, they appear to be eroded hexagons I estimate to be more than six feet in diameter. These are very large basalt columns that have either toppled or…
The top of this photo shows a birds-eye view of columnar basalt blocks because of their horizontal position. The size varies from smallest on the left to the largest blocks on the right. I reported on similar, horizontal columnar joints in a previous post and proposed that the lava flowed down a slope before solidifying.
The lower-right part reveals columnar basalt in a vertical position. This juxtaposition suggests (if my model is correct) that the lava from multiple flows covered an irregular landscape–sometimes flowing into canyons like Cowiche Canyon, and somtimes over fairly level ground.
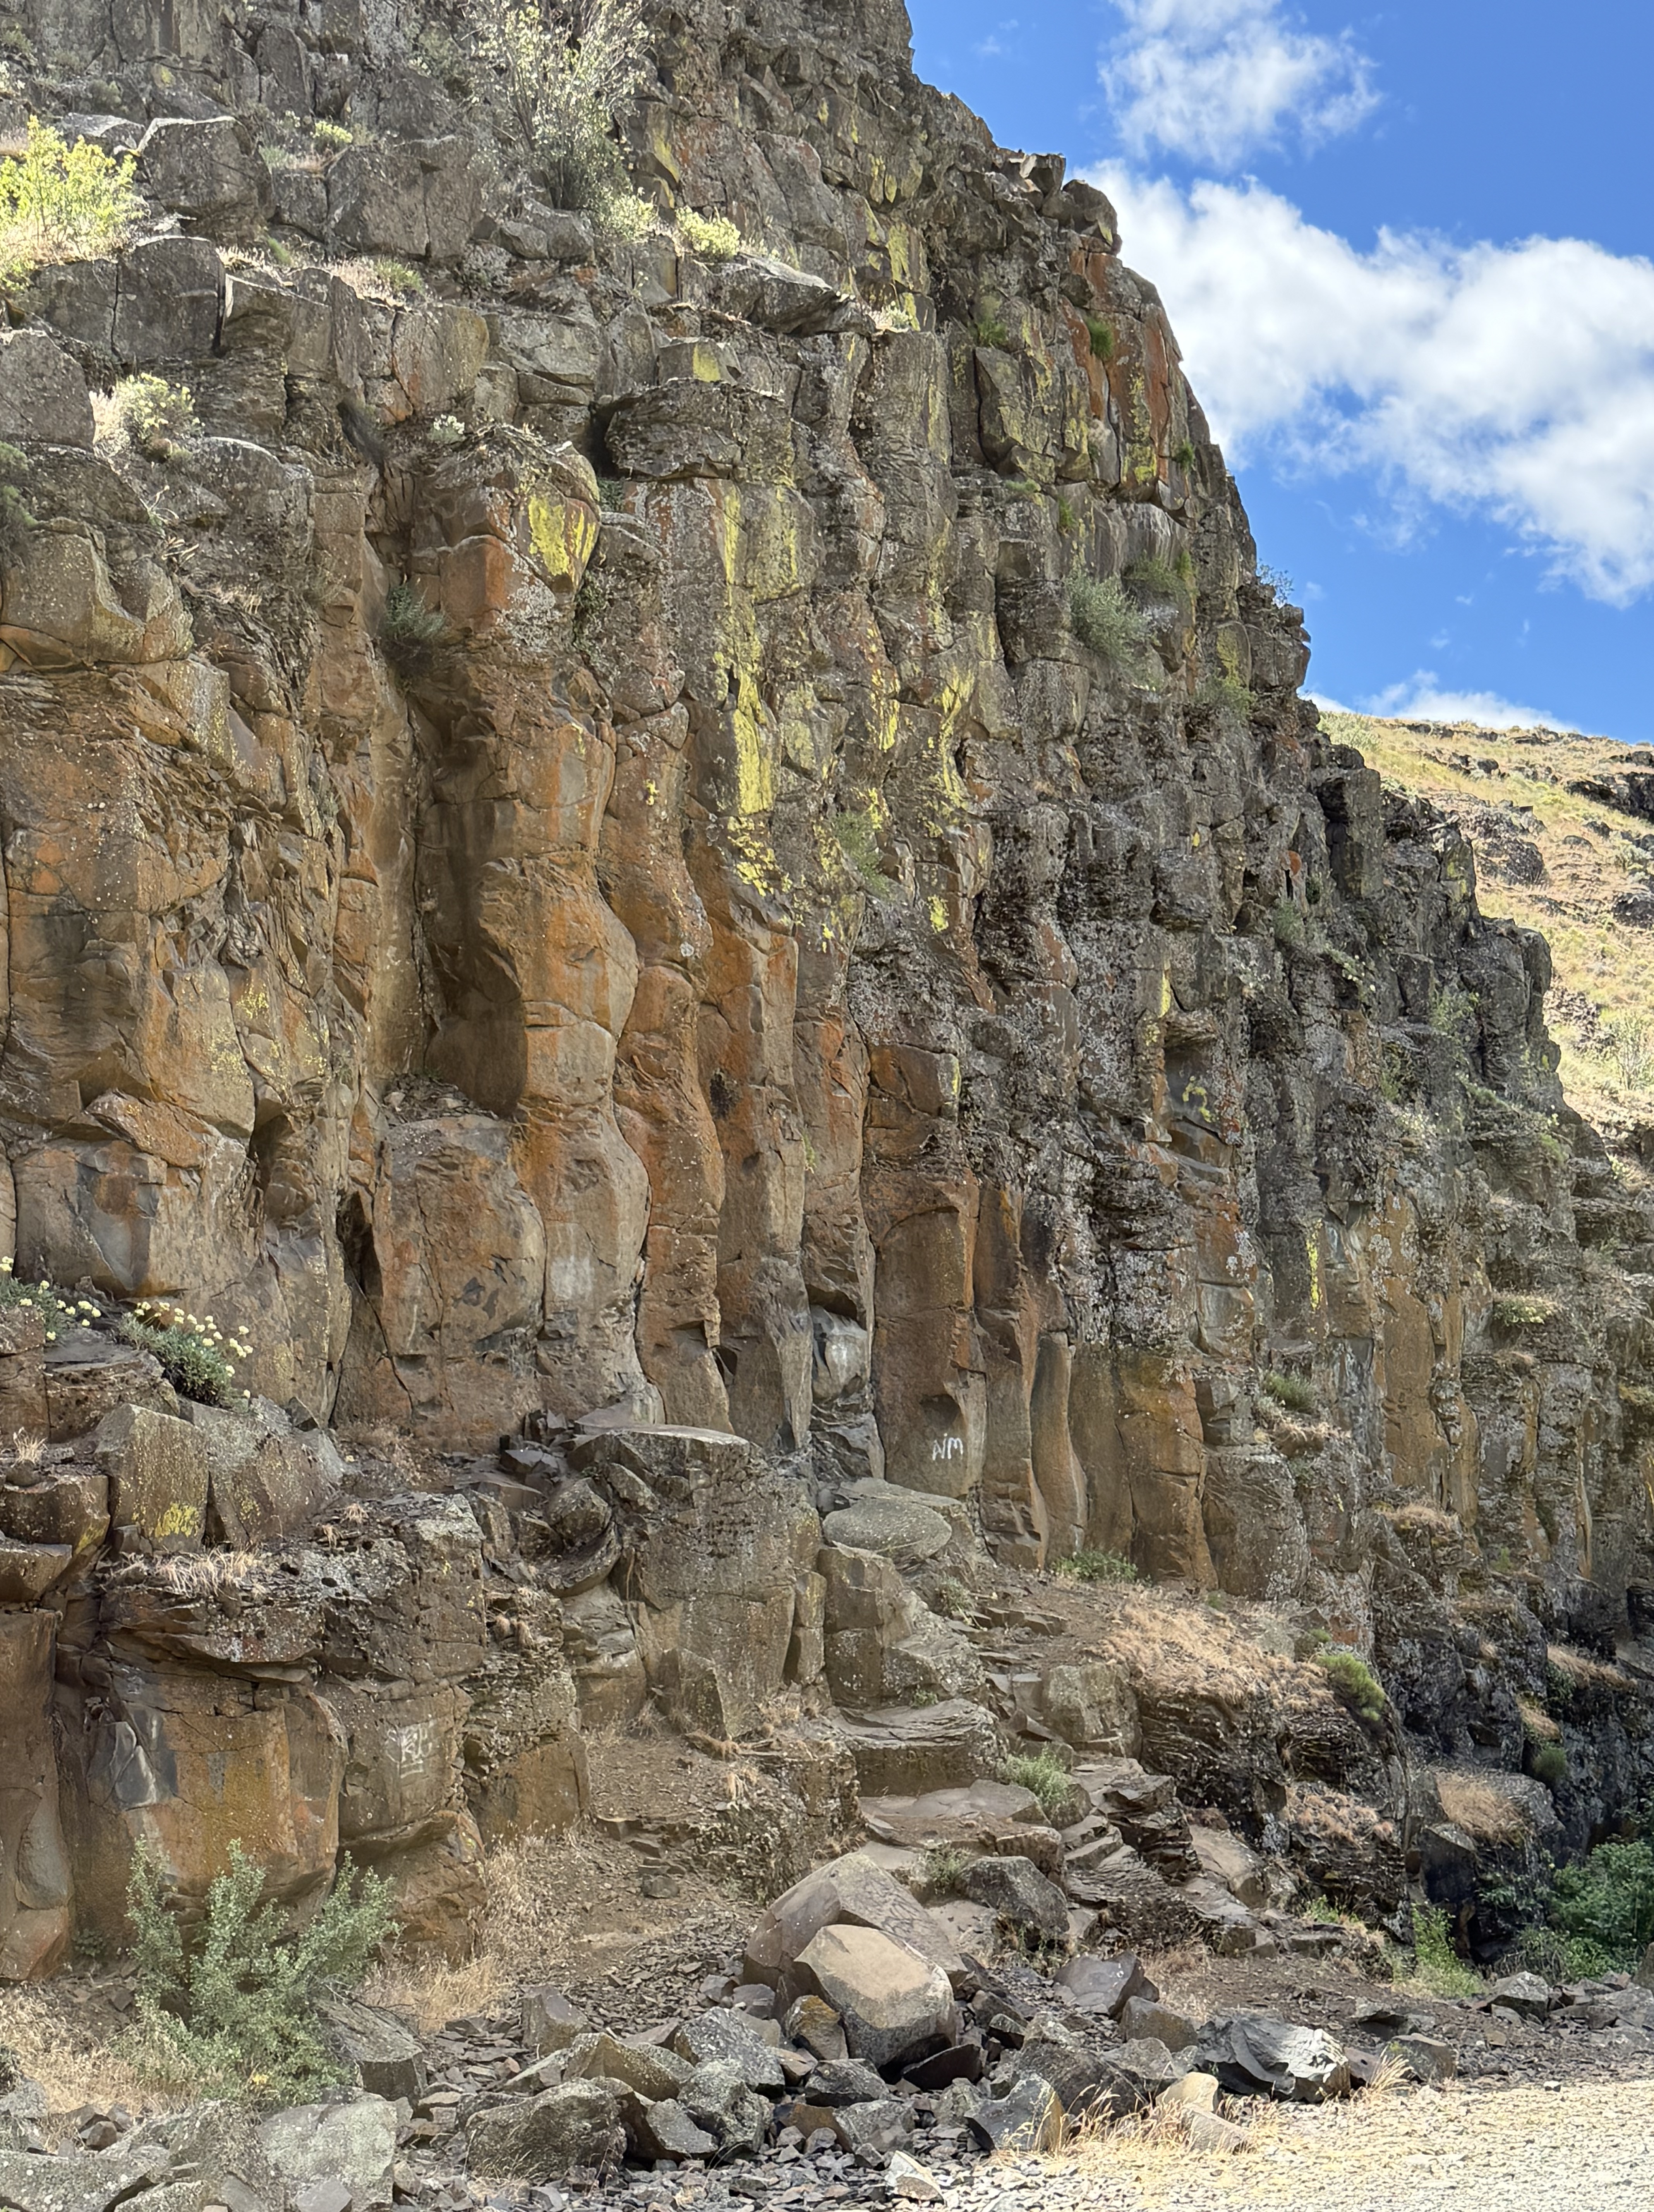
This remarkable set of columnar joints got my attention because of their undulating form. I’ve never seen anything like this before. This style of jointing (supposedly) results from uneven cooling and weathering; for example, a heavy load on the layer during cooling leads to pinching and swelling at fairly uniform spacing. That sounds reasonable to me.
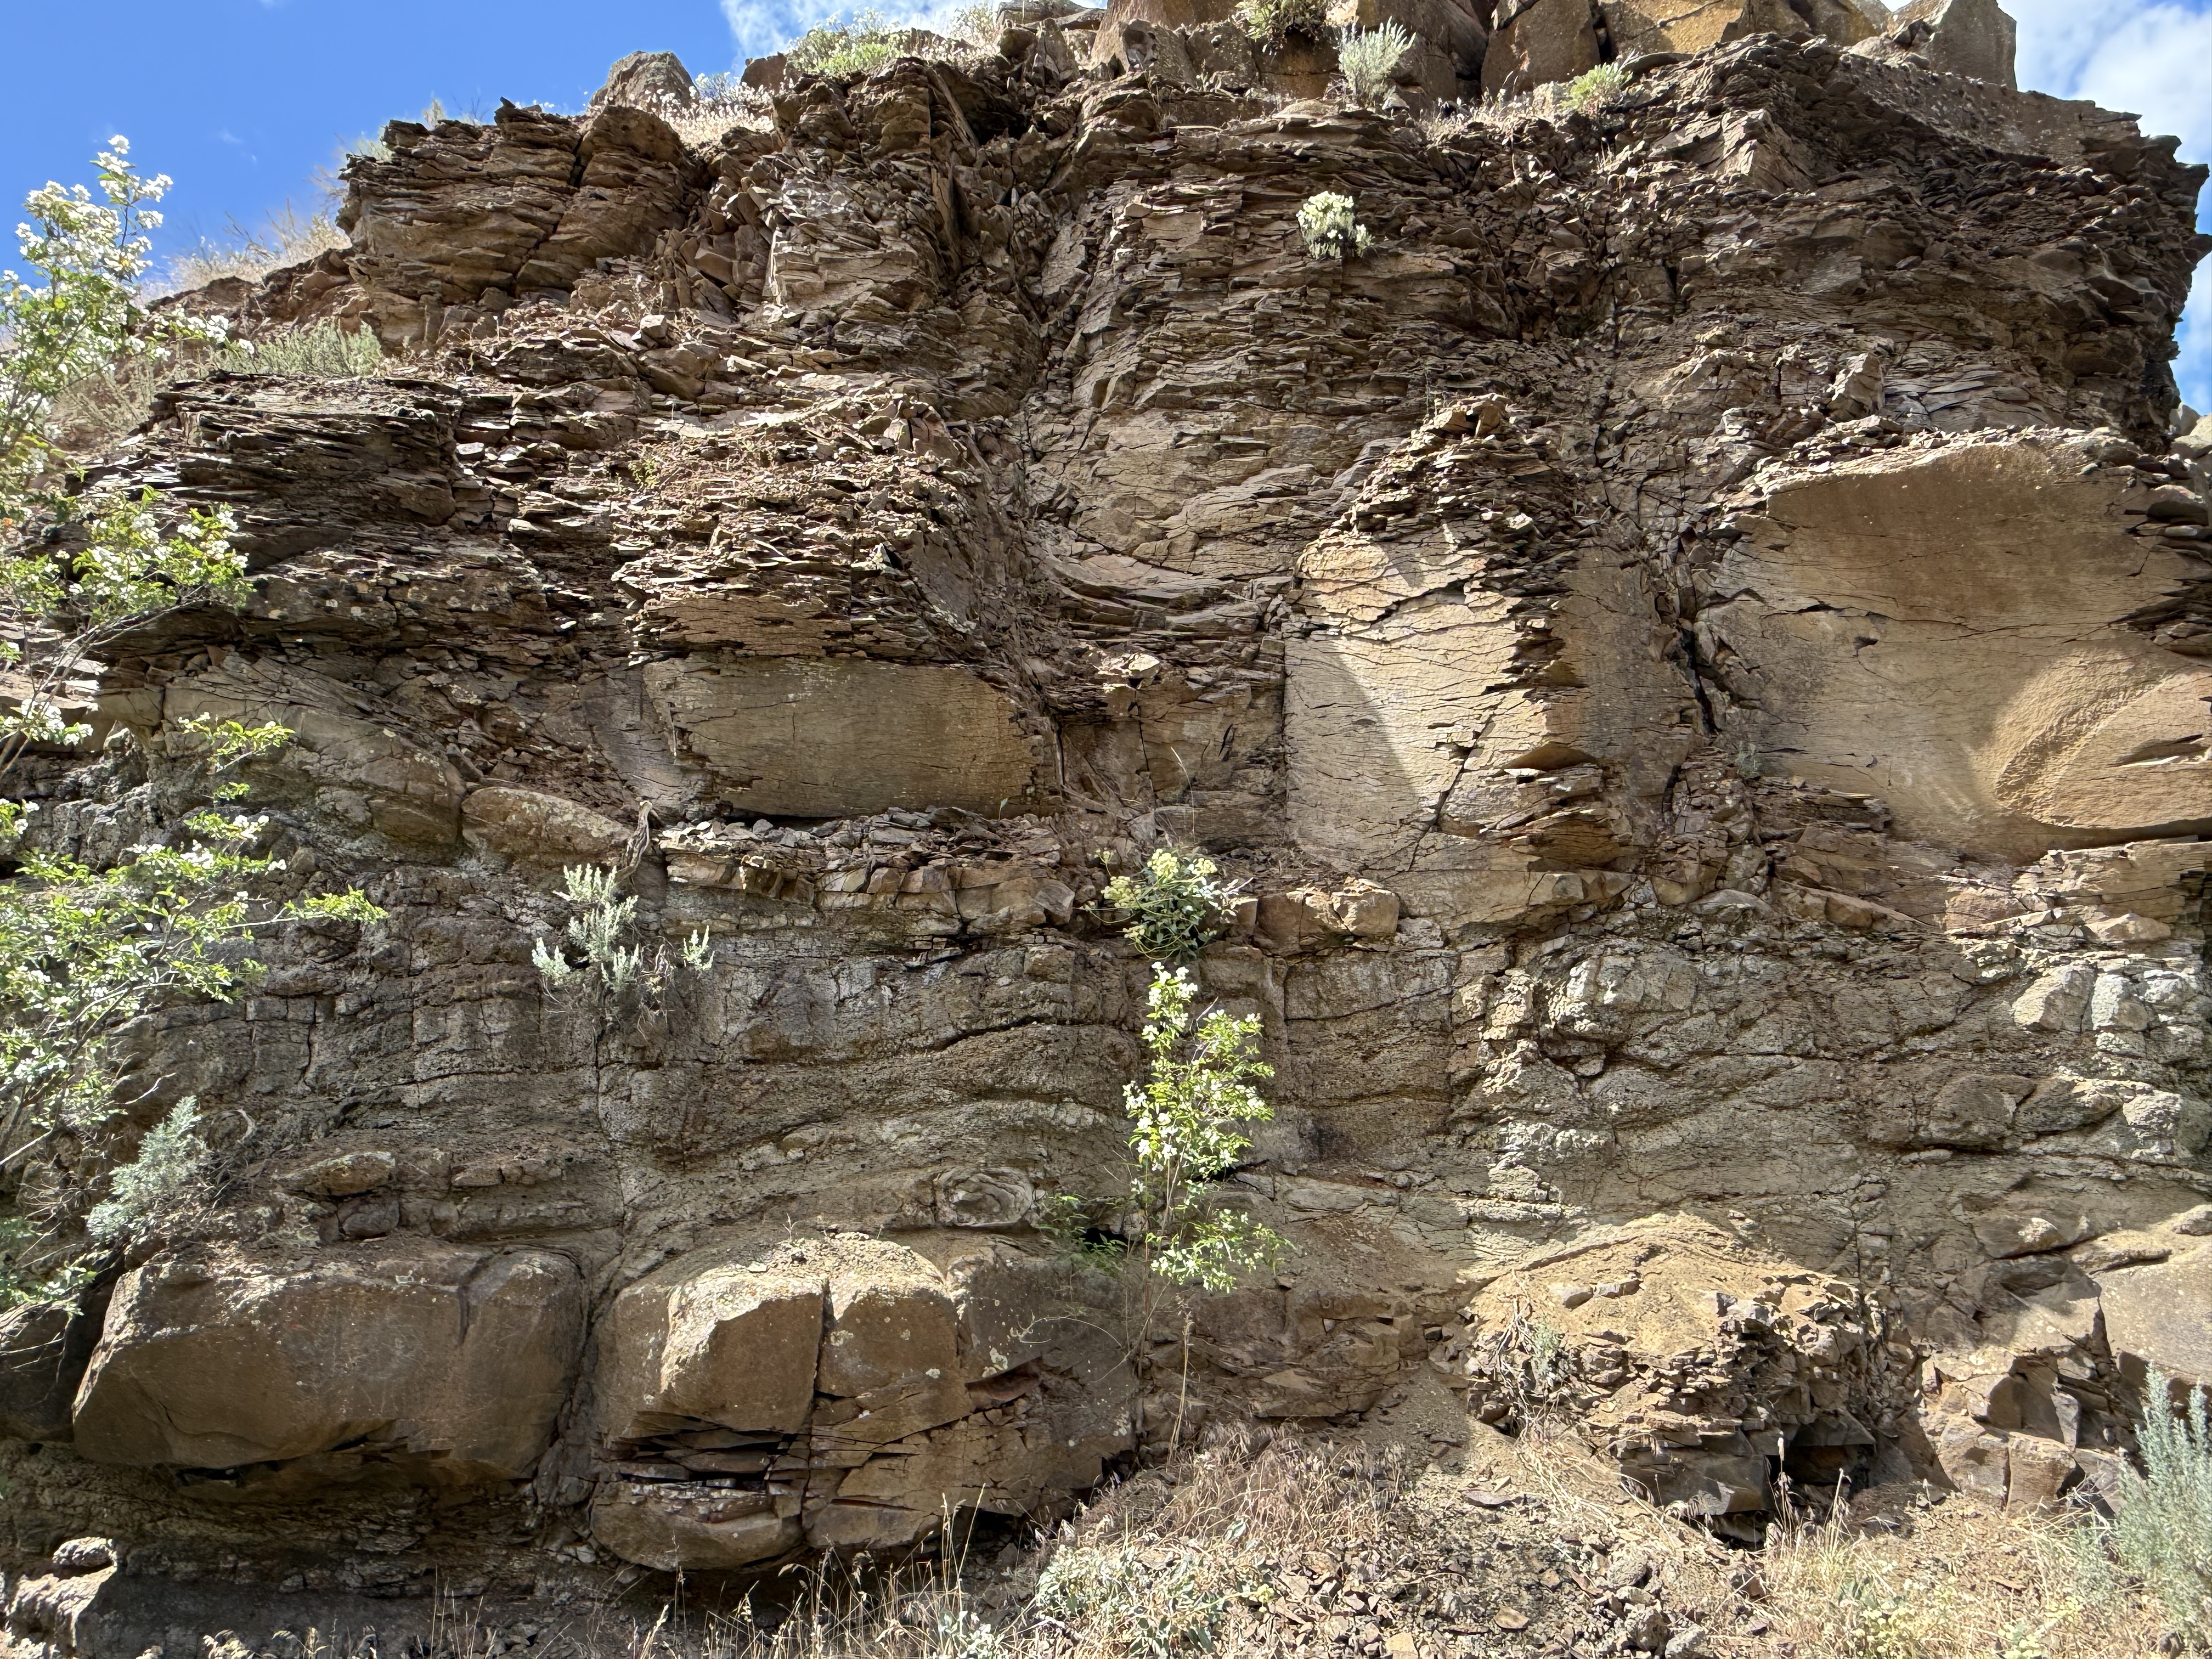
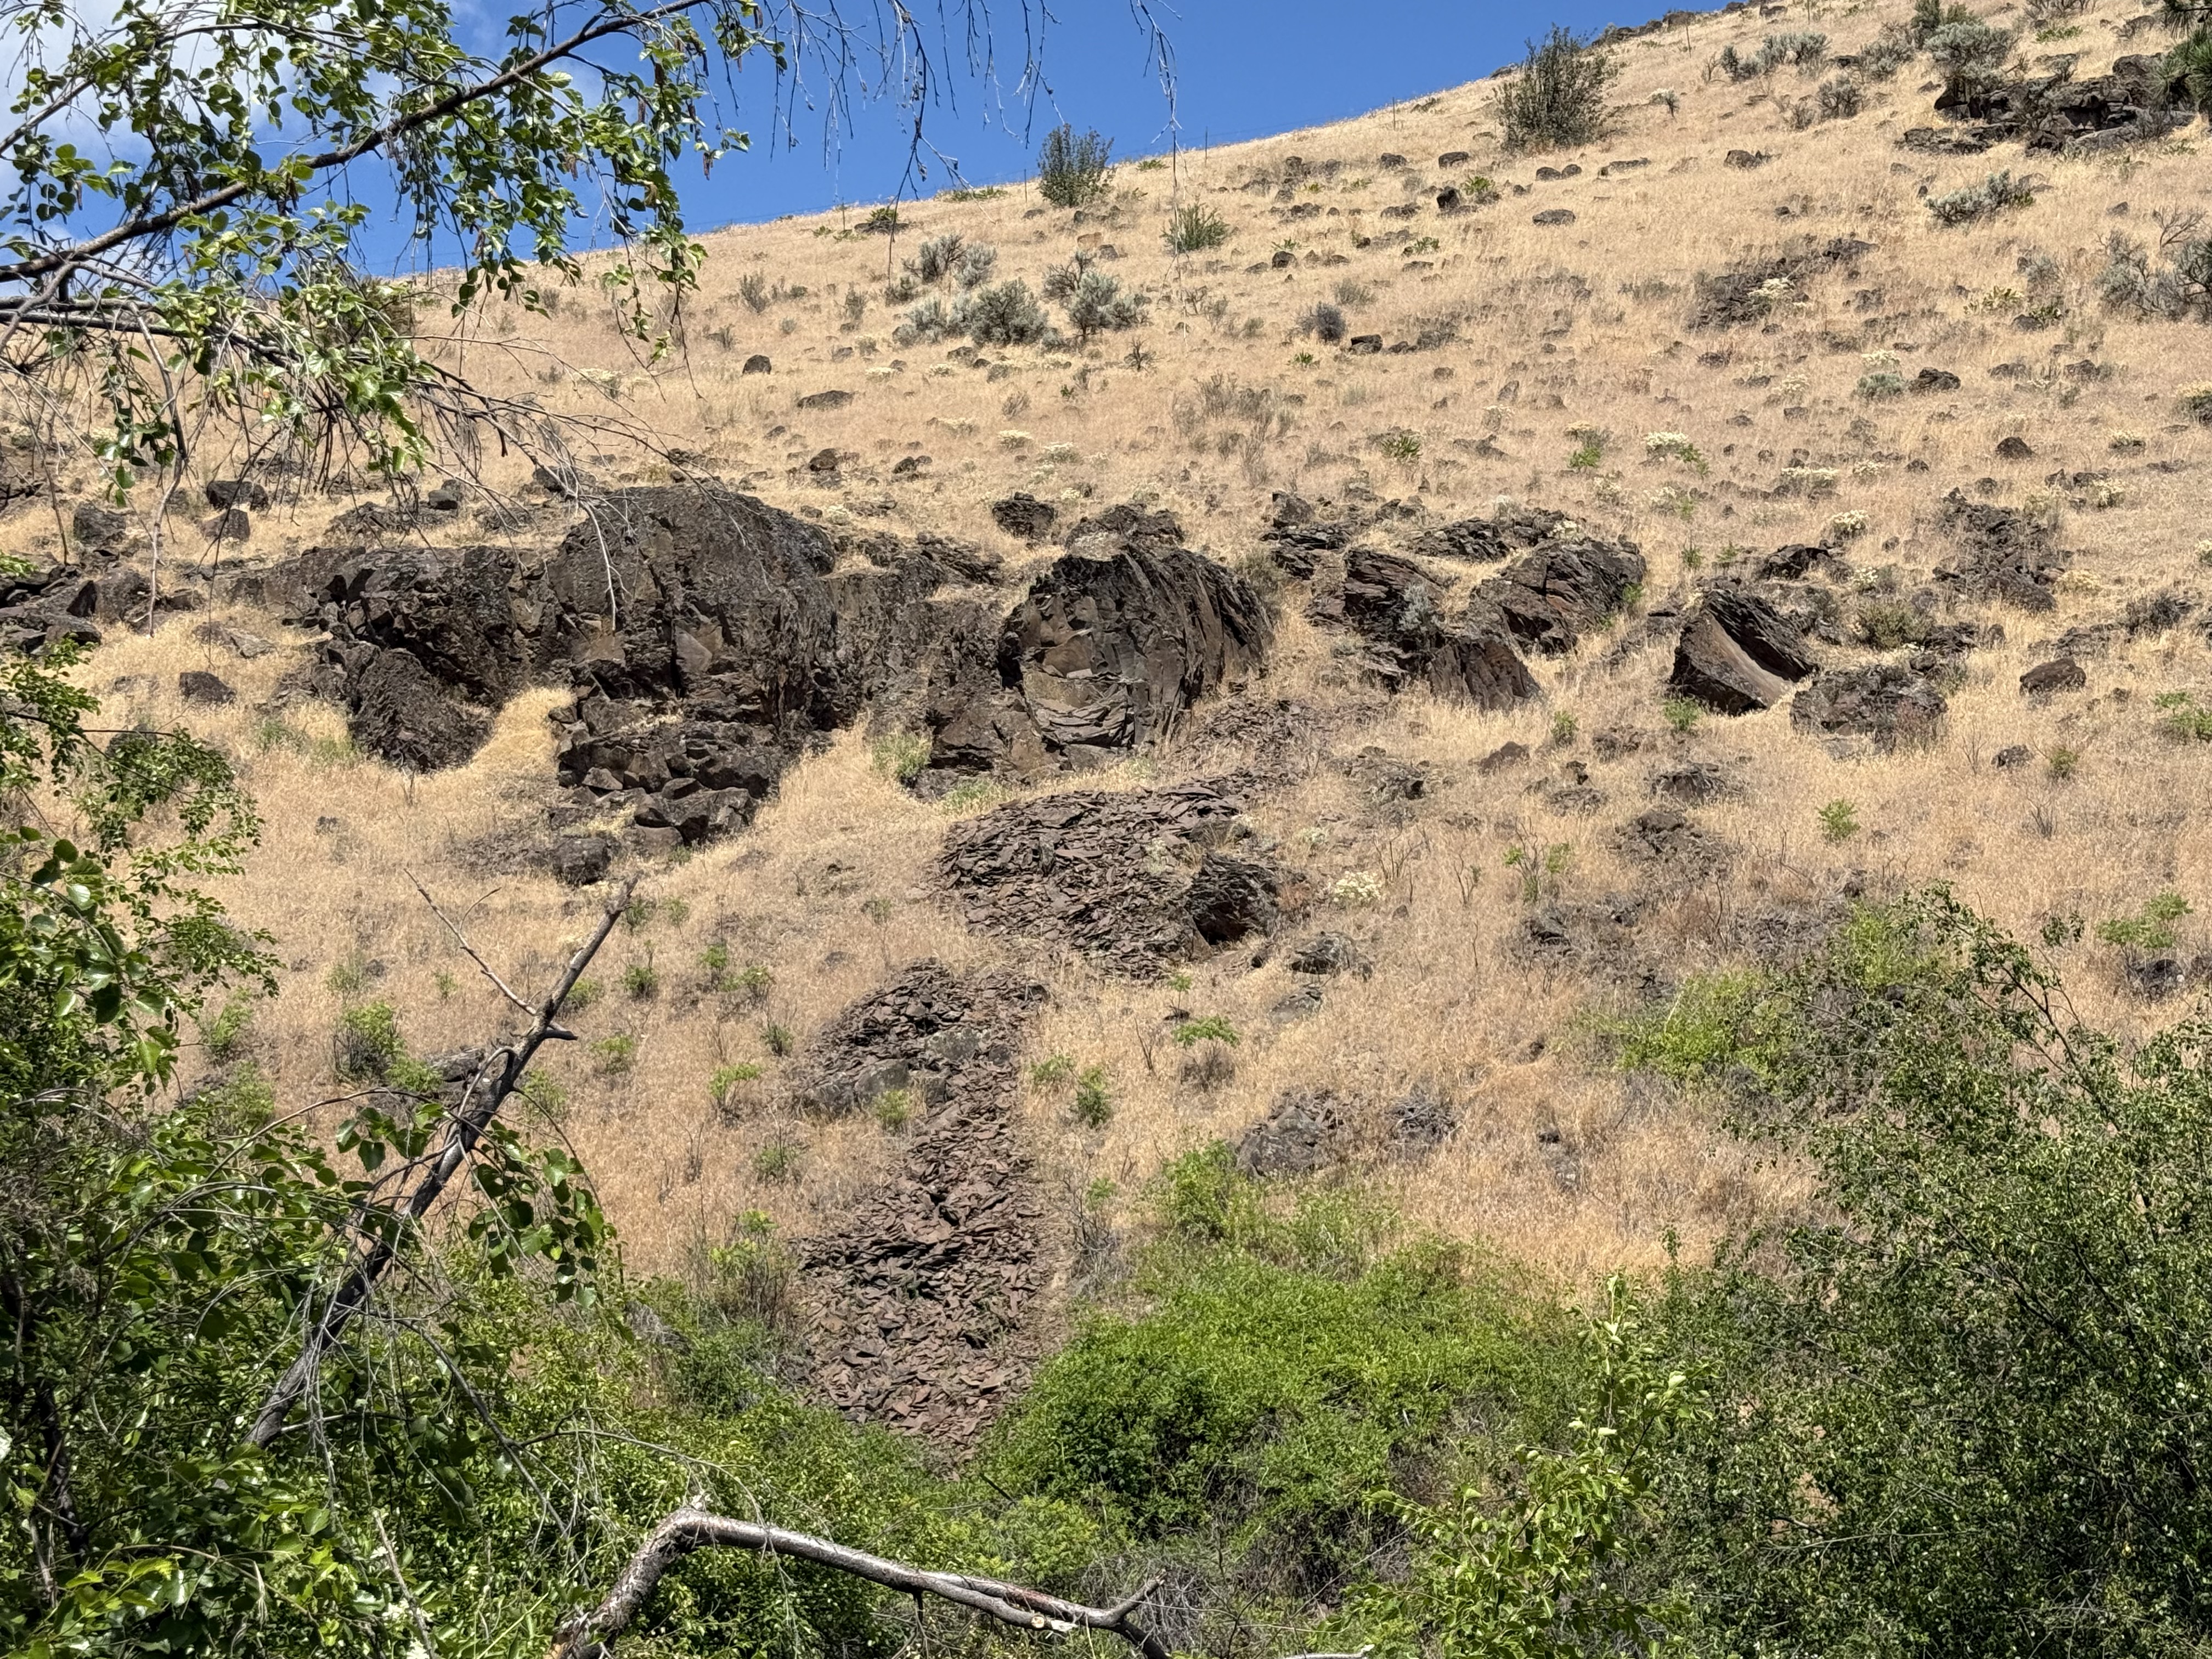
Another weathering feature of these rocks is the fissile structure revealed in this image. More solid blocks are interspersed with flaky layers, possibly (I’m speculating here) associated with necked and wider segments of an individual column. For example, the wider sections might undergo shear during stretching, resulting in microscopic shear layers within the minerals comprising the original lava. These weak layers would permit water to penetrate and weather the mafic minerals of which basalt is made.
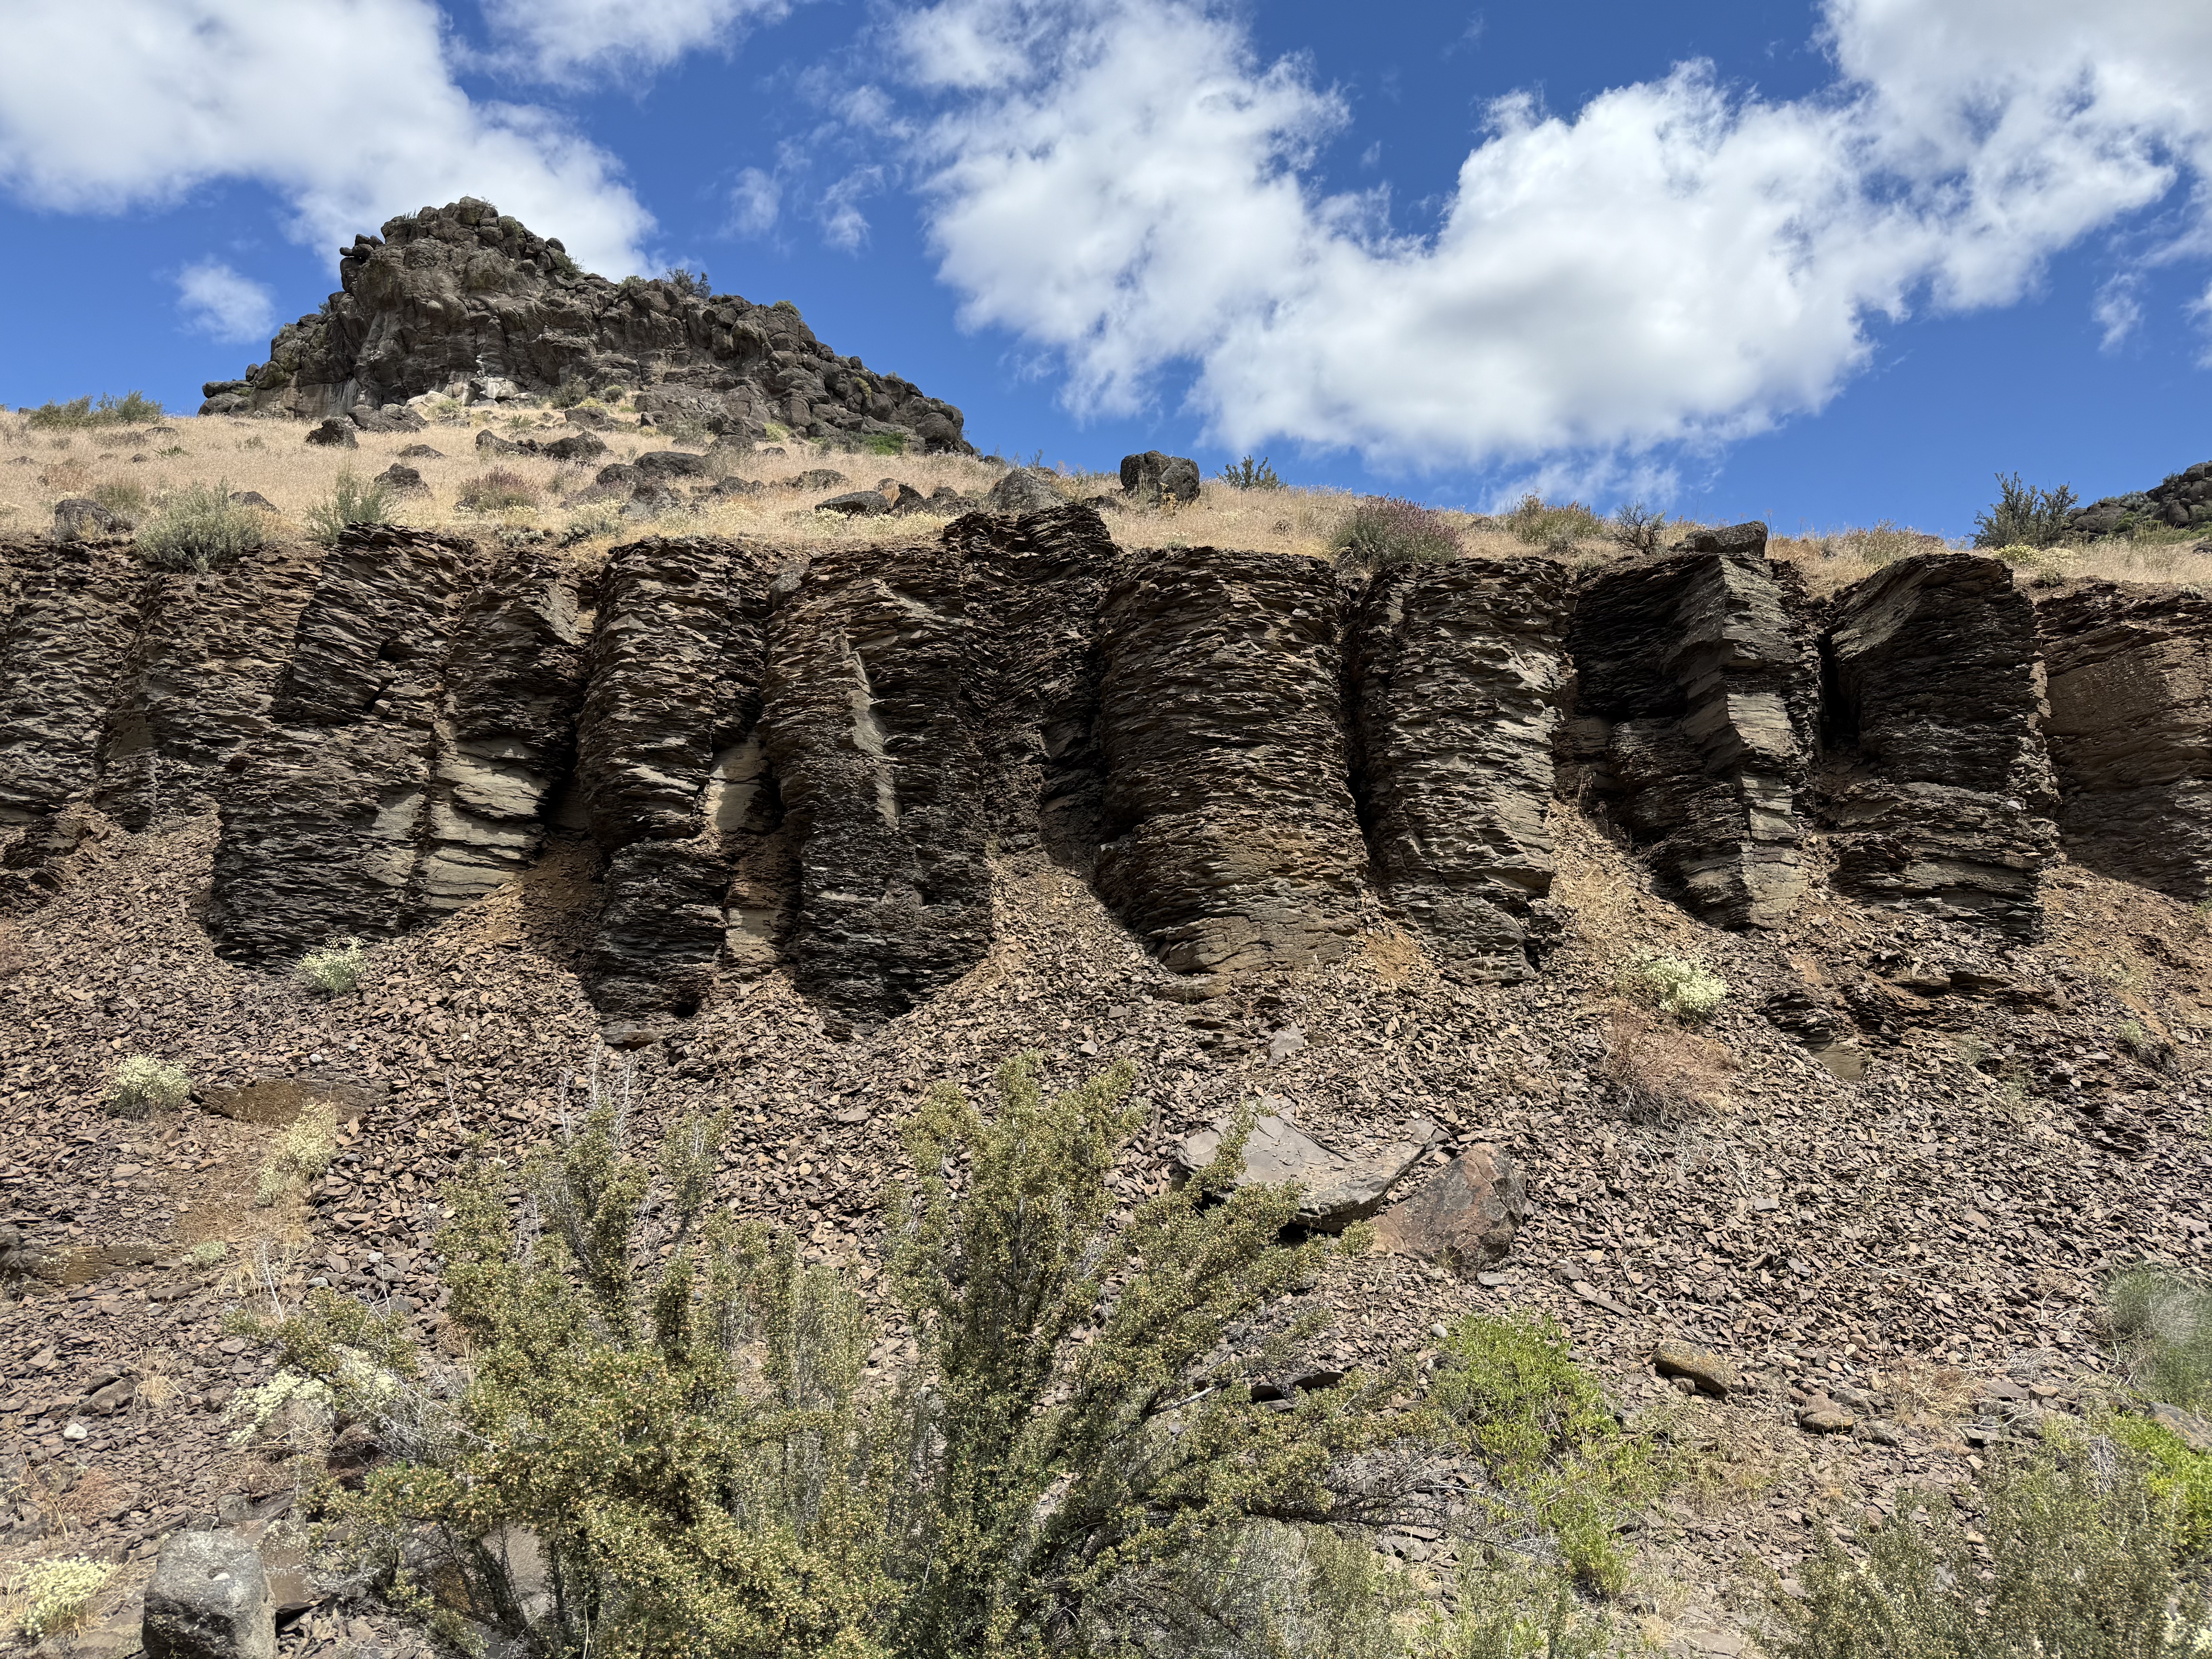
These highly weathered columns are more than six-feet in height. They suggests an alternative mechanism, shear from flowing as the basalt cooled; this might disrupt the microscopic structure without interrupting the macroscopic jointing process. Maybe…
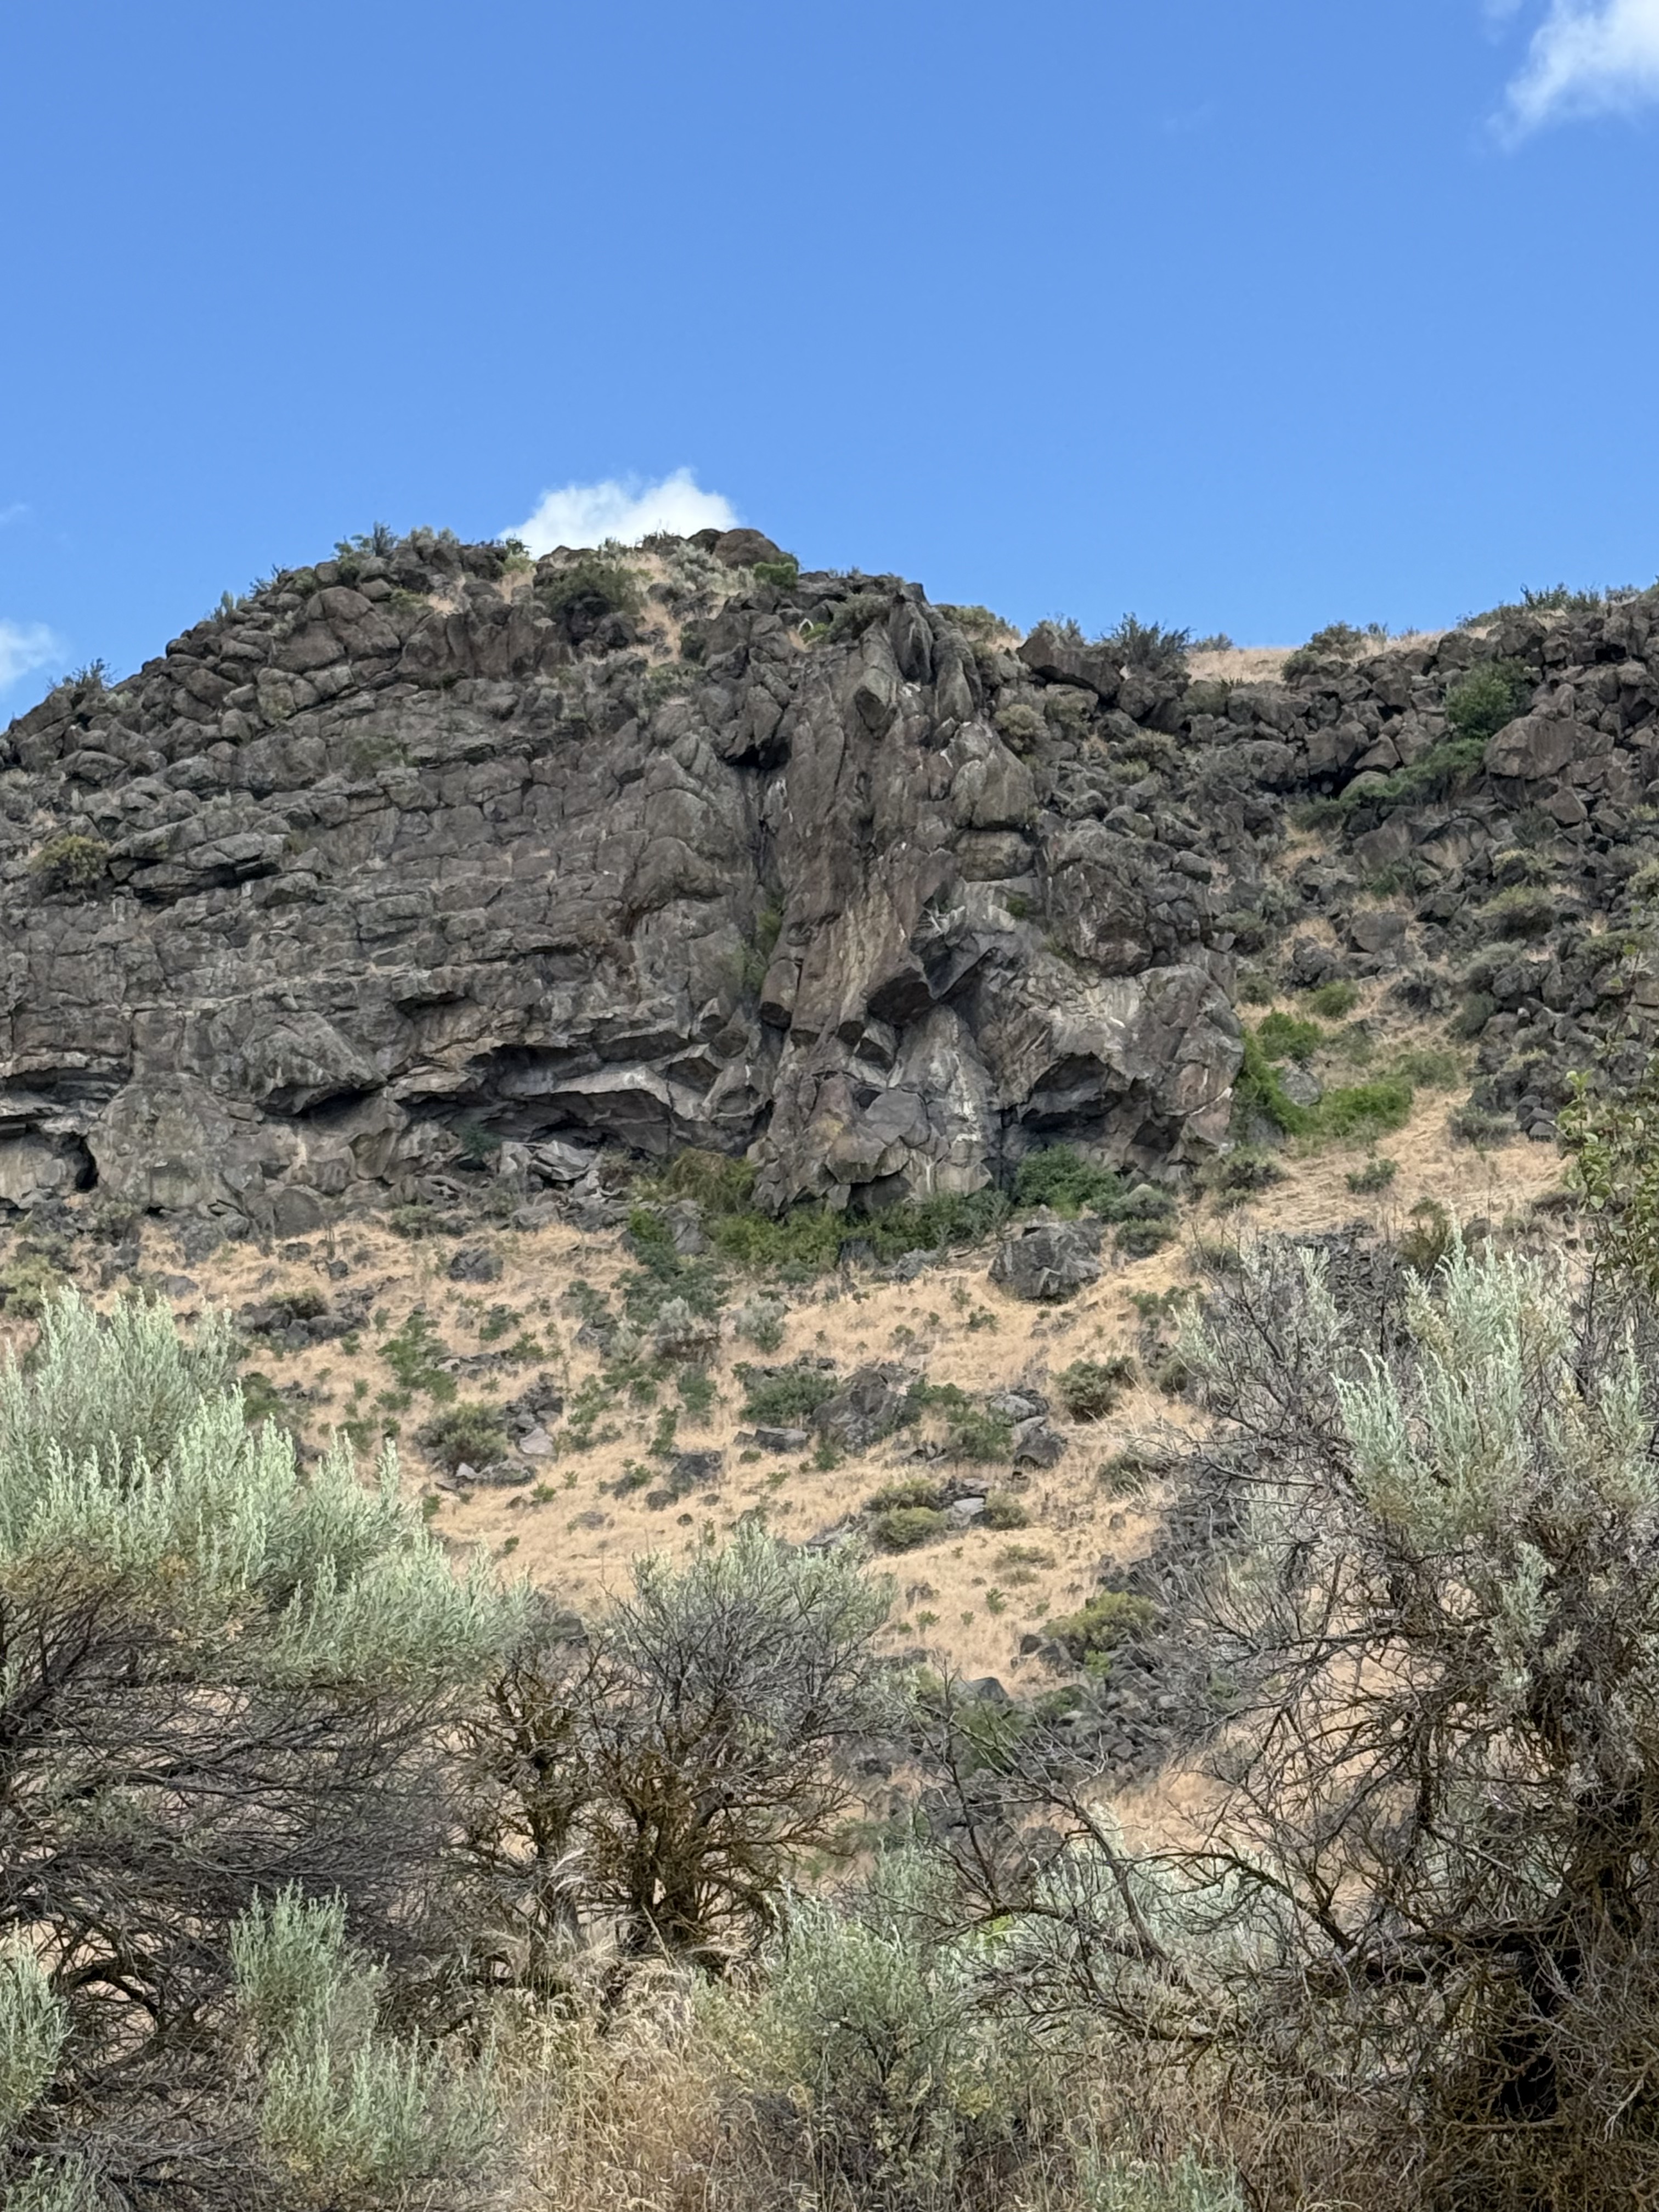
This photo really got my attention. It reveals horizontal columnar joints abutting vertical ones in the upper-center of the image. There’s a lot going on as hot lava flows over an irregular landscape, but I think this is a vent where more magma flowed out; not a large eruption, but enough to have a separate cooling history from the rock it penetrated. I should note that the Columbia River basalts flowed from fissures rather than point sources like volcanoes. The entire area shown in the map above was cut by fissures that led to a shallow magma chamber, which is still down there although it has probably solidified by now. Or not…
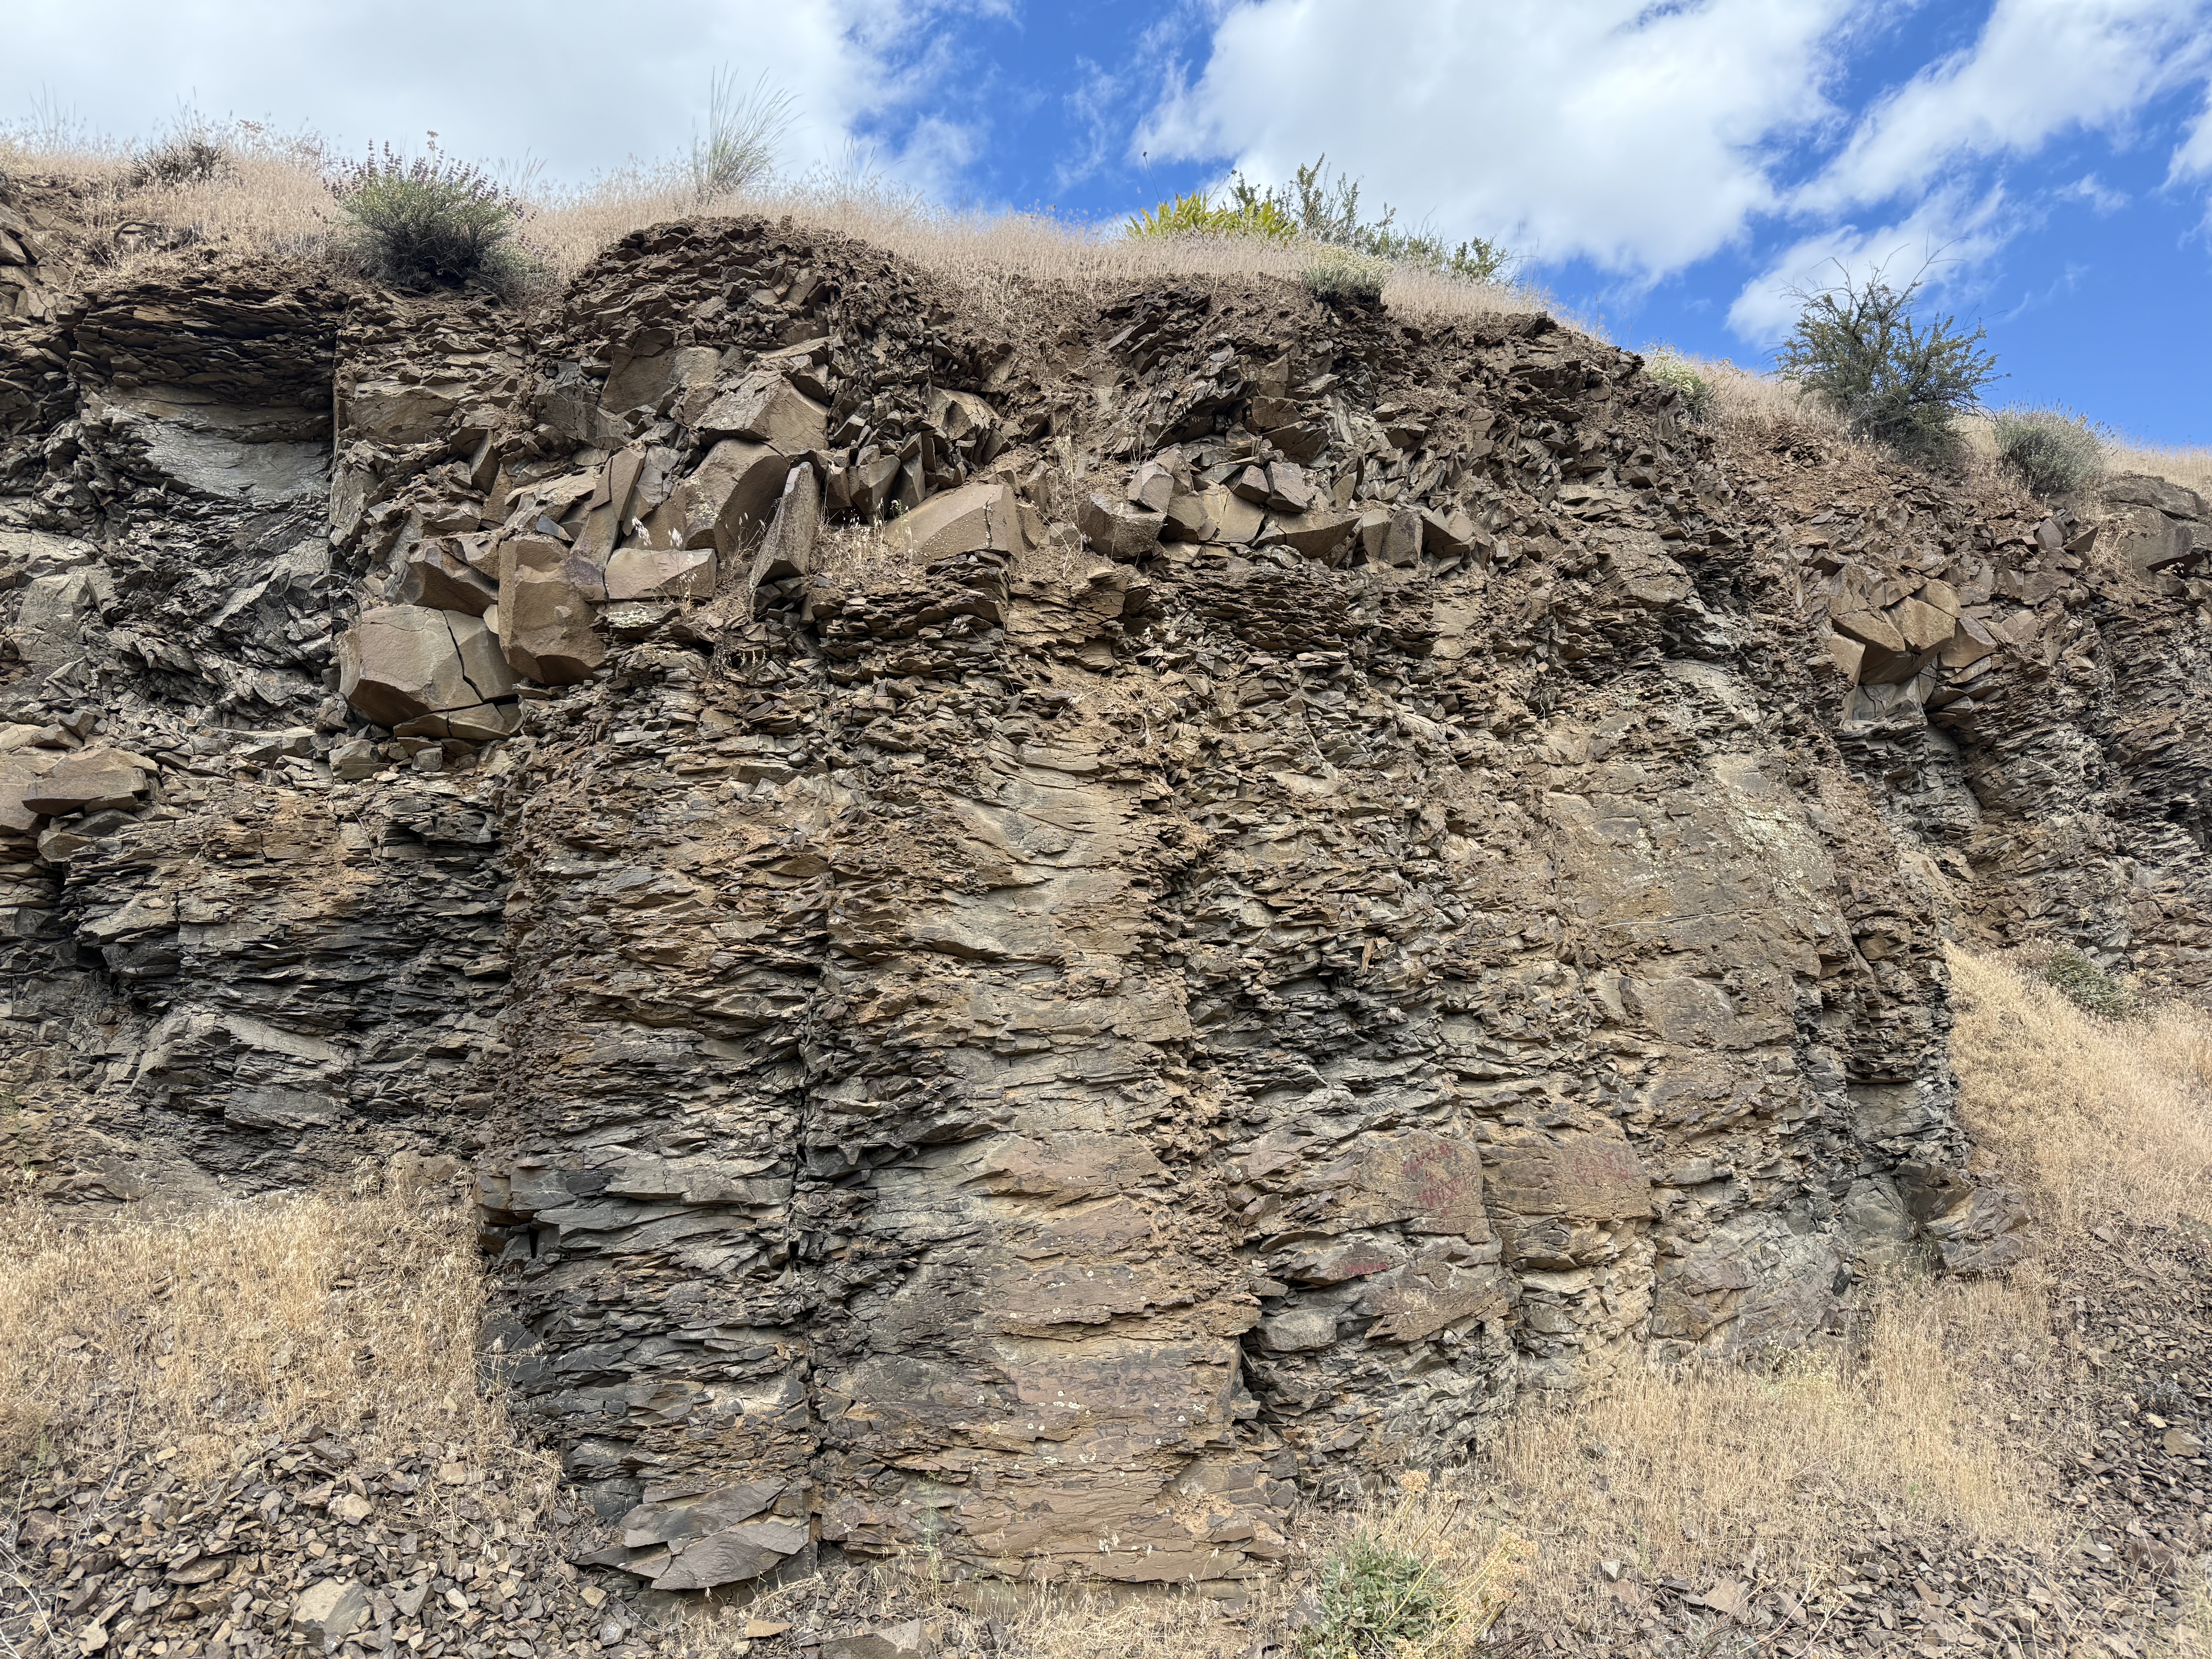
I like this picture because it reveals how much weathering can change the appearance of what was once molten lava in only a few million years. Note the layer of angular blocks sandwiched between weathered columns.
Conclusions
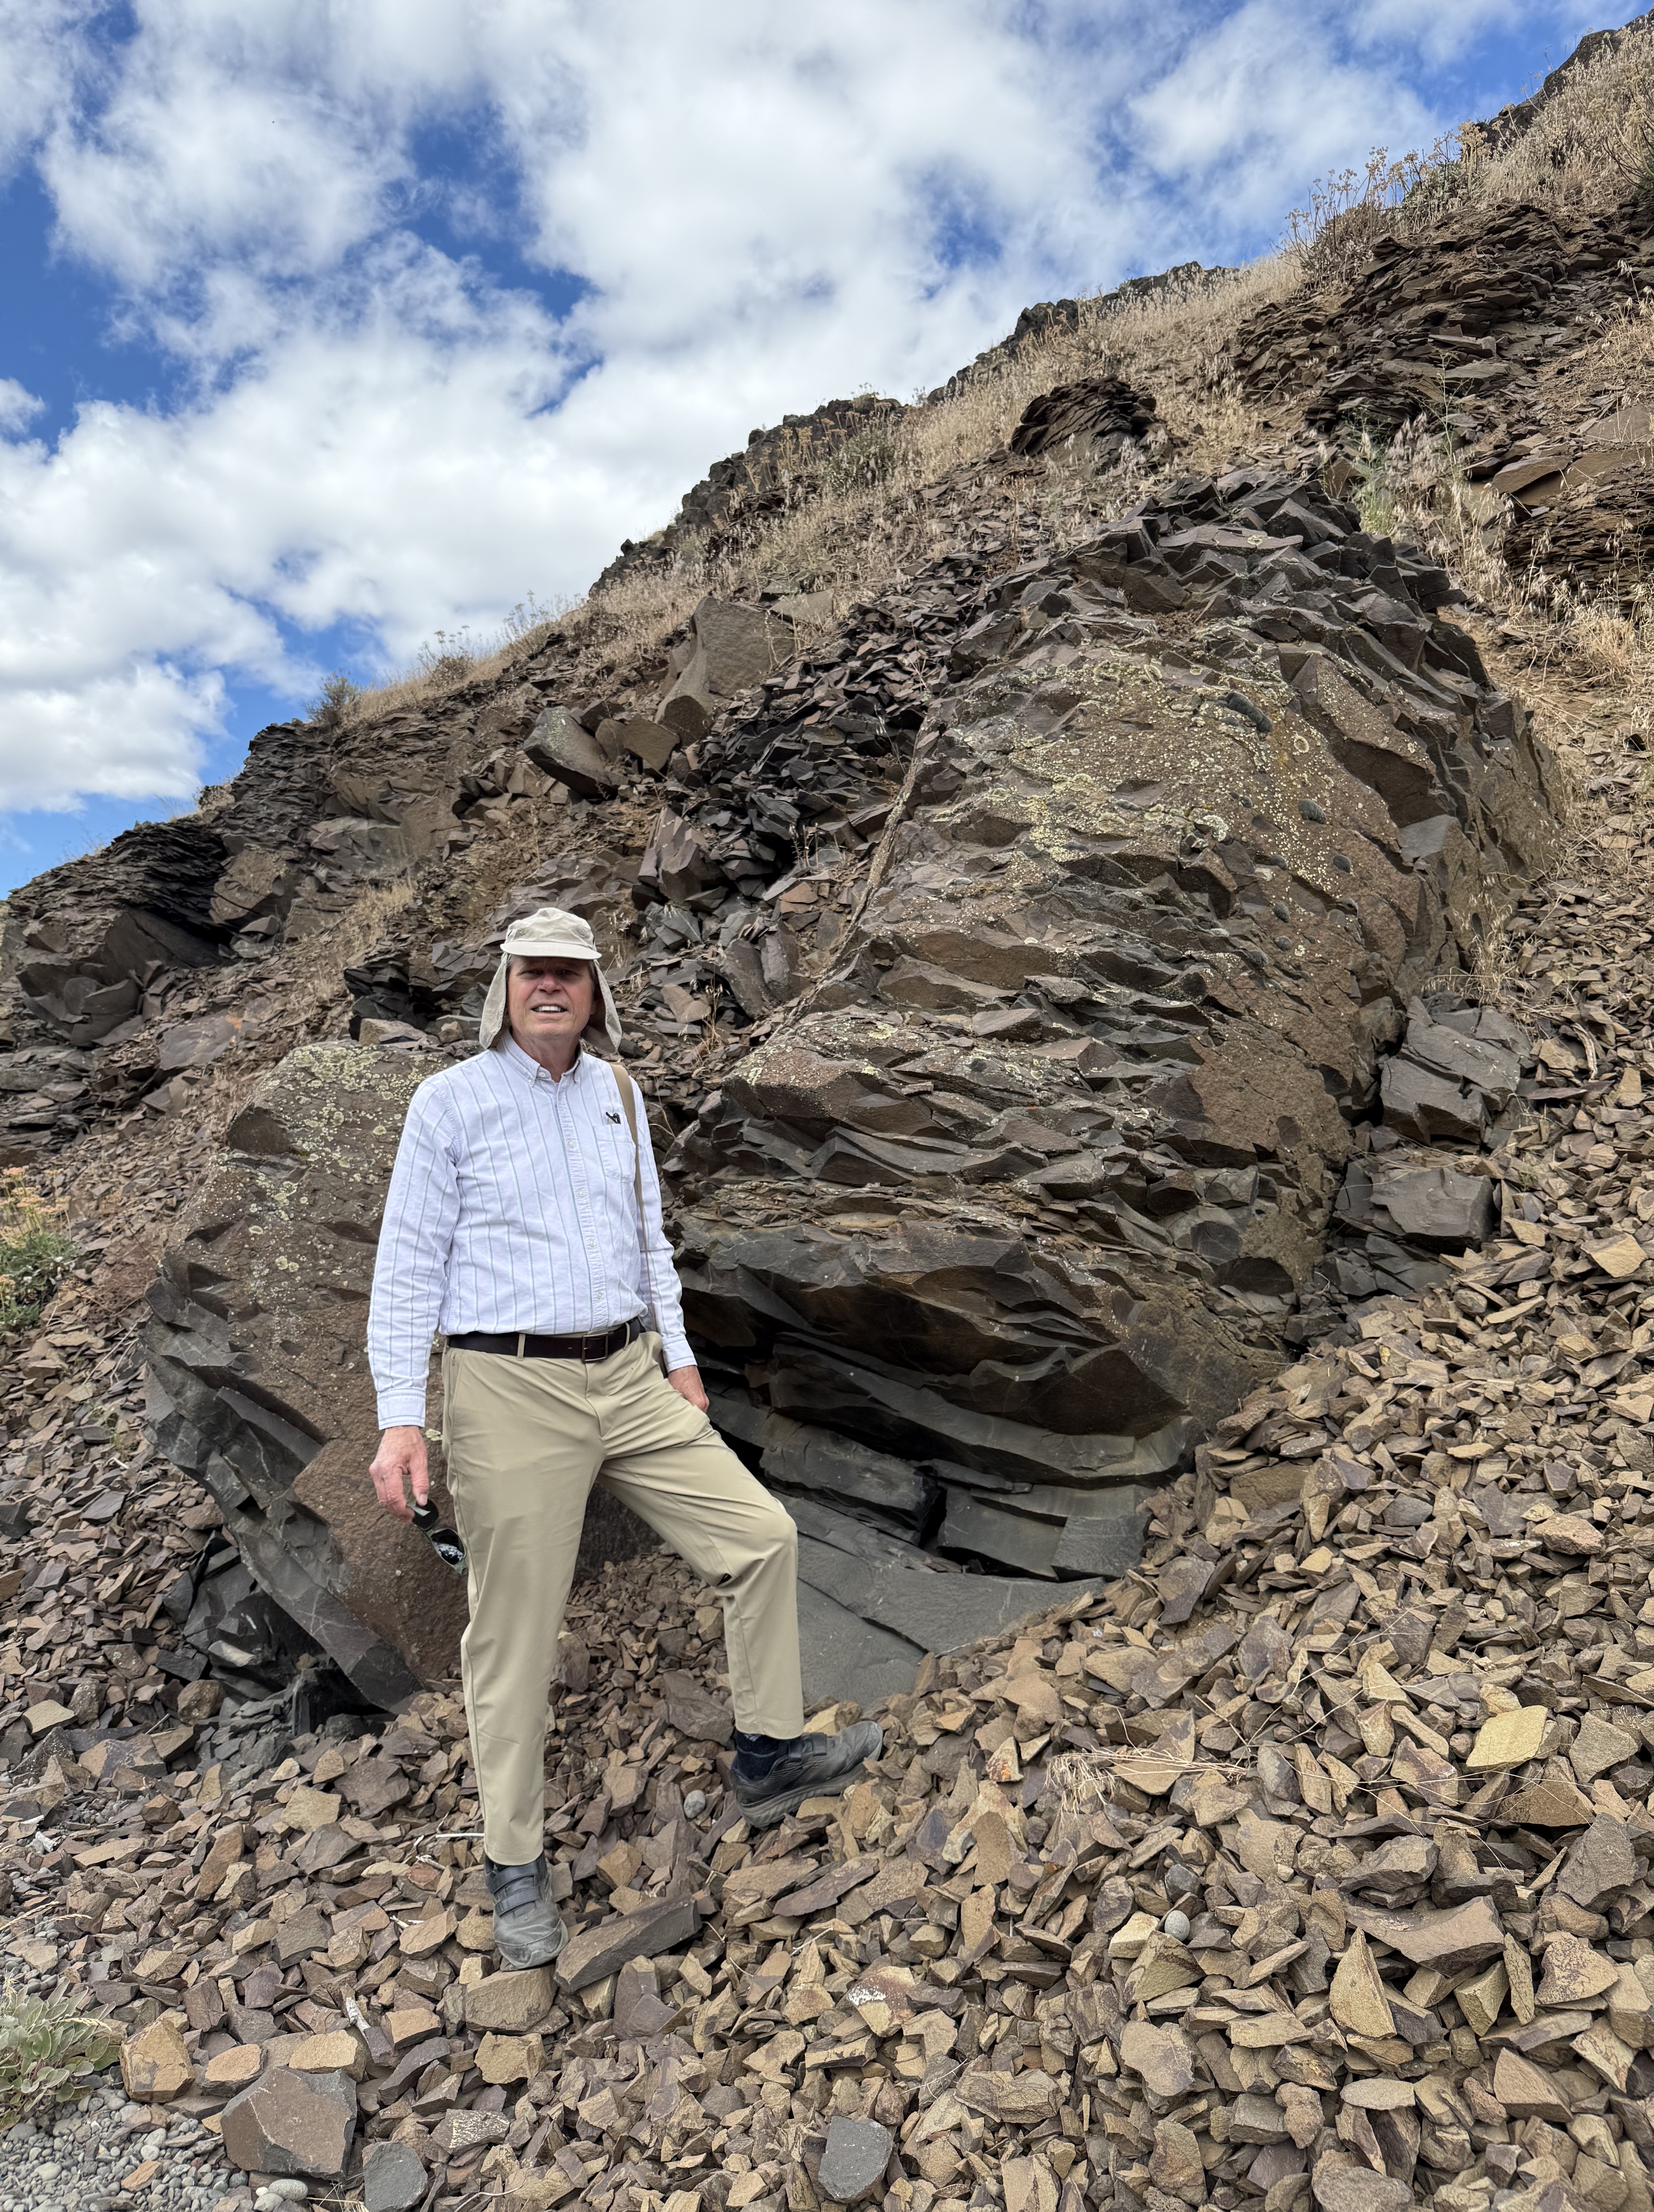
This is a typical basalt column that isn’t as weathered as some of the others. All those shards I’m standing on resulted from the breakdown of the rock by water seeping into its internal structure, where it altered the mafic minerals (e.g. pyroxene, plagioclase feldspar, biotite), which are susceptible to chemical weathering. This is where all the mud in the world comes from.
It was a great day to drive over the Cascades at Chinook Pass, where it snowed on us (in June), and explore the Columbia plateau. I’ve never seen so much variability in basalts before. The magma chamber underlying central Washington was a giant chemical reactor that released pressure by erupting a mix of fluids that cooled to form minerals and then these magnificent rocks. These rocks tell us how the magma chamber evolved over several million years; and once they were exposed to the atmosphere, they began to record the slow process of being reduced back to their basic constituents (fine-grained minerals like clay), which can remain suspended in water and begin their long and perilous journey to their final resting place–sometimes a lake but, ultimately, the ocean.
Everything eventually returns to the sea…
Cretaceous Intrusive Rocks in British Columbia
This post finds me in British Columbia (Fig. 1), where I explored fjords cut into mostly intrusive rocks that form an immense batholith composed of many overlapping plutons. The tectonic regime of this area is collision between the many small plates that comprised the Pacific Ocean as well as any island arcs and microcontinents that got in the way of N. America on its westward journey, which began about 200 million years ago (Ma). A collision between ocean crust and the N. American tectonic plate would have created a subduction zone, in which the denser ocean crust was driven beneath the continent. However, recent work suggests that this process was interrupted for uncertain intervals when islands collided with N. America; furthermore, there is evidence for a lot of strike-slip fault movement along transform faults. You can learn more about this complex history at Nick Zentner’s web page.
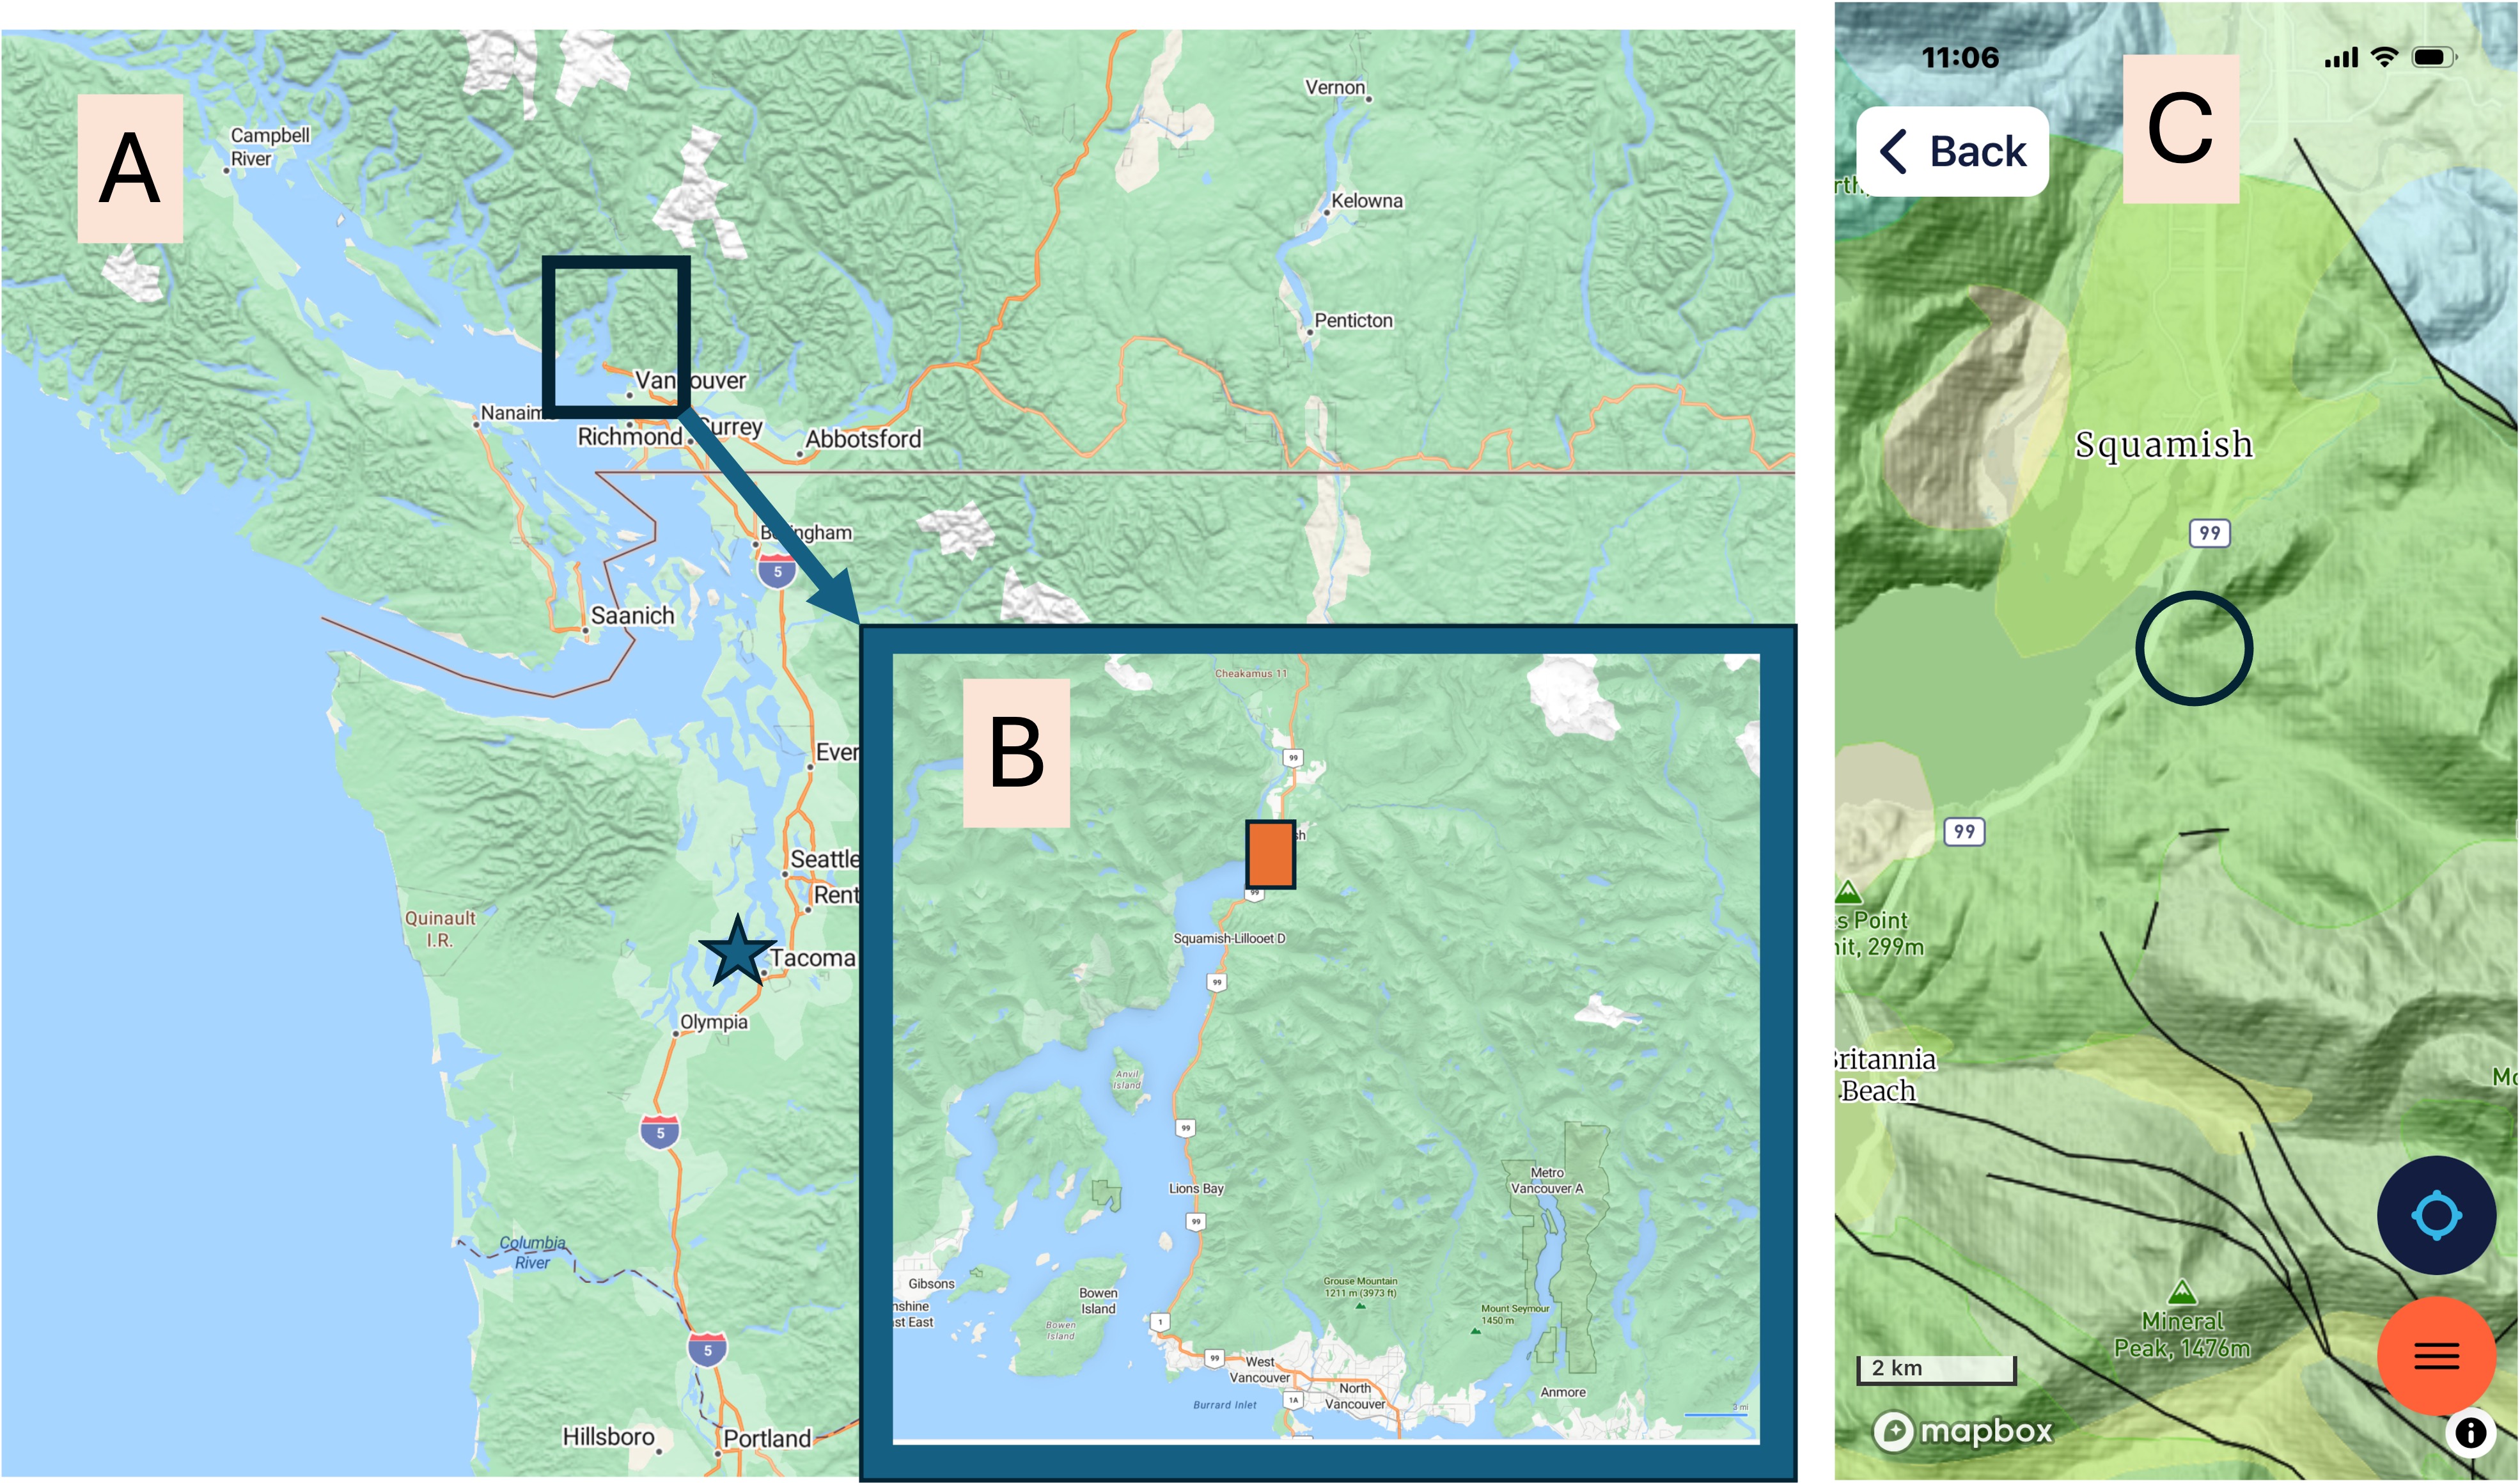
Figure 1. (A) Regional map showing the location of the study area in SW British Columbia, about 230 km (140 miles) north of Tacoma (starred location). (B) Detail map of the inlet (I couldn’t find a name for it), showing the location of the Sea-to-Sky gondola I rode to Squamish and Chief Viewpoint park. (C) Geologic map from RockD, showing the fairly uniform occurrence of diorite intrusive rocks intruded between 143 and 66 Ma (covering the entire Cretaceous geological period). The town of Squamish sits at the head of the fjord. Faults of unidentified type (i.e., normal, reverse, strike-slip) are common but don’t appear to control the location of major drainage basins, which have been excavated by glacial action during the Pleistocene epoch. The circle indicates the area reported on today, except for Fig. 2.
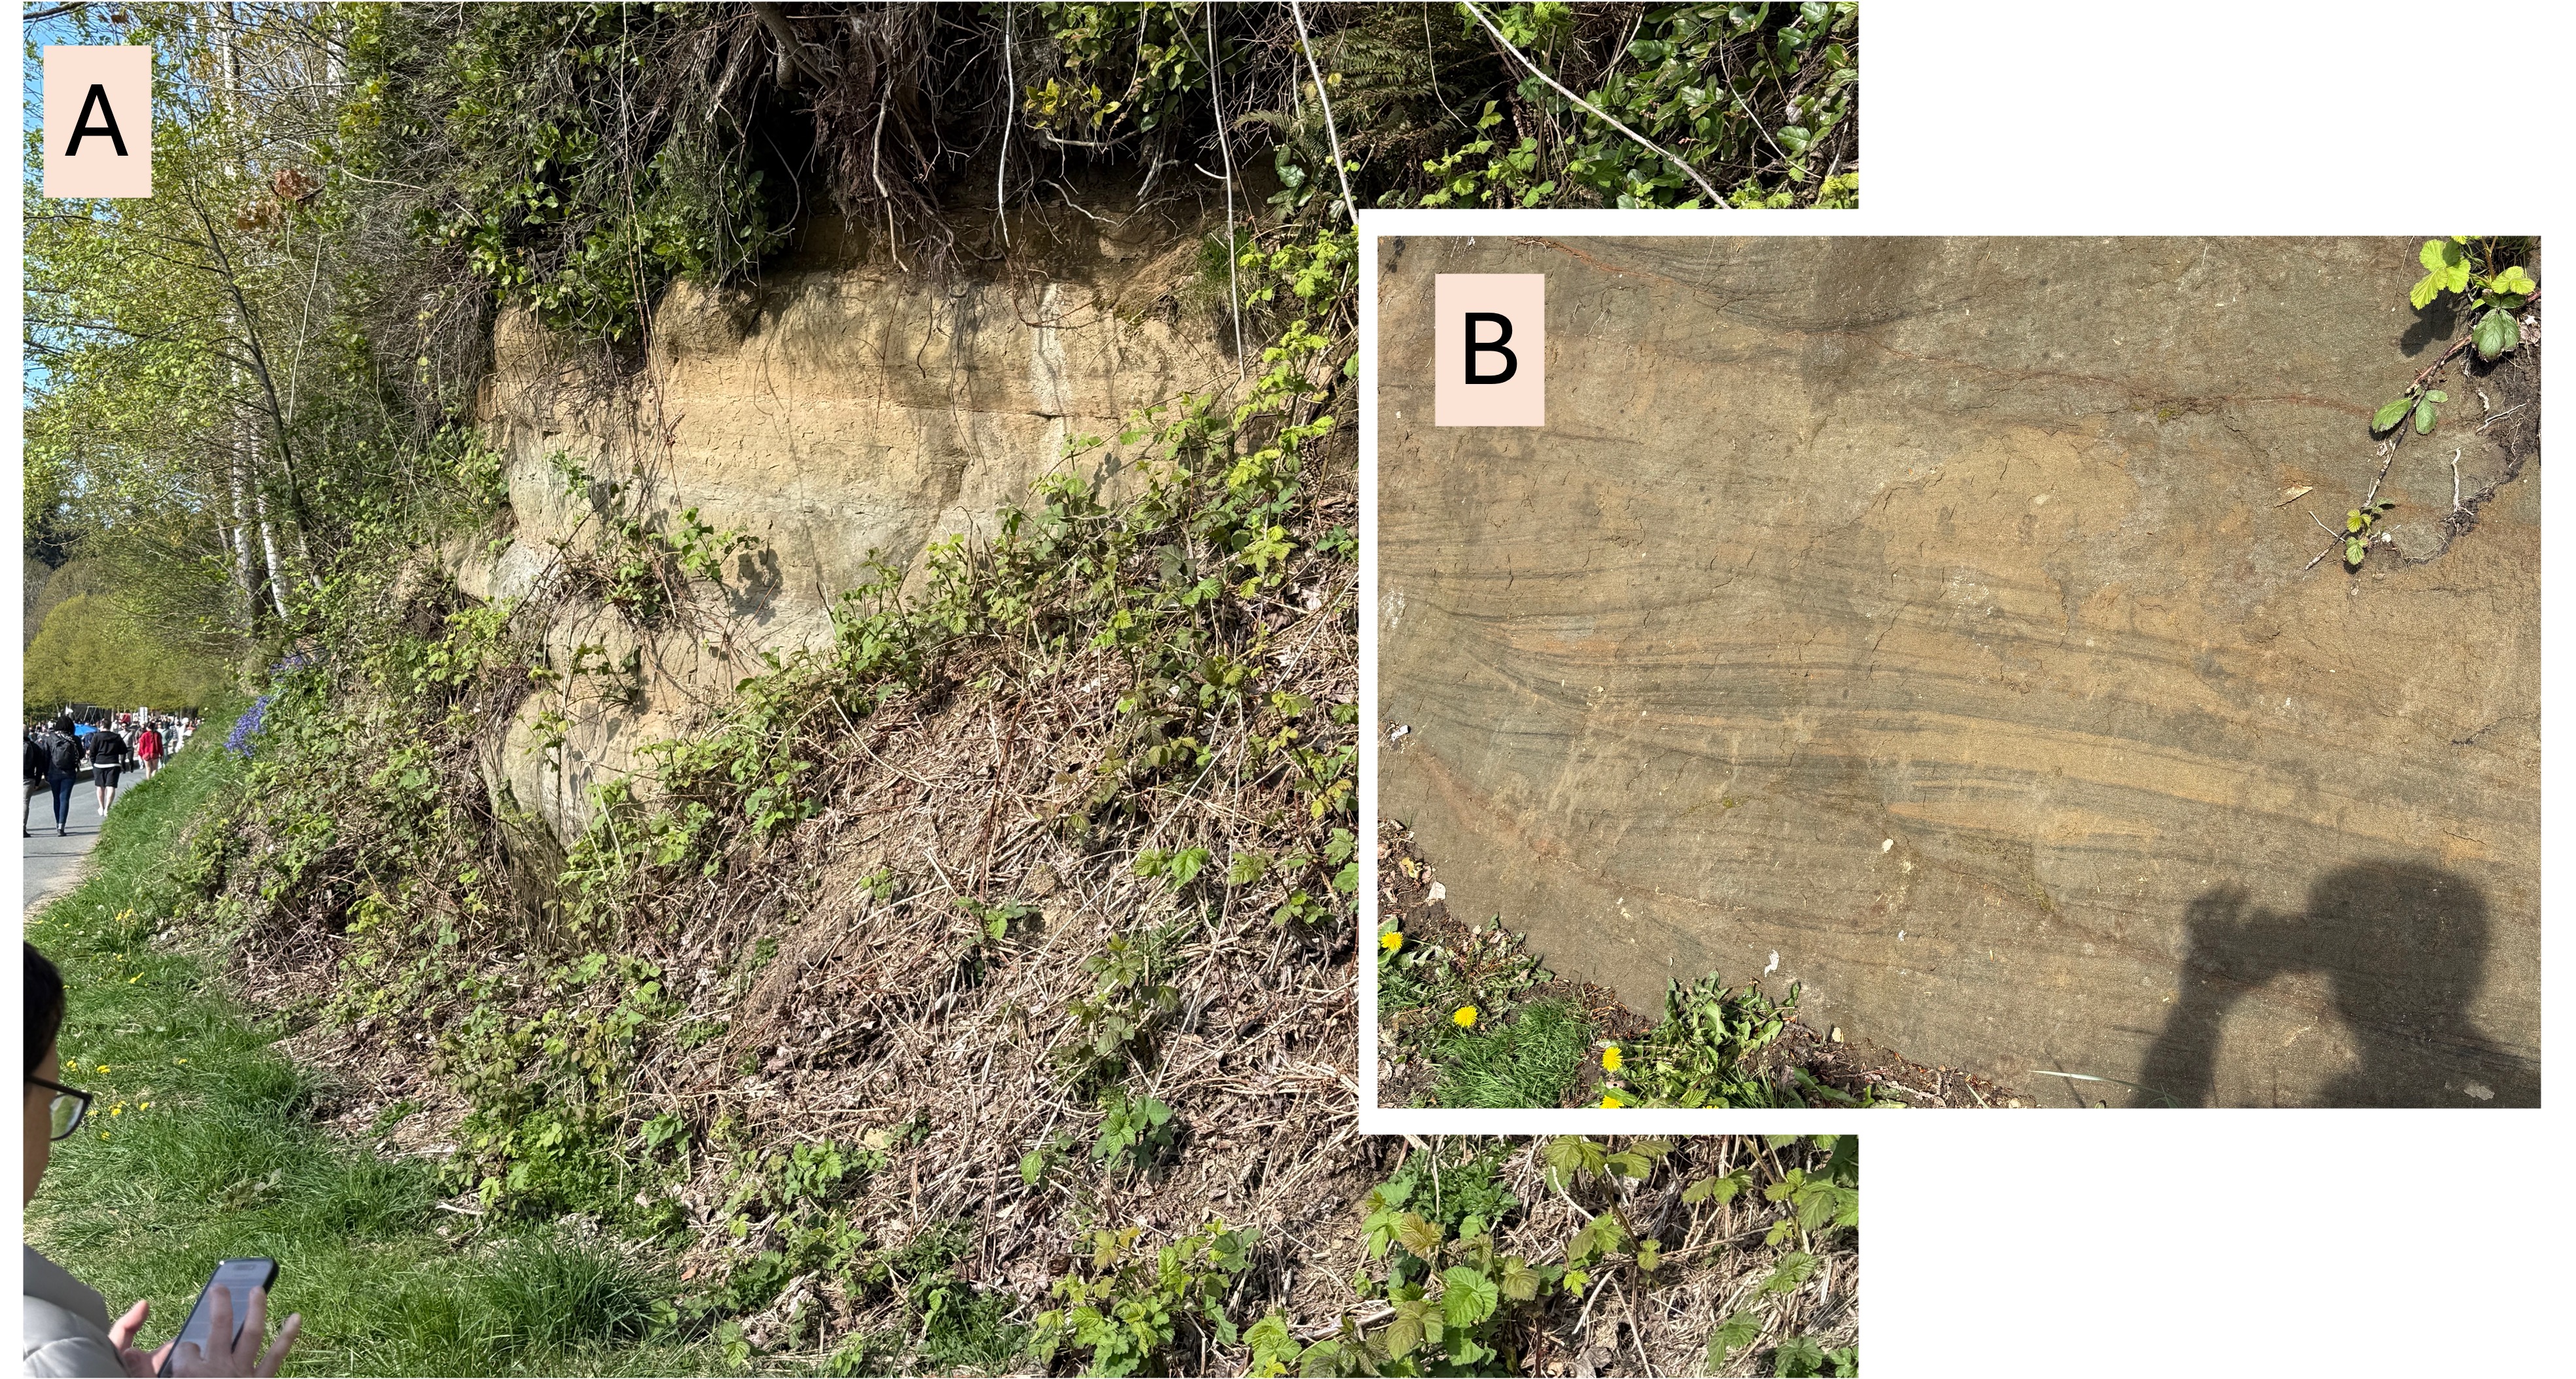
Figure 2. (A) Exposure of Late Cretaceous (100-66 Ma) sedimentary rocks at Stanley Park (bottom center of Fig. 1B). These rocks look unconsolidated, but they are actually well cemented. (B) Close-up showing lamination and sets of unidirectional cross-bedding, which indicates transport in a stream rather than a marine environment. Transport was generally to the left, but each set of cross-beds is a slice through a three-dimensional form like the bars seen in modern rivers.
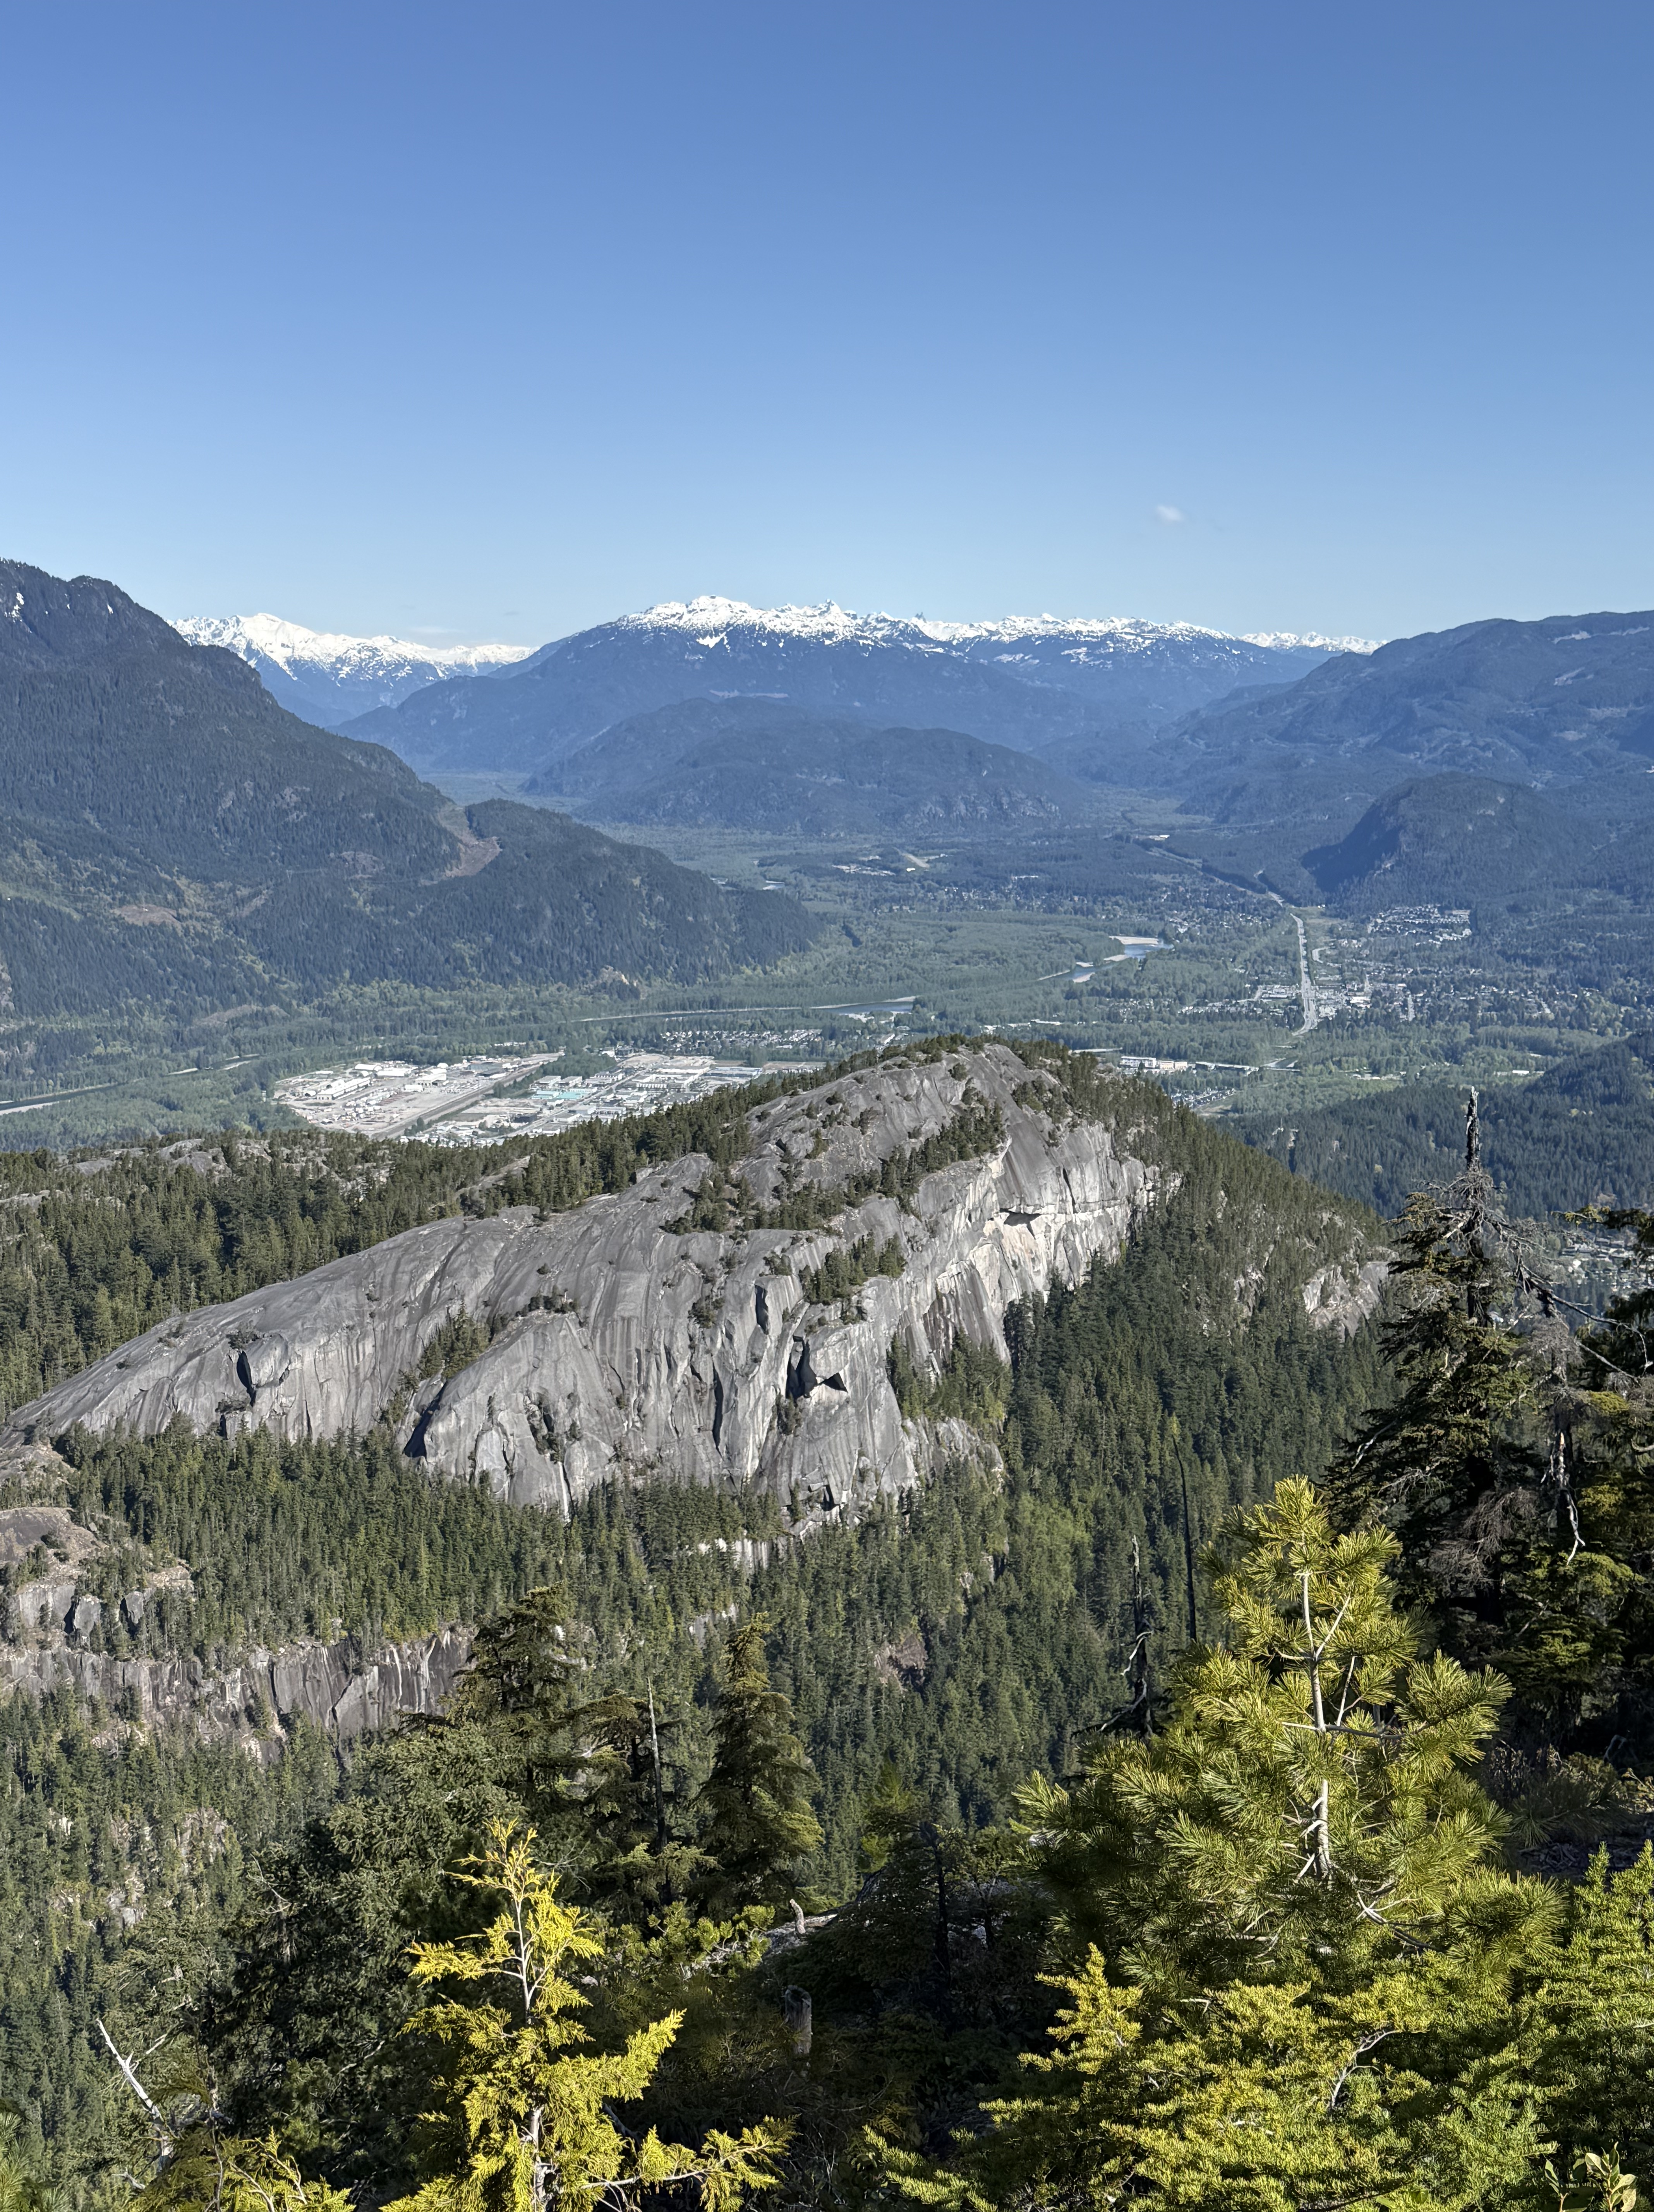
Figure 3. View looking northward from Squamish and Chief Viewpoint park (circled in Fig. 1C). Besides offering a breathtaking view of the northern Rocky Mountains, this photo reveals several interesting geologic phenomena. The small peak in the foreground is solid diorite that was intruded between 143-66 Ma more than 20 km beneath the surface at that time. It has been uplifted as overlying rocks were removed by erosion. It may represent a single intrusive episode because typical plutons are 2-3 km in diameter; batholiths comprise multiple intrusions spanning millions, if not tens of millions, of years. Note the lineations running up the side. These reflect the scraping action of ice sheets during the last two million years as they flowed towards the sea. The valley in the background is the classic U-shape caused by the advance of glaciers. It has been filled in by glacial deposits very similar to those found in NW Washington. Glaciers in this area originated locally and were up to several kilometers in thickness. They flowed both towards the sea and inland to form a continental glacier.
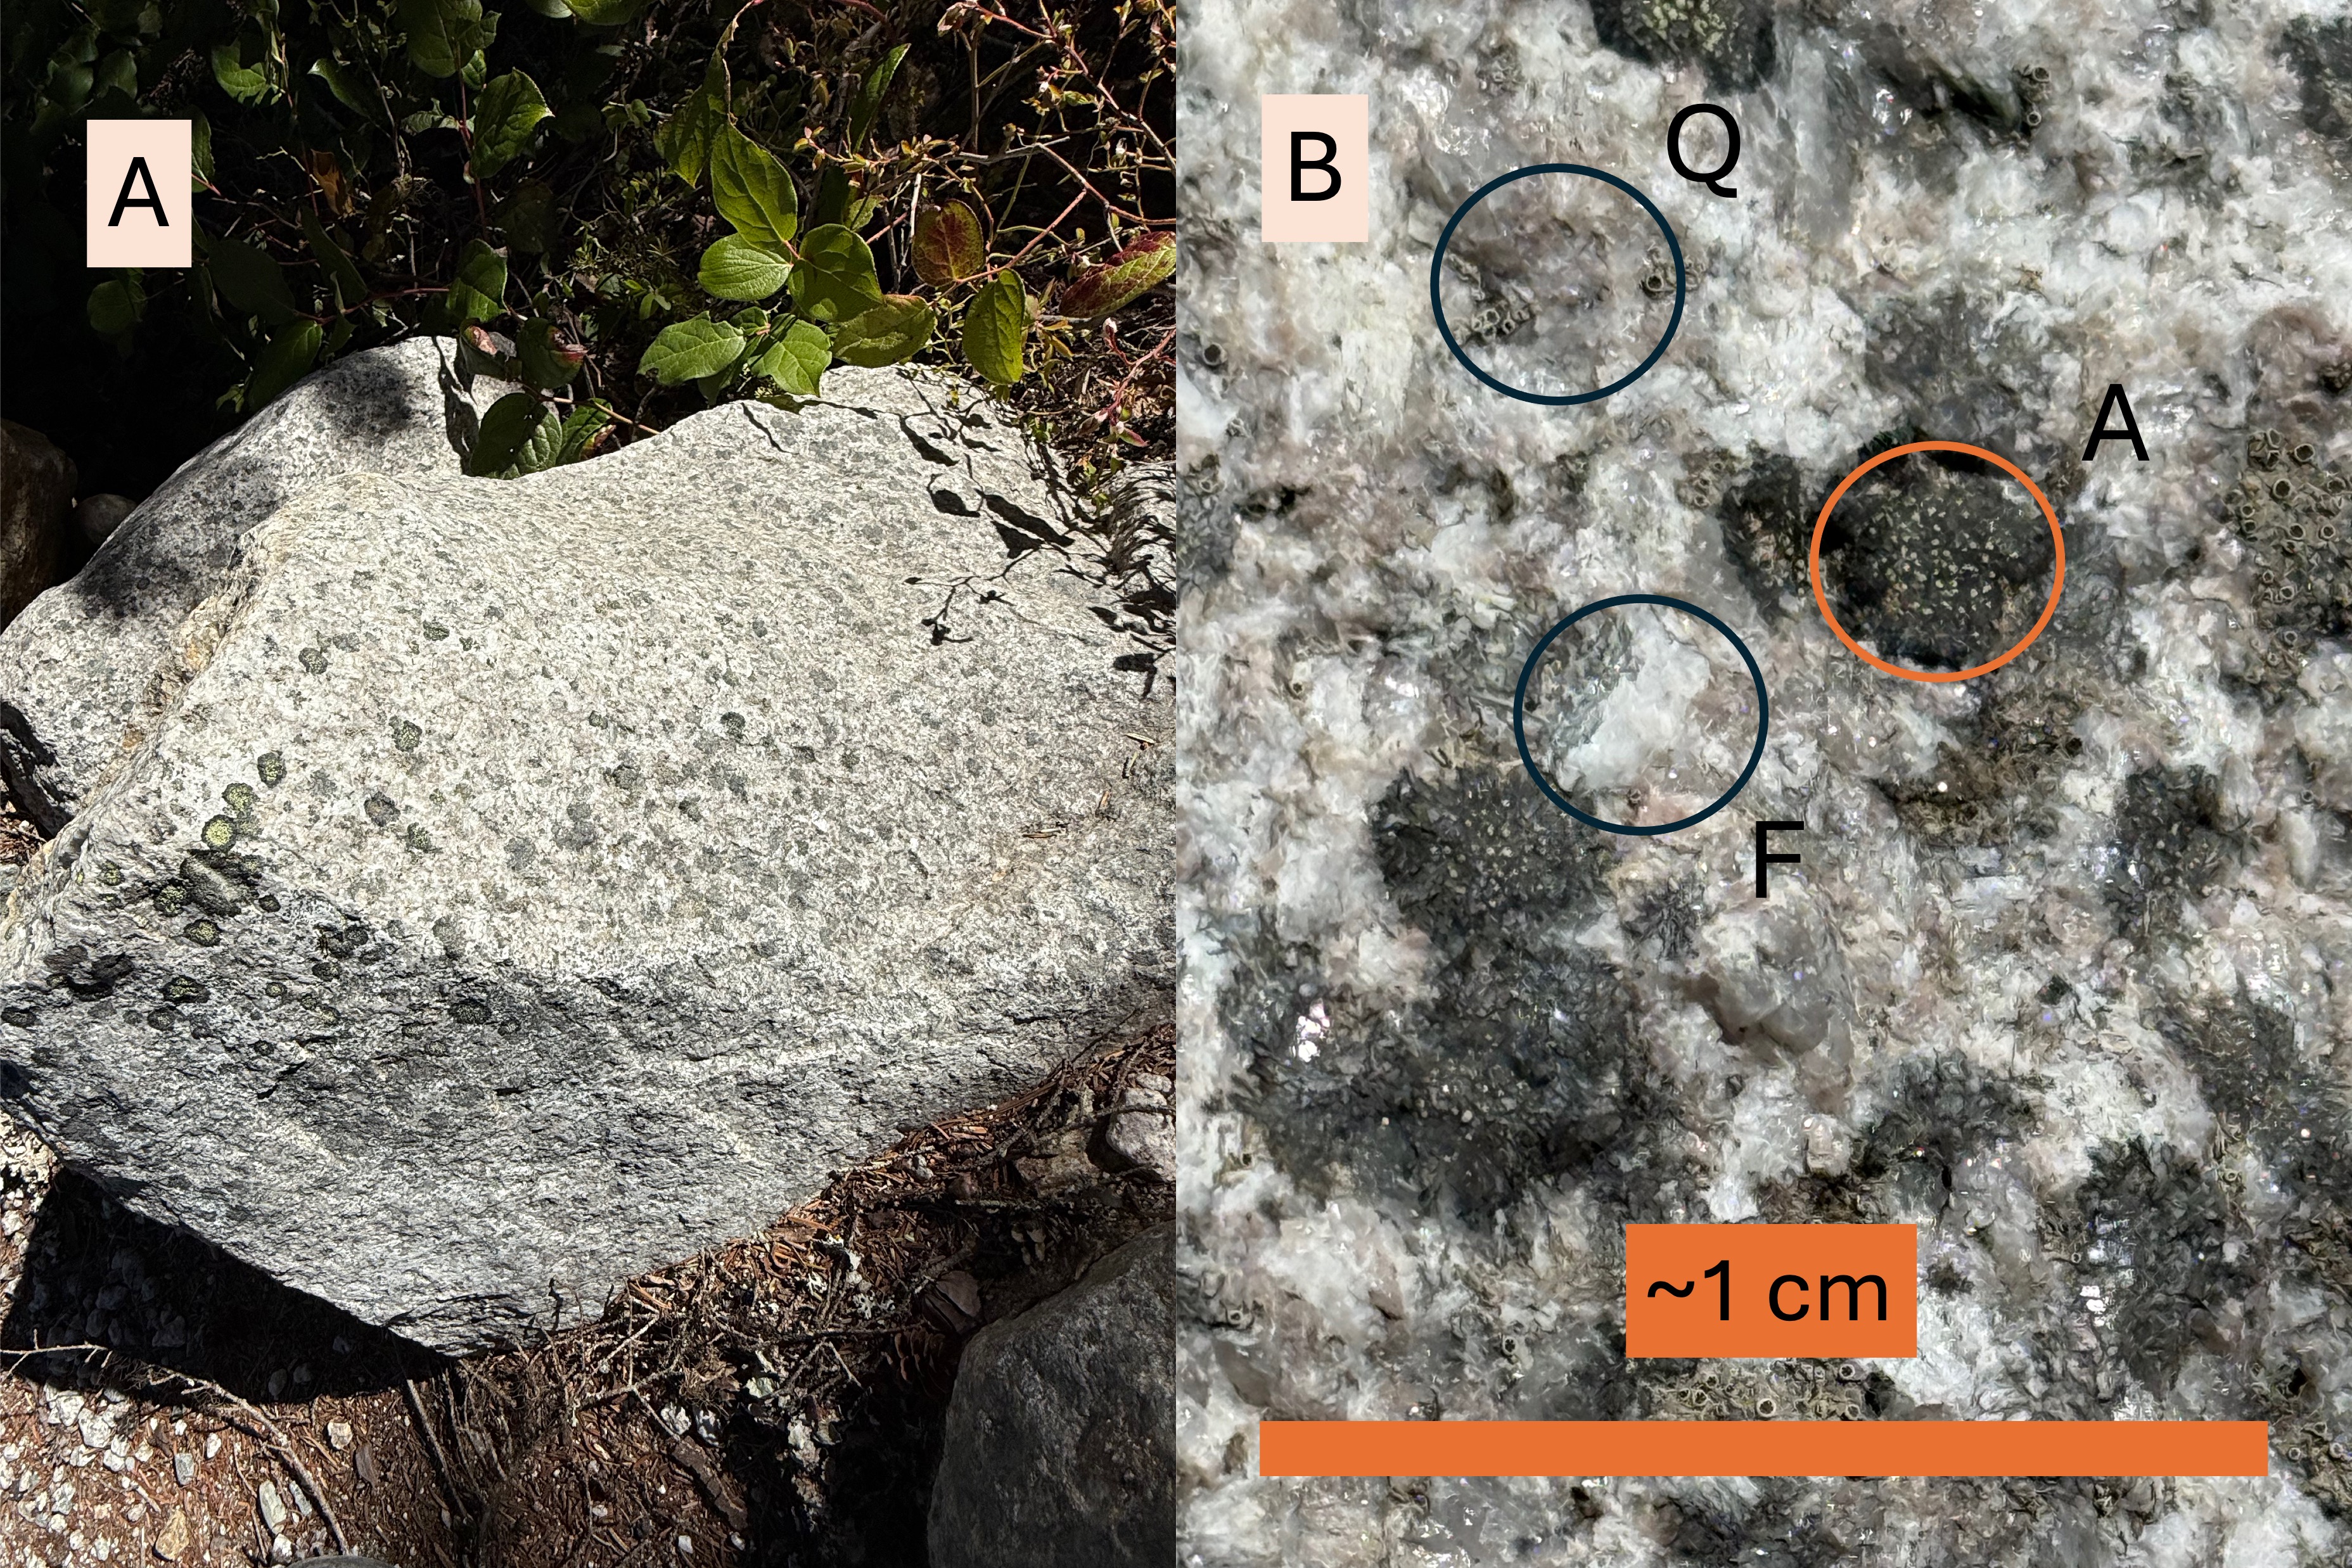
Figure 4. (A) The rocks within the park are fairly uniform in composition because they were intruded as part of a single pluton. This boulder shows the typical salt-and-pepper appearance of dioritic rocks. This sample is relatively fine grained, which indicates that it wasn’t emplaced more than a few tens of kilometers deep; i.e., smaller crystals indicate faster cooling which occurs nearer the surface. (B) Close-up at the highest optical magnification available on my phone, about 5X. RockD generally describes the igneous rocks from this area as granodiorite, a type of diorite that contains 20-60% quartz (labeled Q in the photo), and primarily feldspar (labeled F) that contains sodium and calcium with little potassium. The dark minerals are amphiboles (labeled A), probably hornblende. These are typical granitoid rocks from a subduction zone.
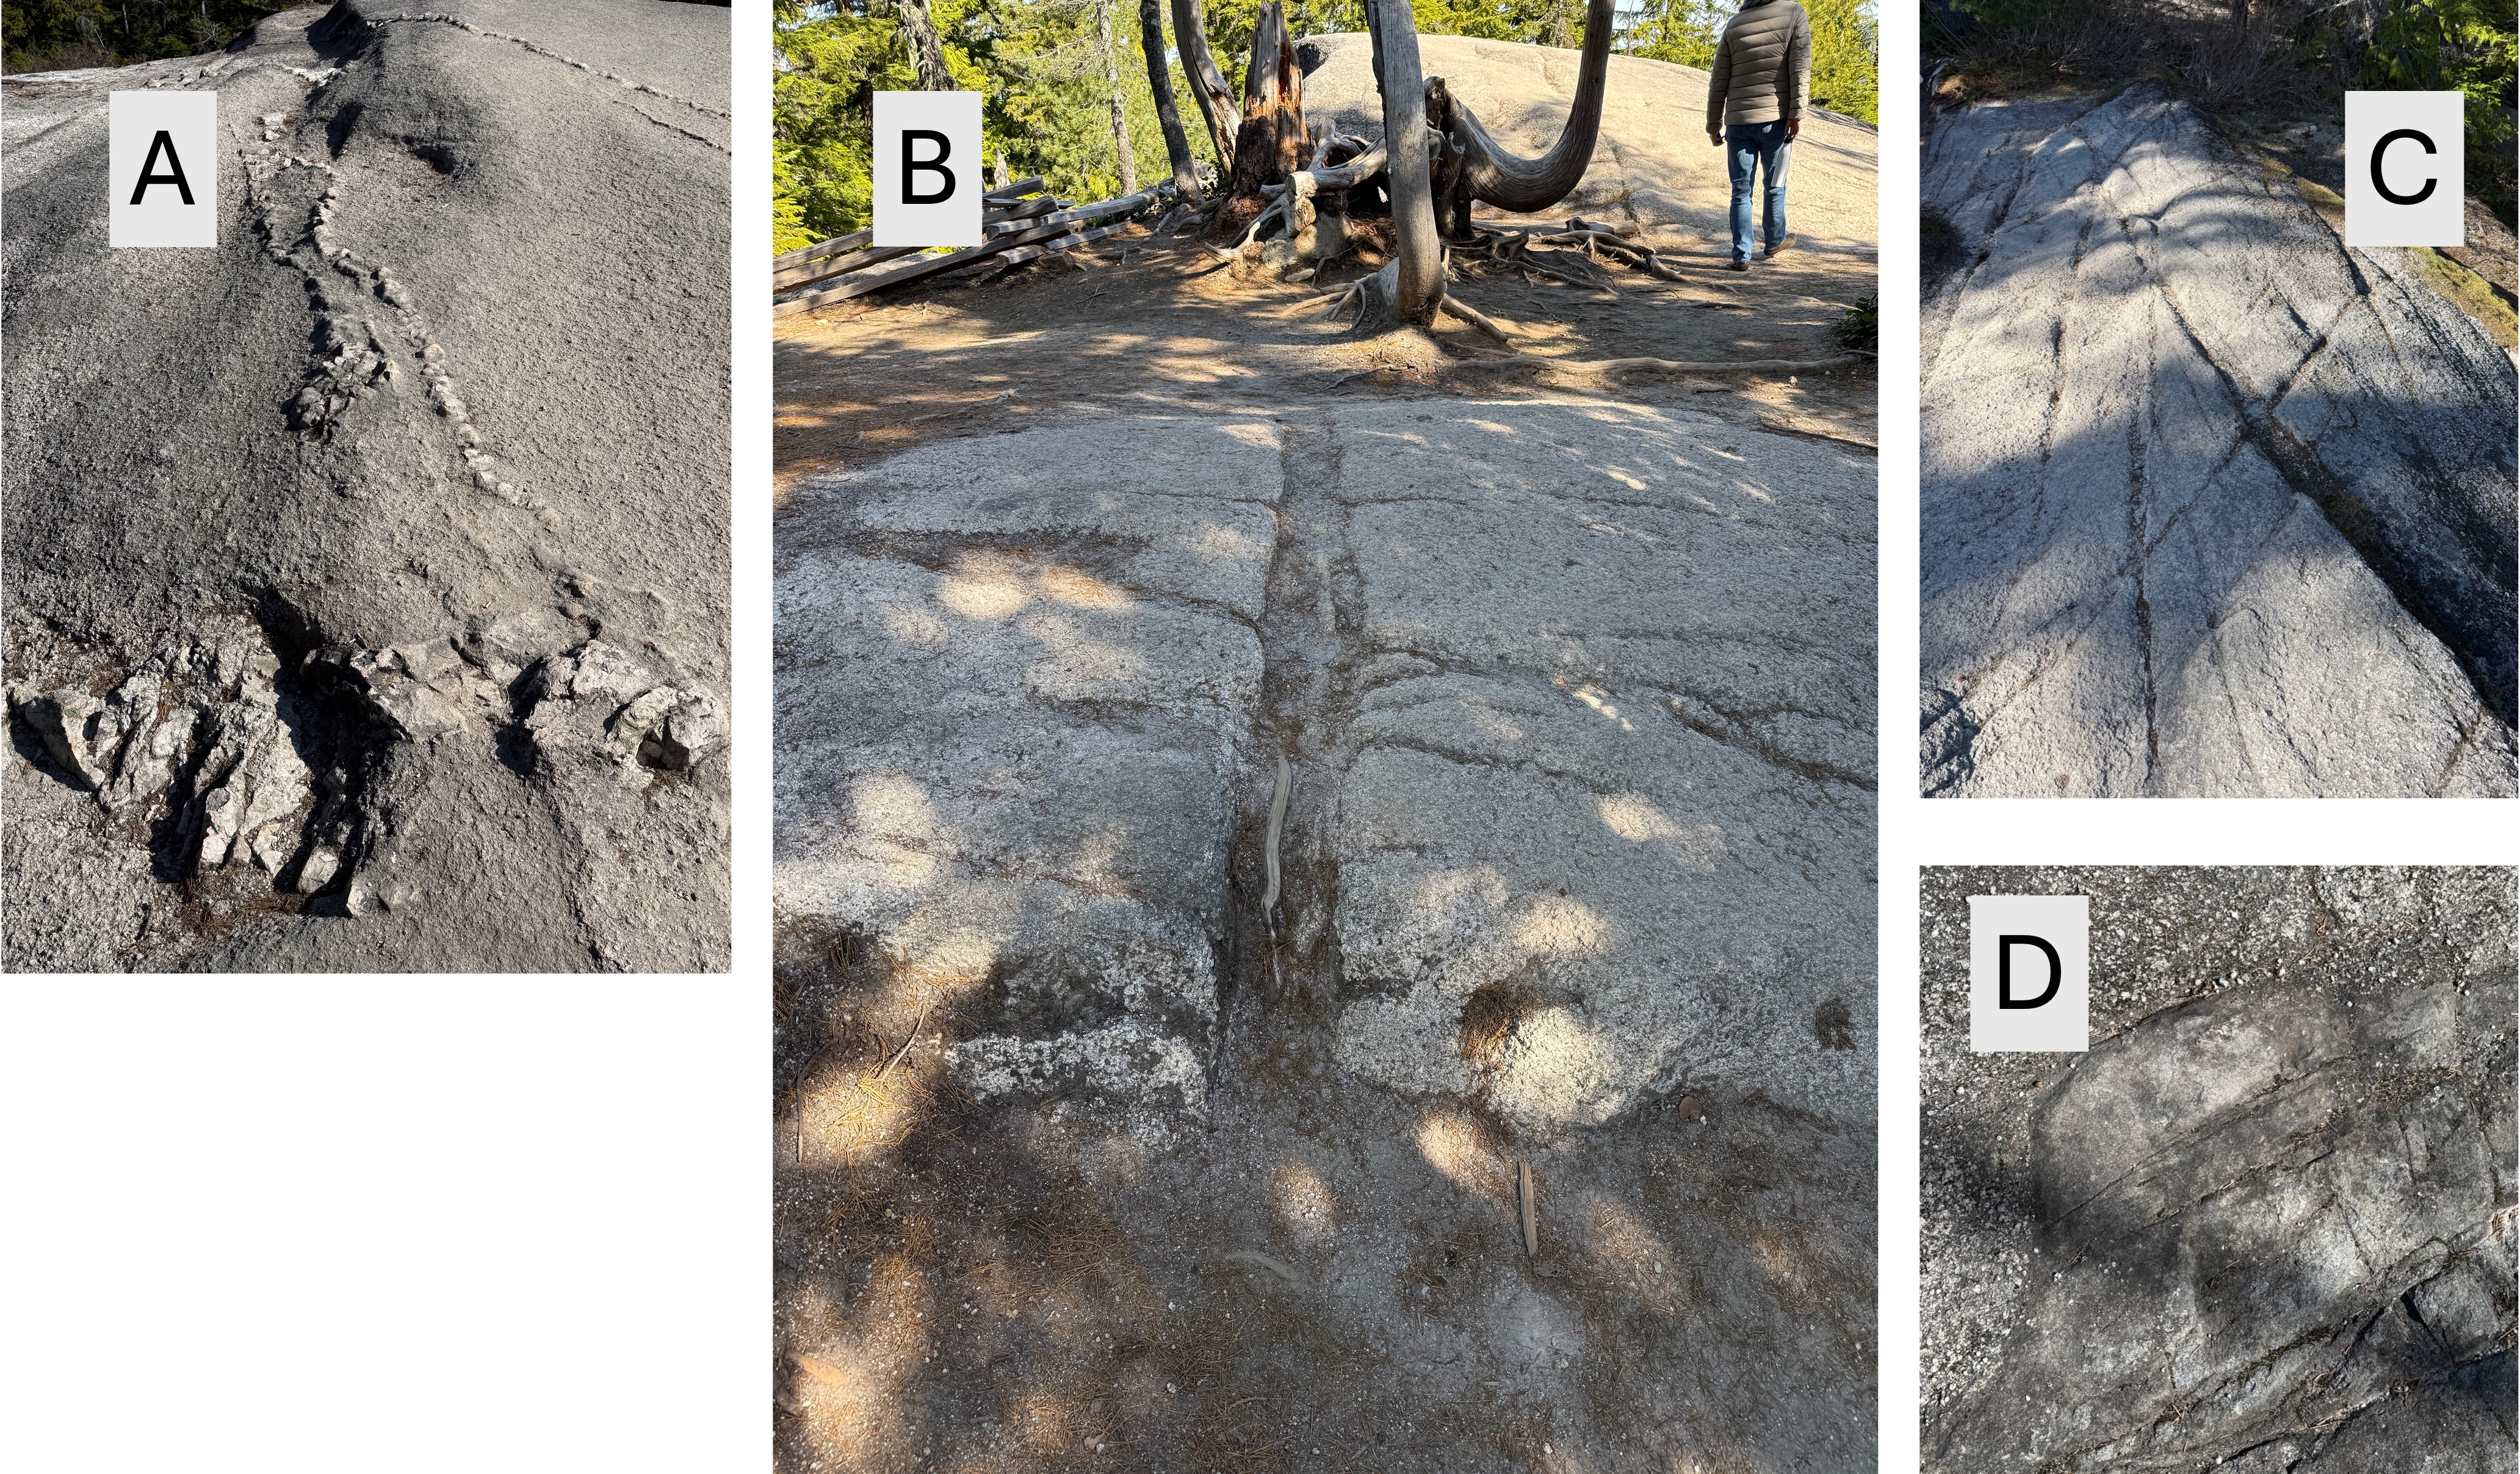
Figure 5. (A) Surface showing a vein filled with a harder mineral that is probably quartz. The softer feldspar and hornblende has weathered more easily and been removed by the scraping of ice sheets containing rocks. Note the irregular shape of the vein; minerals like quartz have the lowest temperature to solidify and fill cracks in the slowly cooling magma. (B) This vein is straighter than that in A and is filled with minerals that have weathered more than the main rock. (C) This photo shows joints (X pattern in the center of image) and lineations (top to bottom) that indicate ice moving over the surface with embedded rocks that scratch the exposed rock. (D) This image shows a finer grained material filling a void in the original magma. The pebbled appearance of the coarser material results from preferential weathering of minerals like hornblende and feldspar. These images imply that the magma had solidified sufficiently to form joints as it cooled, but was then injected with more fluid. This isn’t surprising in a region where so many plutons were being created; there was certainly a lot of overlap in their intrusion.
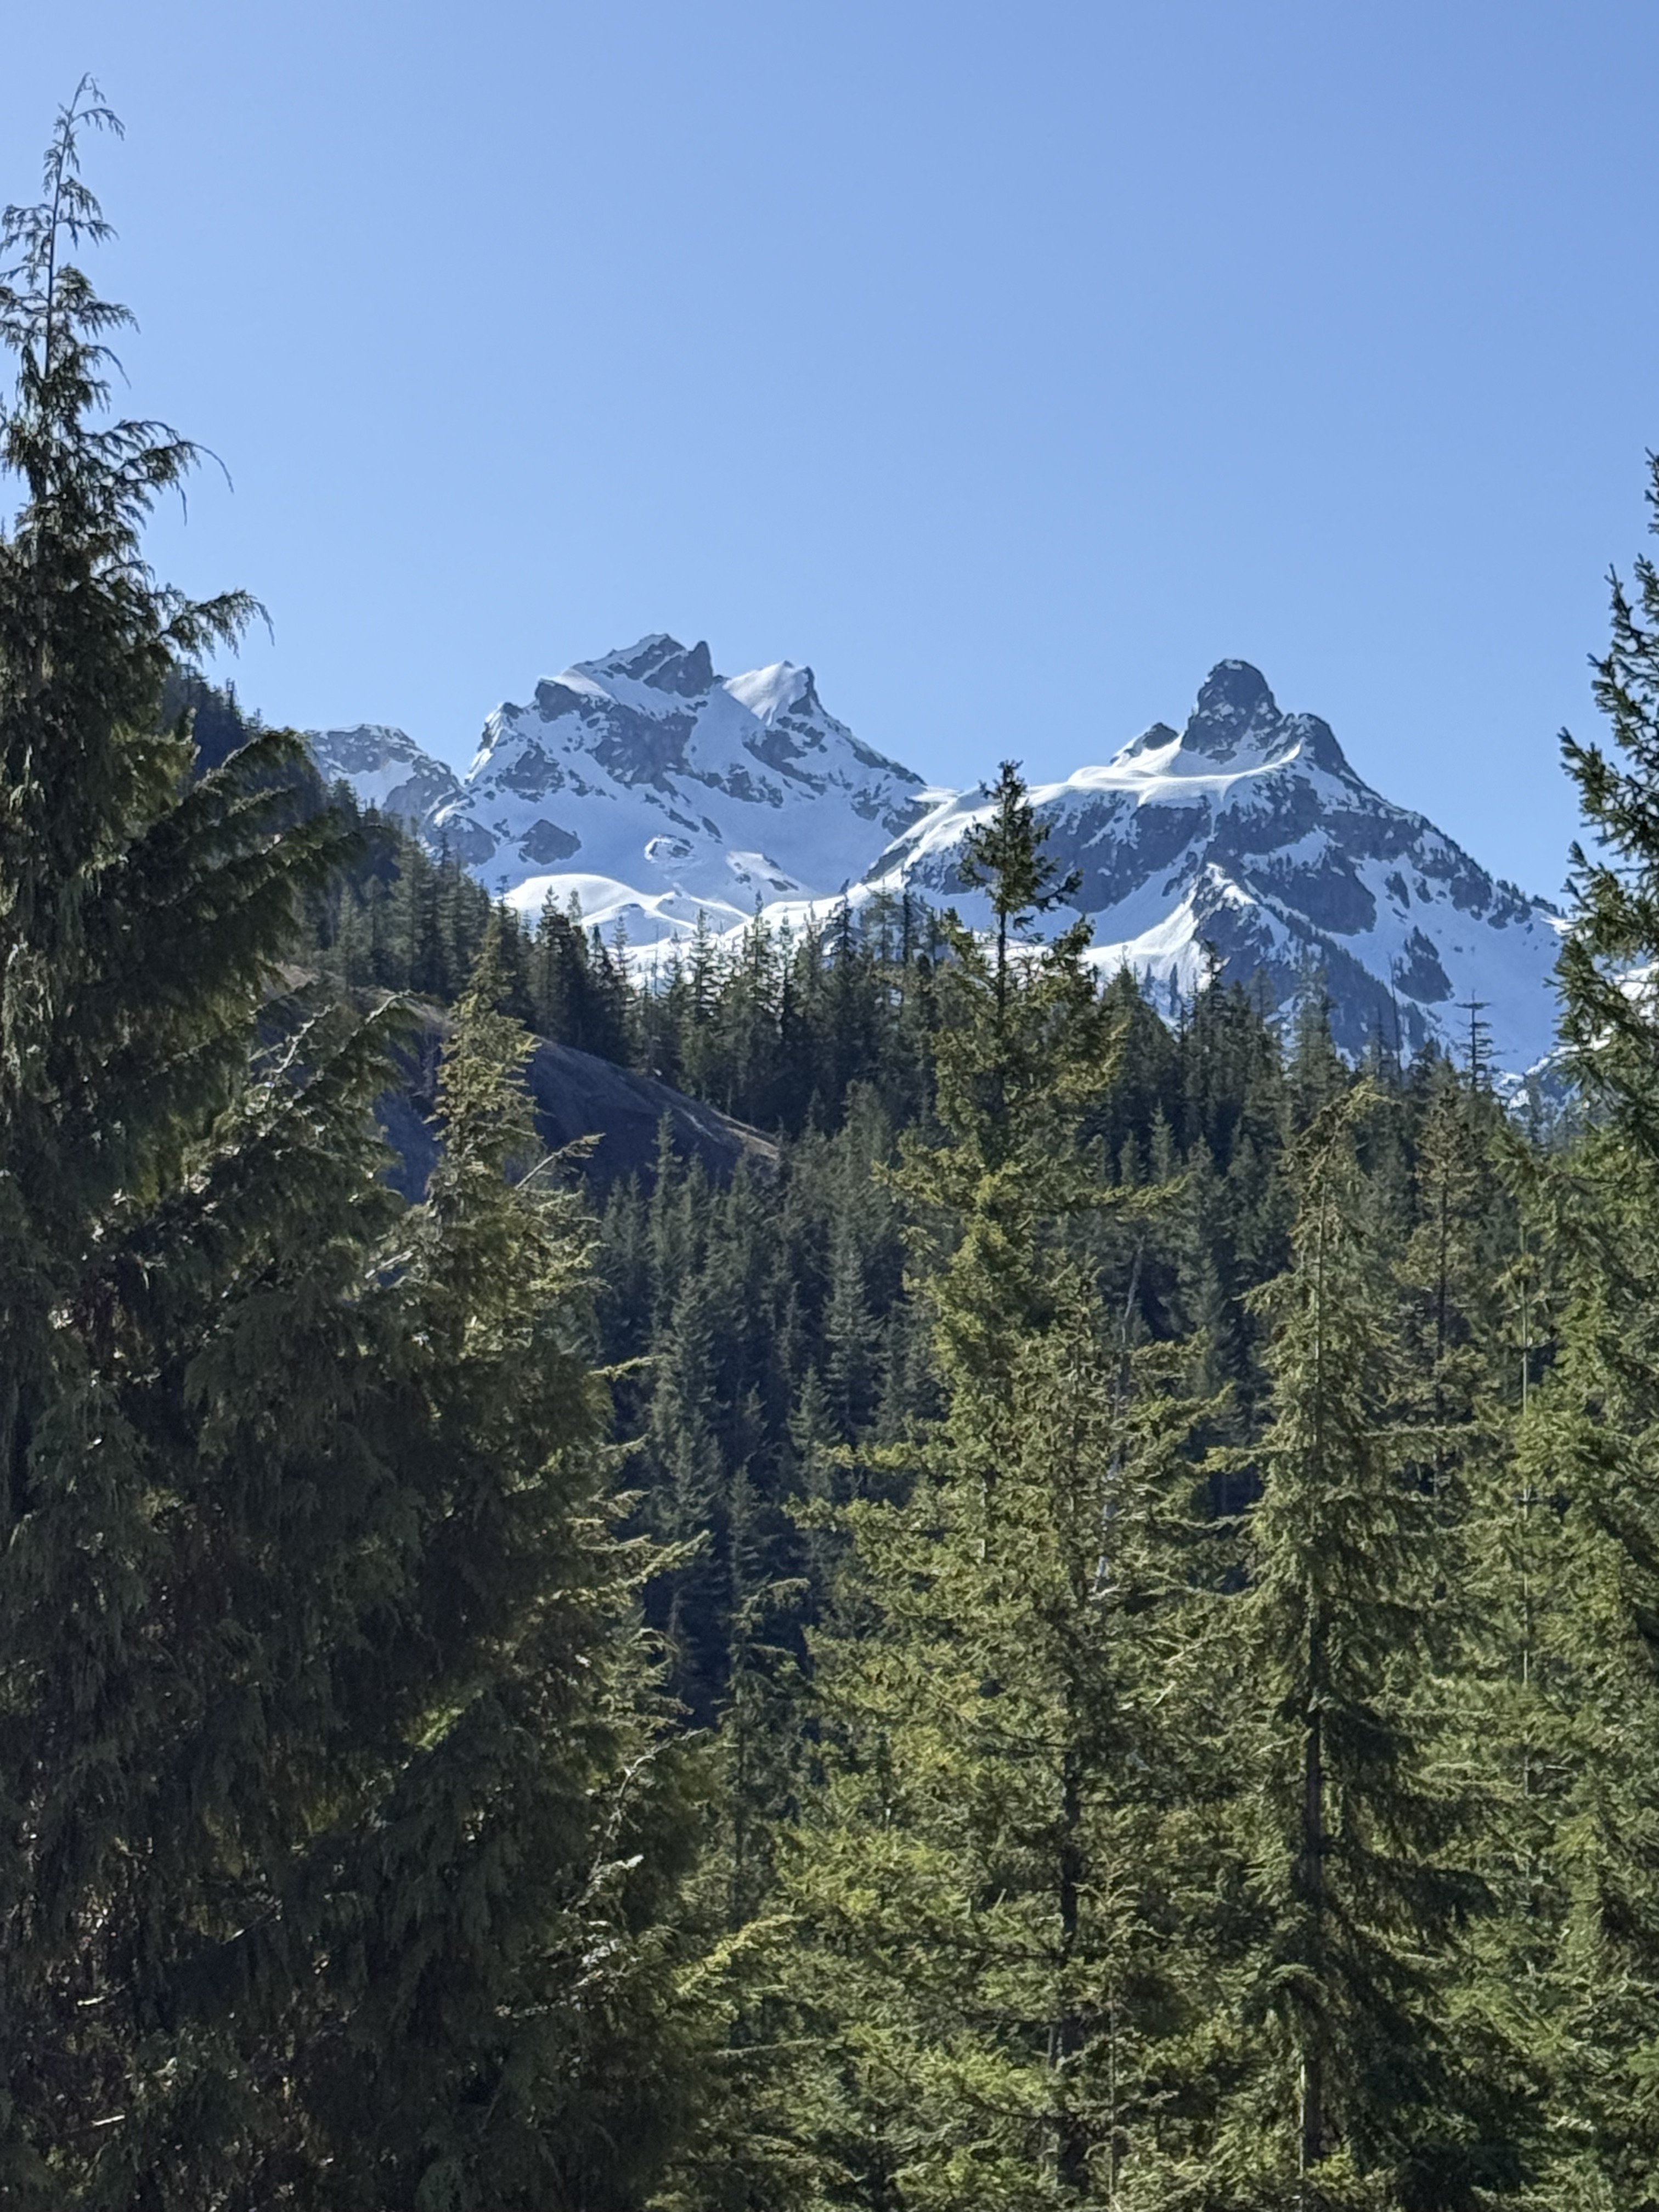
Figure 6. This final photo shows two pointed peaks that result from ice cutting away at any rock that protruded above the main surface. Remember that the ice was up to three kilometers thick here whereas the peaks are less than two km above sea level. It is hard to imagine that much ice.
SUMMARY
This post describes only a small part of one pluton of the hundreds exposed within the Northern Rocky Mountains in British Columbia. The scale is difficult to visualize, but they represent only a tiny fraction of the immense volume of oceanic crust that was subducted beneath the nascent west coast of N. America during the Cretaceous period. Nevertheless, what we’ve documented shows that this was a continuous process that lasted almost 70 million years. And it is continuing to this day, as evidenced by volcanism within the Cascades Range of Washington, Oregon, and N. California.
Deep igneous intrusion doesn’t necessarily create volcanoes, however; surface eruptions occur when magma is emplaced at shallow depths, which was probably not the case for these rocks from the Cretaceous. We can’t know for sure because so much rock has been removed by wind, water, and glaciers during the uplift of these intrusive rocks, from tens of kilometers beneath the surface.
Even if our picture of the earth’s history in the Pacific Northwest is incomplete and mysterious, it is awe inspiring to look back in time and deep within the crust.
And it isn’t science fiction…
Mount St Helens After Forty-Five Years
Introduction
I was a geology student at Arizona State University in May, 1980, when Mount St. Helens made the headlines. It is the largest volcanic eruption in North America, and when one-cubic-mile of mountain collapsed, it became, and remains, the largest landslide in human history. I followed the progress of geological investigation into the eruption with interest as I pursued my education, but progress was slow. It isn’t easy to reconstruct an event that occurred in a few minutes. The area was too dangerous to approach for more than a year because of gas explosions from within the pile of debris, which reached 600 feet in thickness.
Mount St. Helens faded from memory for decades, eventually becoming just another geologic event in a long chain of cataclysms covering billions of years. I never thought about it until I found myself living less than 100 miles from ground zero. I had to check it out. This post is a brief summary of what I found when I visited Mount St. Helens National Volcanic Monument. I hope I can convey some of the excitement I felt at stepping on ground that was literally on fire less than fifty years ago.
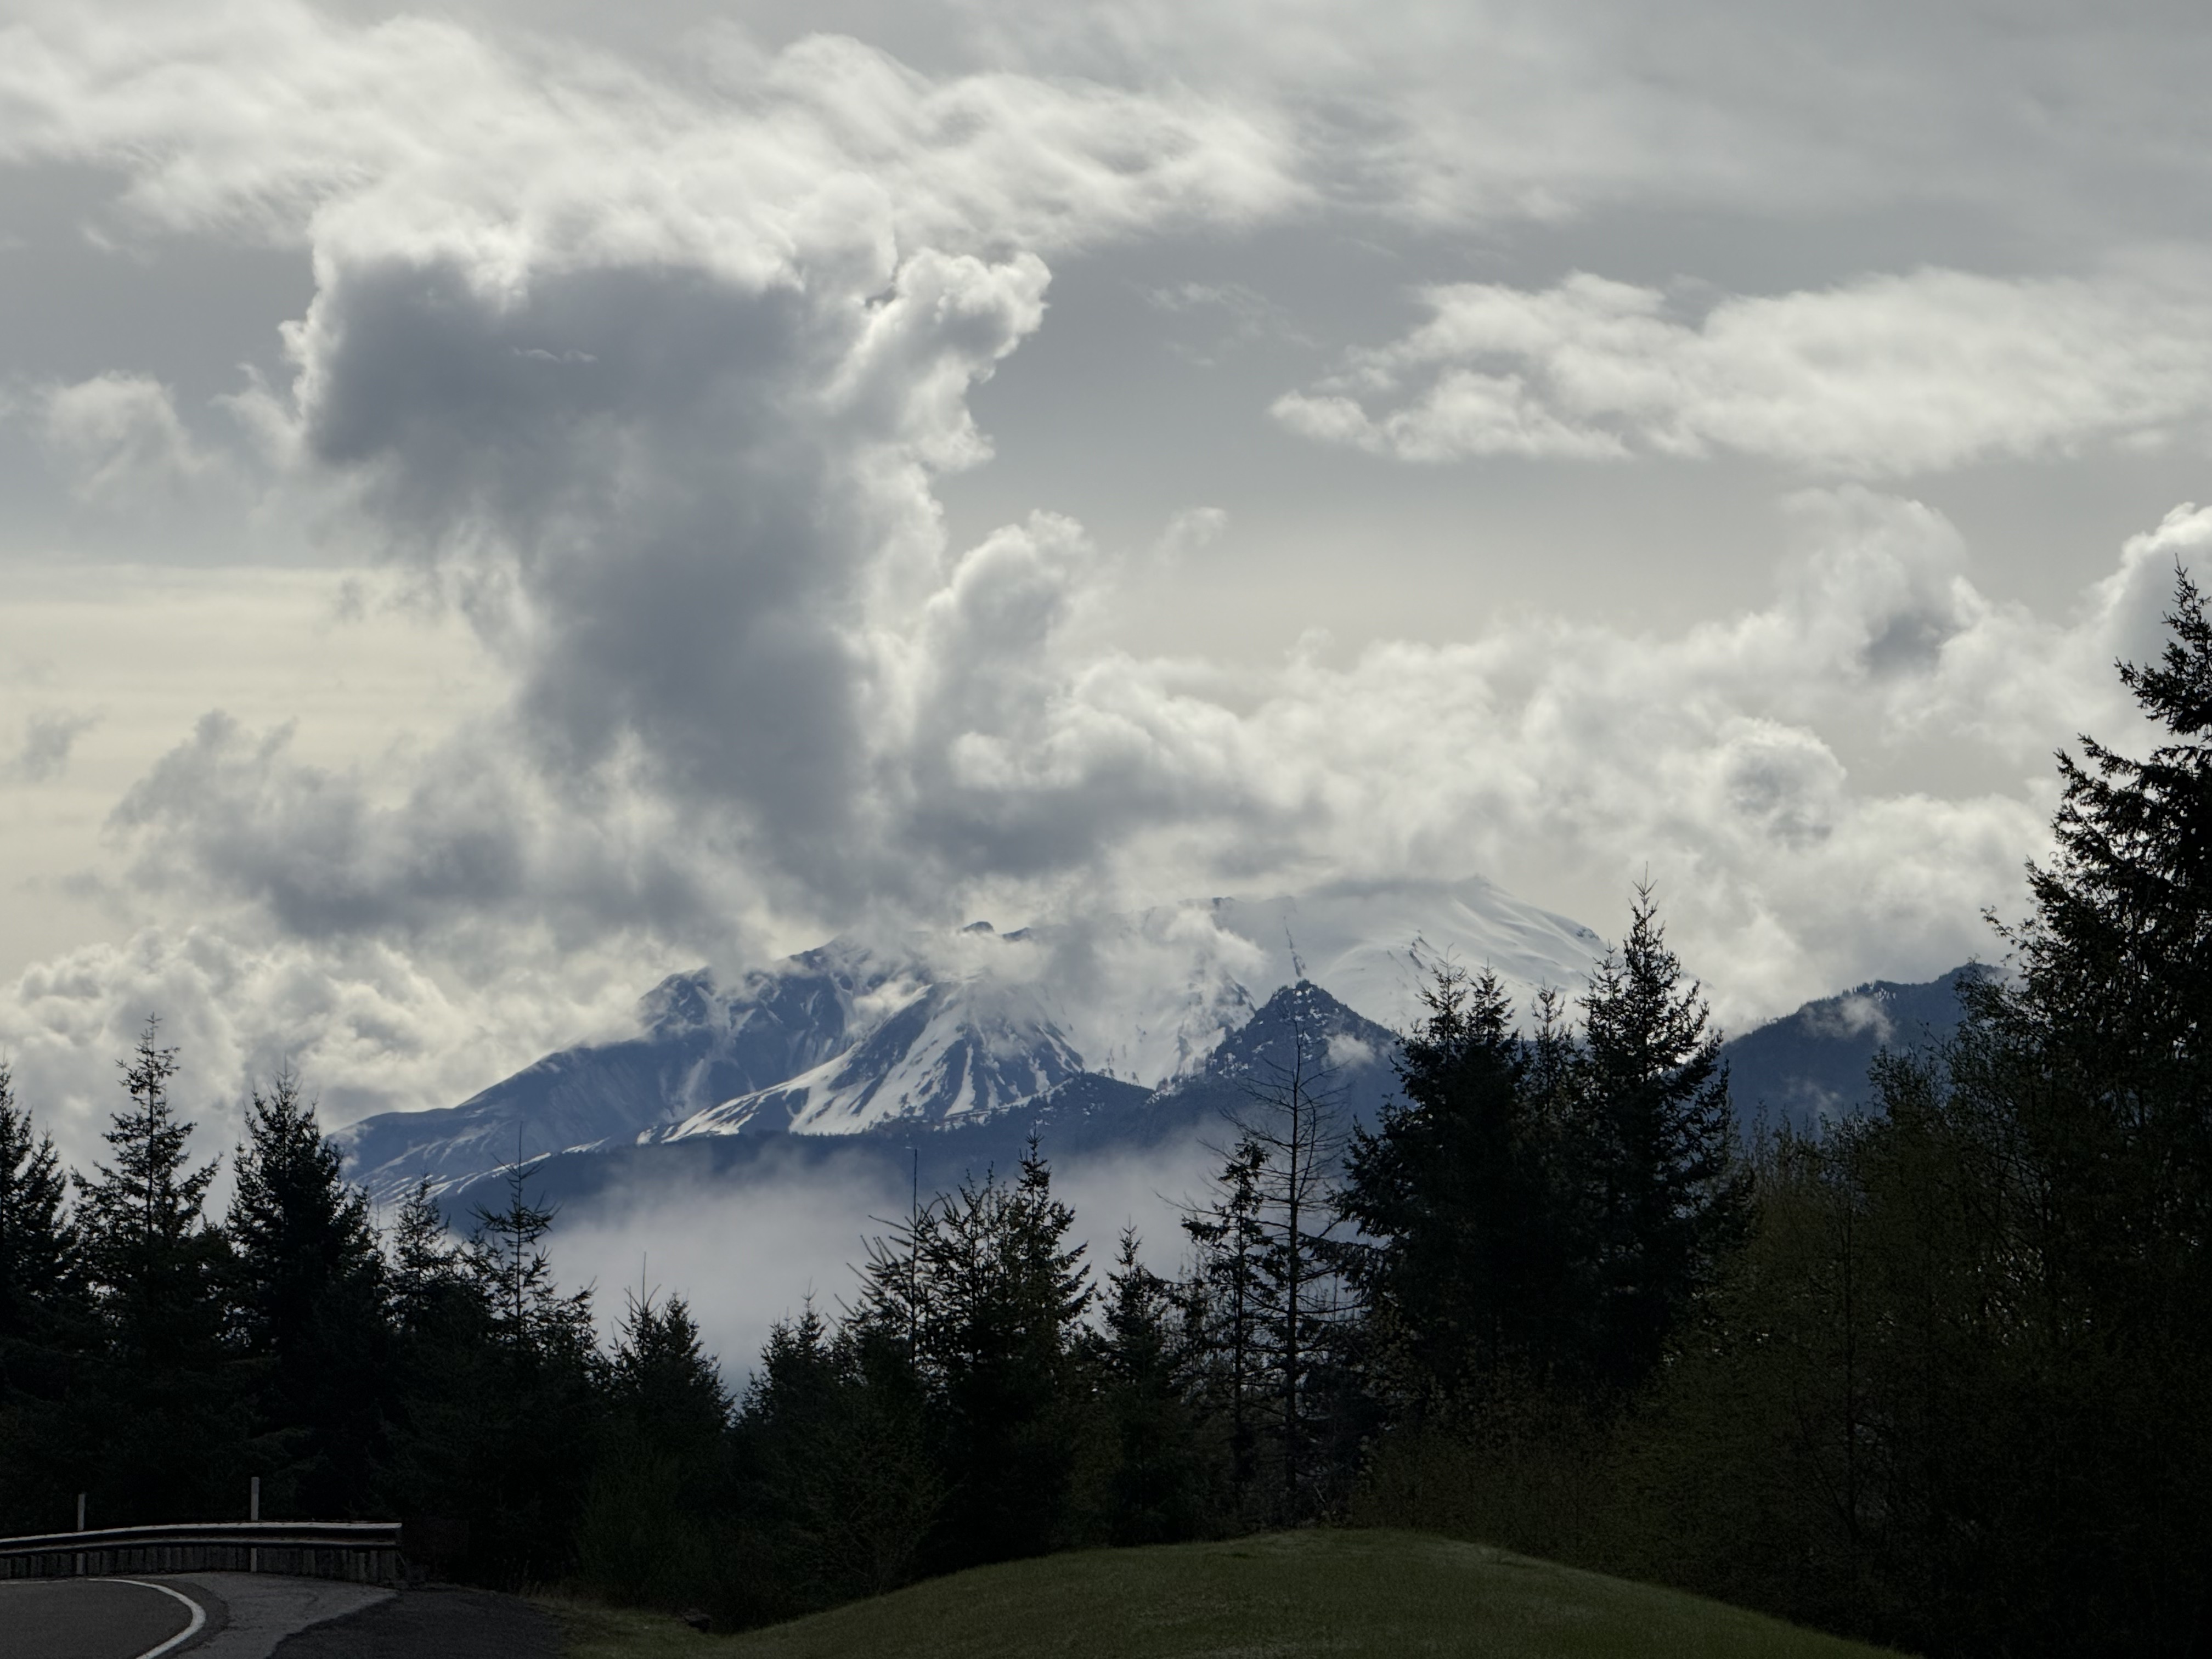
Figure 1. I arrived at about 10:30 in the morning and got this image before low clouds settled in, accompanied by fog later in the day. The characteristic volcanic cone is missing; the top of the mountain slants slightly upward to the right in the center of this image. That isn’t a lake in front of St. Helens, just fog collecting in the valley that feeds the Toutle River.
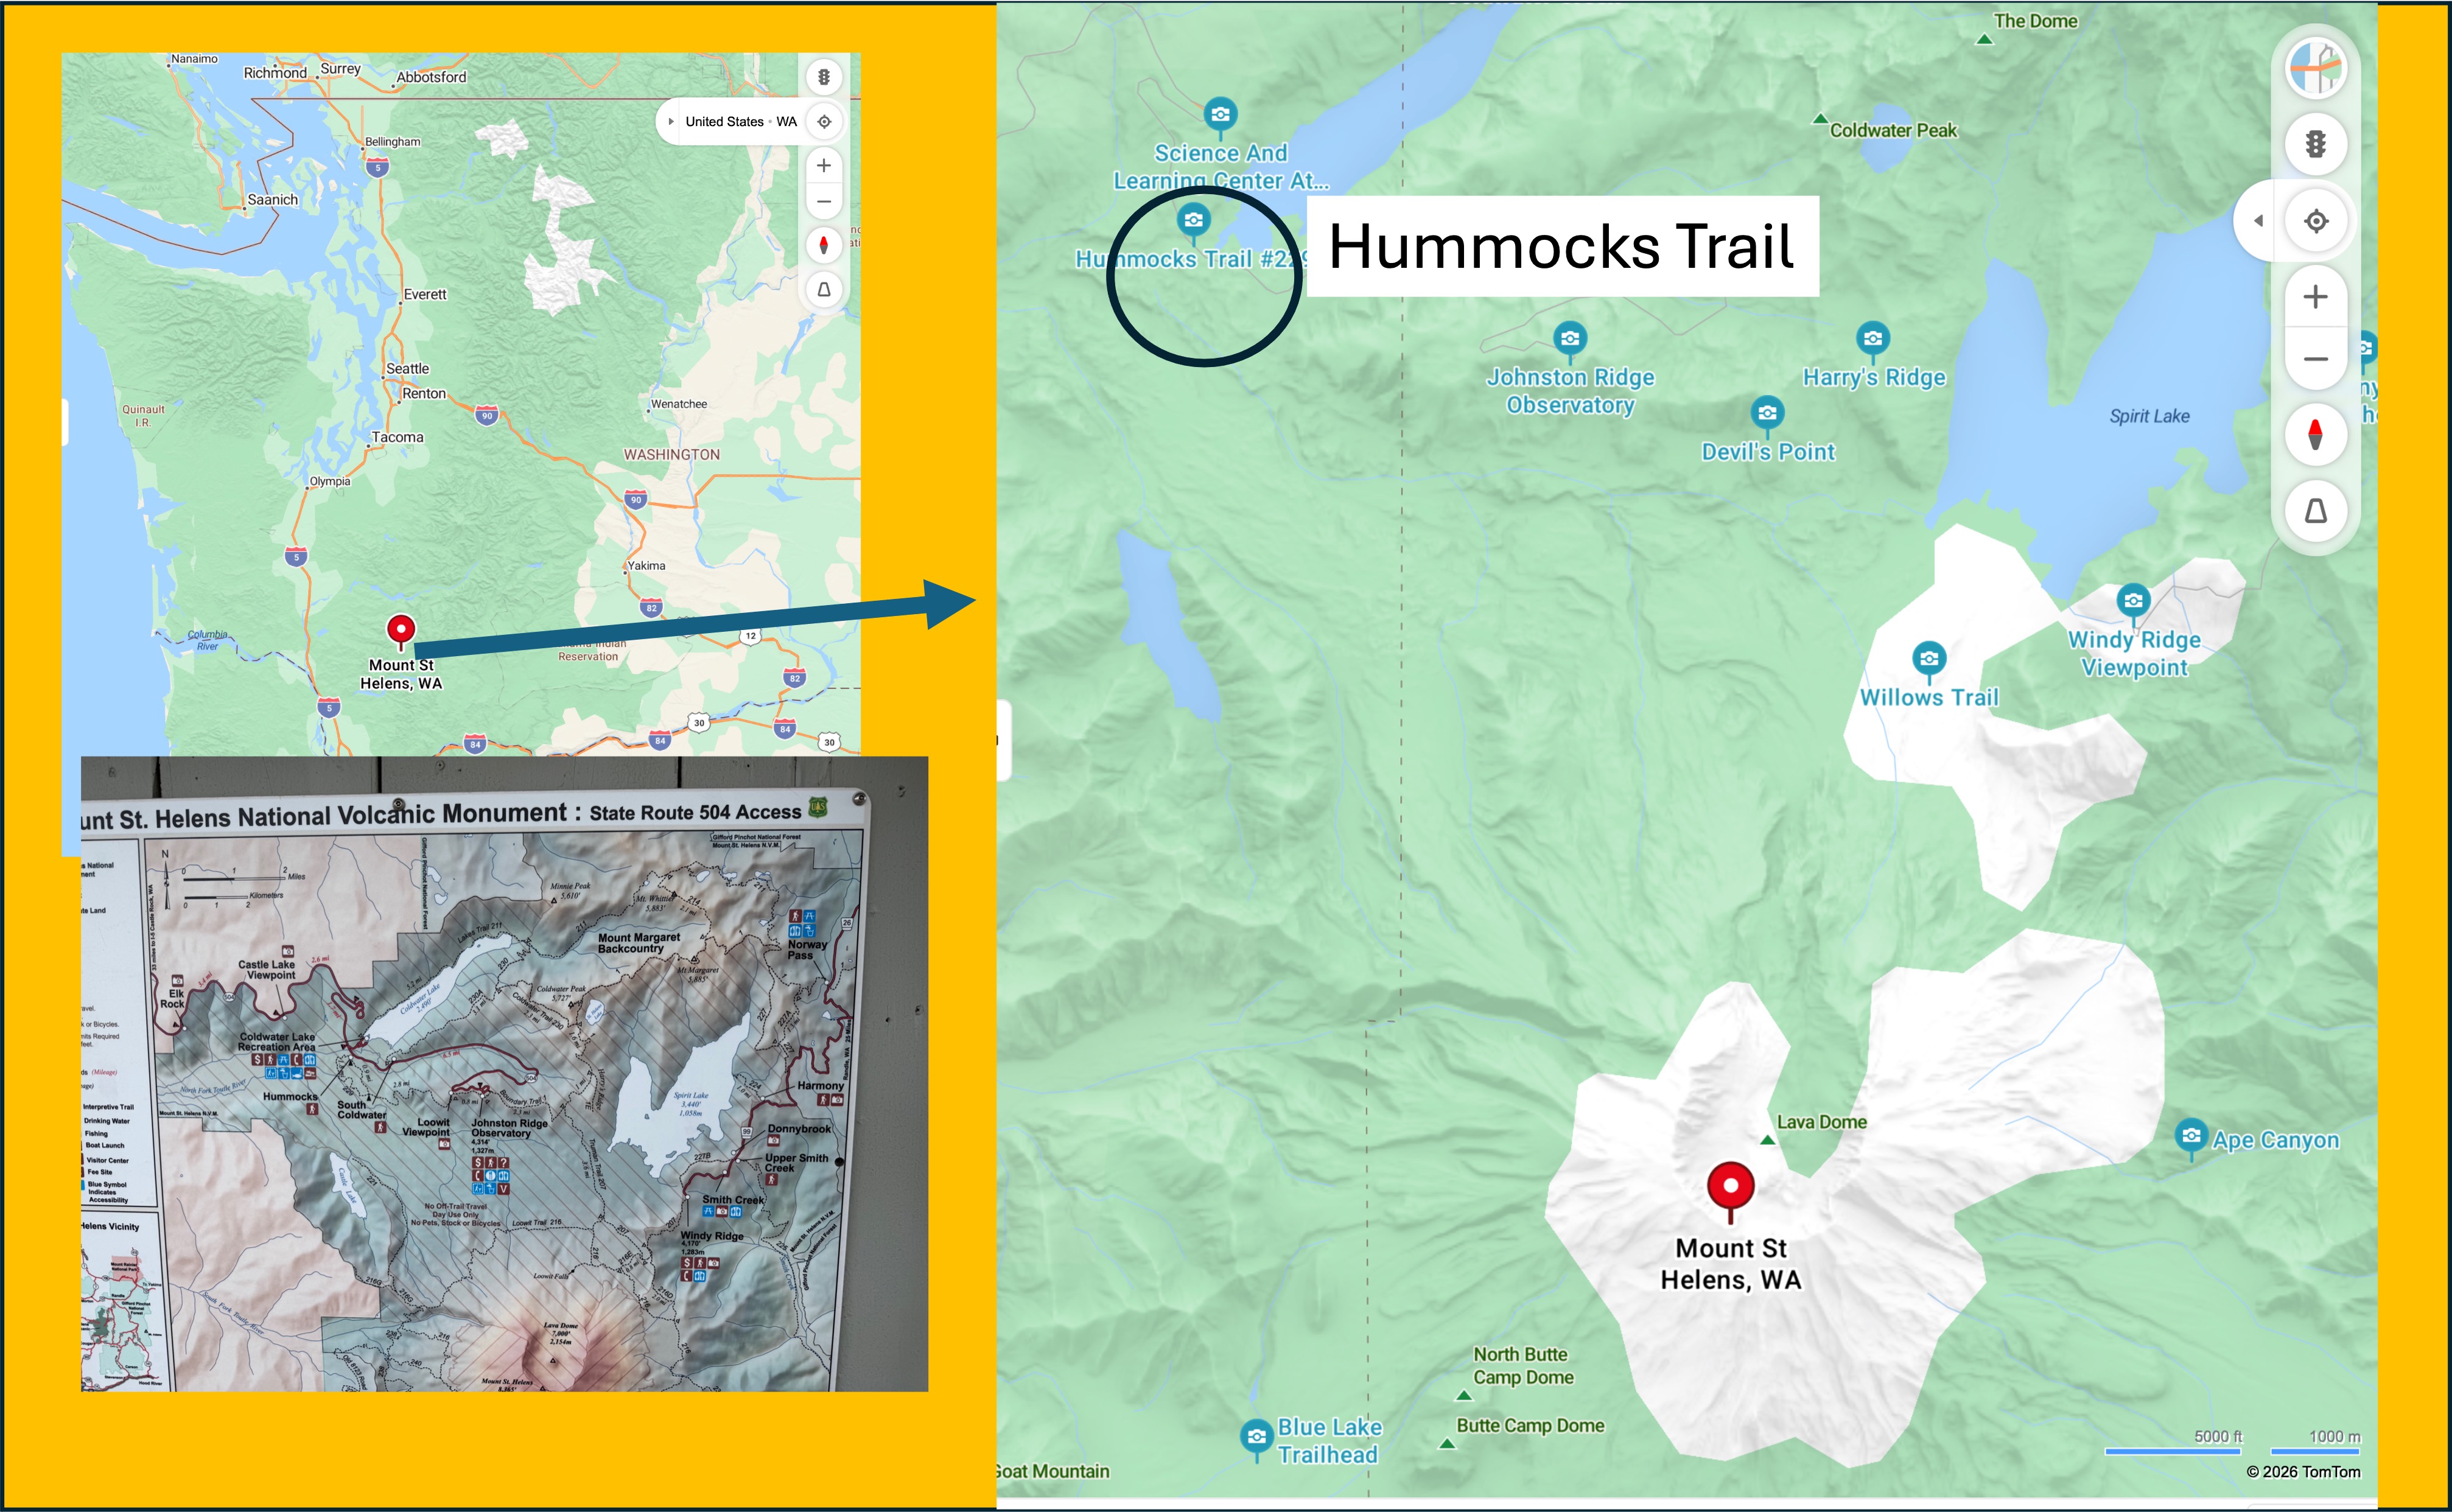
Figure 2. Mount St. Helens is about 2.5 hours from Tacoma. The closest you can drive is Hummocks Trail, but a four-mile hike will take you to the rim of the caldera. Maybe another time.
Older Volcaniclastic Rocks
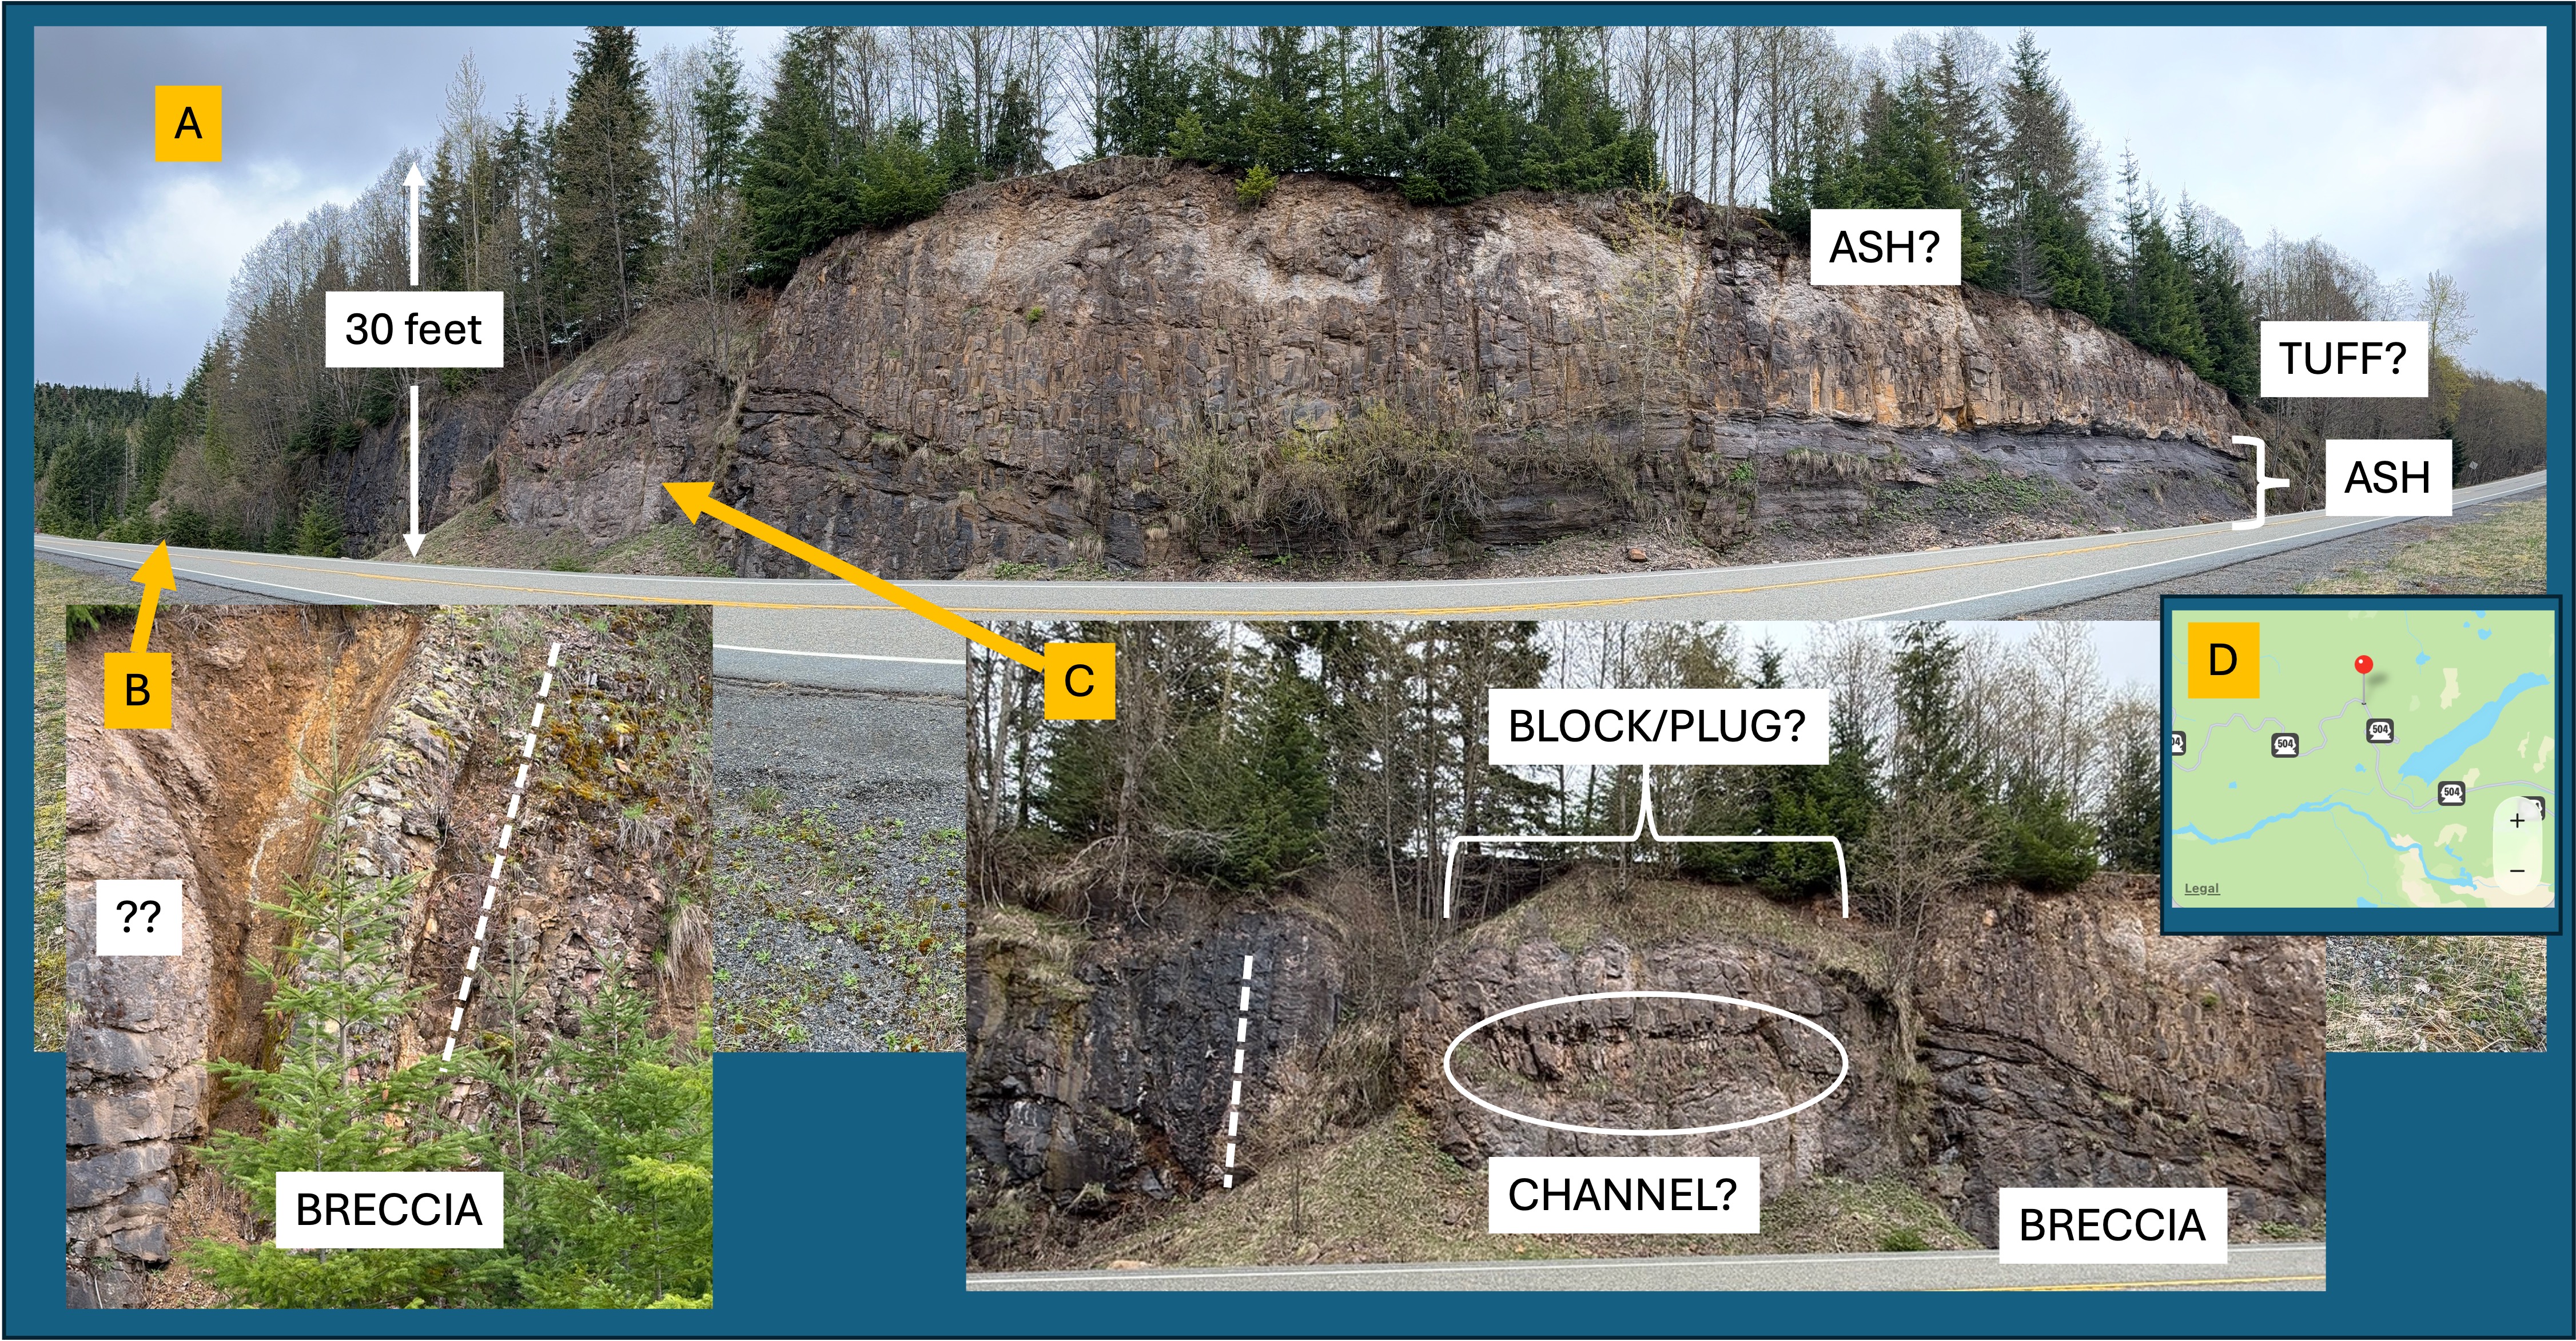
Figure 3. Mount St. Helens is less than forty-thousand years old, but it is constructed on a thick sequence (~2 miles thick) of volcanic rocks as old as 300-thousand years. Beneath these Pleistocene volcaniclastic rocks mixed rocks of uncertain age that comprise “bed rock” in this area; however, these igneous and sedimentary rocks are much older–spanning the Oligocene epoch (~34-23 Ma). I stopped to look at several road cuts along the new Highway 504 (the original is buried under debris).
A. Exposure of andesite volcanic rocks showing a complex eruption history, which includes ash layers and what looks like tuff (ash so hot it melted together to form a glass-like volcanic rock).
B. Close-up from the left side of (A) showing a layer of volcanic breccia that is now vertical. Individual clasts are visible but there is very little matrix. The dashed line indicates the approximate bedding plane of the layer. The rounded block labeled with ?? is about 12 feet in diameter. This is a puzzling structure. My guess is that there was a collapse of one or more volcaniclastic layers into a ravine after deposition. A jumble of material.
C. Photo of a complicated structure separating the left side of the exposure (tilted beds and blocks) from the right side (horizontal ash layers). The dash line is meant as a reference to the vertical beds in (B), but it was difficult to determine orientation. However, a clear change in texture suggests a depression, which may have been a conduit for volcanic material to erupt. The BLOCK/PLUG label reflects this interpretation. Within this “BLOCK” there is a discrete region of thin, irregular bedding that I’ve labeled (for convenience) as a CHANNEL? The question mark reflects my doubts about this identifier. Nevertheless, this road cut exposes a sequence of events: lava and ash being erupted onto an irregular volcanic landscape; probable surface erosion for some period of time; physical disruption and collapse, probably while still hot, of some part of later volcanic material. I don’t have enough experience with volcaniclastic sediments to say anymore than that.
D. The pushpin shows the location of this road cut. The blue ribbon is Coldwater Lake, where Hummocks Trail is located (see Fig. 2); this exposure is more than ten miles from the caldera, and hundreds of feet above the valley floor.
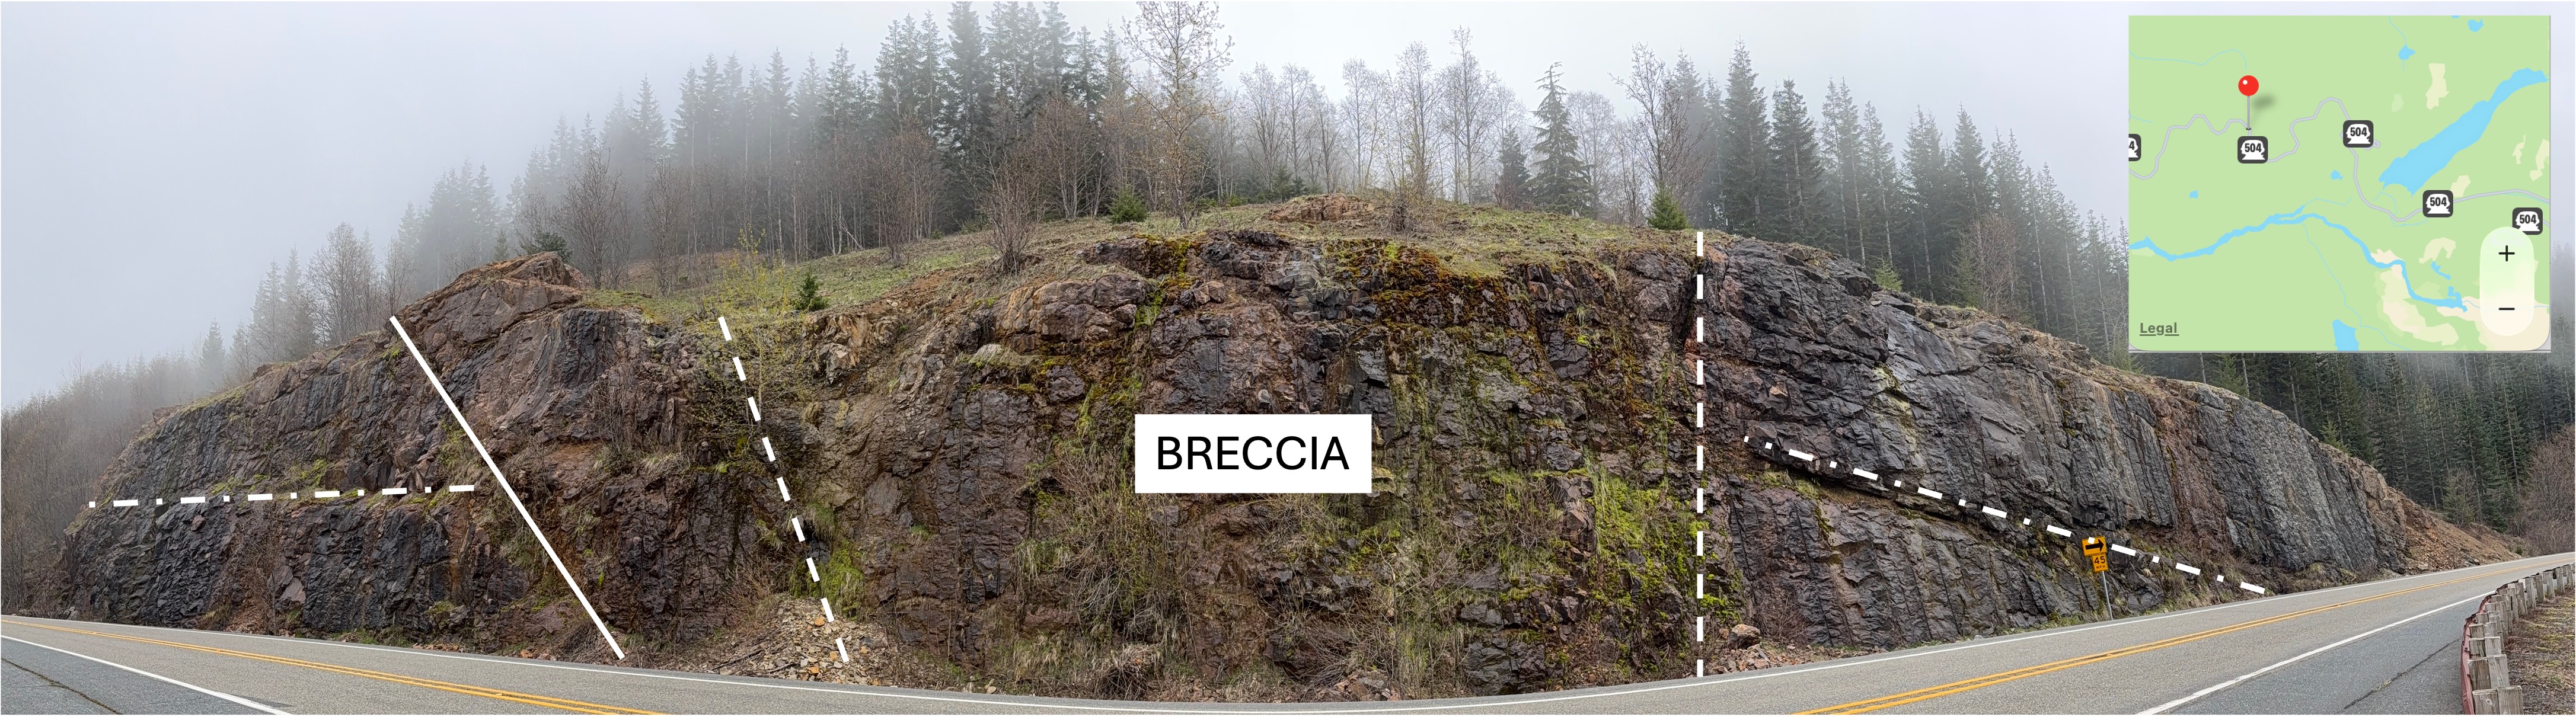
Figure 4. This post-eruption road cut is a mile or more further from the caldera. The solid line was a striking lineation that could be a fracture or possibly a contact between eruption beds. The dash-dot lines are apparent bedding planes between andesite flows. There is no ash present at this location. The dash lines delineate what I’m calling a BRECCIA because there is no evidence of bedding and the overall appearance is irregular; also, some large blocks were evident, although they could be a result of differential weathering. Lava flows are notoriously difficult to trace any distance laterally. Nevertheless, this exposure is similar in appearance to Fig. 3 with respect to the discontinuity between identifiable volcaniclastic deposits.
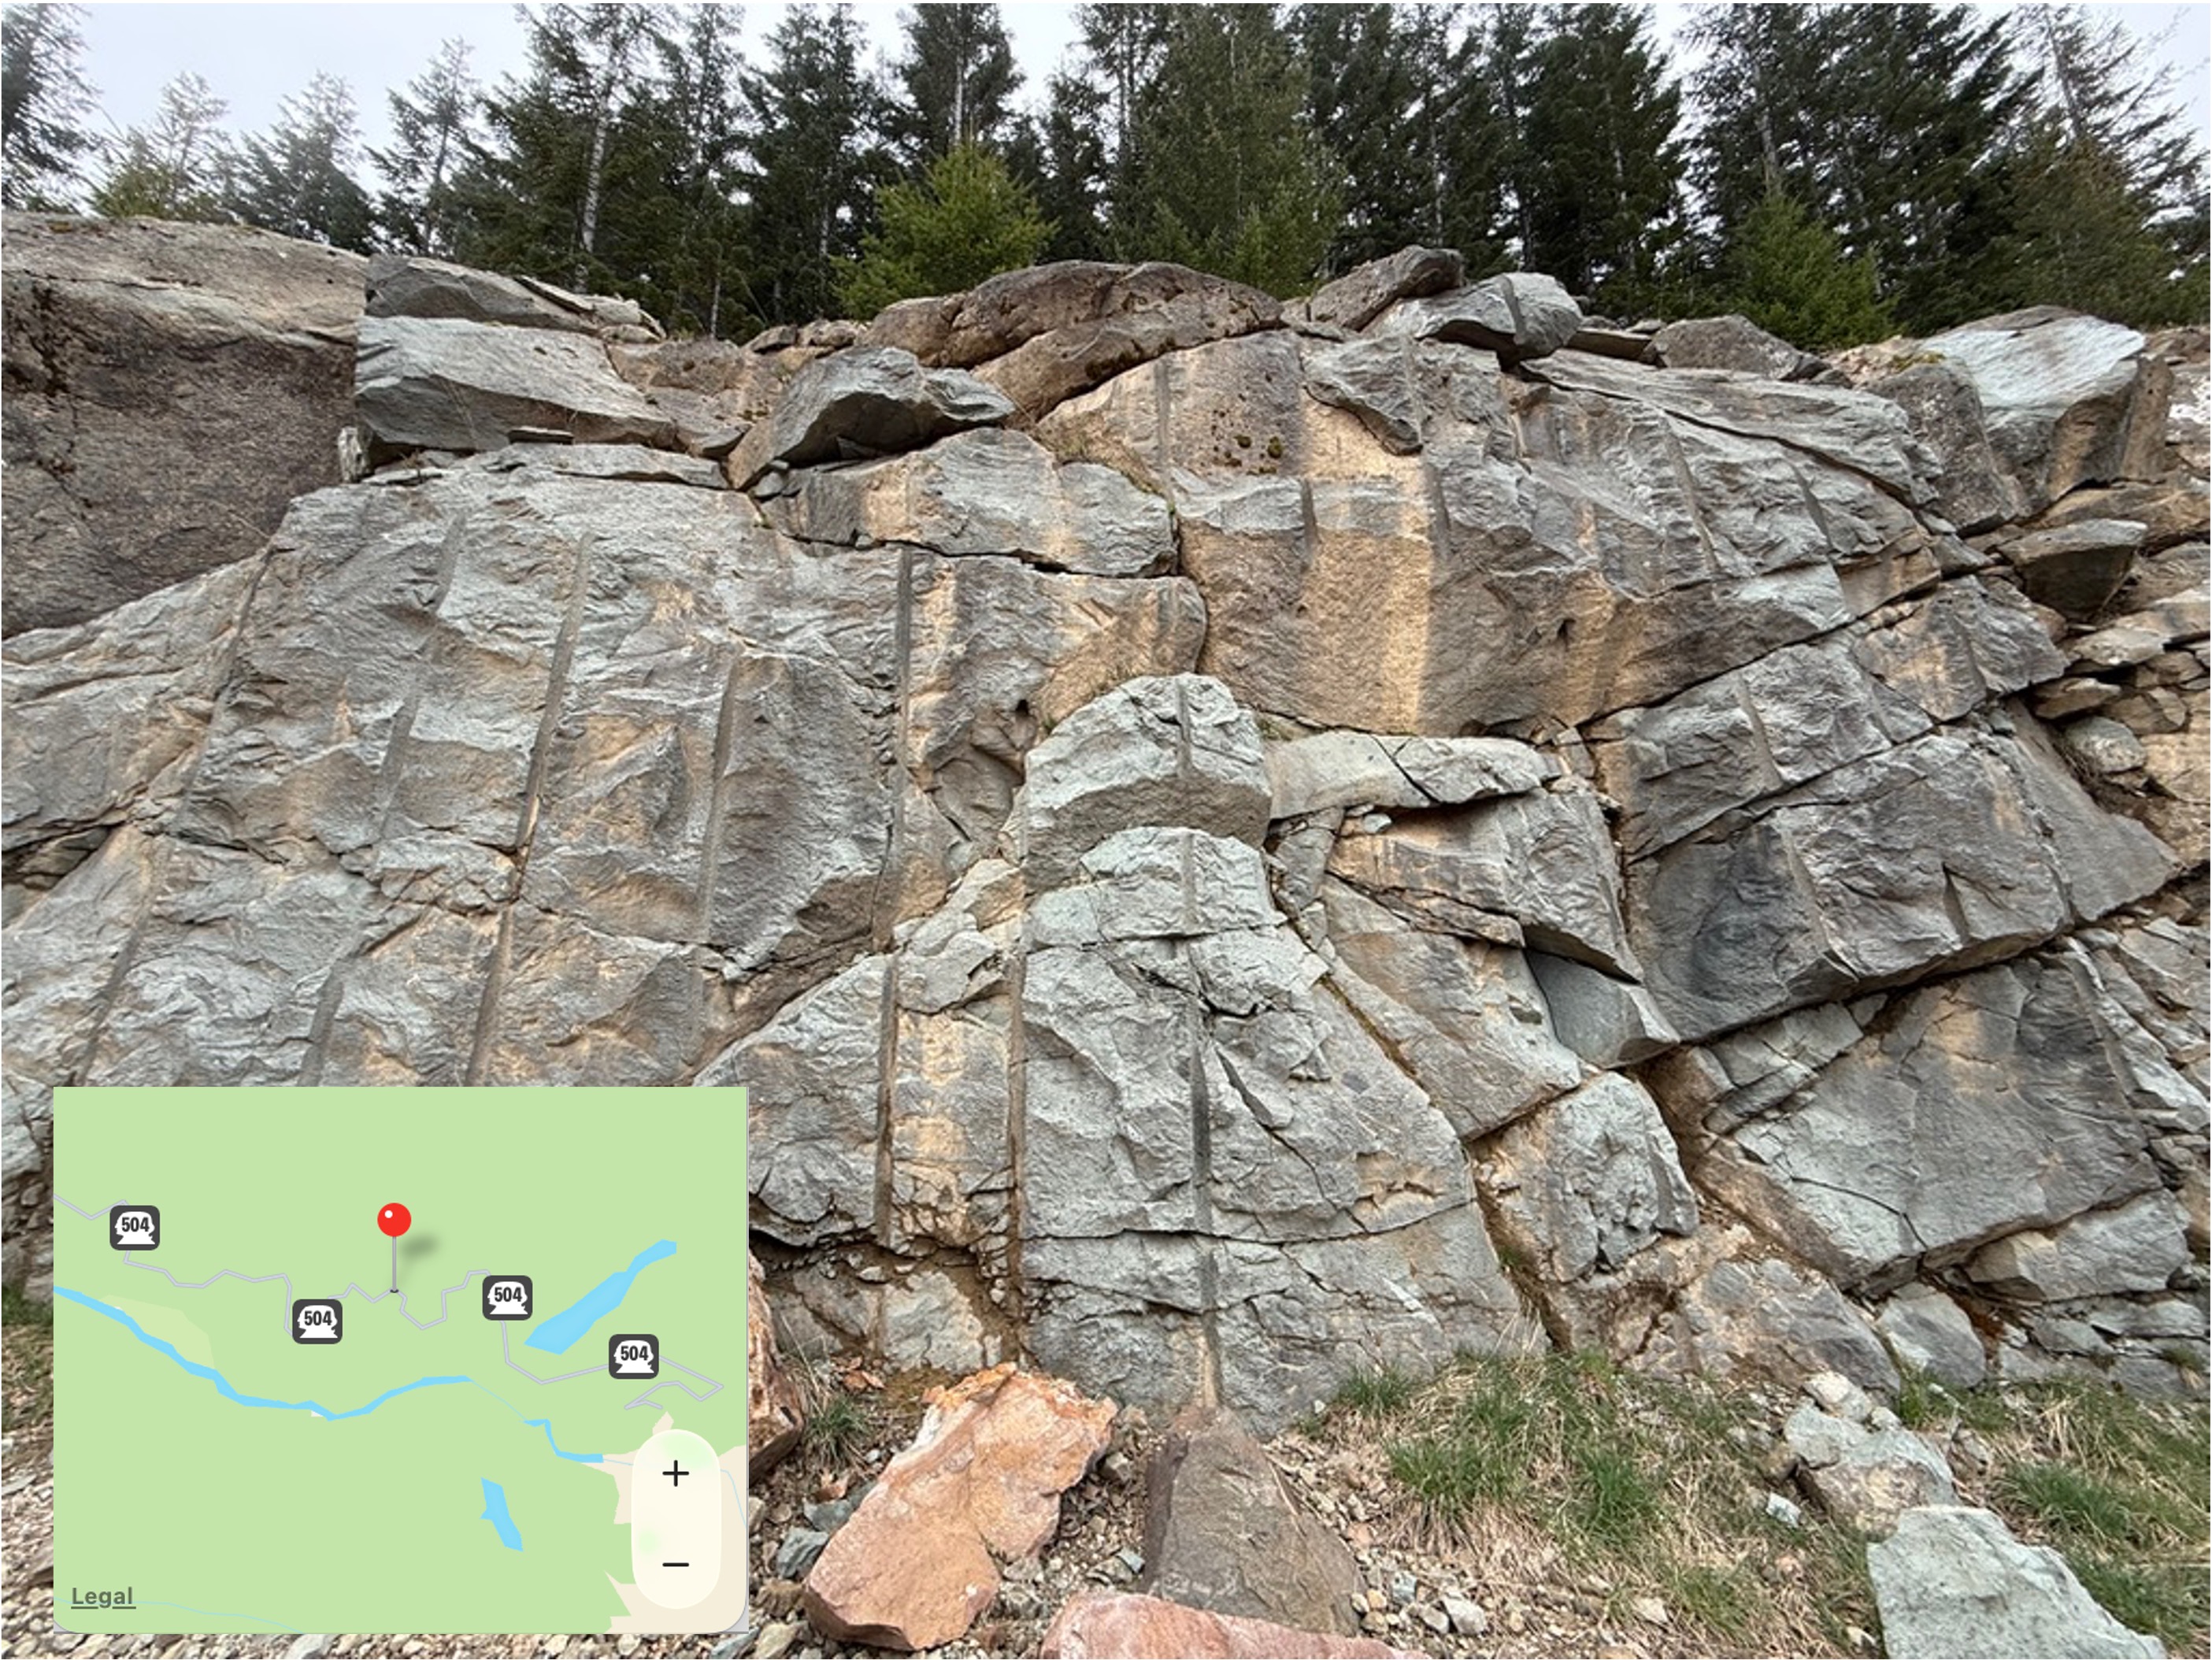
Figure 5. This road cut is located (see inset map) in an area the geologic map (Rock D) identifies as volcaniclastic rocks of Oligocene age (33.9-23.04 Ma). This is a smaller exposure than seen in Figs. 3 and 4, but it is also very different in appearance. That could be an optical illusion; close examination of the photo (I took it from my vehicle stopped in the middle of the road) suggests to me that this is ash that was so hot it formed what is called a welded tuff when it fell, after being blown into the atmosphere by an eruption. The light color suggests a magmatic composition more like granite than gabbro, or even diorite. That wouldn’t be surprising in the complex magmatic environment of a subduction zone, where partially melted, oceanic crust (e.g. gabbro and basalt) chemically mixes with continental crust (e.g. granite and diorite).
This completes my survey of older volcanic rocks near Mount St. Helens. There are no rocks exposed that explain the apparent hiatus in volcanism between about 23 and 2 million years ago. That is a story for another day…
Volcaniclastic Deposits from May 1980 Eruption
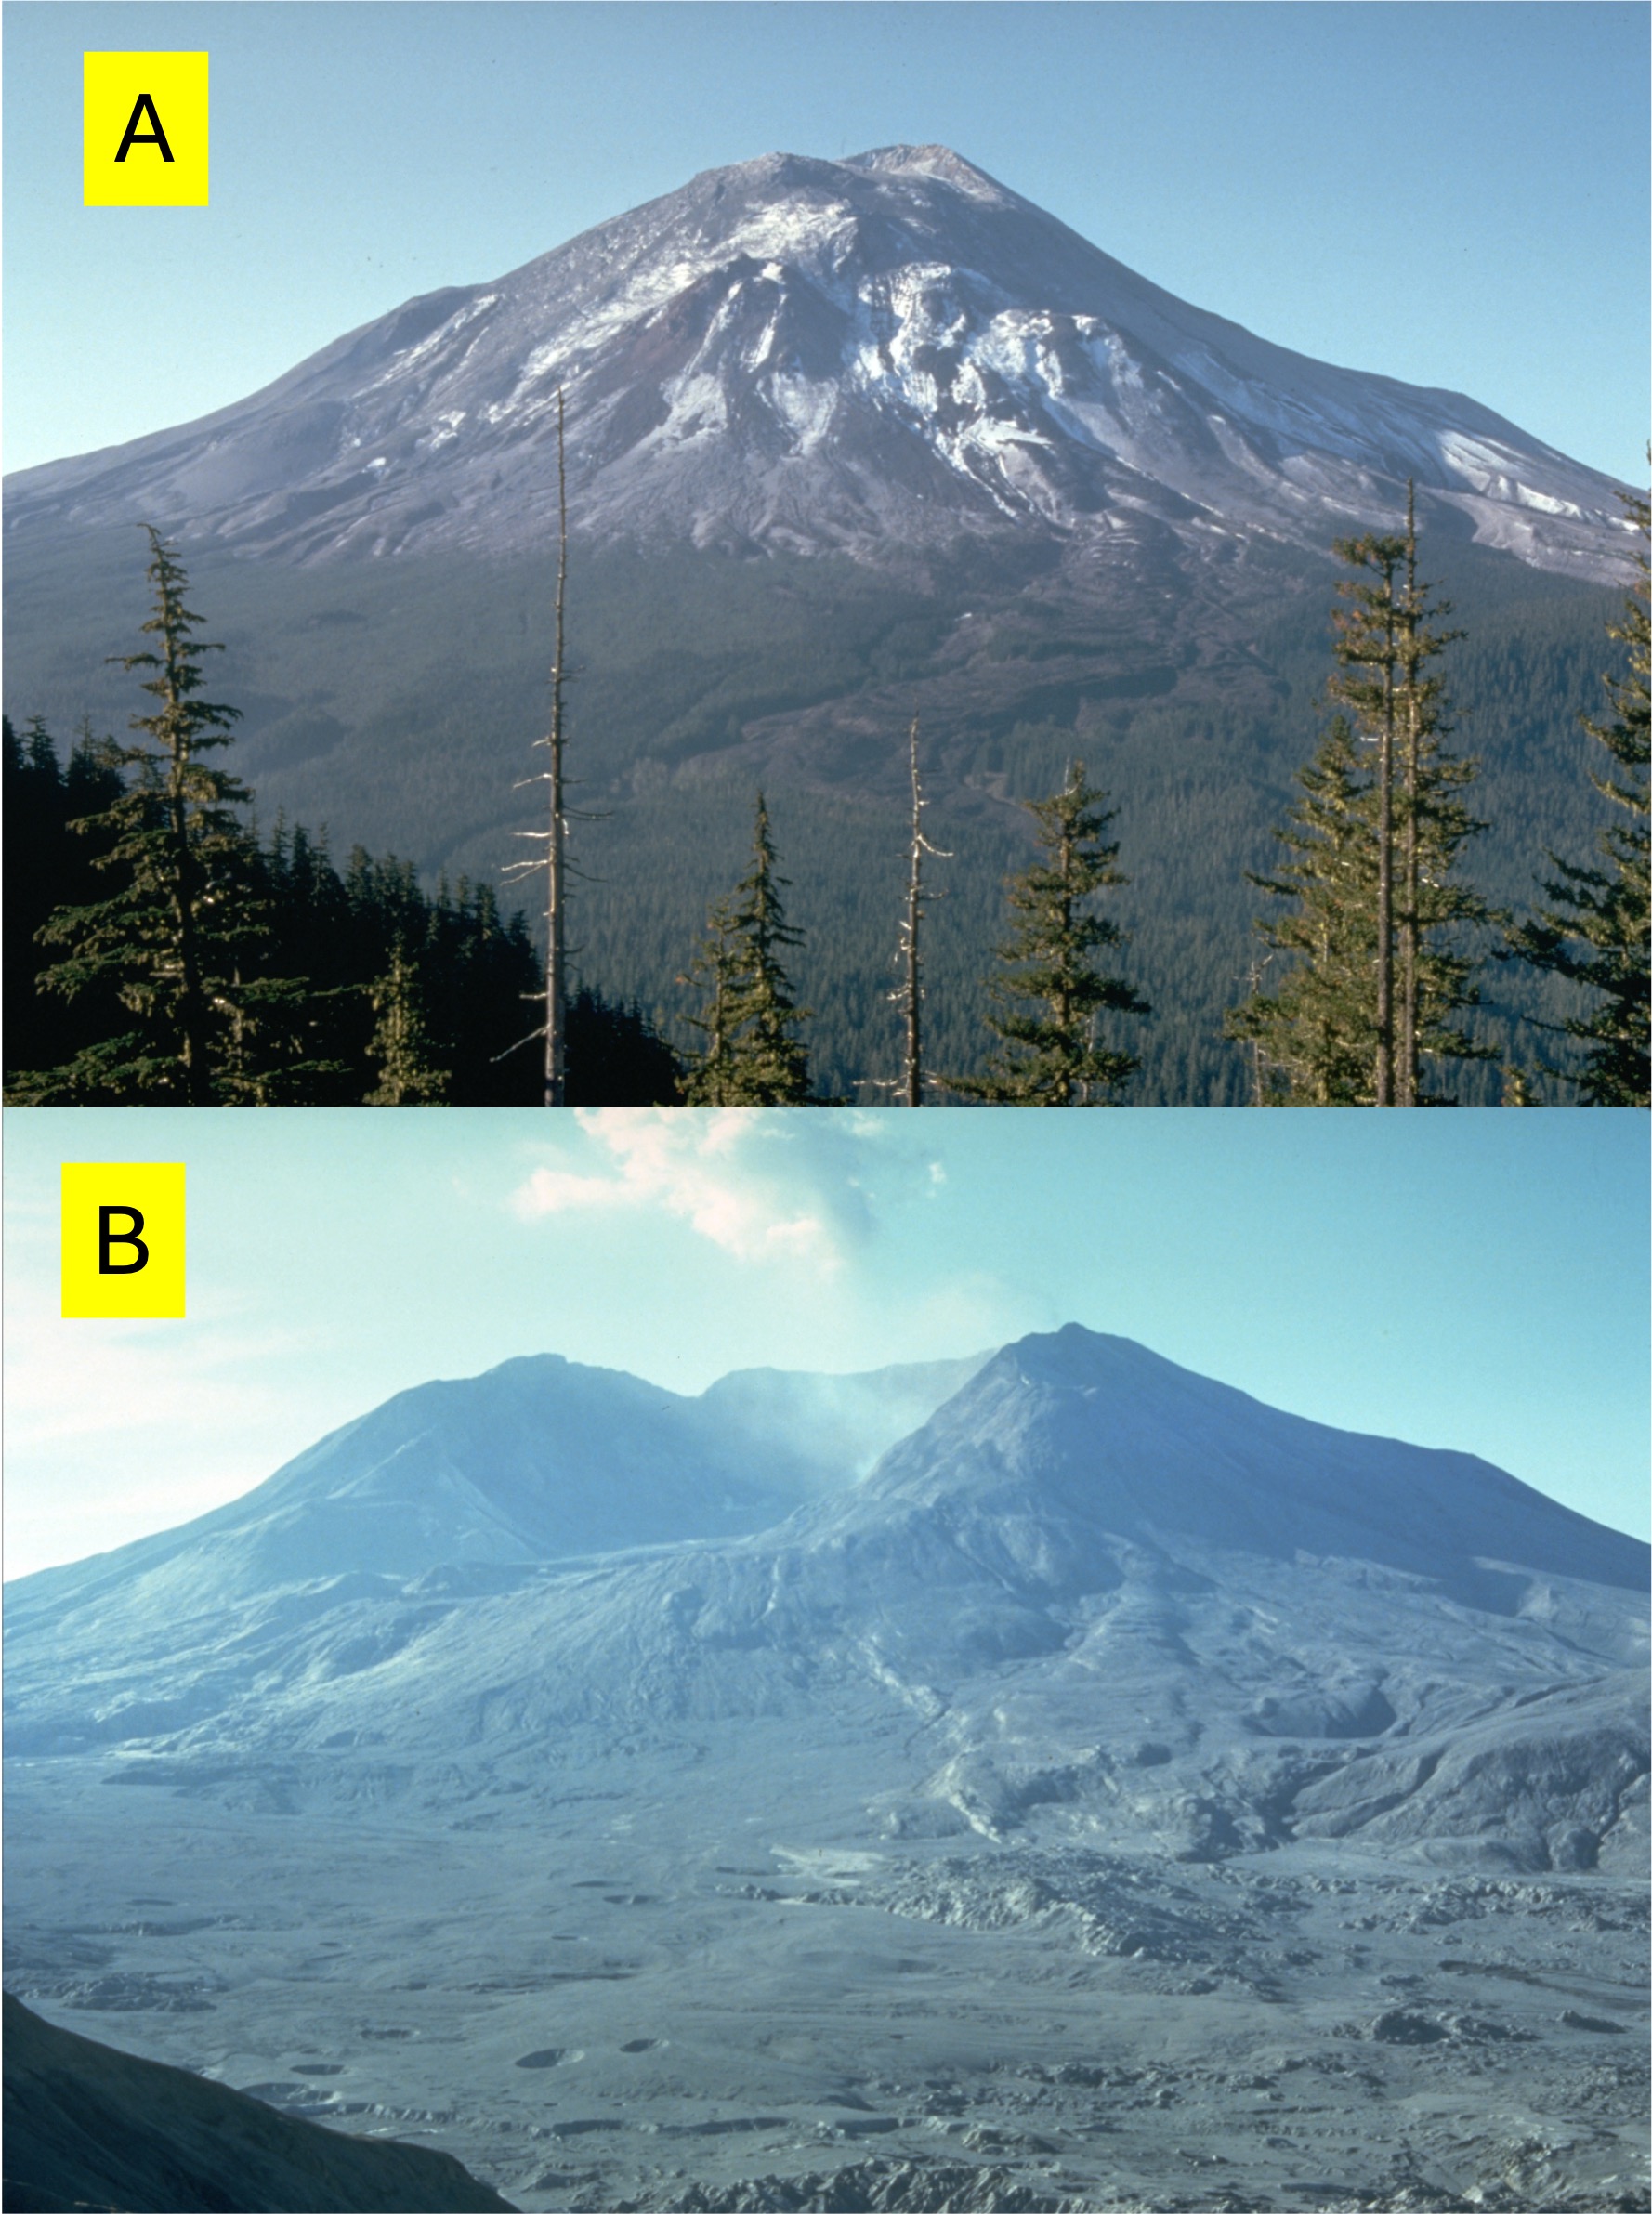
Figure 6. Photo A was taken a few days before the eruption in May, 1980. Image B was taken a few days afterward. The pre-eruption volcano was 9677 feet tall, but the obliterated peak is only 8365 feet. The total volume of material displaced exceeded one cubic mile, most of which was rock that collapsed during the rock slide preceding the actual eruption. The flat area fronting the volcano in (B) is a large fraction of the previous peak, which filled in several channels originating at the volcano. Note the holes in (B), which are probably blow-outs of gases trapped in the debris.
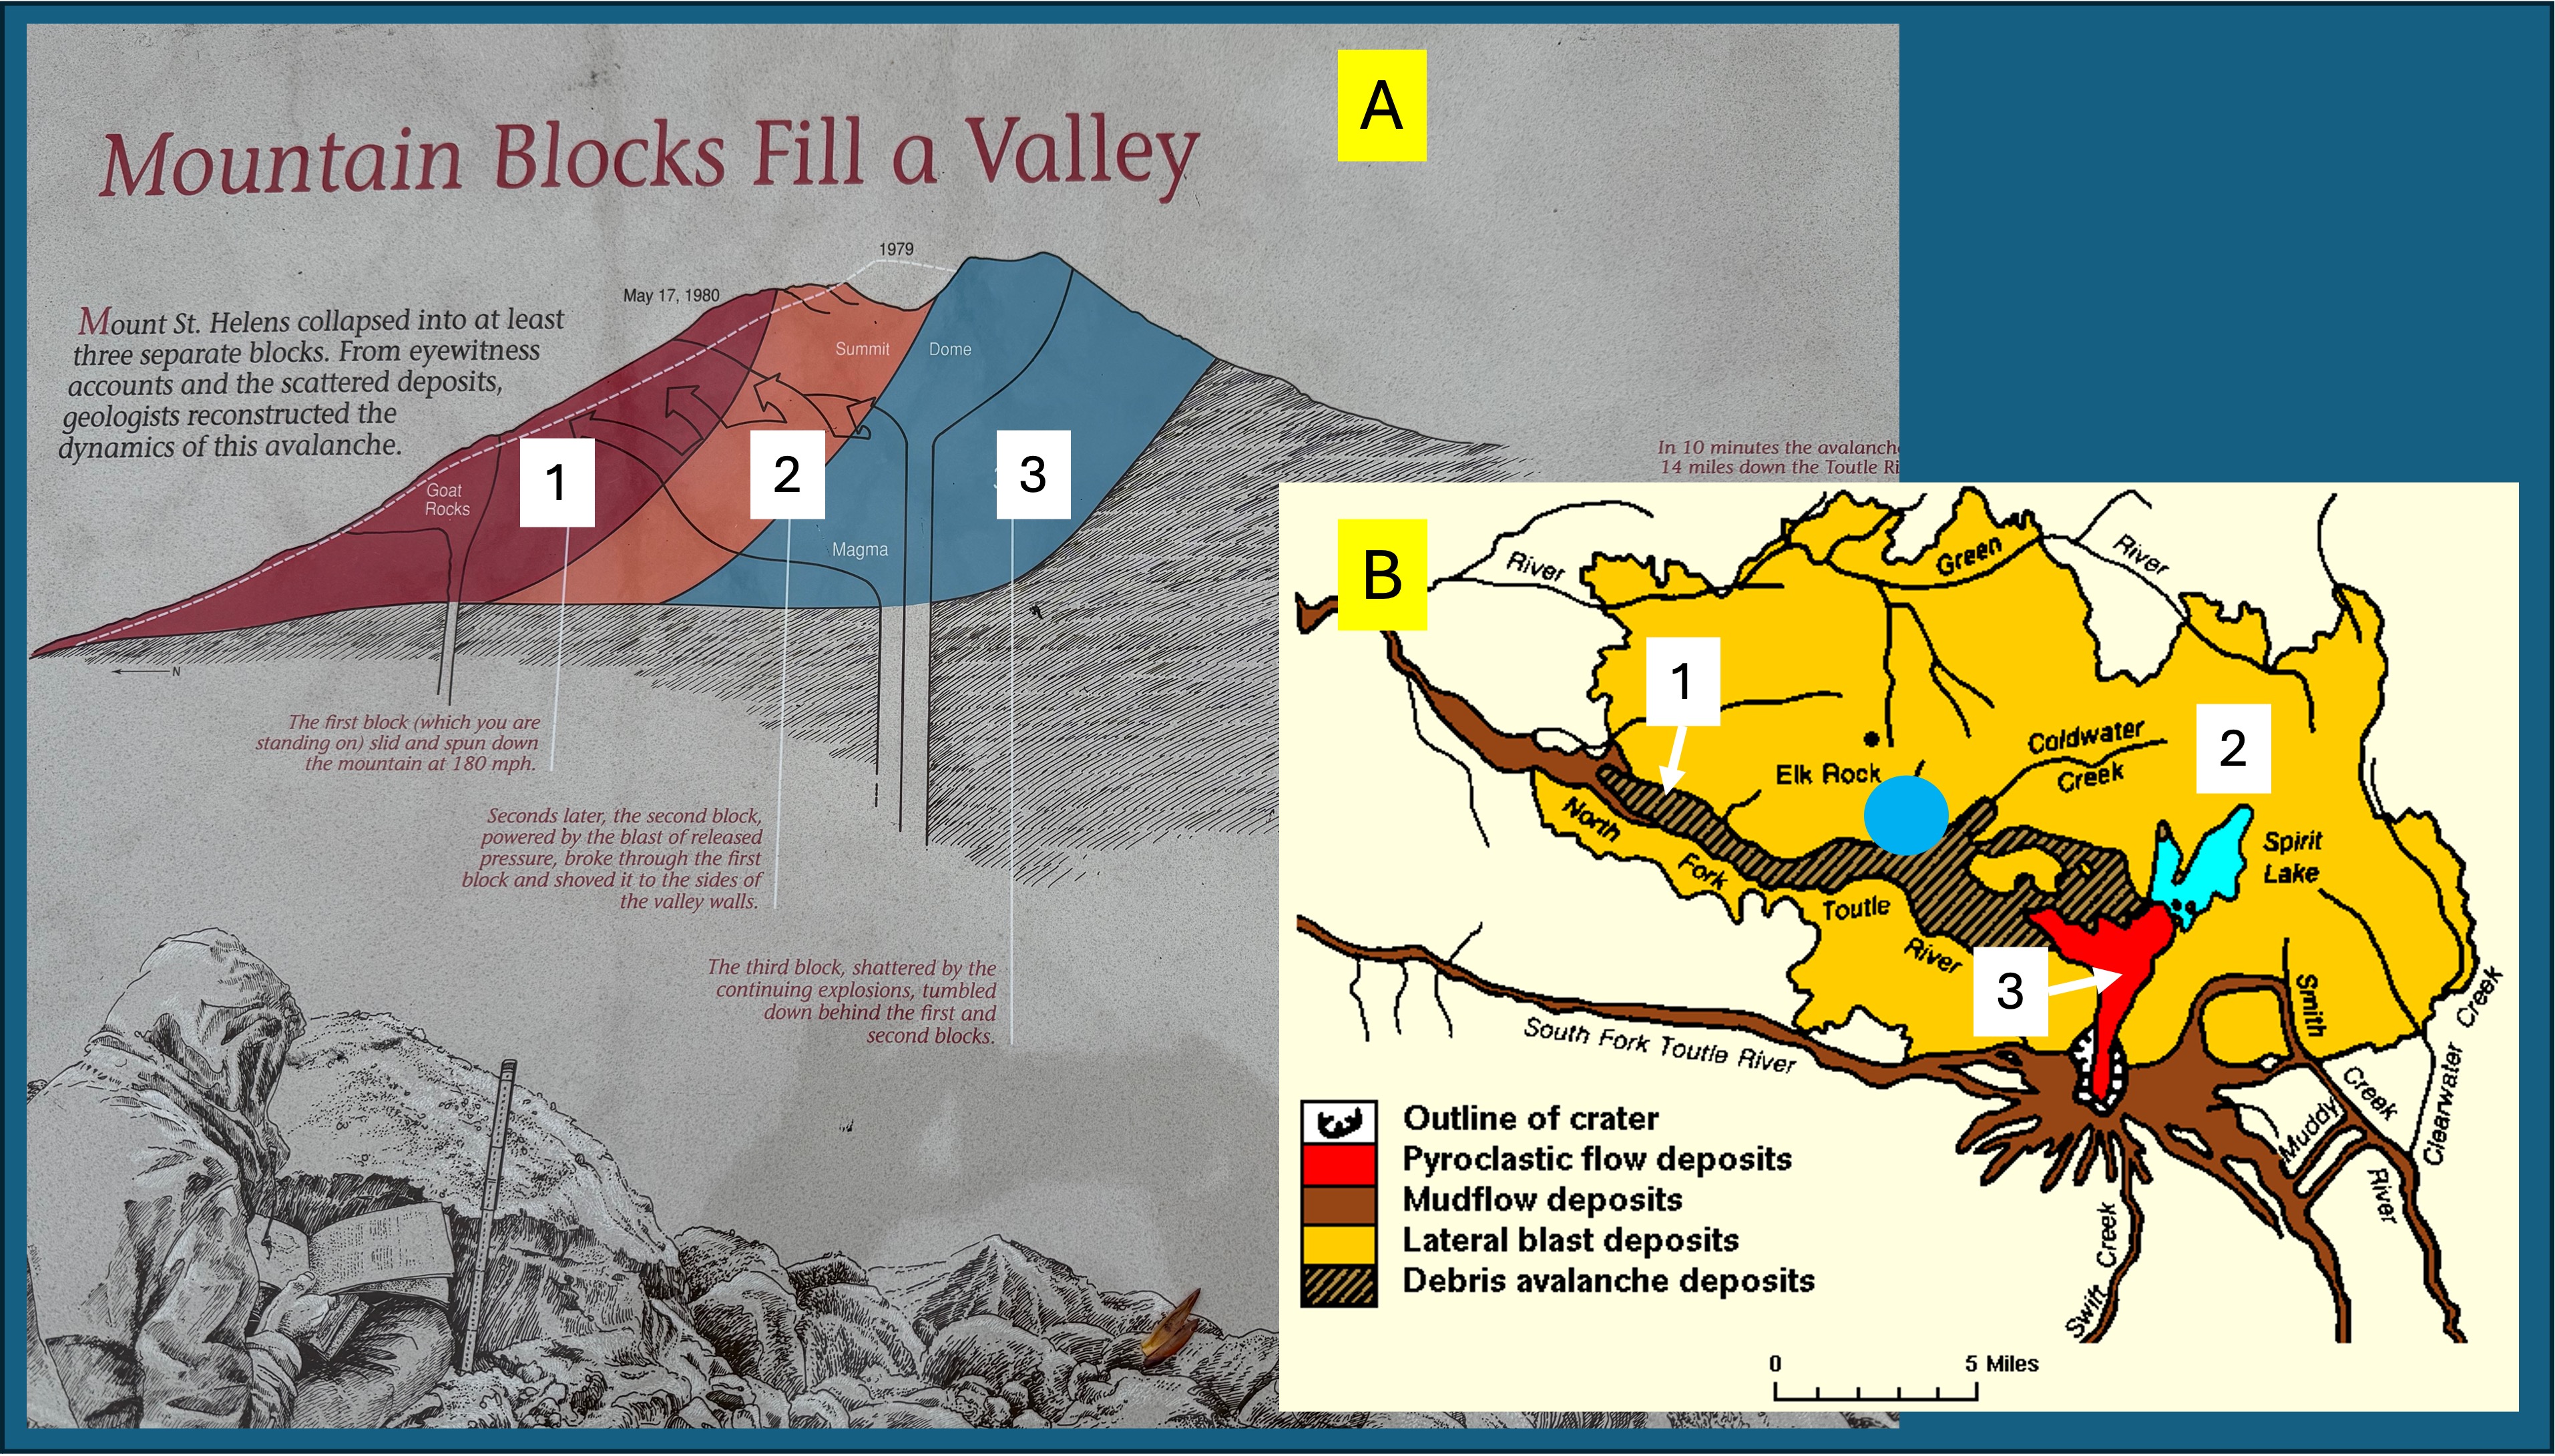
Figure 7. (A) This plaque was located along Hummocks Trail. I’ve supplemented it with the map of volcaniclastic deposits shown in (B). I will focus on the three major volcaniclastic deposits I encountered at Hummocks Trail (blue circle in B), which are numbered 1-3 in both figures.
The first stage was collapse of the north flank of Mount St. Helens (brown in A and cross-hatched in B). This was a run-of-the-mill massive landslide that followed existing drainage, until stage two occurred.
When the rock containing the highly pressurized magma was removed. The resulting release of pressure created an explosion equivalent to 10-50 megatons of TNT; although a volcanic eruption is not analogous to a nuclear explosion, the energy released was roughly 1600 times the energy of the Hiroshima atomic bomb. It moved a lot of rock. This blast occurred seconds after stage 1 began; the hot gases overtook the rock slide, driving rock and debris up the sides of the valley, removing everything, including top soil, within a few miles of the volcano. The orange area in B shows how widespread this explosion was.
Stage 3 was a pyroclastic flow (red in B), which was limited to the immediate vicinity of the caldera; however, what goes up must come down, so several inches of ash were deposited as far as Spokane, Washington–400 miles distant.
Video 1. This video shows debris from the landslide (Stage 1) that was pushed at least 300 feet from the original valley floor to the ridge by the unimaginable blast of Stage 2. The main slide followed Toutle River (North Fork), but with this impetus, debris was launched over the canyon walls. That’s what this video shows. It’s like the heavy stuff collected at the top of the ridge whereas the sand/gravel-sized debris was blown miles further.
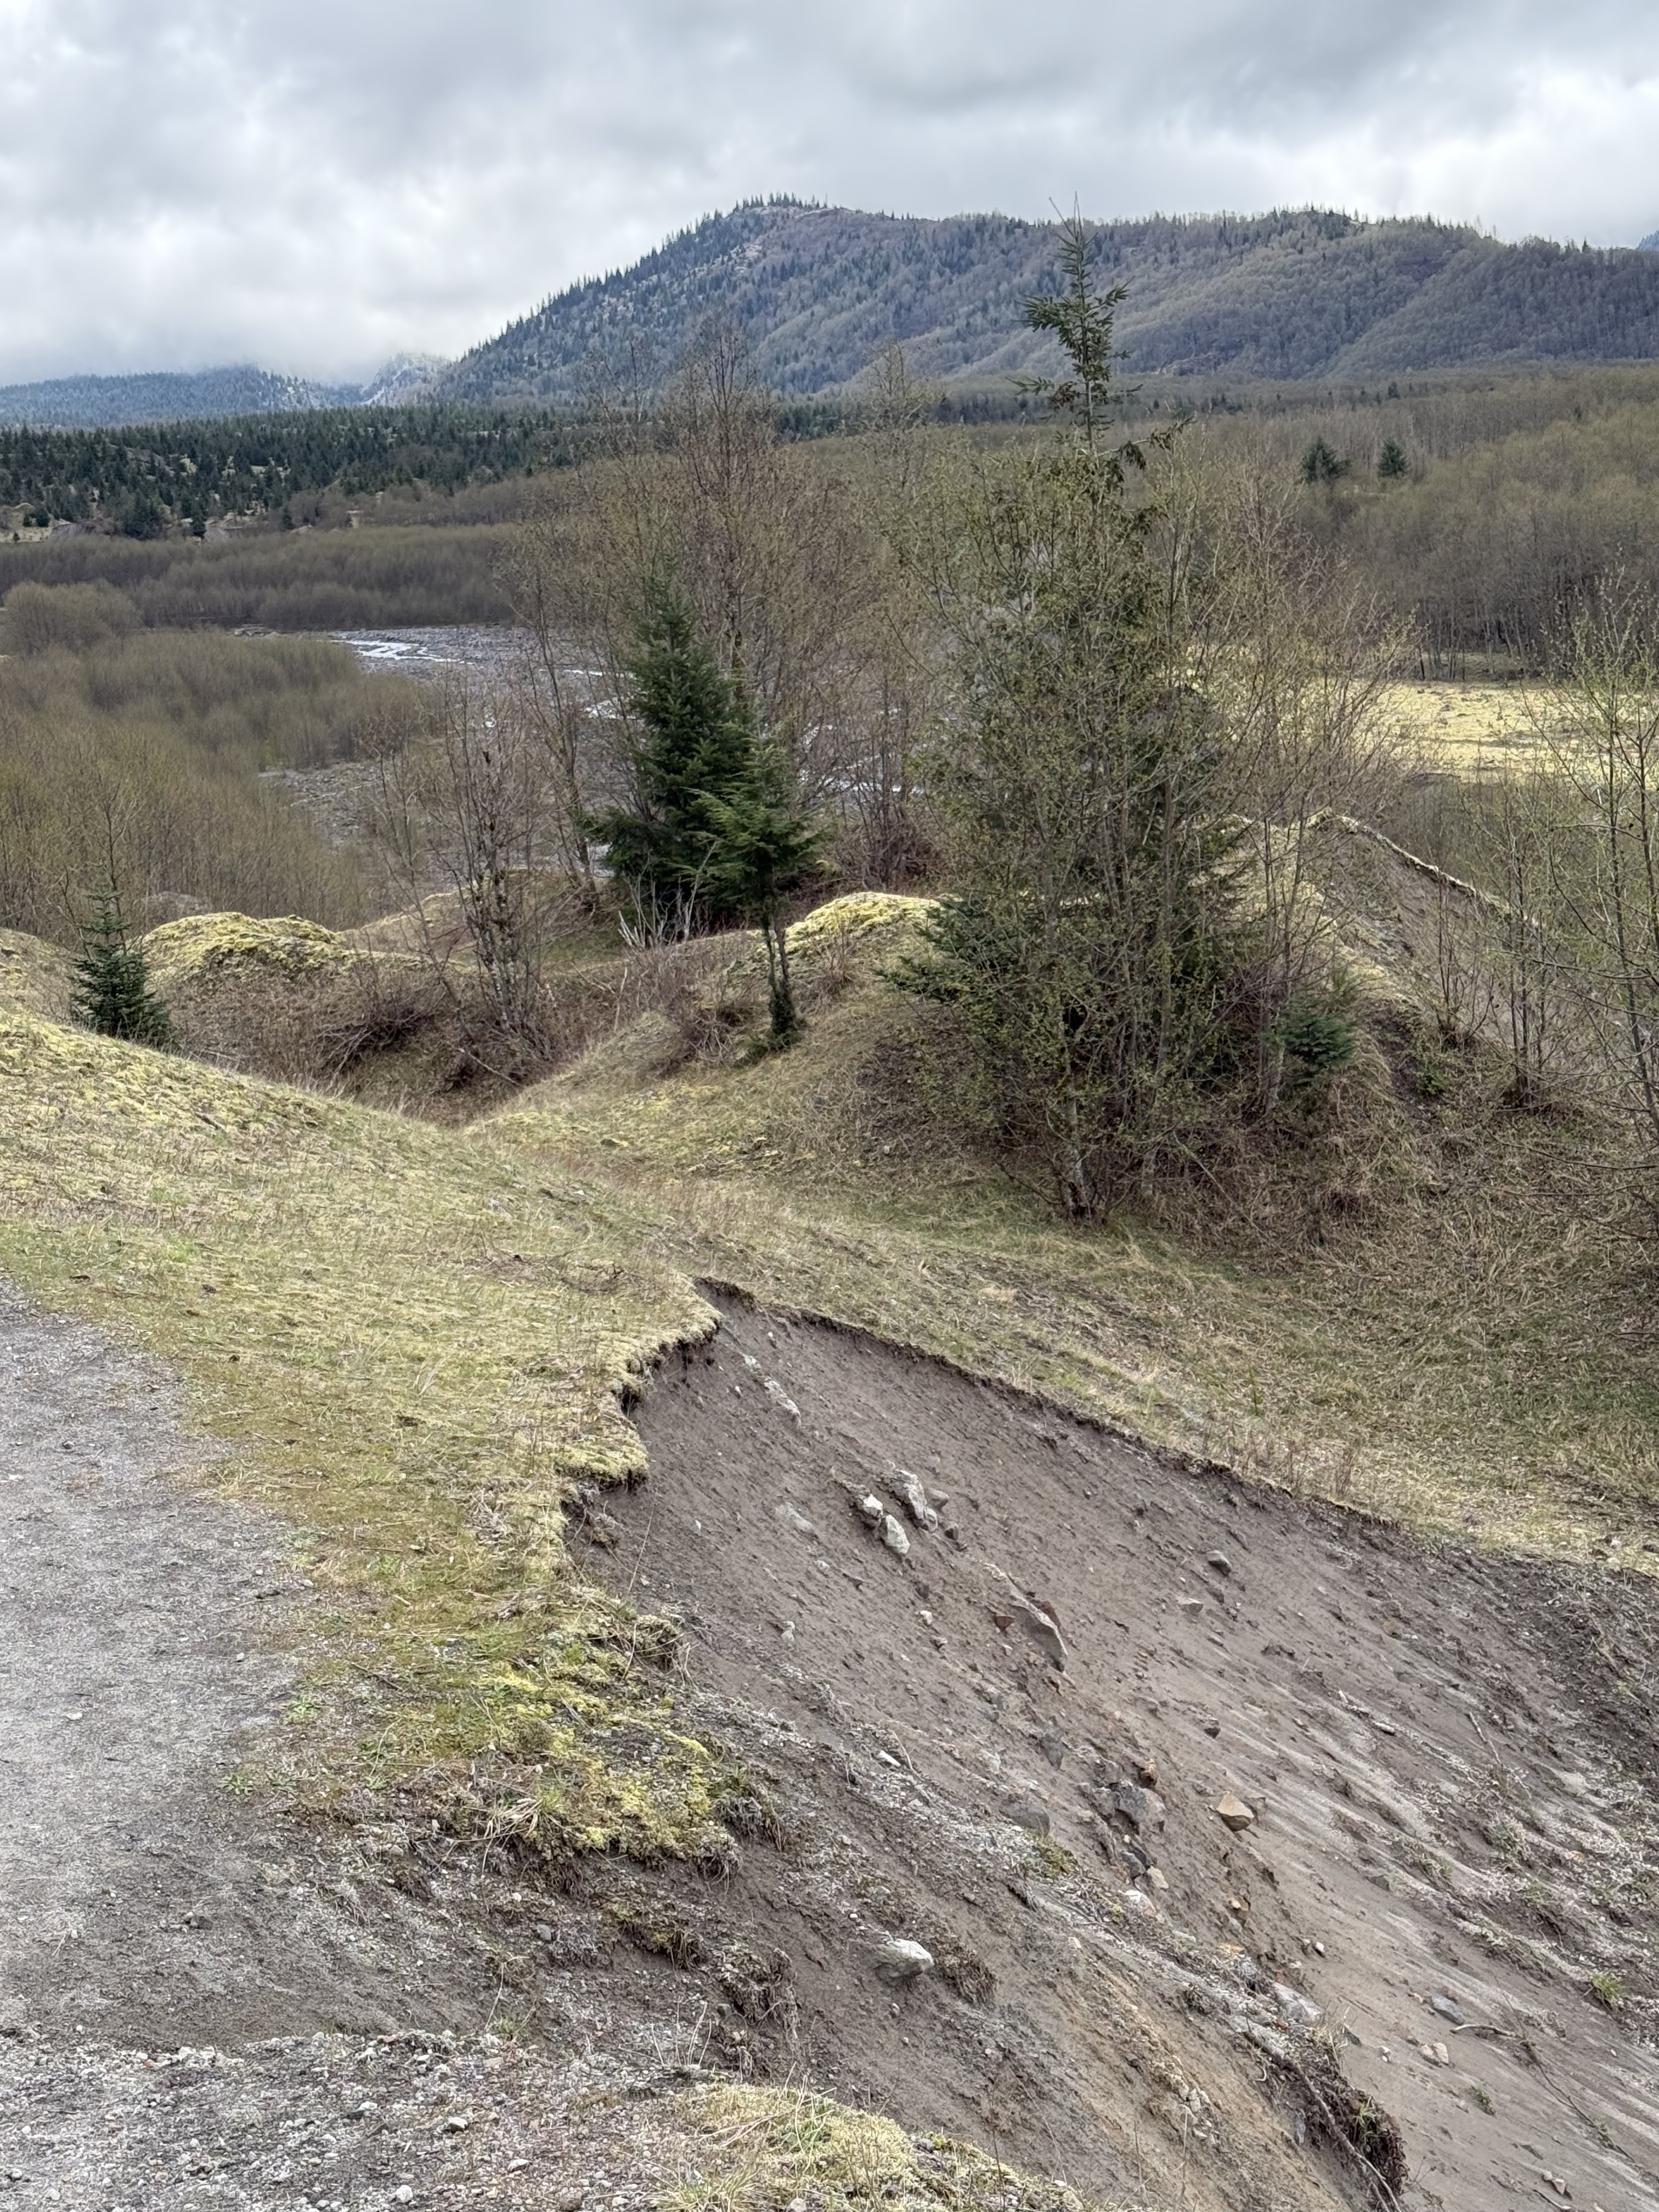
Figure 8. This photo is looking south towards Mount St. Helens from Hummocks Trail (see Figs. 2 and 7B for location) along the Toutle River (North Fork), which is more than a hundred feet lower, even after being filled with debris from the 1980 eruption. Note the difference between this scene and the deposit from Video 1. It’s difficult to comprehend the dynamics of a blast (Stage 2) capable of pushing rock (Stage 1) up this slope; when the explosion lost energy it simply dumped its load, creating a surreal landscape. The debris has very little clay and is thus non cohesive; thus slumps like this are common. Note the small hill and “ridge” in the middle of the photo. This terrain makes no sense, other than erosion has been etching it for 40 years.
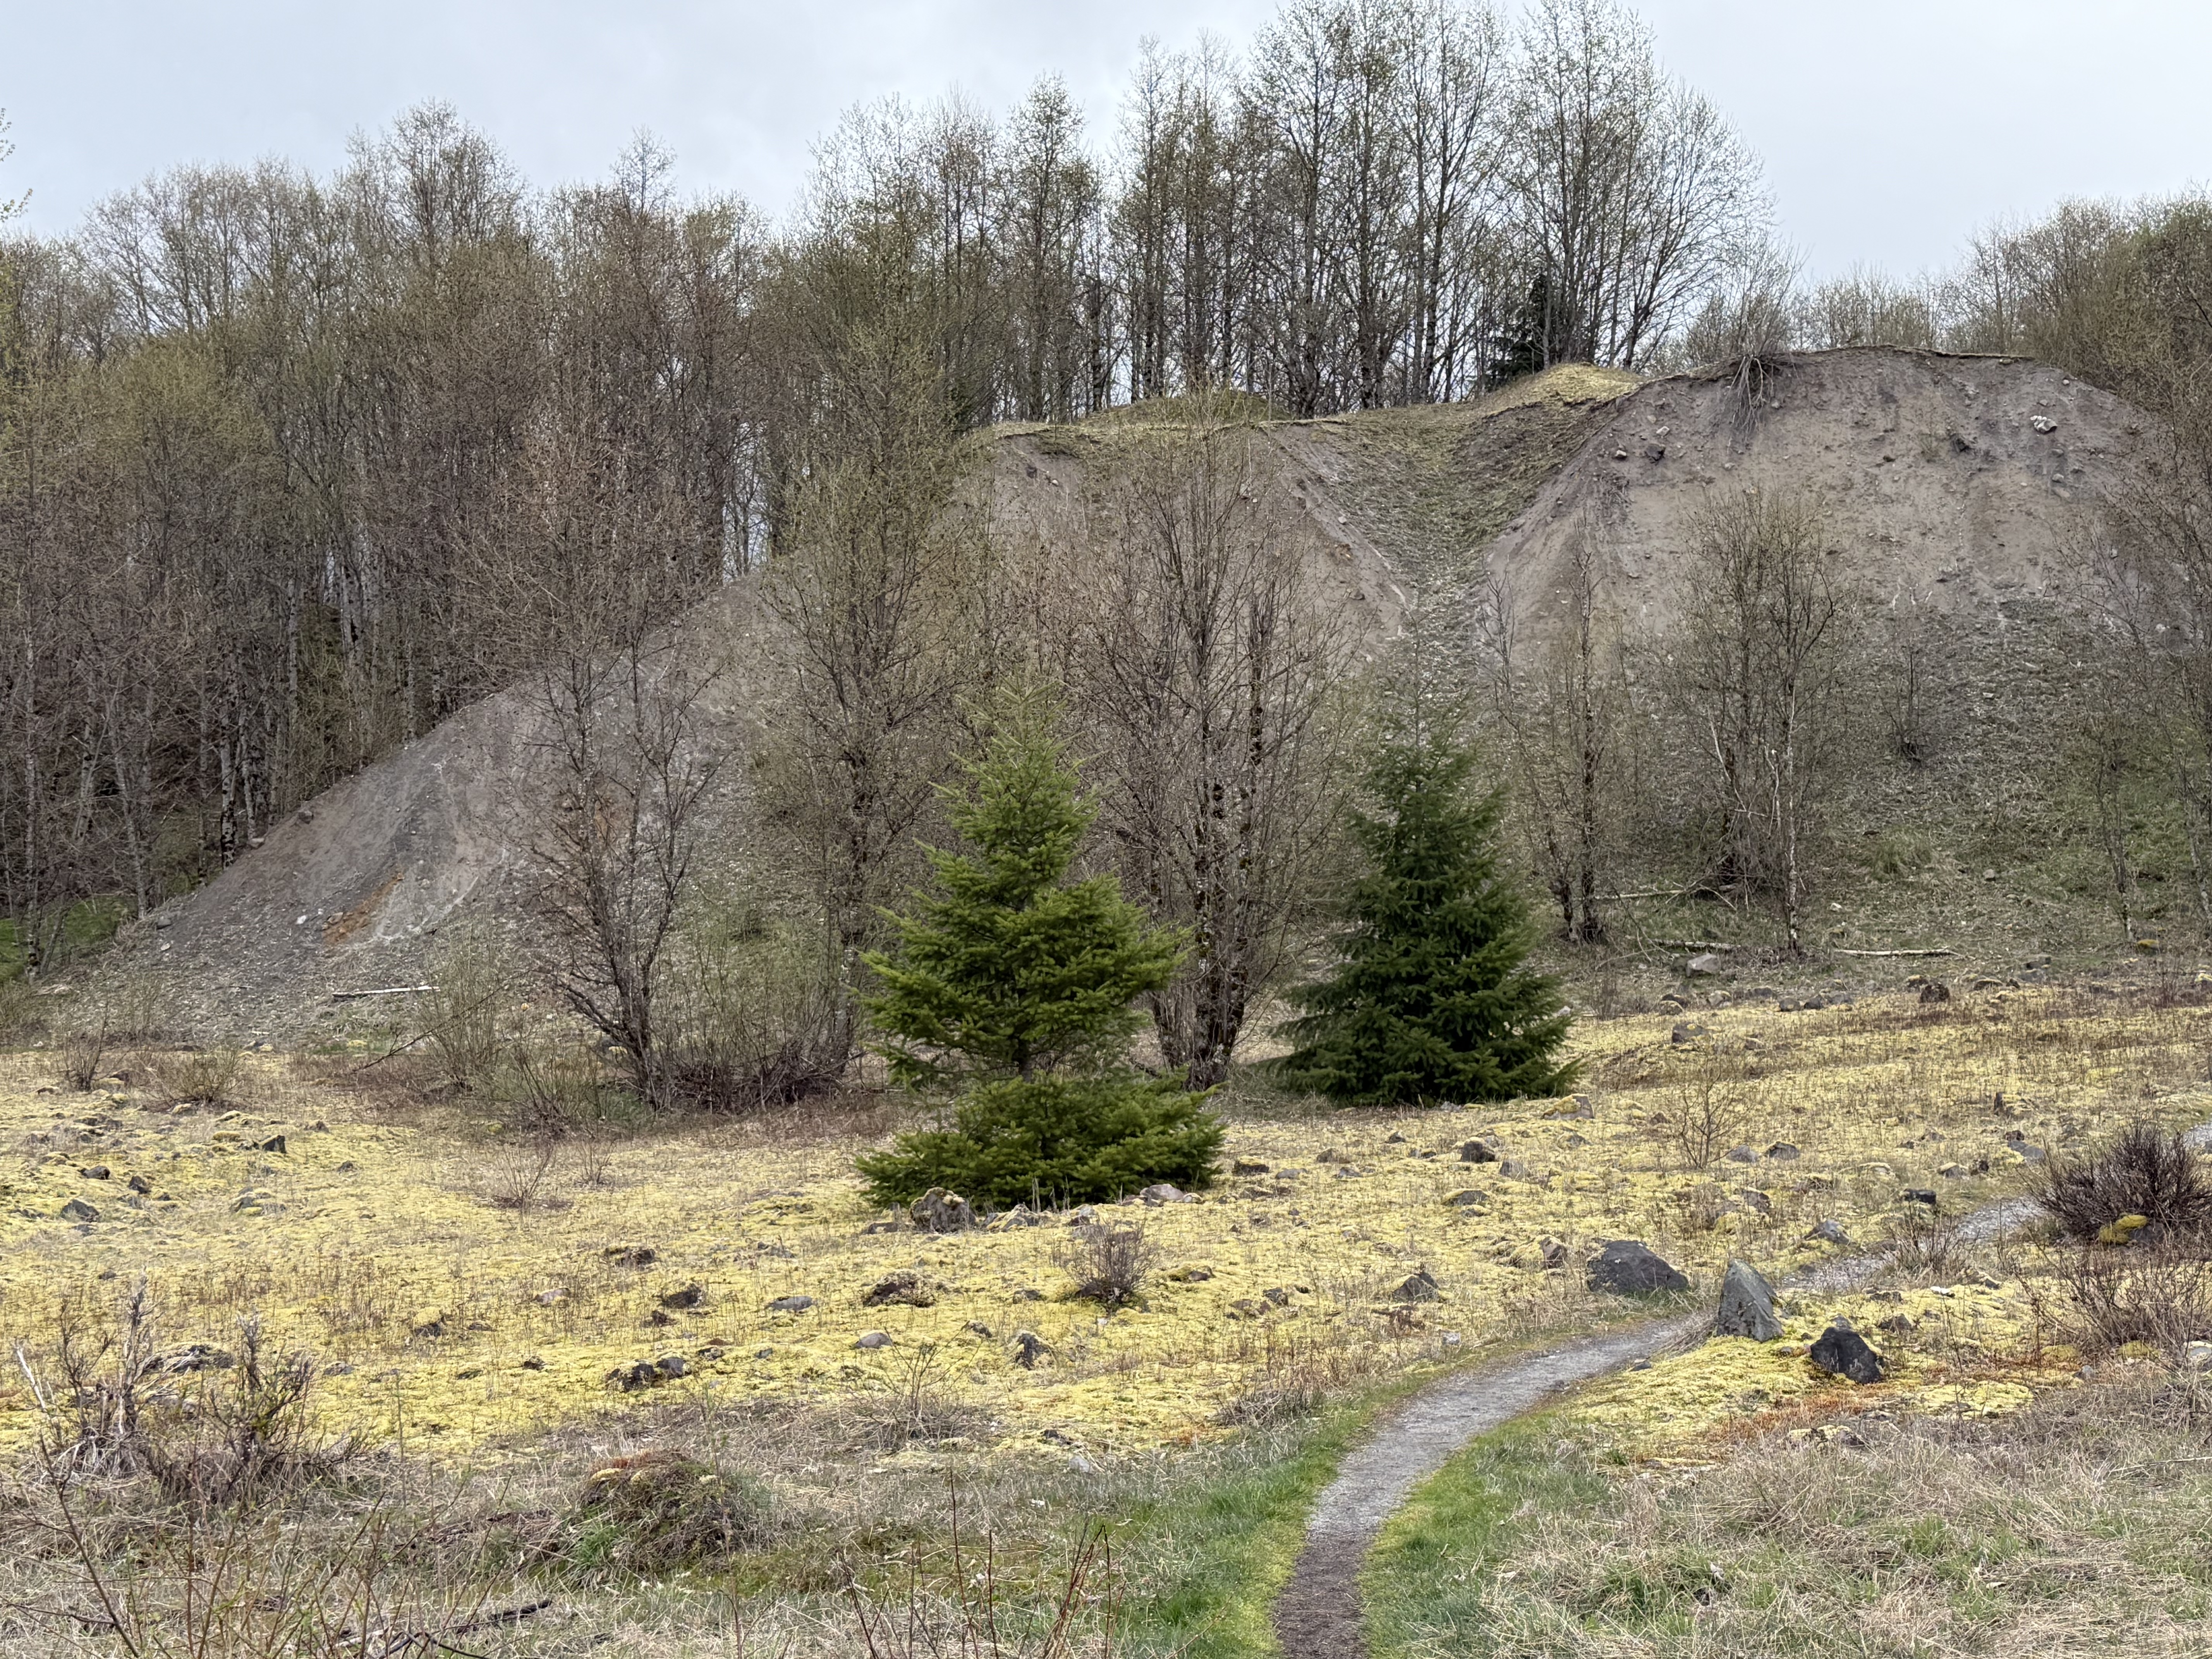
Figure 9. This layer of ash I encountered along the Hummocks Trail is a remnant of a vast sheet originally deposited during Stages 2/3–breaking such a continuous eruption sequence into stages is useful but not particularly elucidating. It all happened too fast to comprehend. You might call this an “over-bank” deposit, like when a river tops its natural levee and deposits fine-grained sediment on its floodplain.
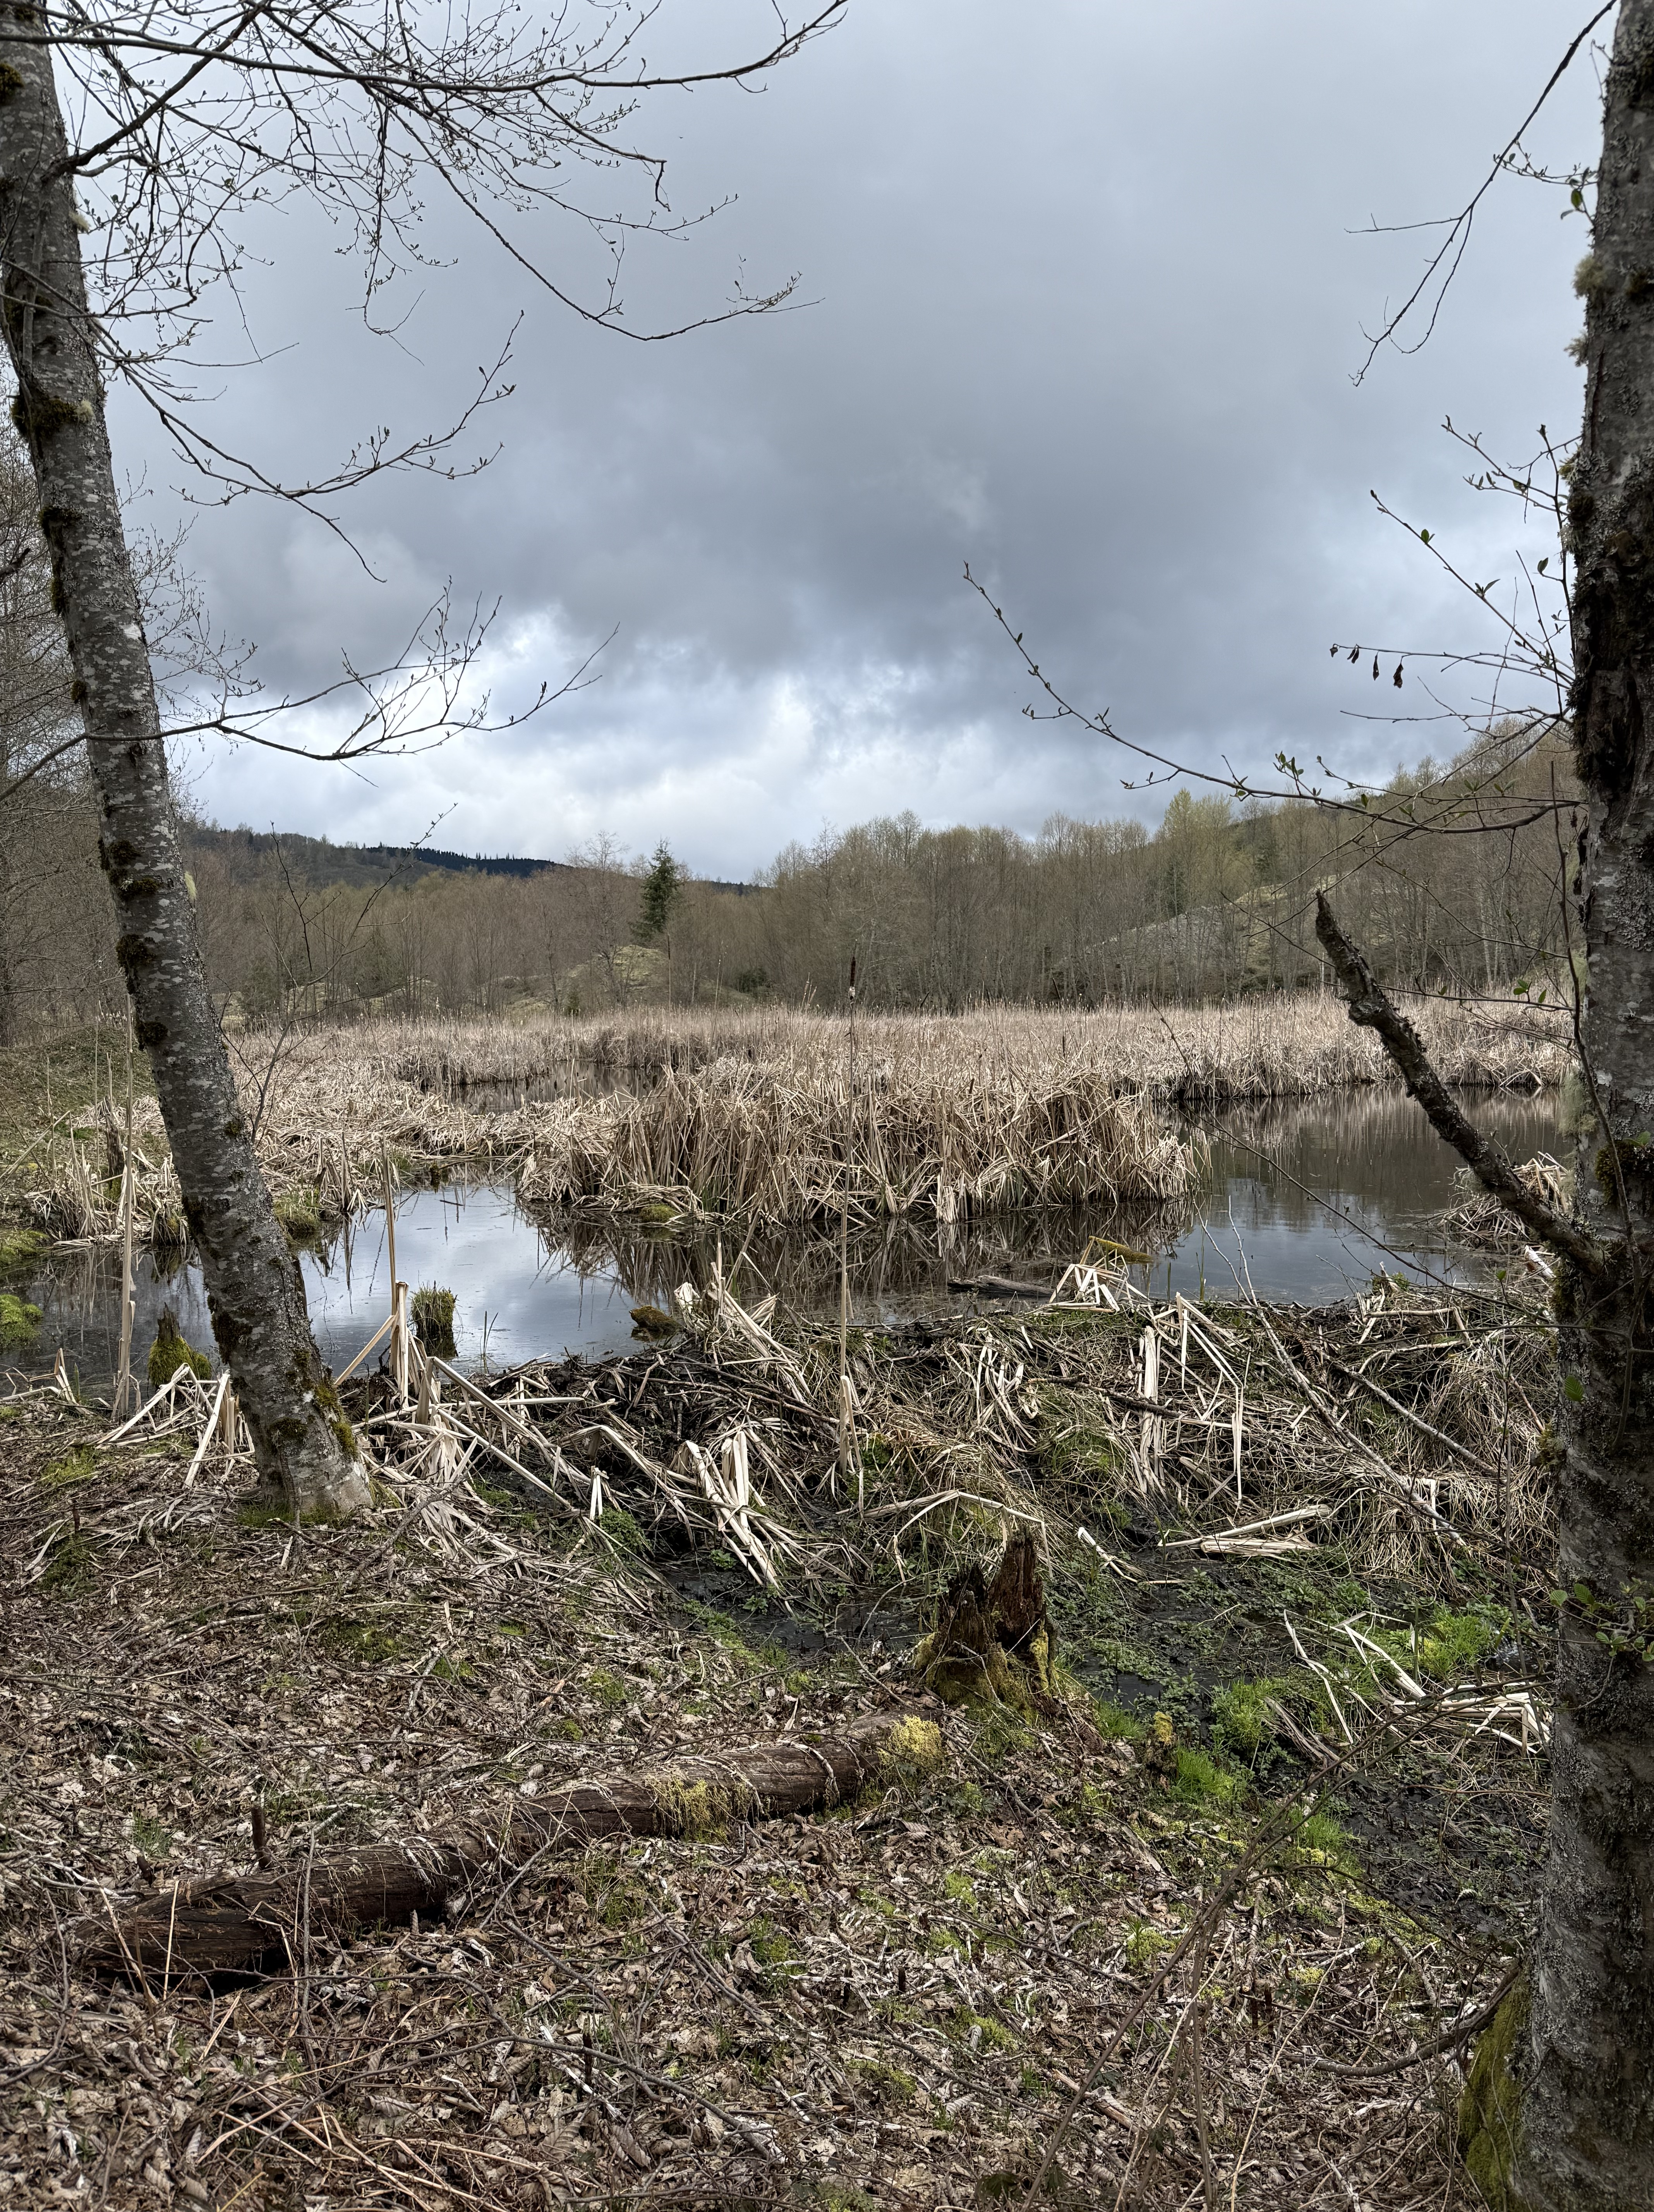
Figure 10. Hummocks Trail followed a small stream through a bizarre landscape comprising multiple small ponds like this one. A dam constructed of eruption debris (left-to-right in the center of the photo) has blocked the stream flow, creating a meandering channel during low-water conditions; but I can imagine all those dormant grasses erupting later this spring. I encountered several of these marshes, each one defined by water trying to find a way out of this labyrinth. According to Fig. 2, this is the outflow from Coldwater lake; the eruption partially blocked its path but nature is finding a way through this discombobulated landscape.
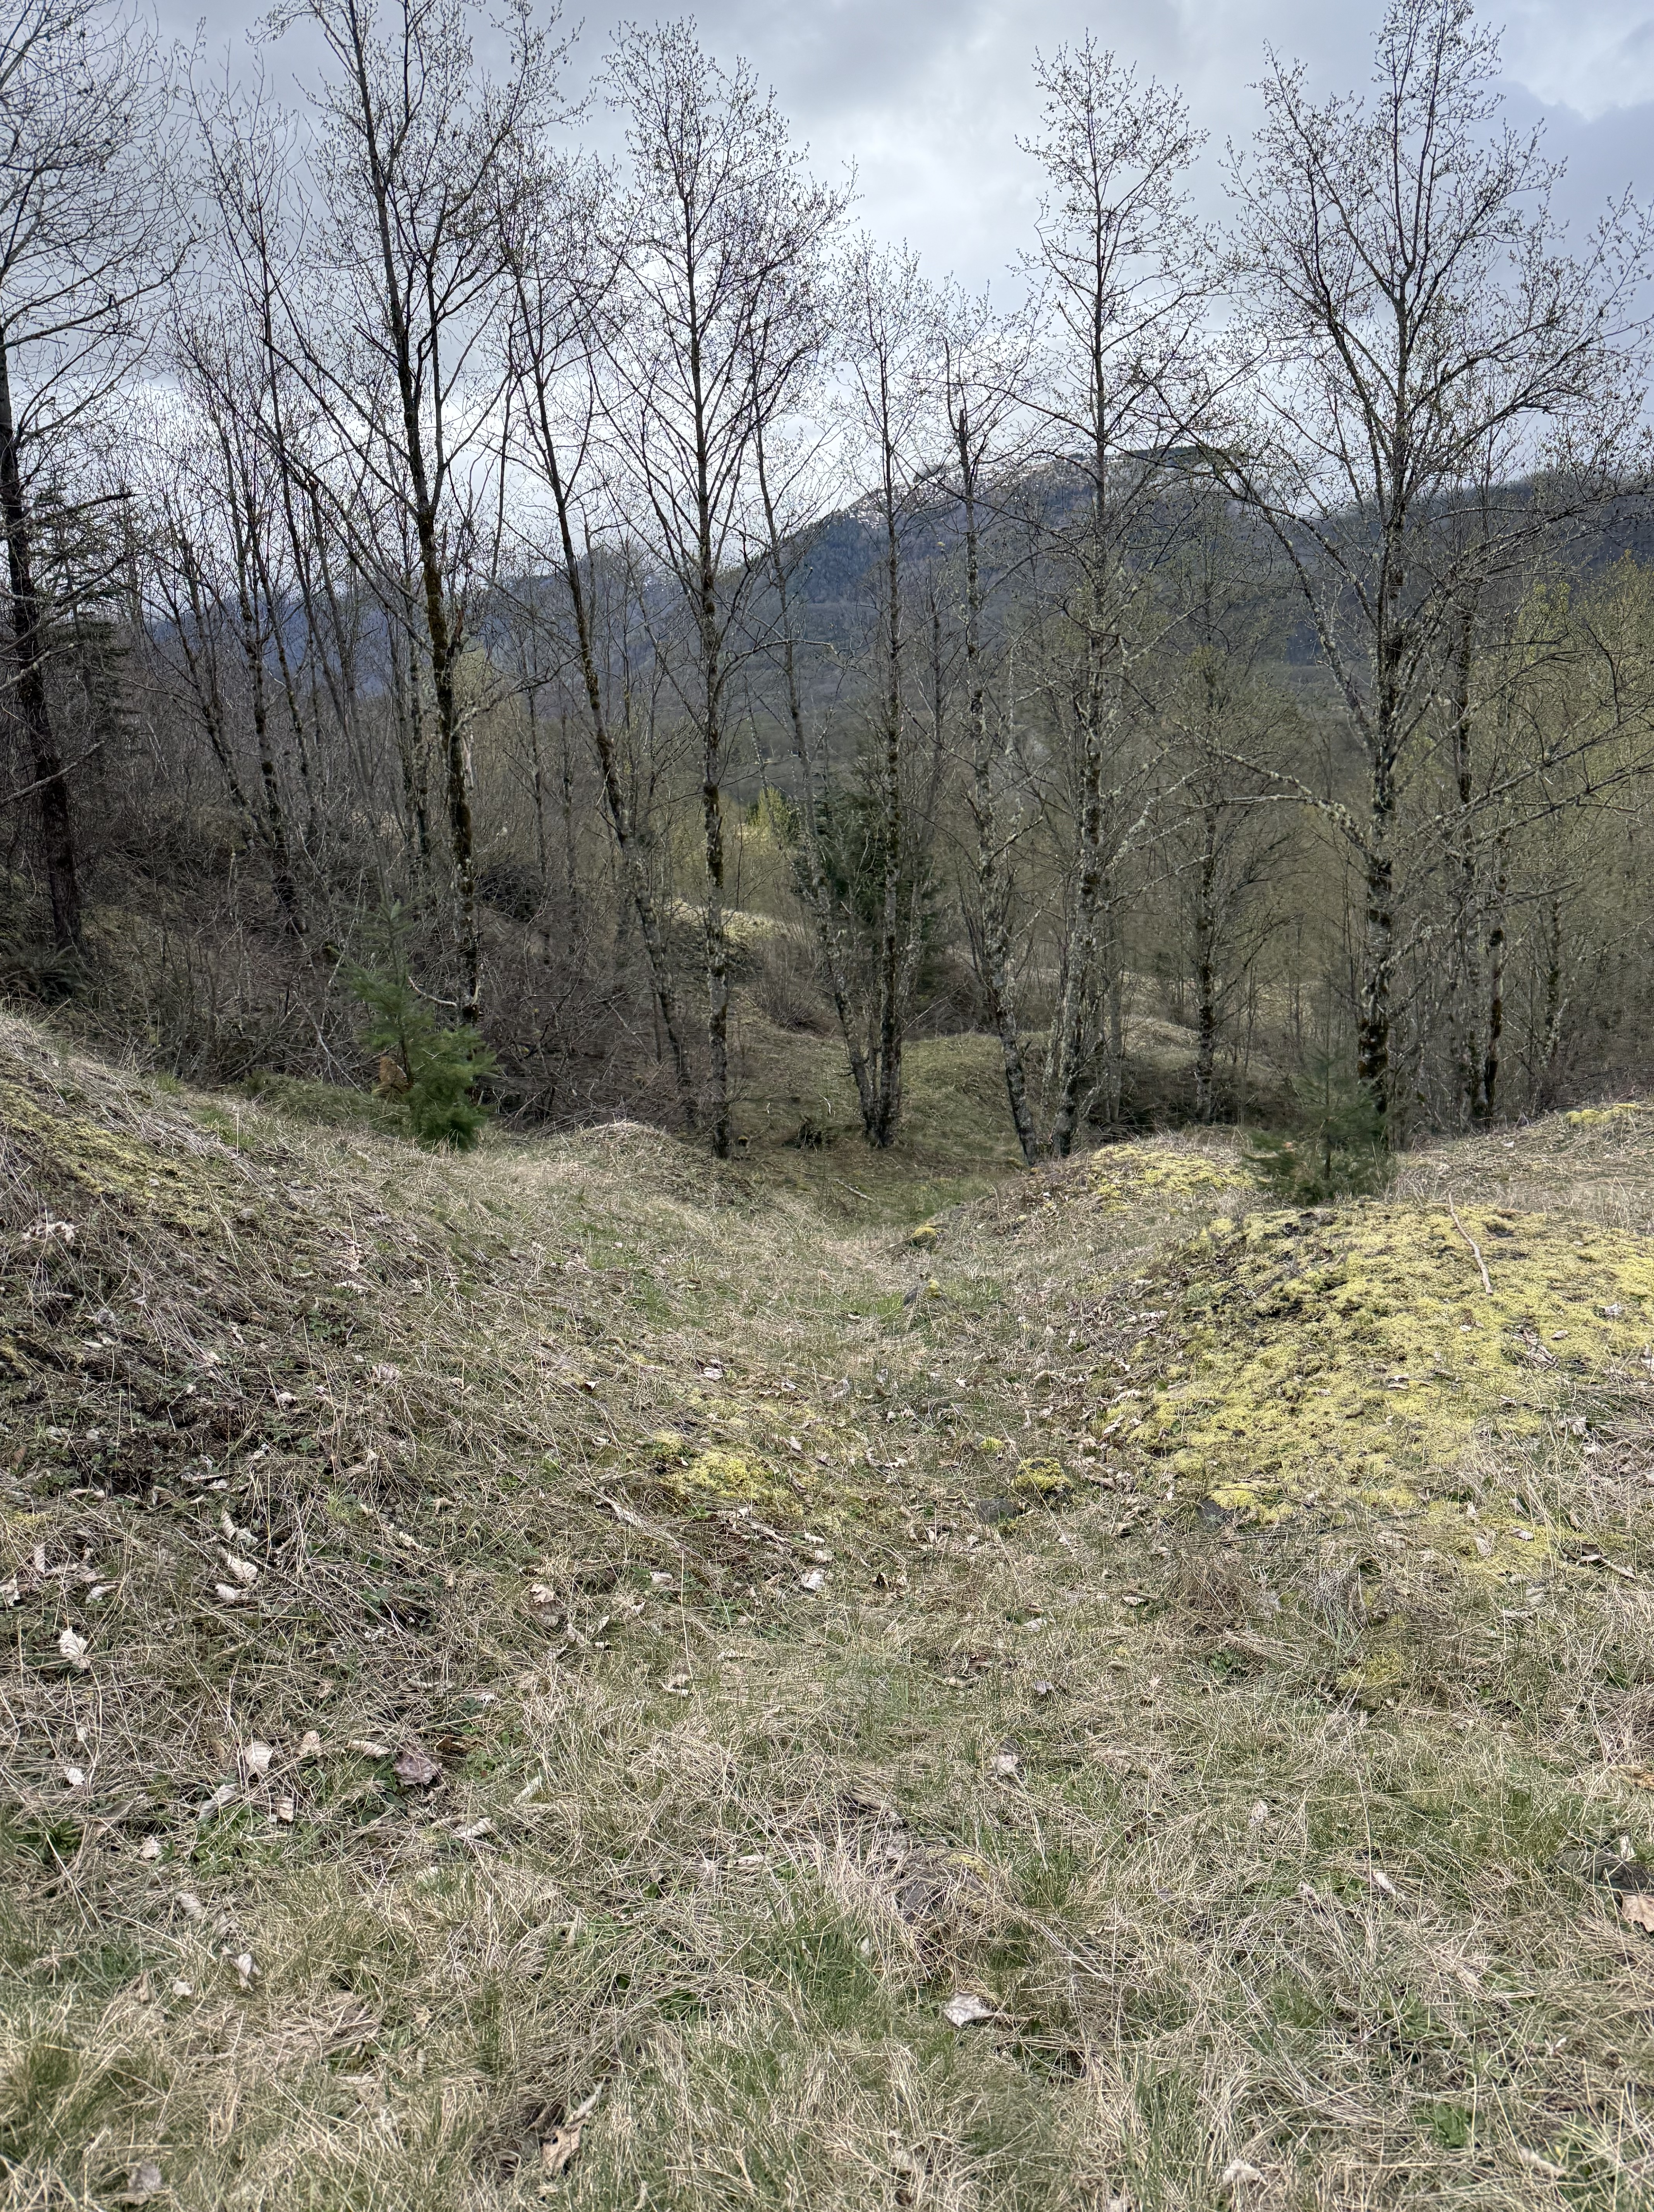
Figure 11. This photo perfectly captures the topography of Hummocks Trail. This is the northern end of the trail, which is a little higher; the Toutle River (North Fork) is more distant and the cliffs we saw in Fig. 8 have receded, replaced by moderate slope; however, note the fine-scale nature of the hummocks here. They are ubiquitous but contain only a few scattered boulders.
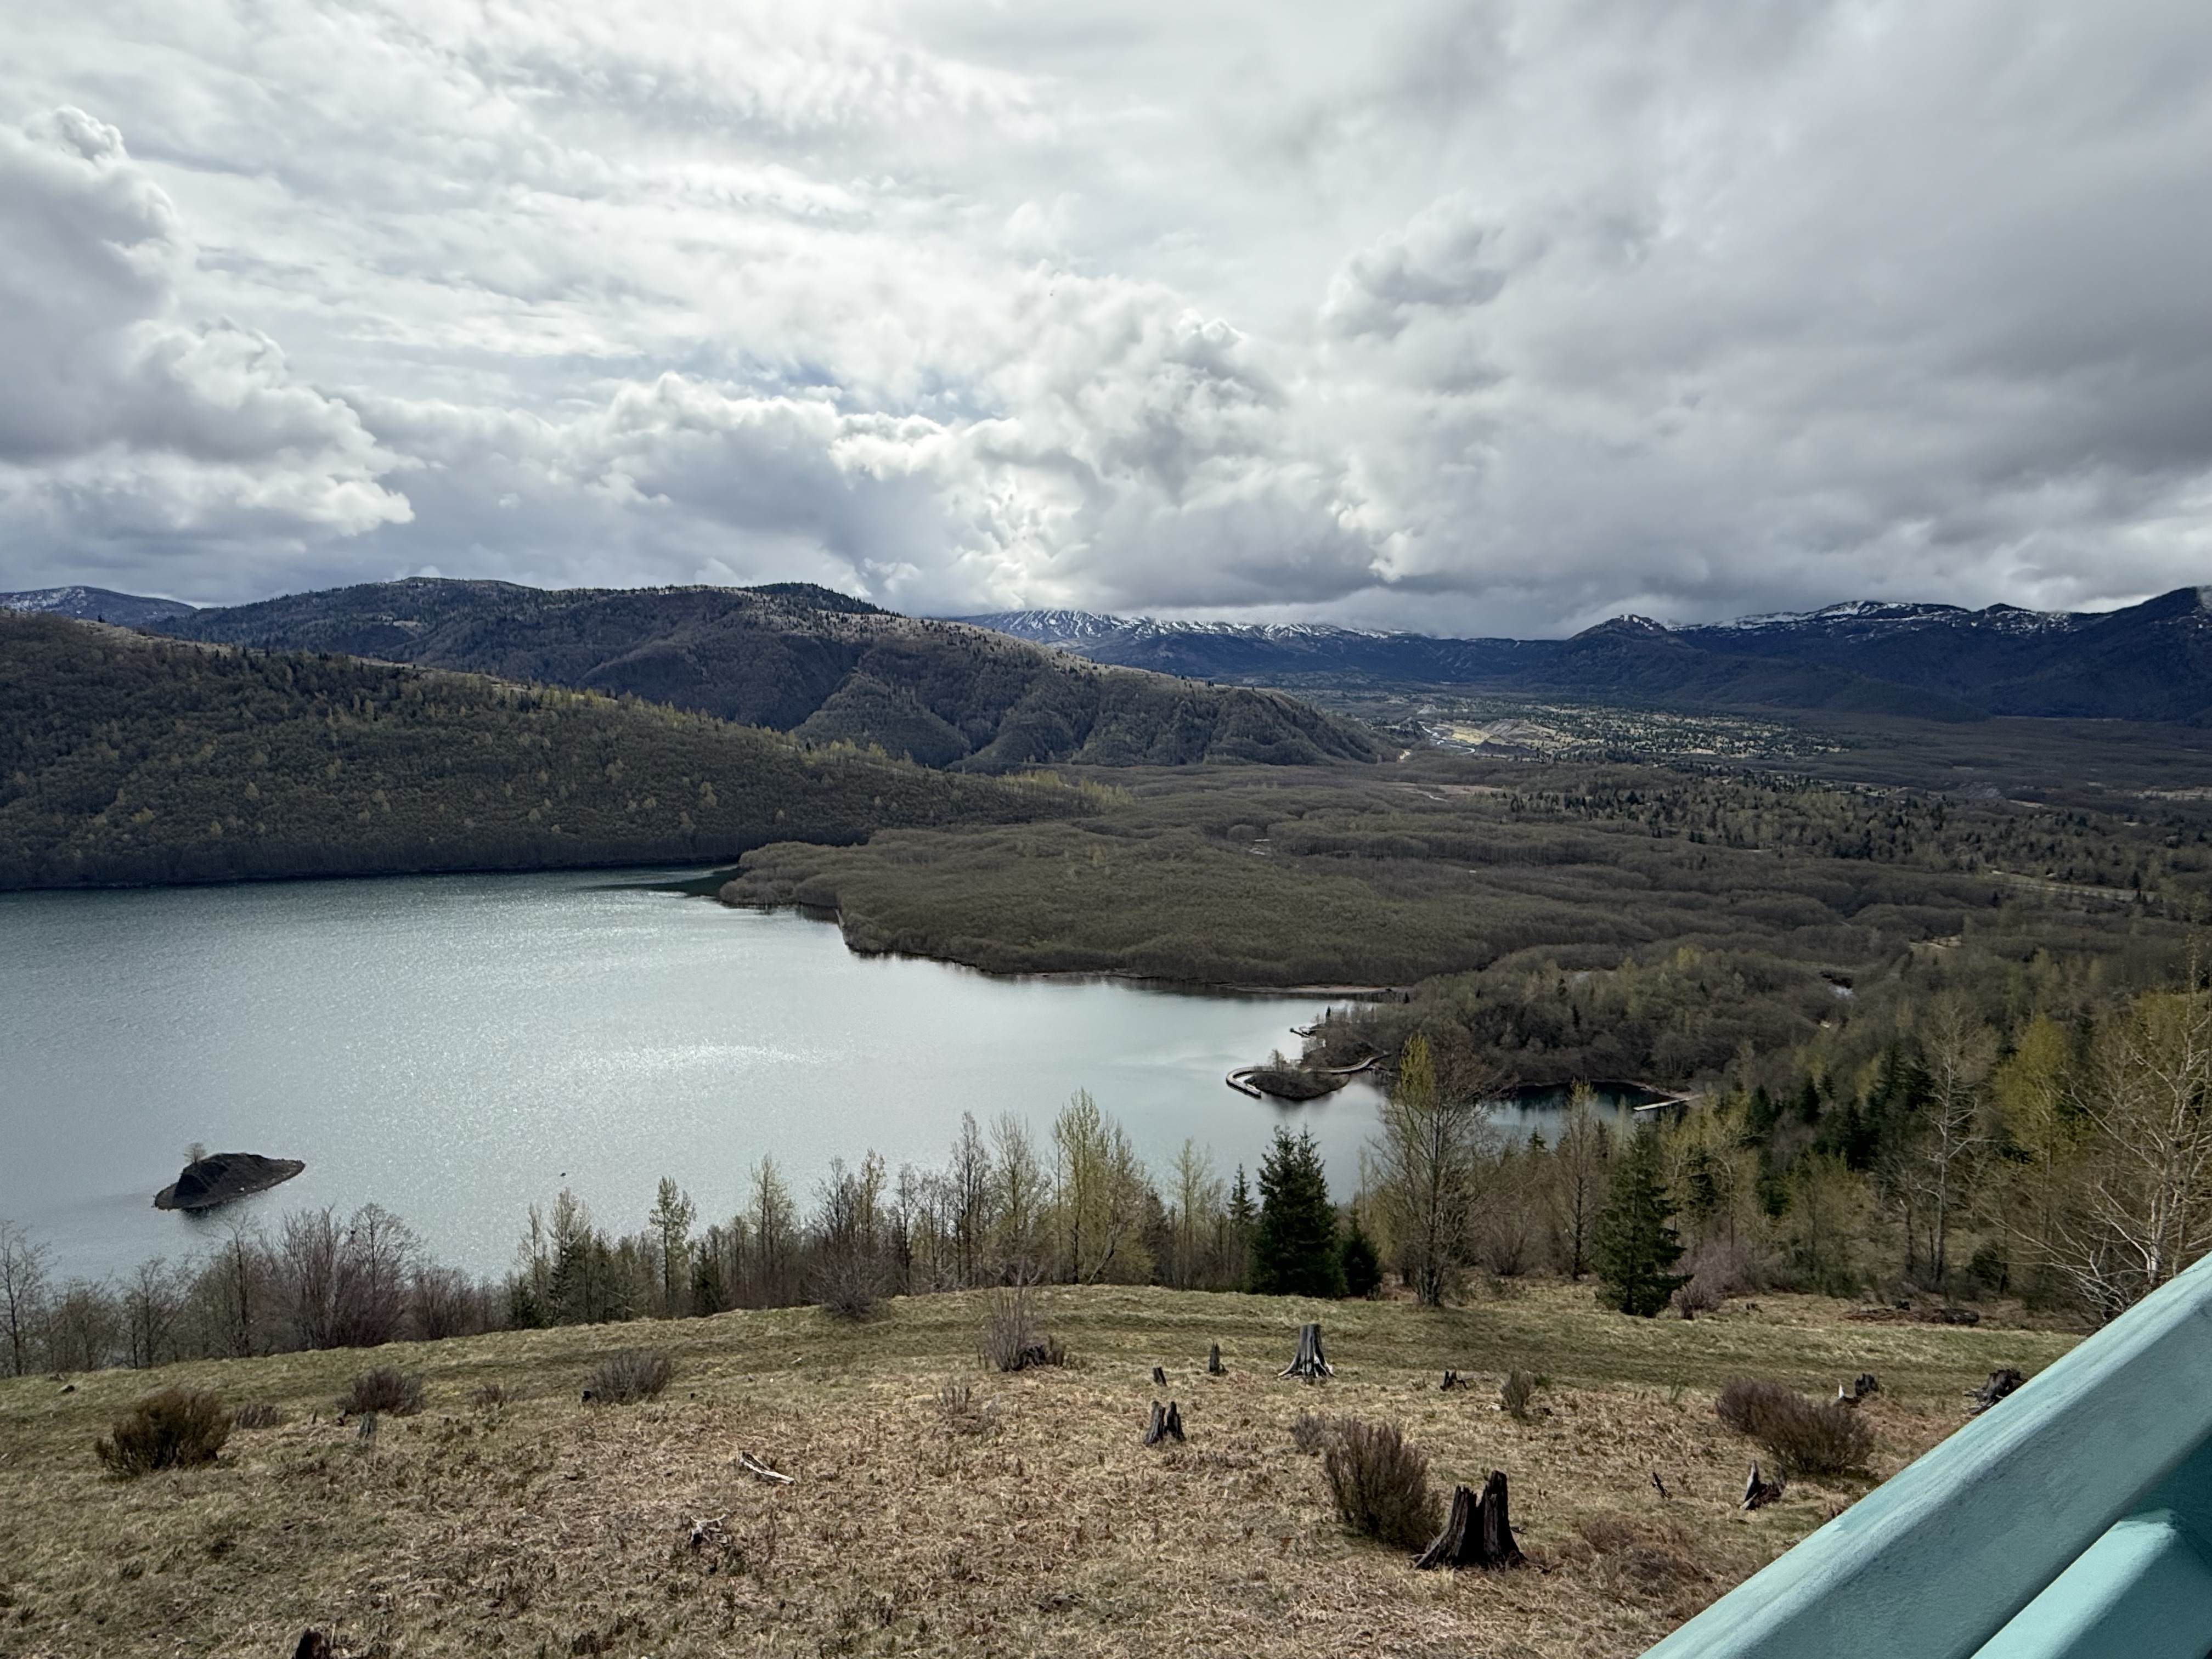
Figure 12. This is a view of Coldwater Lake from the visitor center, looking south towards Mount St. Helens. There are two things to note from this image: 1) the Toutle River valley is a broad, flat plain because it was filled with debris from Stage1; 2) the overflow deposits (e.g. Video 1) have blocked the lake and raised its level. The source of water we saw in Fig. 10 is evident in the center of the photo. This isn’t a sedimentary dam, created by flood deposits, or even a glacial dam produced from the debris scraped up by thick ice sheets. The shoreline was modified when Mount St. Helens collapsed and then exploded with unbelievable violence.
Final Thoughts
The eruption of Mount St. Helens in 1980 gave geologists a rare opportunity to see how Earth produces sausage. Let me explain my metaphor.
Ocean crust is denser than continental crust it encounters at a convergent plate boundary, and at a lower elevation. It is thus overridden by the continent, forcing it to dive into denser and hotter rocks at depths of hundreds of miles. This obviously displaces hot and ductile rocks, heating the subducting rocks even more; the sausage-making operation has begun. Still pushed from behind by the conveyor belt of oceanic crust being subducted, this basalt/gabbro mixture heats enough to boil off the water contained in its sedimentary cover as well as any constituents with a reduced melting point (e.g. silicon-rich minerals). This superheated material rises through tens-to-hundreds of miles of crust, heating it and producing a mixture of oceanic and continental crust.
Plate tectonics keeps turning the crank on the sausage machine for tens (even hundreds) of millions of years. The molten mass of magma keeps rising because it is less dense than the rocks through which it is passing, until the pressure has decreased enough for it to find cracks in the solid crust. The magma fills these cracks, which often lead to fissures in the surface; the magma erupts. The magma cools and begins to solidify, forming a pluton at depths of several miles to tens of miles.
This process keeps operating, in fits and starts, until the tectonic plates change direction. In the meantime, the upper crust has been filled with multiple plutons (solidified magma chambers), sometimes squeezed into the volcanic rocks from previous eruptions. Individual magma chambers/plutons are about one mile in diameter, although they take many shapes, and remain active for less than one-hundred-thousand years (often much less). These are injections of fluid rising through weak points in the crust, driven by pressure paths–not missiles launched from the mantle. They are like the sweat on your brow after a hard workout.
Mount St. Helens has released a lot of pressure, although it is still very dangerous at human scales. Chances are that this magma chamber will solidify within the next hundred-thousand years; but the unstoppable sausage machine will continue cranking out more mixed material in a molten form until it has filled every nook and cranny in the upper crust. That’s how mountain ranges like the Sierra Nevada were formed. It takes a really long time.
Mount St Helens probably won’t erupt again at the scale of the 1980 event, but that doesn’t mean much if you happen to be camping near the caldera when a smaller eruption occurs. After all, the magma chamber is still extruding lava in an unsteady process that is currently pretty slow. However, we humans can’t see fractures in bed rock; thus, the next and the next, etc, magma chamber could appear anywhere from Northern California to British Columbia. There are plenty of young volcanoes in the Cascades that haven’t blown their tops yet.
Who’s next?
Cape Flattery: Conglomerates at the End of the World
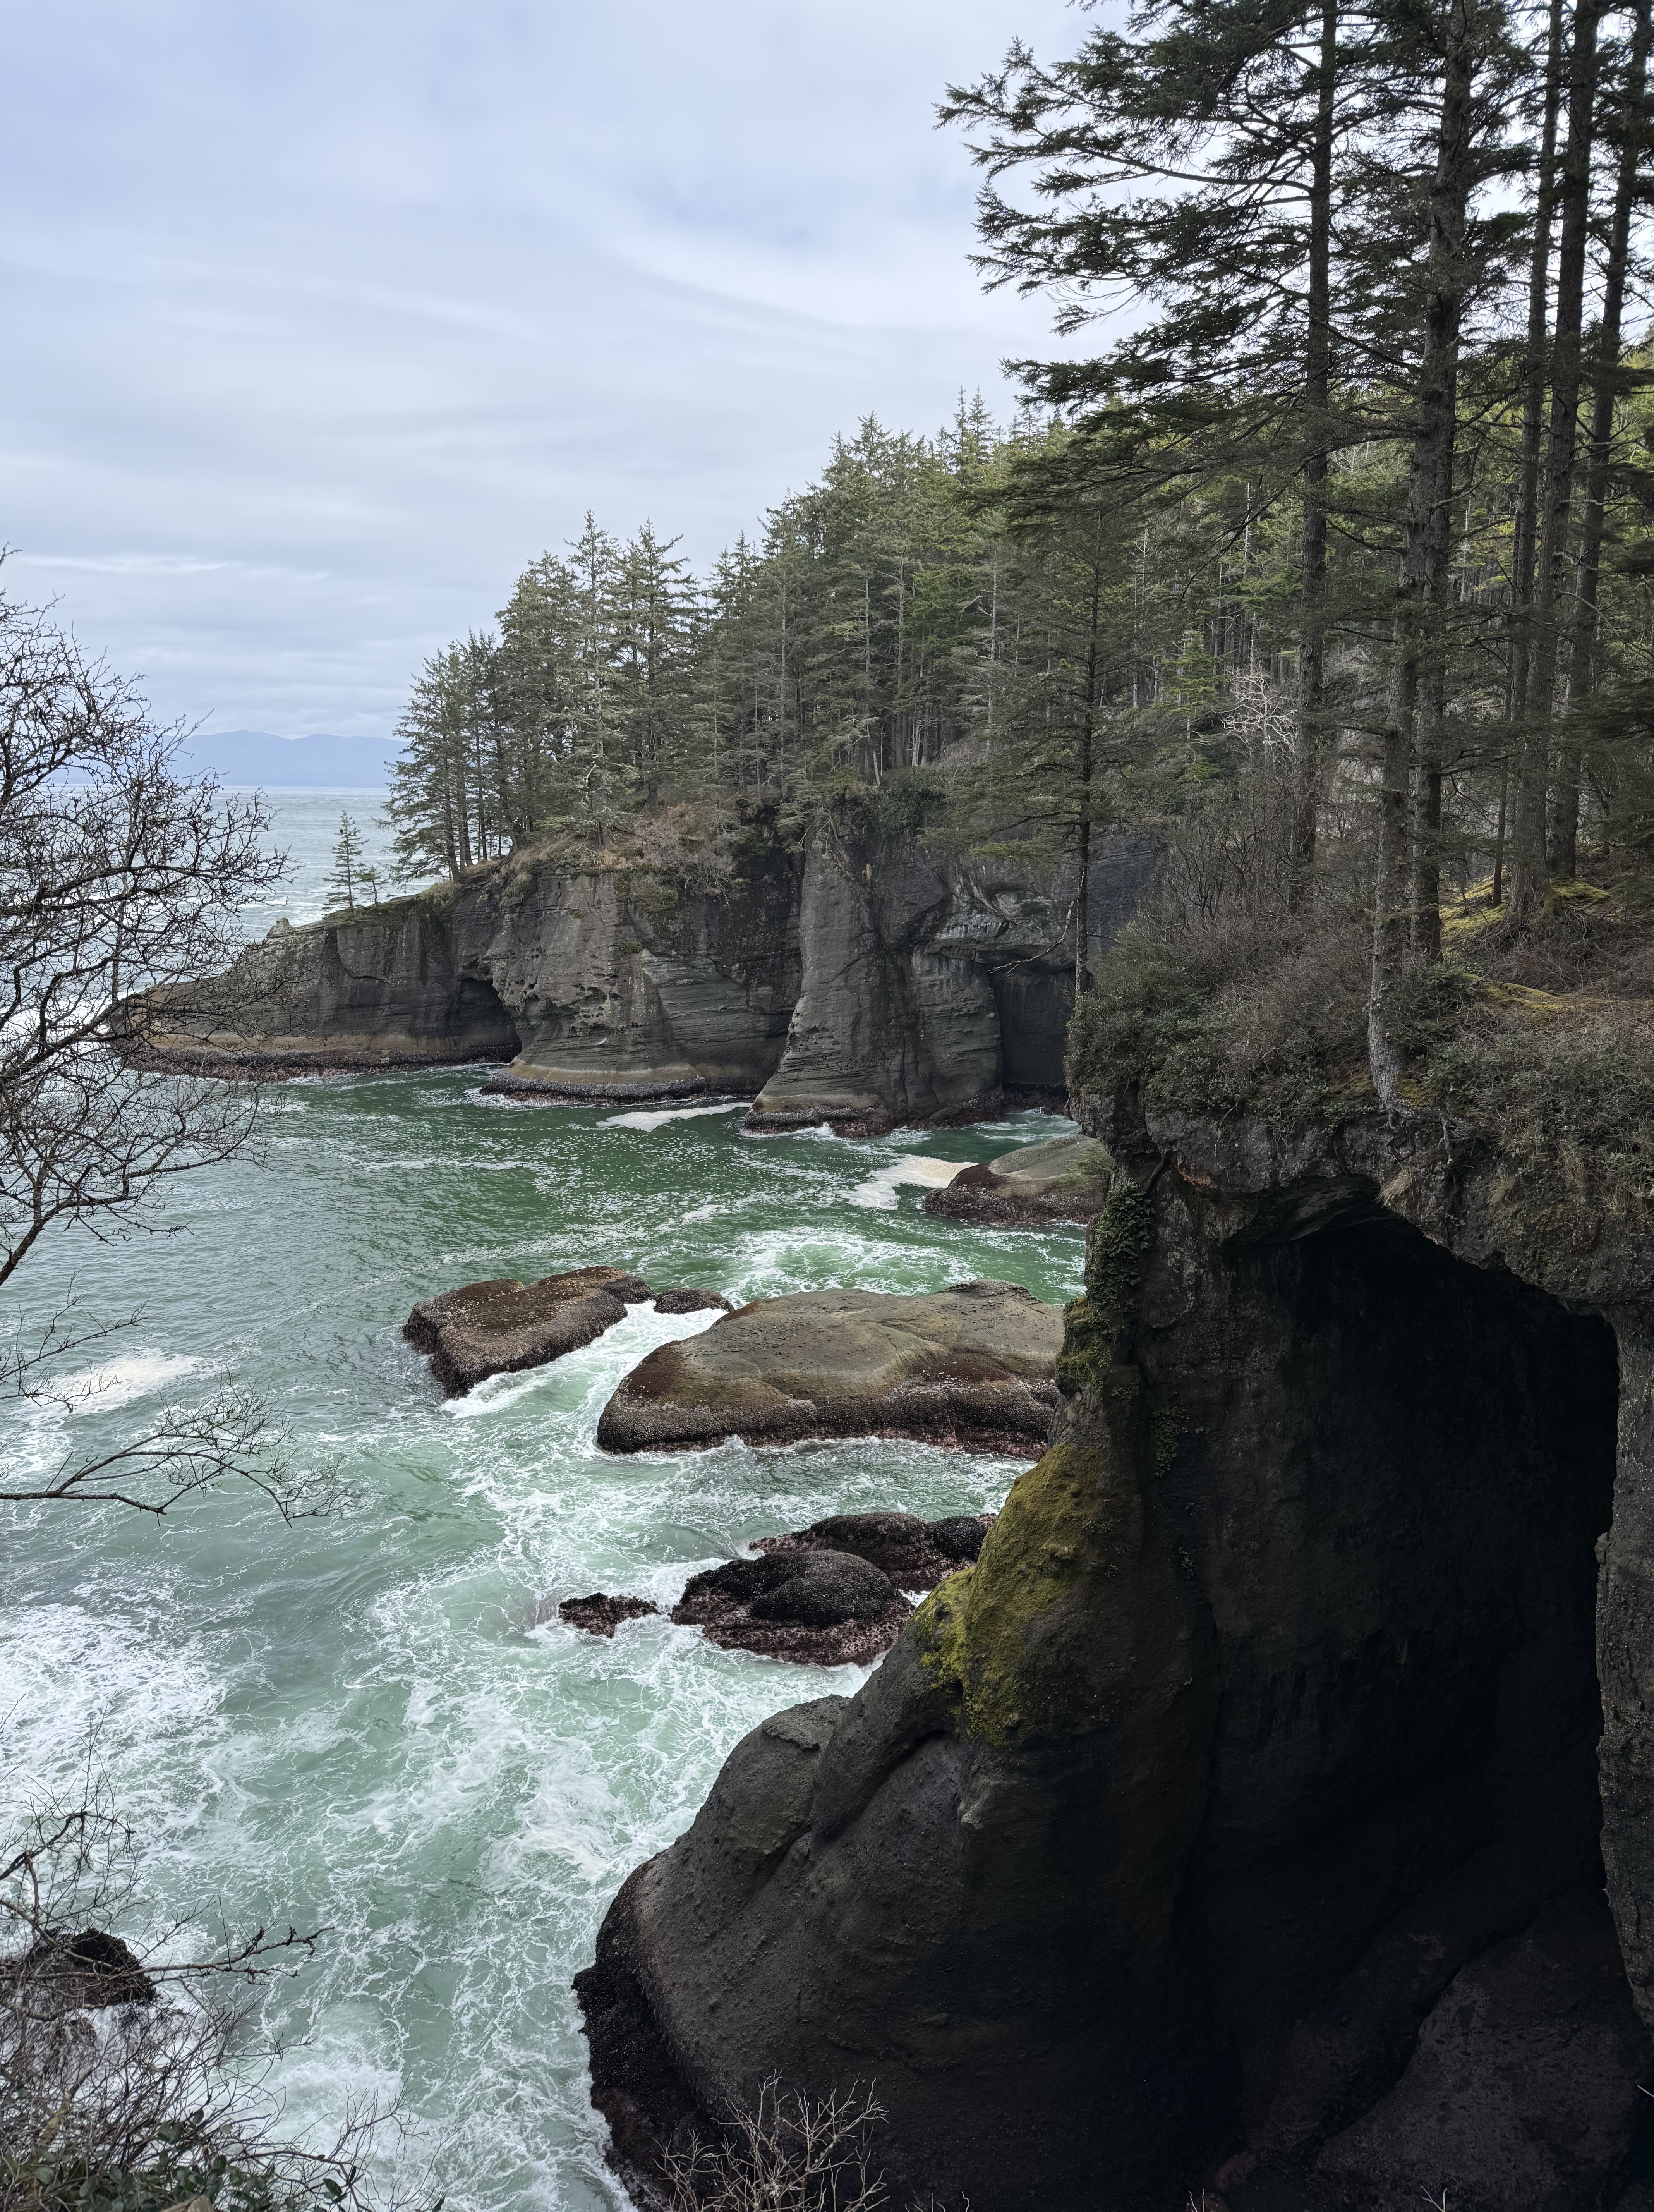
Figure 1. I ran out of road and land, ending up at Cape Flattery on the Makah Reservation. This is Location D in Fig. 2. A half-mile hike down a boardwalk took me to the end of the world, where the cliffs are about 80 feet above sea level. This photo is looking northward towards Vancouver Island, Canada, in the distance. Wave action has cut a wave terrace, a seen in the center of the image, and a series of sea caves.
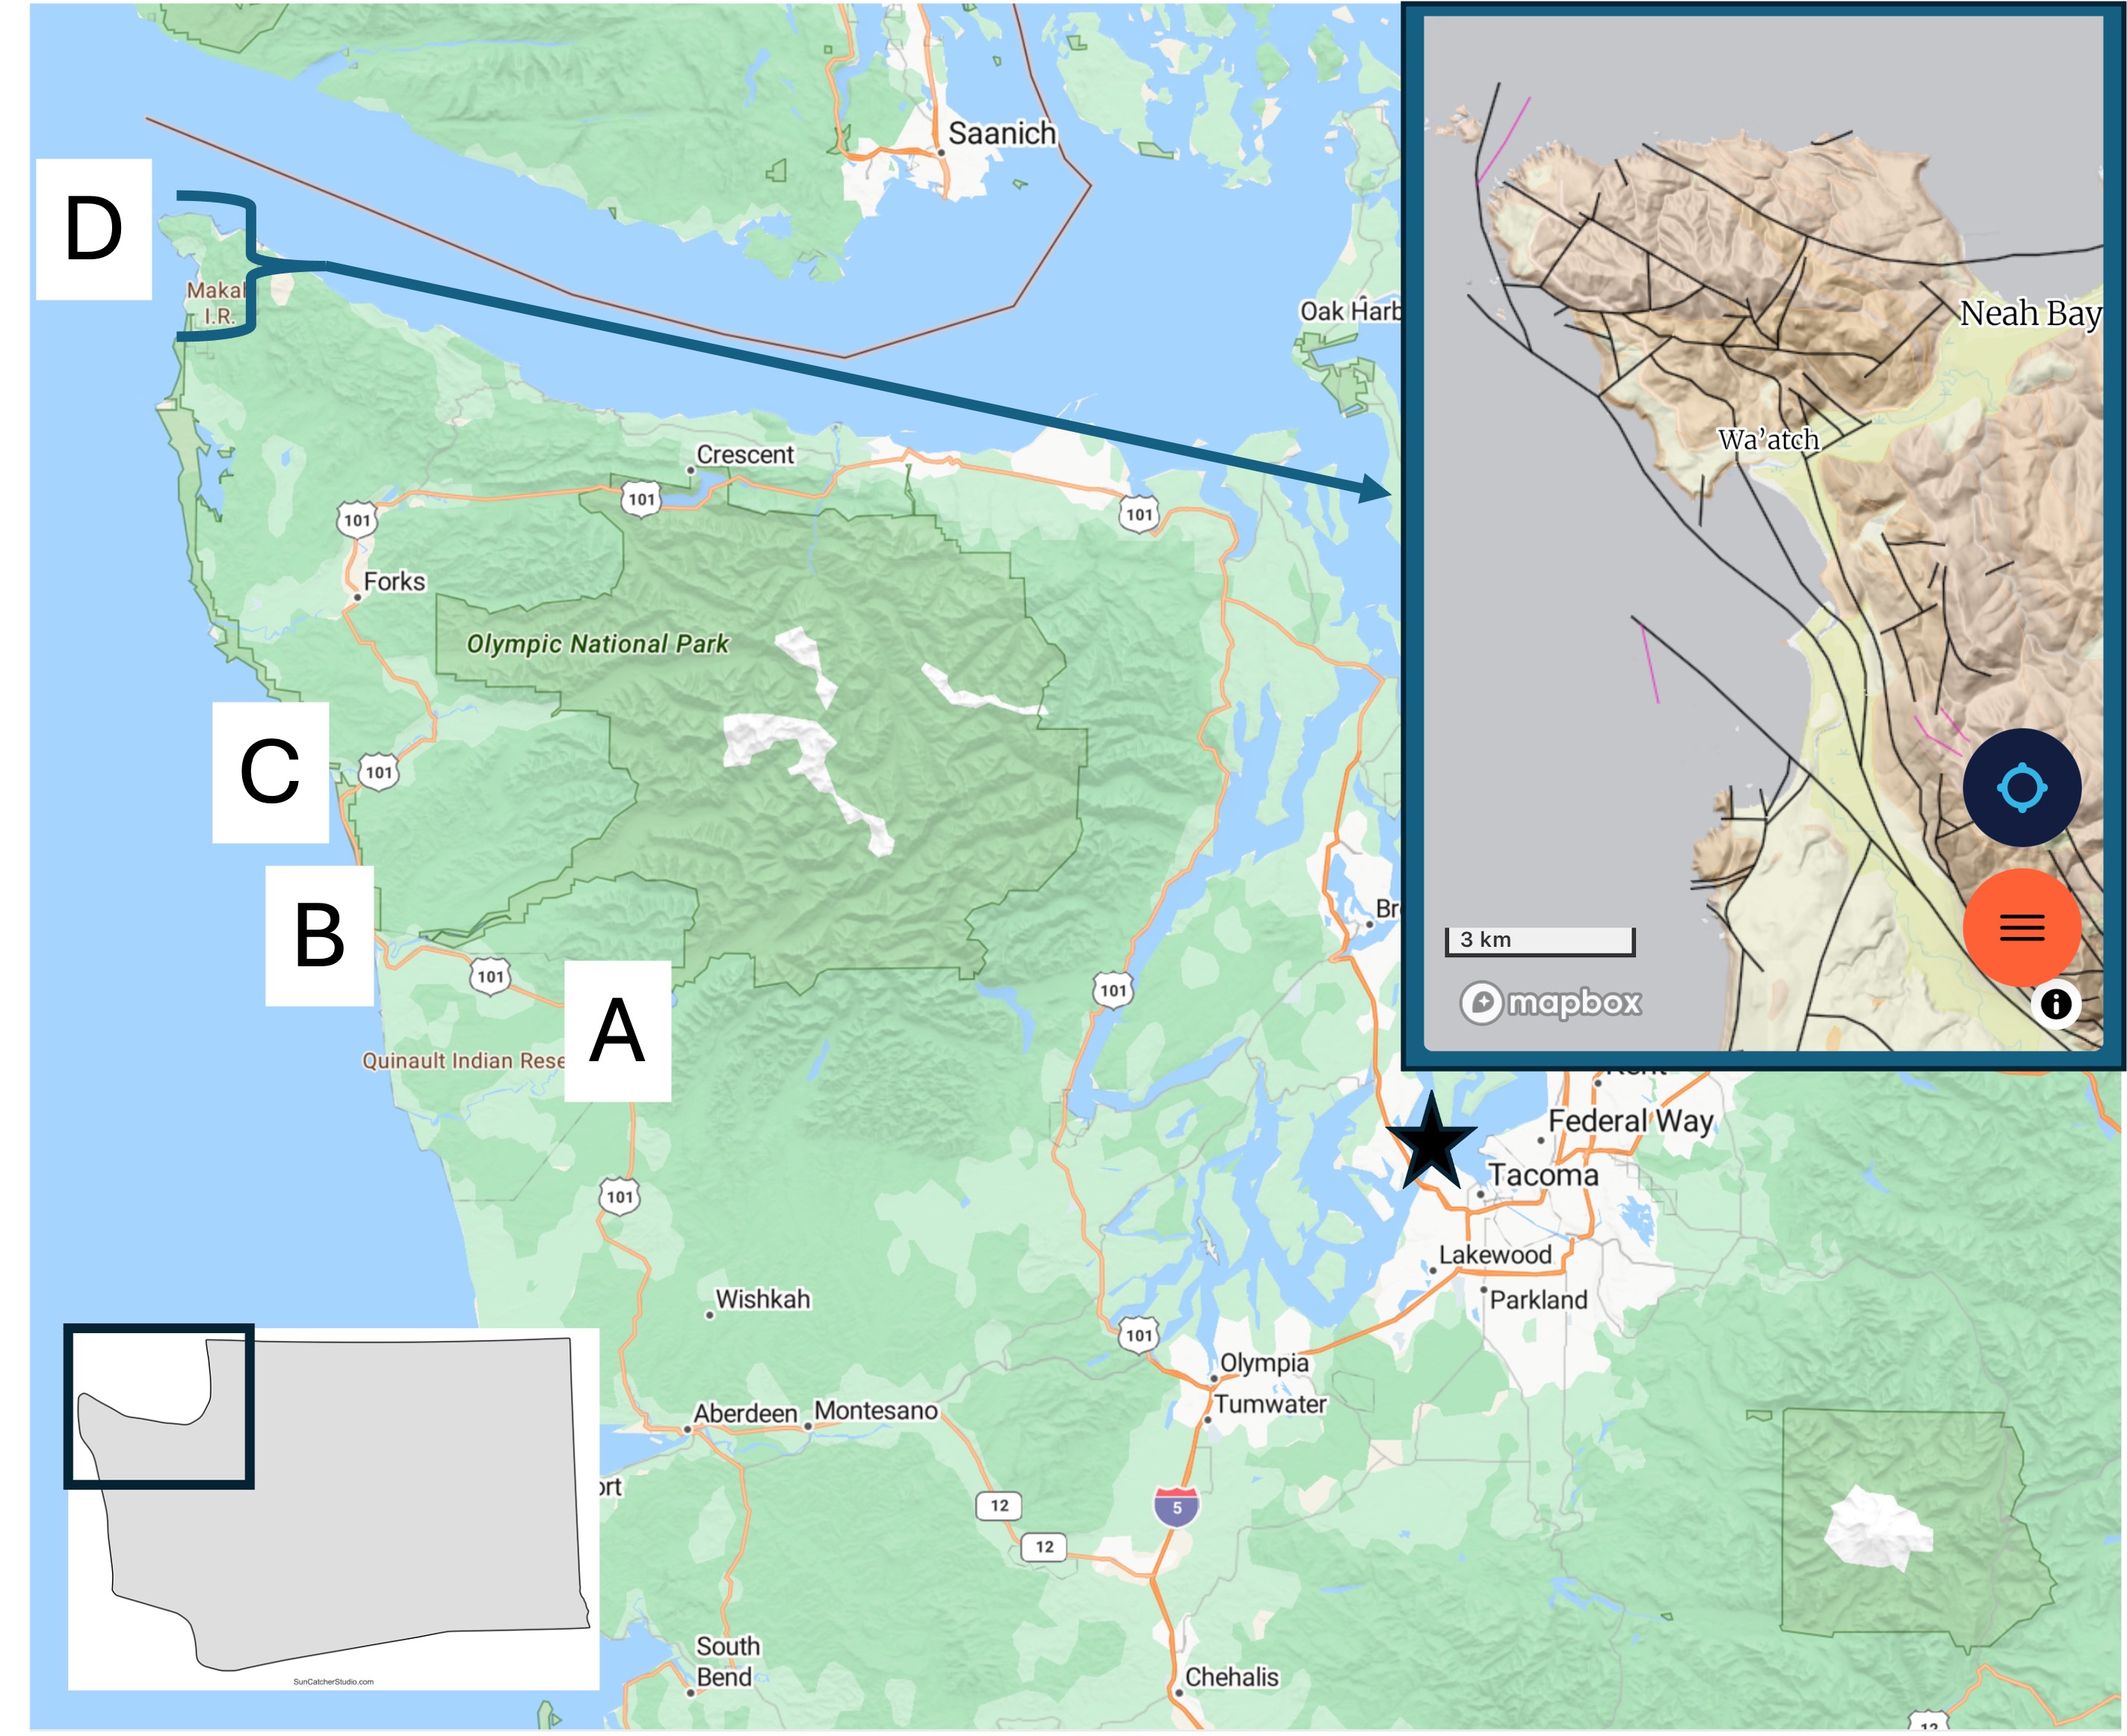
Figure 2. Today’s post takes us to Site D, which is shown in a geologic map from Rock D in the inset map. The rocks are a mixture of sandstone and conglomerate of Eocene age (56-34 Ma). This is the same time that the lower Cascades were being created east of Puget Sound. Note the large number of faults (thin lines) shown in the inset map. Many of these are strike-slip faults with motion of the opposing crustal block to the left, which would explain why the sedimentary layers in seen in Fig. 1 are almost horizontal, dipping slightly towards the sea.
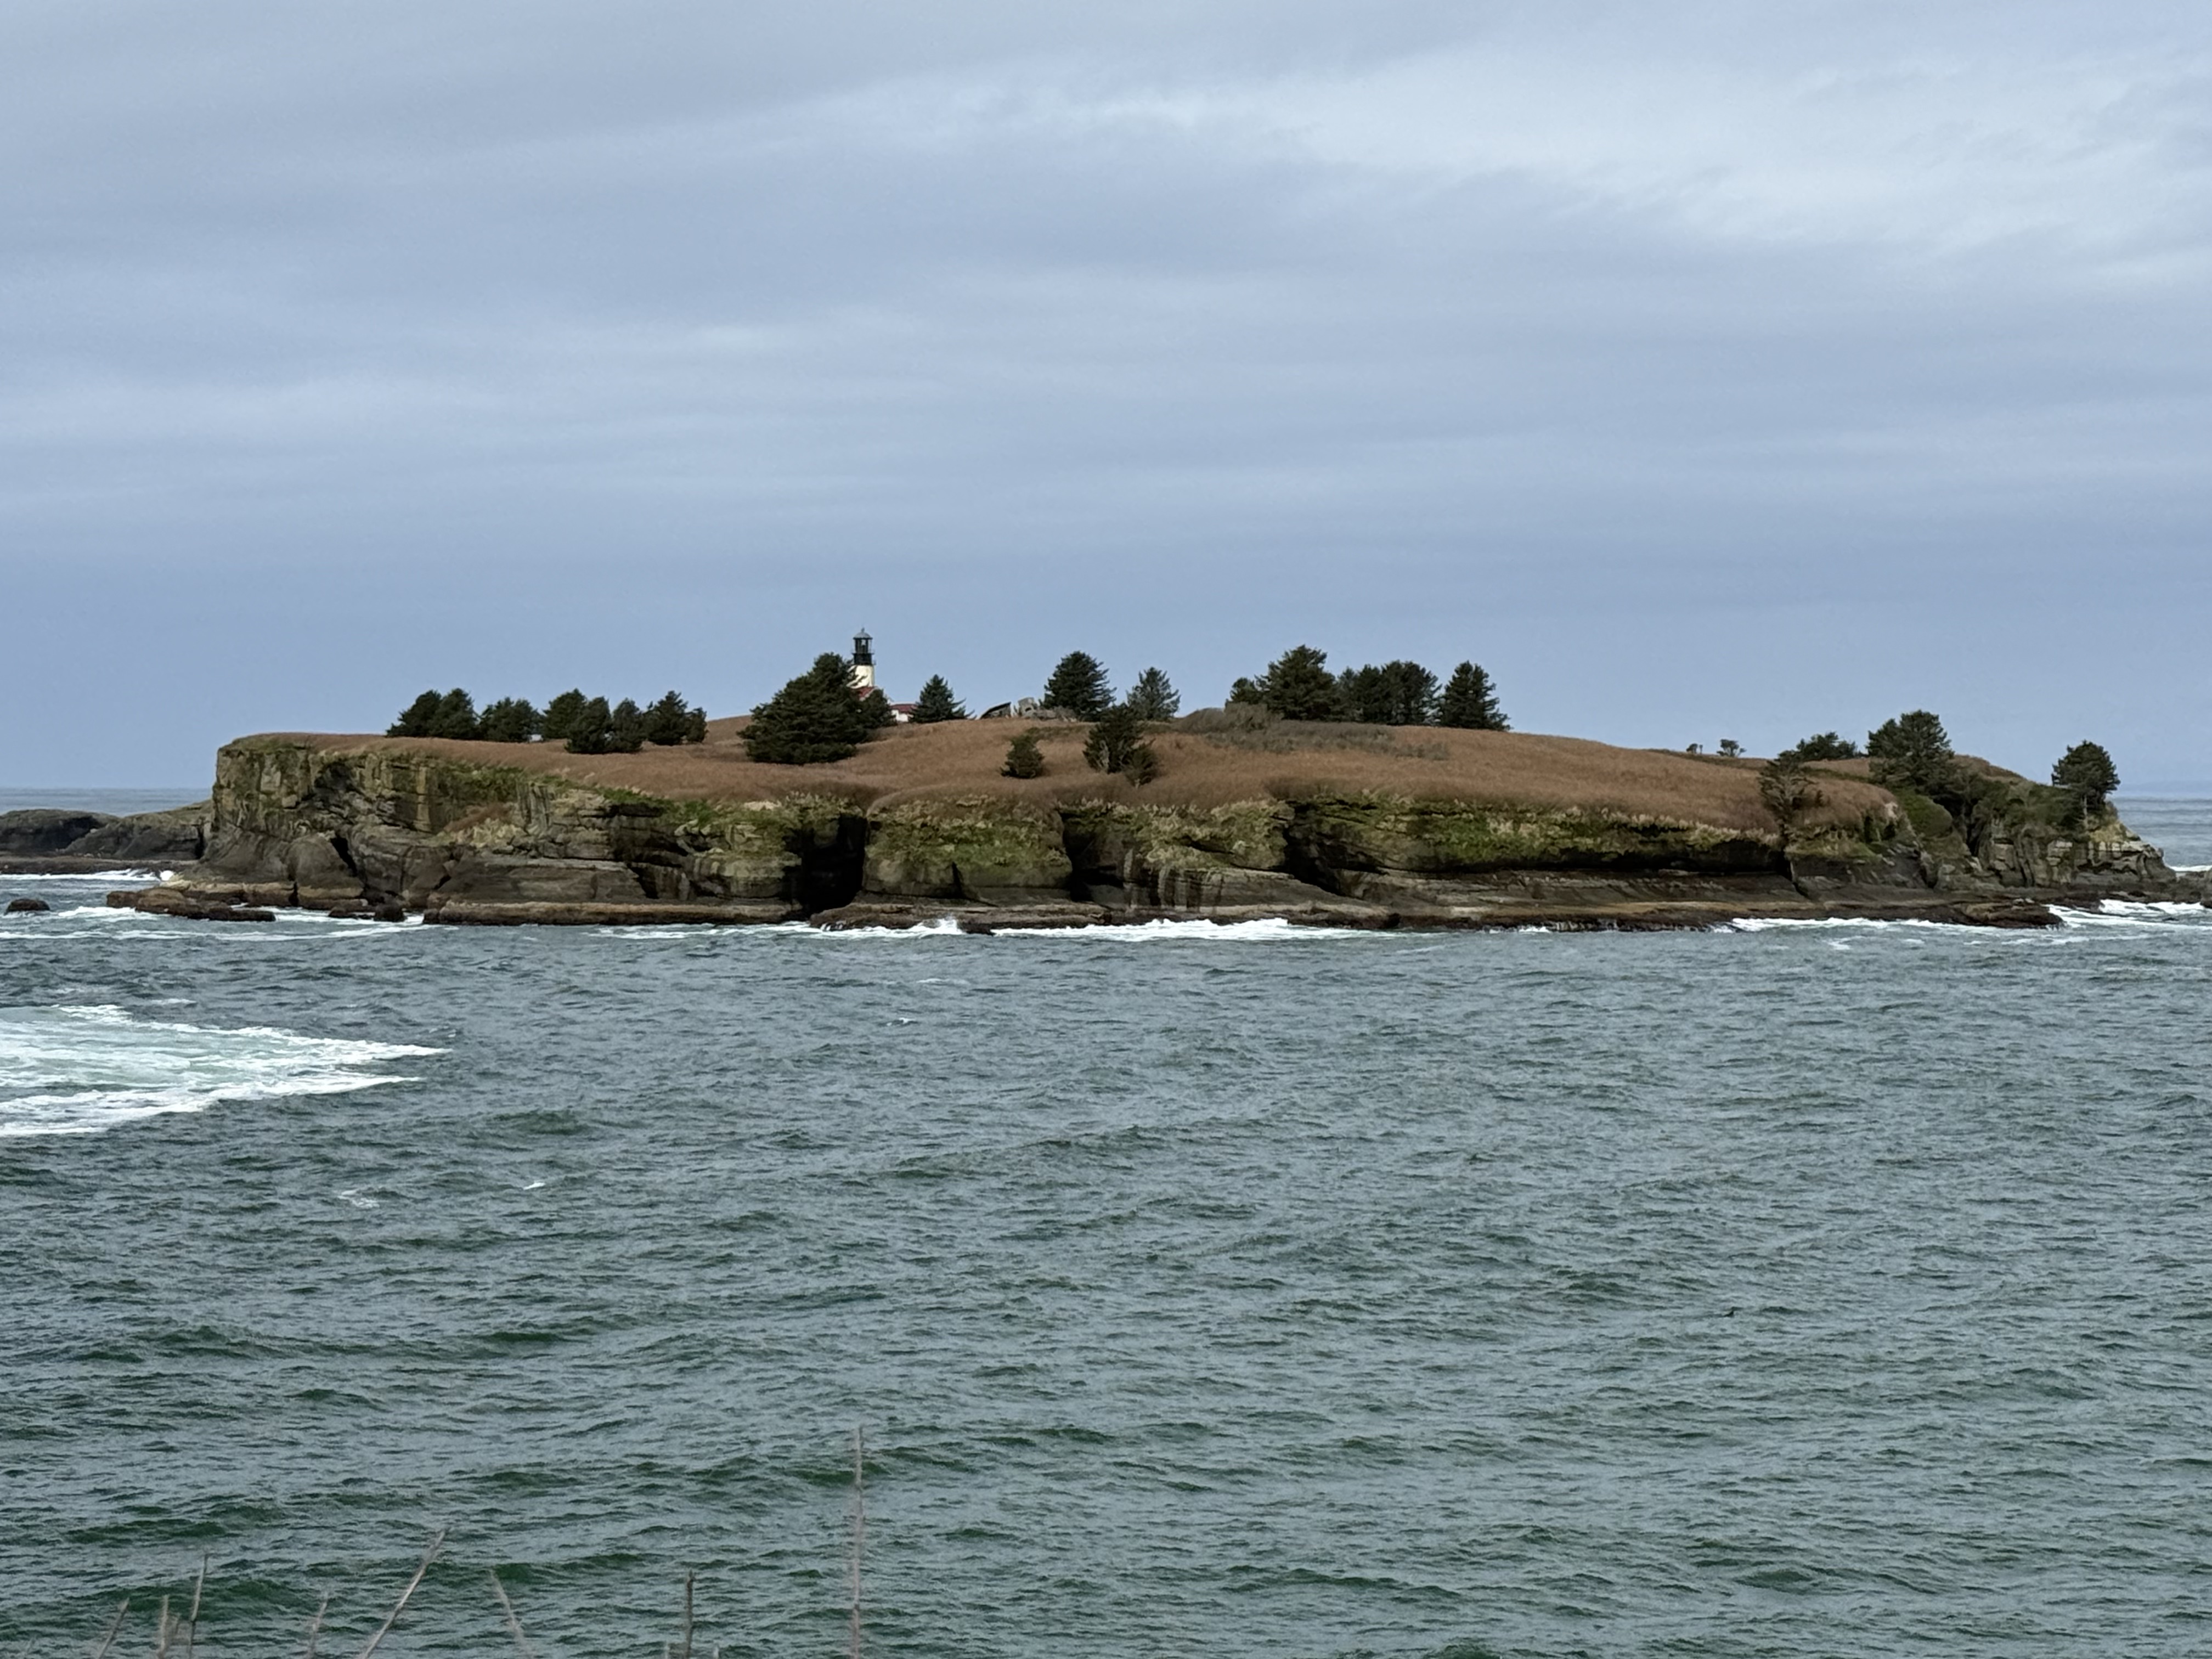
Figure 3. The sea stacks seen further south have been replaced with rocky islands like Tatoosh Island, which has a light house. Pacific Ocean seafloor (Juan de Fuca tectonic plate) is being actively subducted along the Washington-Oregon coast at about 2 inches/year, but the plate tectonic geometry is complex in this area. This could partly explain the large number of faults seen in Fig. 2 as well as the high elevation of bedrock. Maybe.
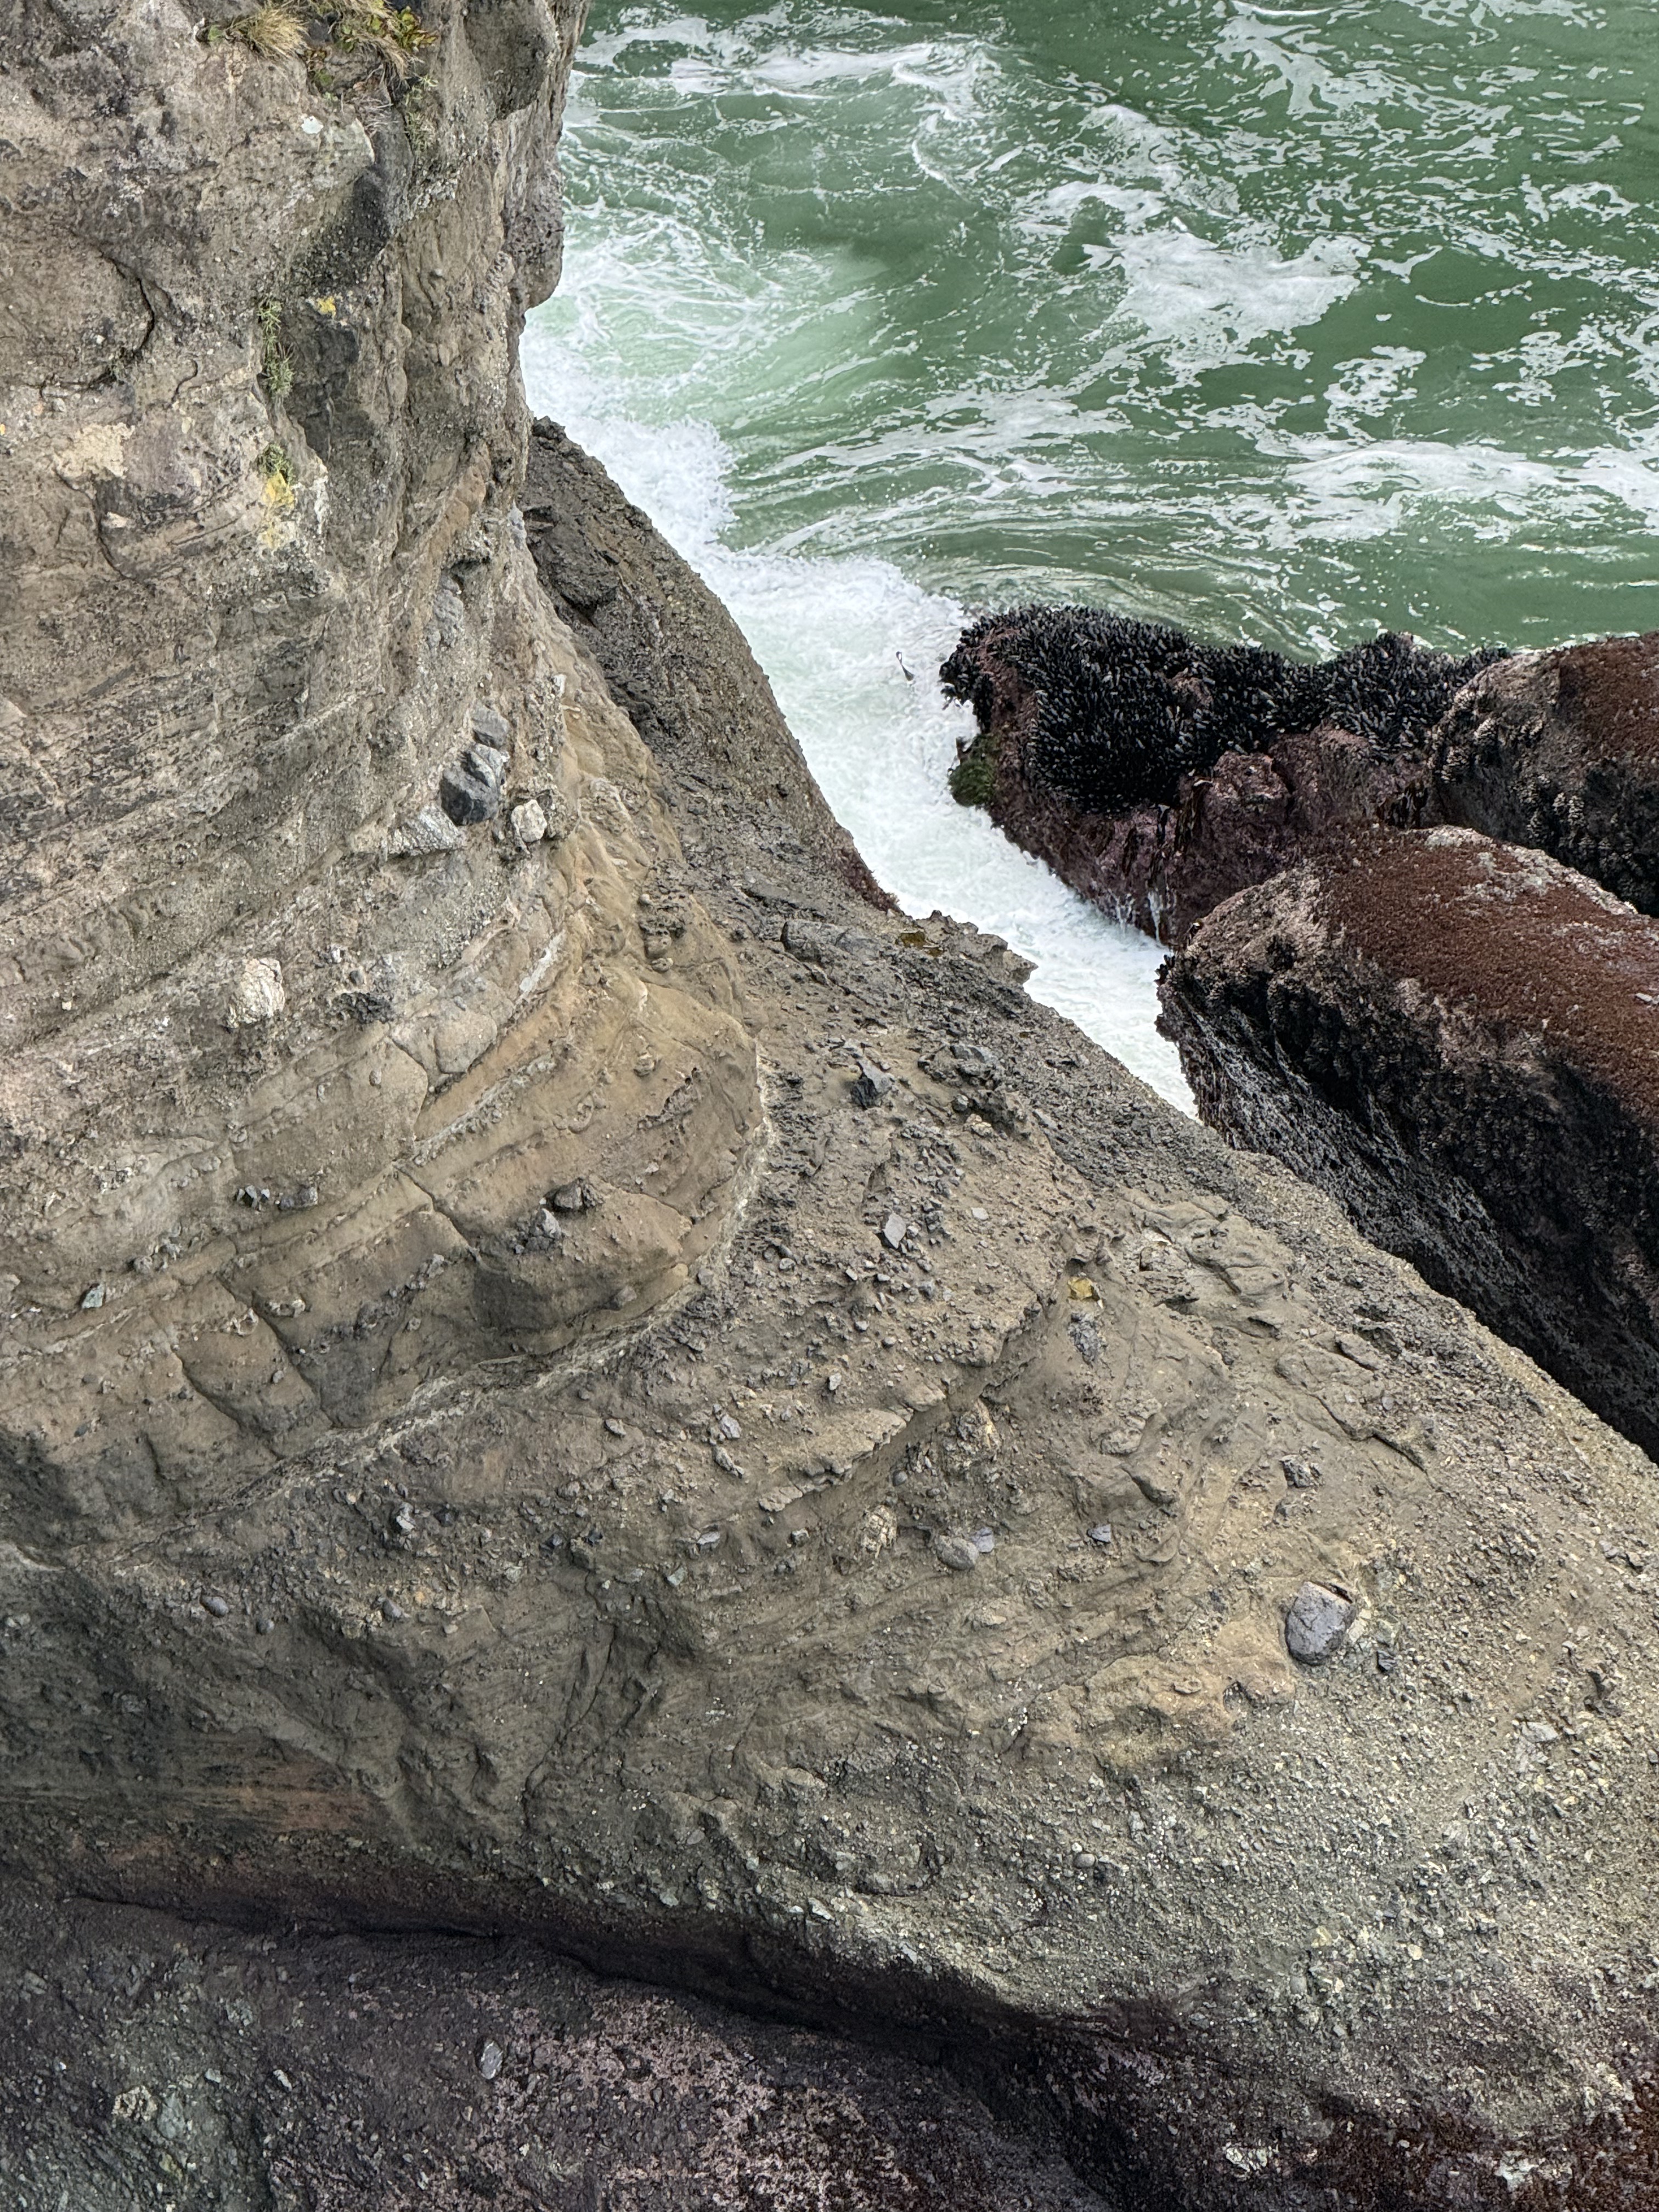
Figure 4. This photo was taken looking down towards the wave-terrace on the south side of the lookout point. For scale, the largest boulders are a couple of feet long, based on exposures at the surface of the trail. This is a textbook tectonic breccia. However, note that most of the rock fragments are rounded, so they have been transported some distance before reaching their final resting place. Some of the layers are relatively uniform with a few large boulders whereas others resemble the cobblestones we saw at Ruby Beach. Each bed might represent a single depositional event (like a landslide) or accumulation over years. These are marine rocks, deposited on a submarine fan, probably as turbidity flows. The process that created them is occurring now a few miles offshore, where the rocky outcrops we saw are eroding and supplying large and small fragments to a steep continental shelf.
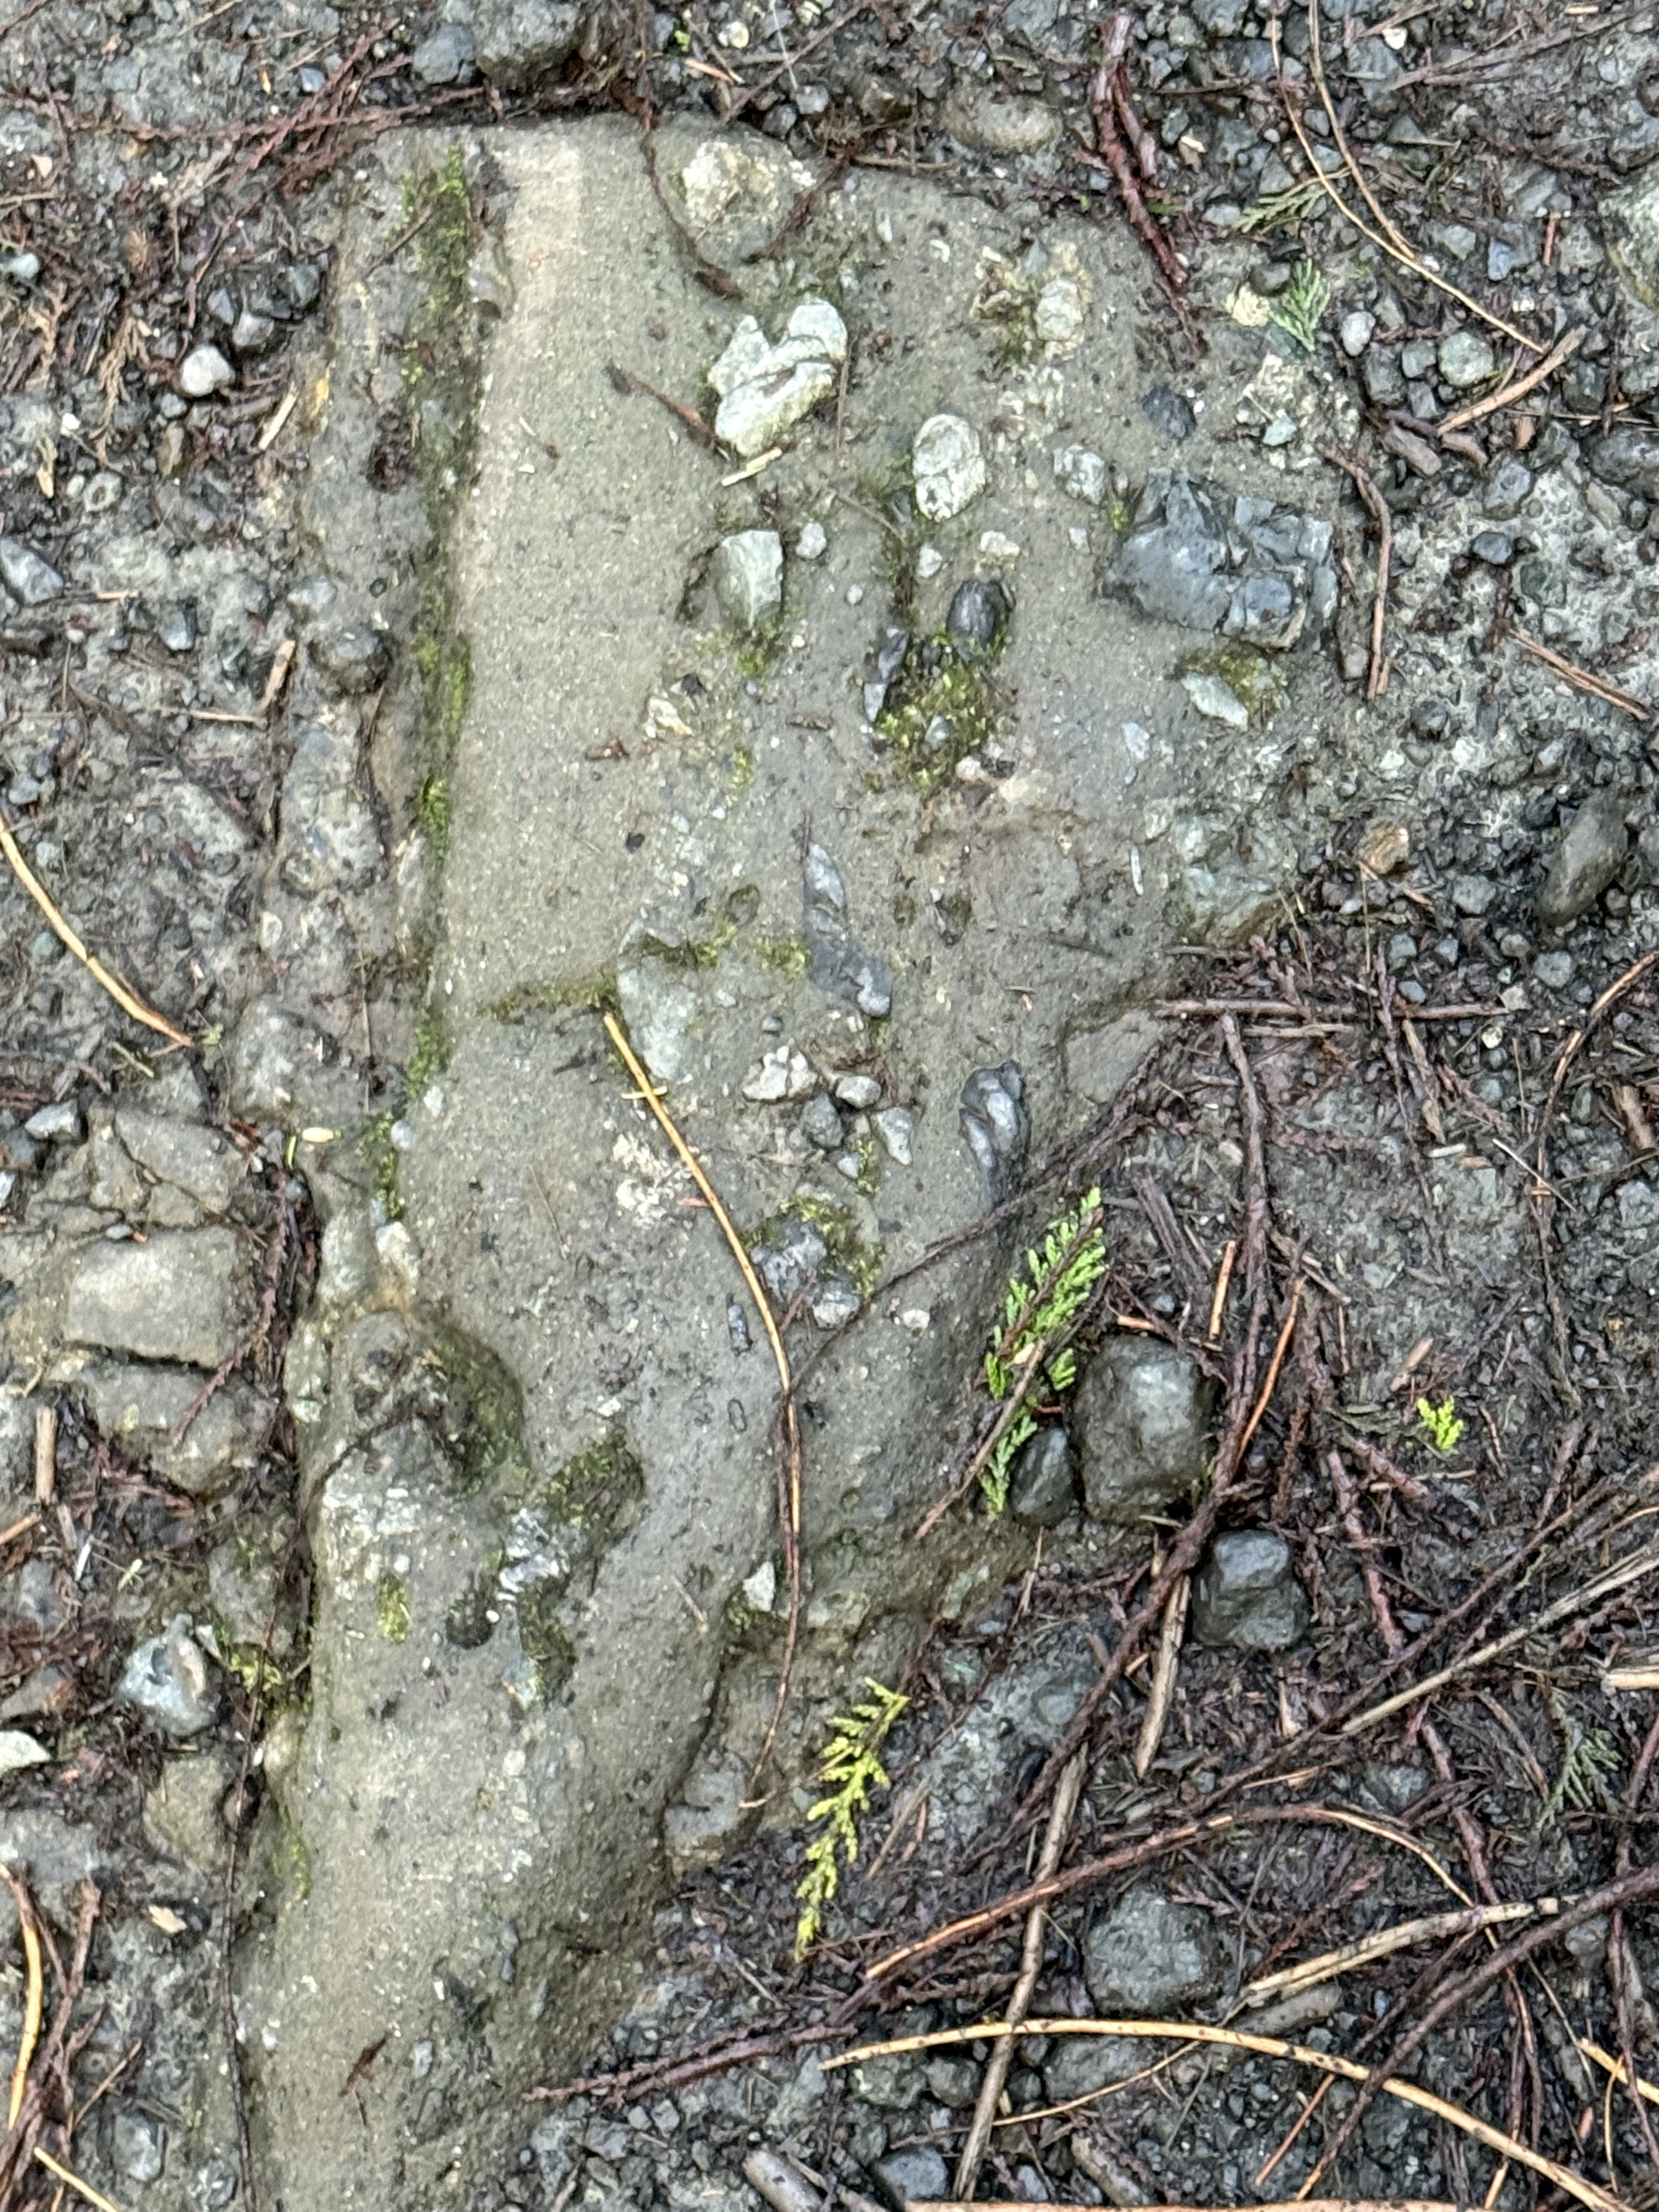
Figure 5. This image looks like run-of-the-mill gravel like you see on pathways and drives, but it is Eocene rock, and I mean solid rock (Note the large, gray piece protruding from the cliff in Fig. 4). This angular slab is about a foot in length. There is no Pleistocene glacial till in this area, even if the ground looks the same. This is a picture frozen in time, where an angular piece of what looks like sandstone, but could be andesite, slid downslope along with smaller fragments.
Summary.
This is the last of my geology posts from a weekend excursion along a hundred-mile stretch of the Washington coast. This is a high wave-energy coast with a tidal range of about 10 feet, the beaches covered with sand and cobbles. Sea stacks protrude from the beach, culminating in cliffs made of 50 Ma conglomerates. Beneath our feet, ocean crust was being subducted at several inches per year, feeding a system of magma chambers that are actively venting through volcanoes like Mt. Saint Helens, Rainier, and Mt. Baker. Rainfall drops along this coast at up to 12 feet per year, feeding streams that carry immense quantities of sediment into the trench created by the subducting ocean crust.
Geology doesn’t get any realer than this…


Recent Comments