Deformed Marl at Knockainey
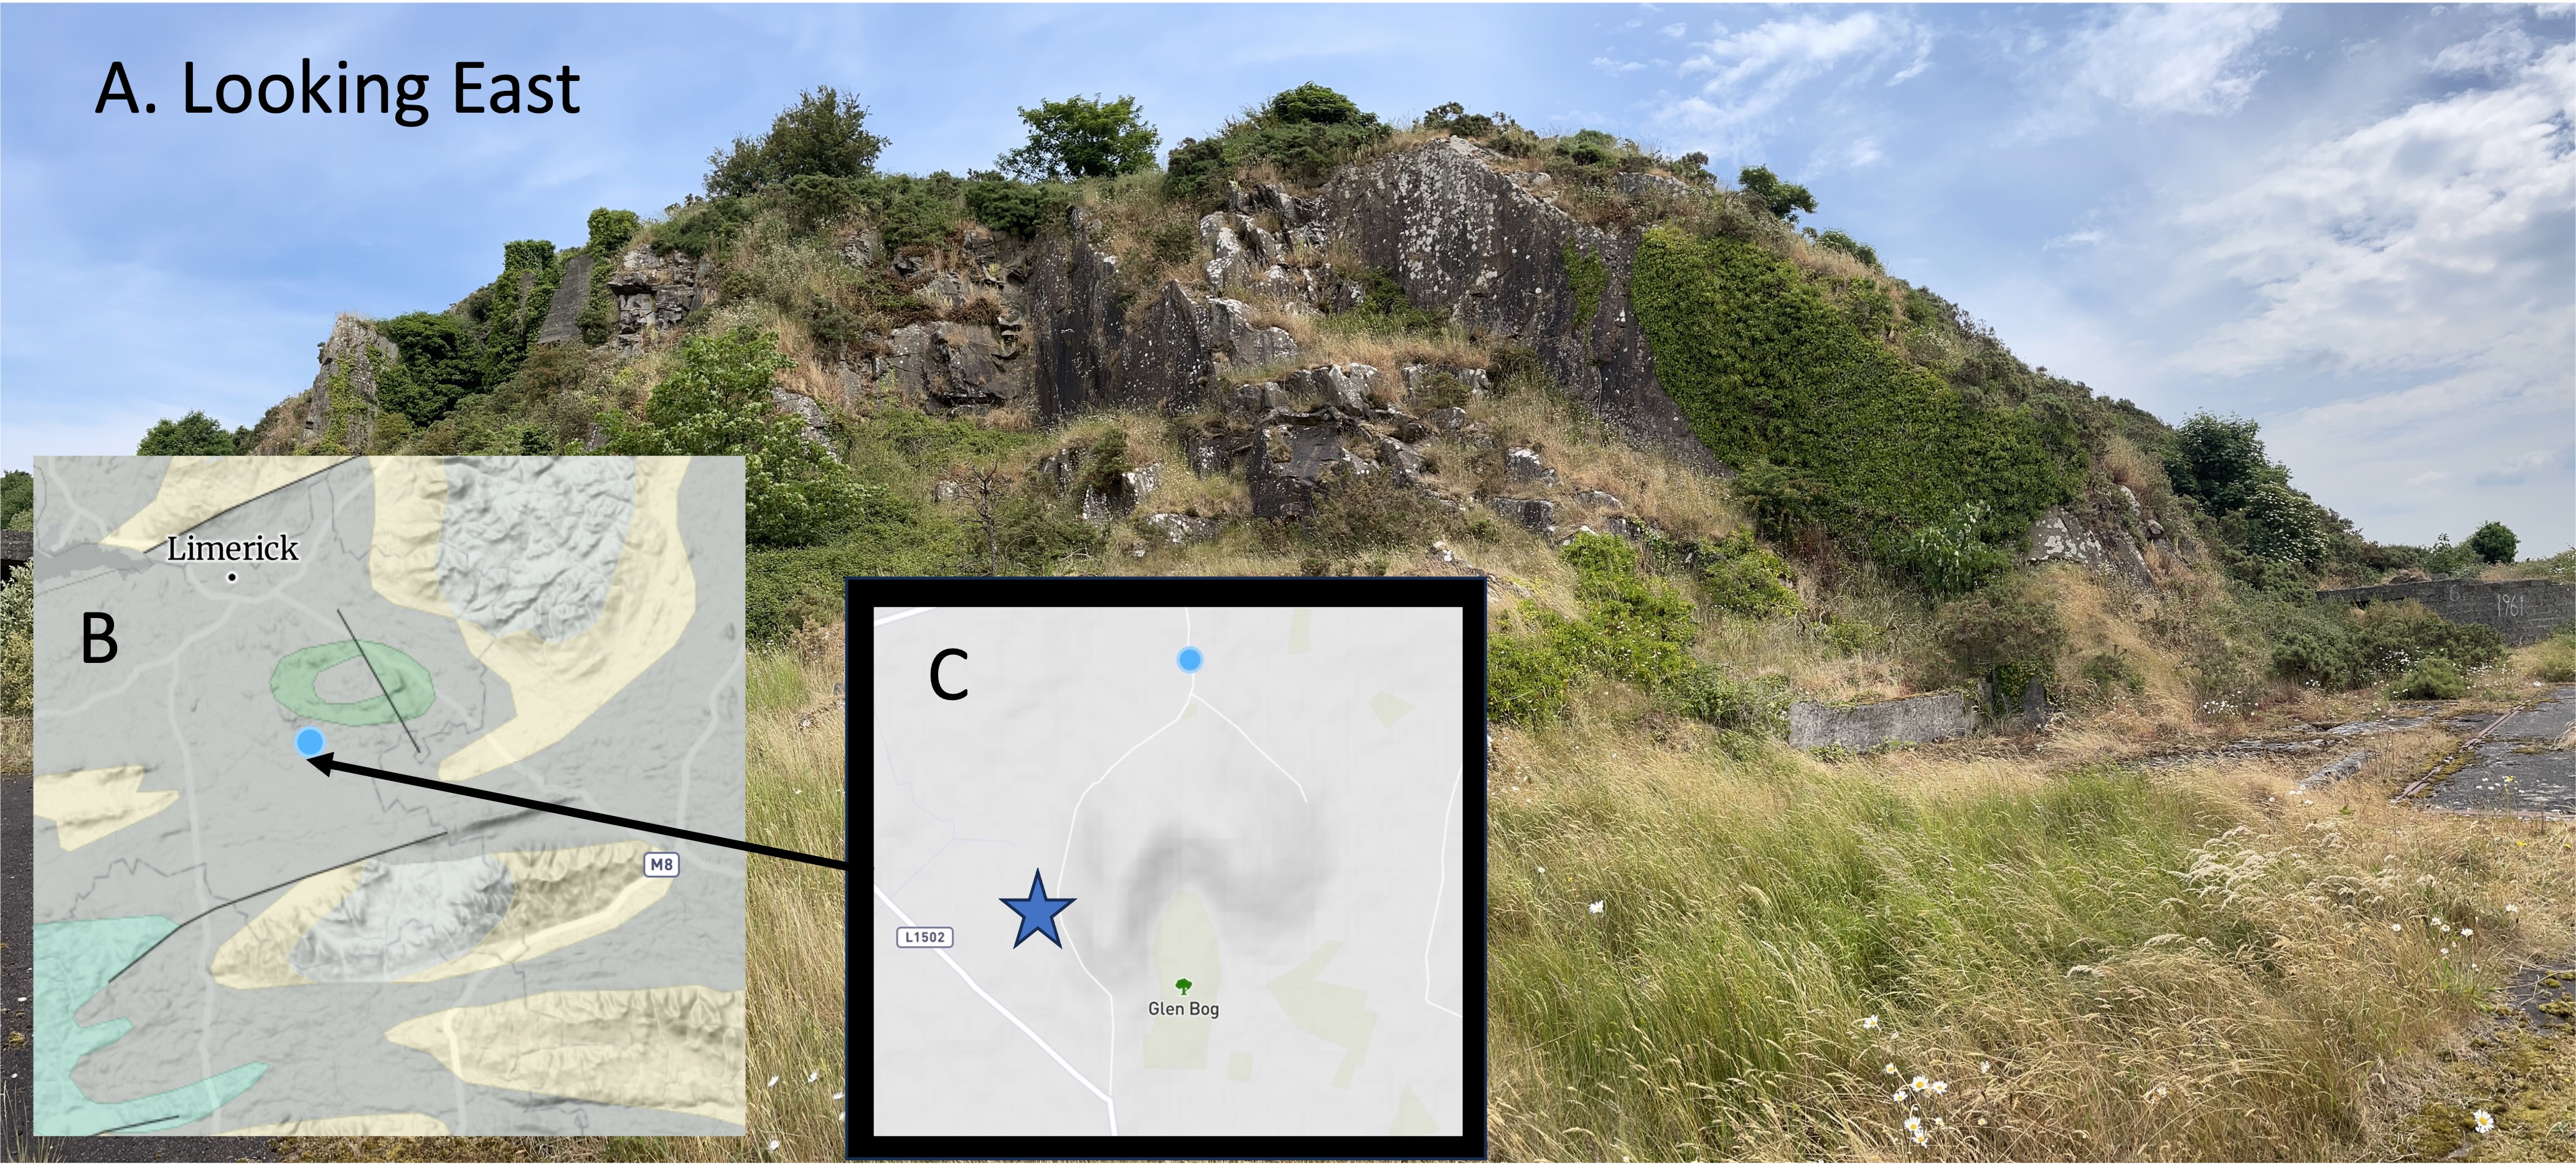
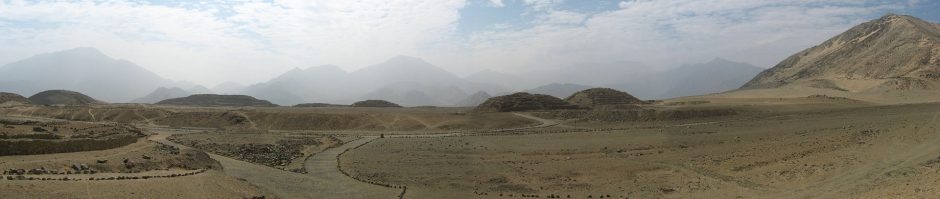
Figure 1. (A) This hill is more than 50 feet high, standing out above a gently rolling countryside. It got my attention because it looks like another source of building stone in a farming area the walls between fields are built of field stone. (B) The location places it just south of metabasalt alluded to in a previous post, which is the ring of light-brown on the inset map from Rockd. The major lithology of the green area is limestone, with some clay and sandstone; this Early Carboniferous (360-323 Ma) limestone is coeval with the rocks from Loch Gur. (C) The distinctive shape of the hill is seen in the topographic map The star is the small study area, located near the remains of an abandoned automotive service facility.

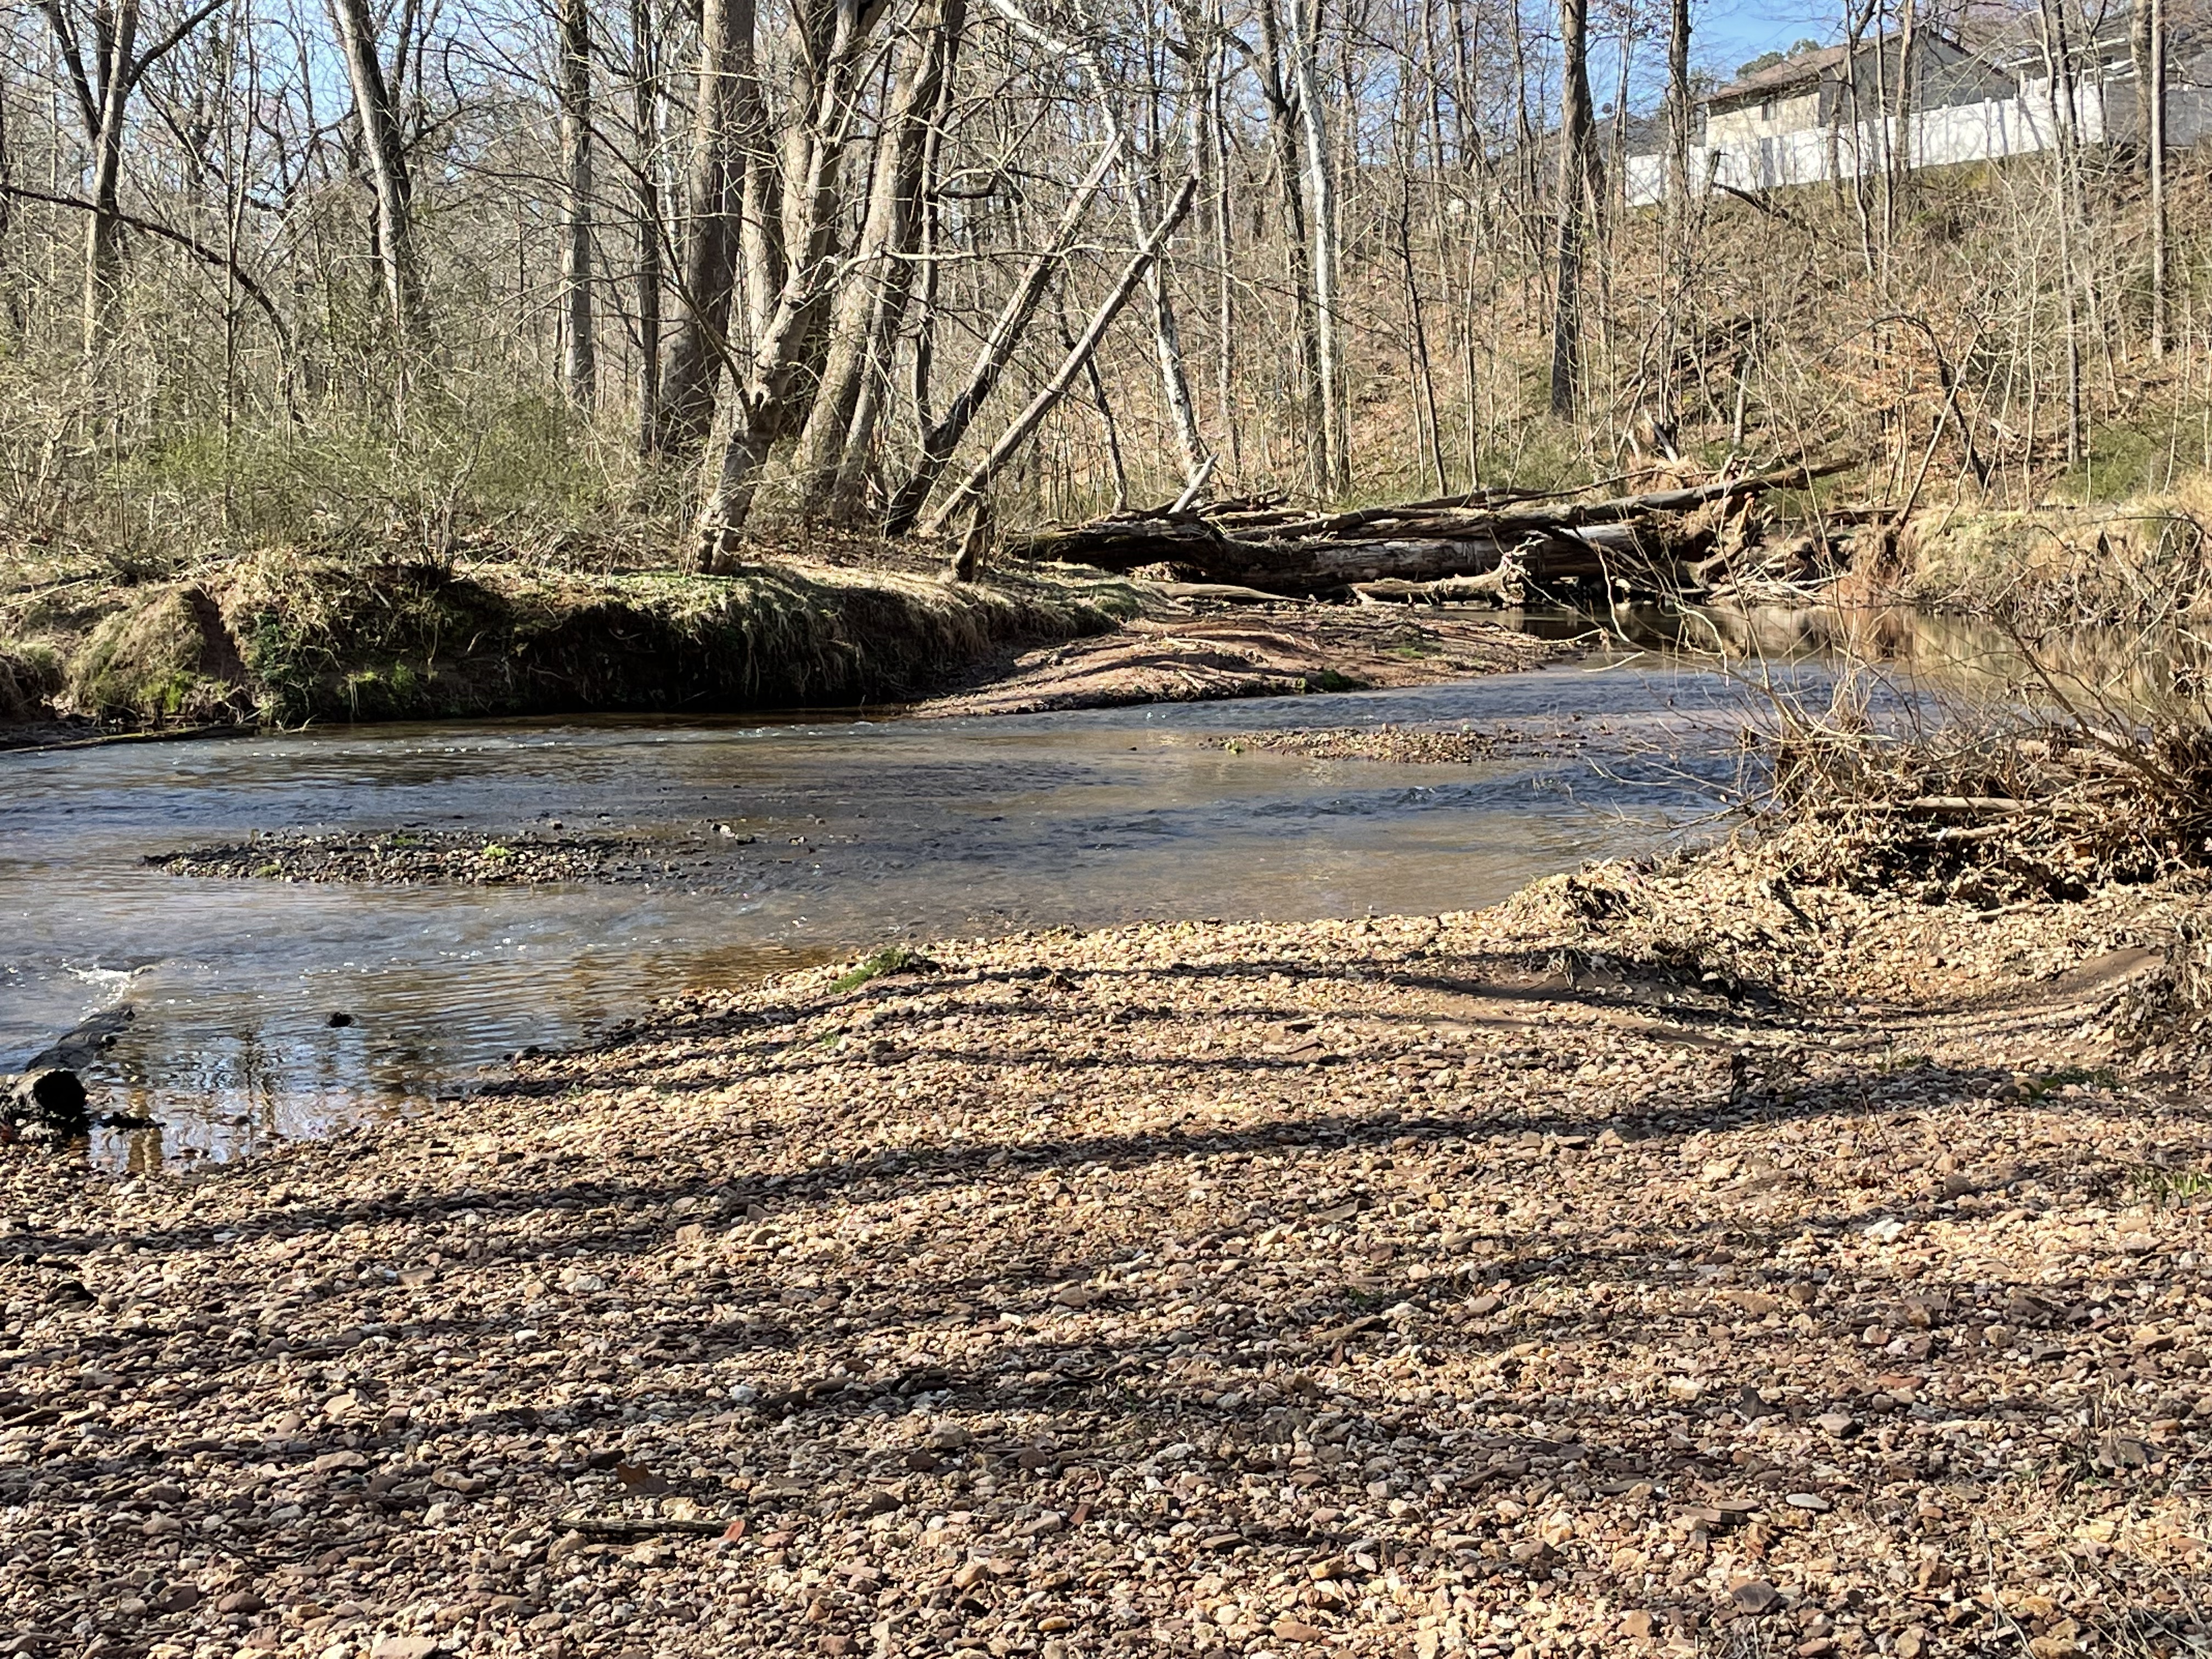
Figure 2. The rocks here are relatively massive but larger, in-place, exposures had a common plane oriented approximately like those labeled “Bedding Plane” in the photo. These beds are close to vertical whereas those at Loch Gur were much less steep. This could have been caused when the basalts (brown ring in Fig. 1B) were emplaced sometime after burial; the forced eruption of basalt would have folded the layers of limestone back like a flower opening.

Figure 3. Close-ups of boulders lying at the base of the cliff (inset photos), reveal similar textures but have slightly different hues; plate (B) is slightly redder, but both have a texture similar to unweathered limestone we saw near Loch Gur. The surface color is caused by the weathering of iron-bearing silicate minerals like amphibole and biotite.
Besides the color, there is another important difference between these samples and those: there is no evidence of the dark inclusions we saw at Loch Gur, which were also absent in the rocks from the stone circles described previously. There are also no dissolution cavities in these rocks, as seen at the quarry.
The photos in Fig. 3 have black circles drawn around inclusions. They are representative only. Some of these inclusions appear to be regular (e.g. the lowest circle in Fig. 3A) whereas others are highly irregular, such as the leftmost circle in Fig. 3B. These are NOT fragments of rock, or sand grains; however, they may be the remnants of fossils within the original carbonate sediments that were partly dissolved during burial.
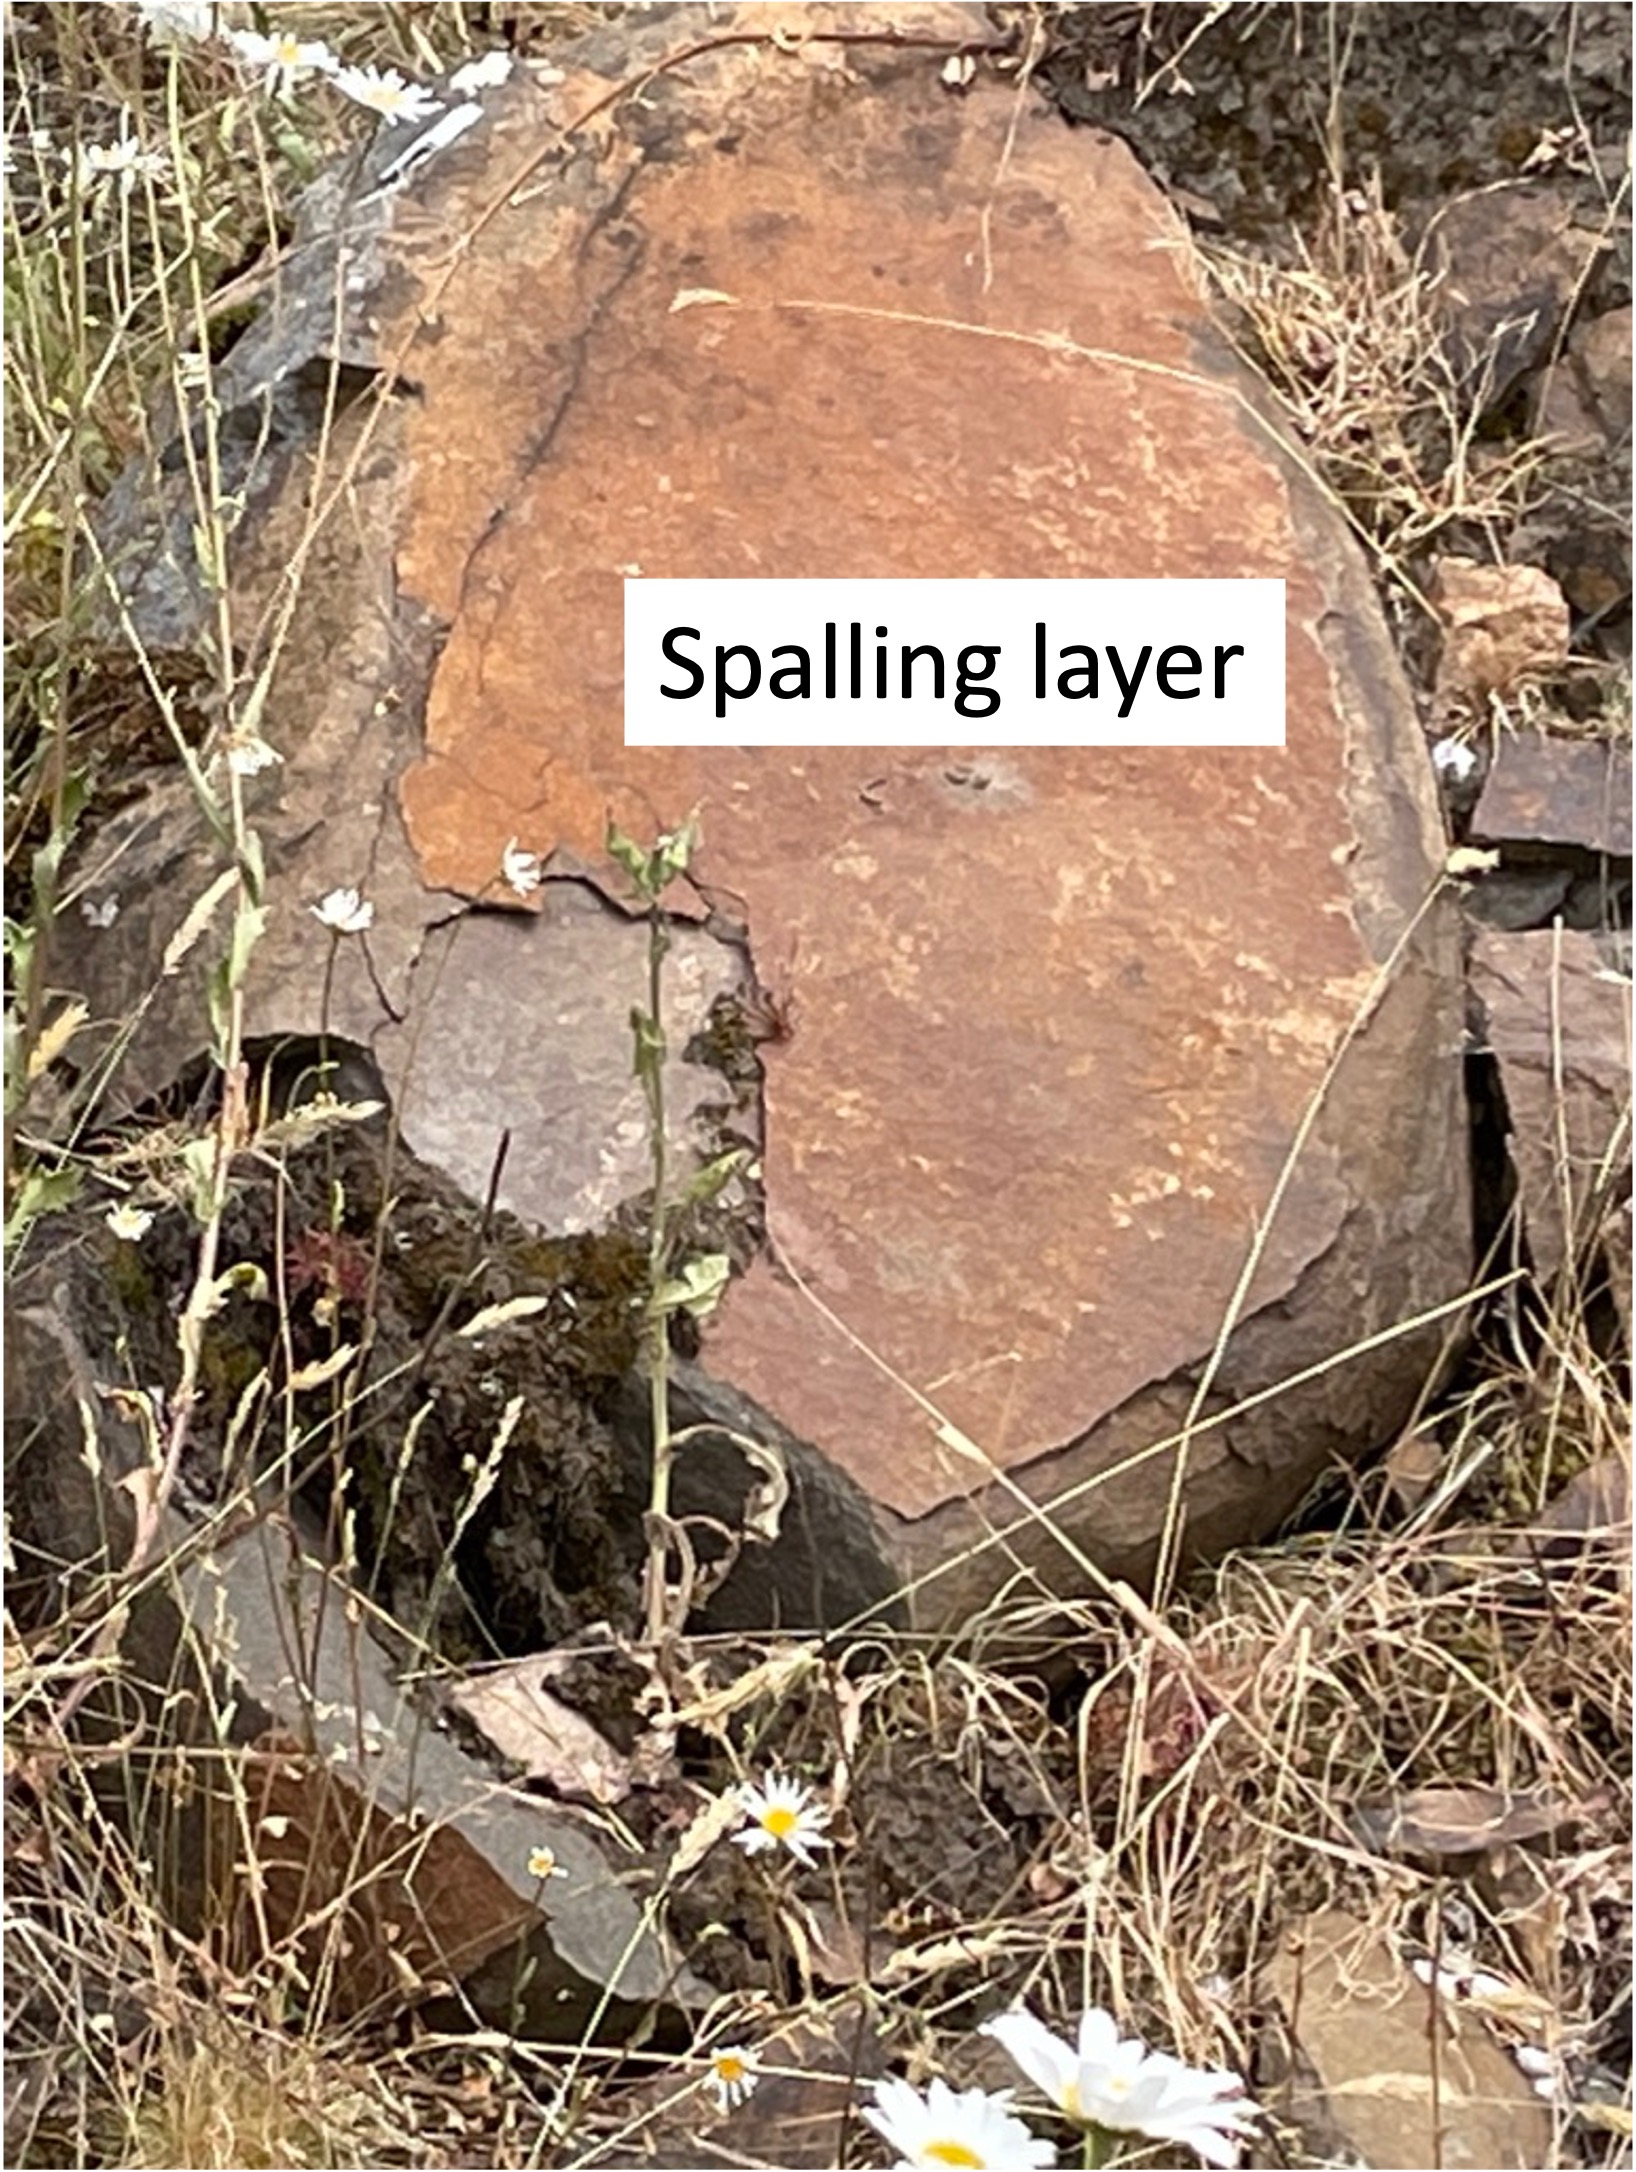
Figure 4. This boulder has a surface layer (labeled “Spalling layer”) that has separated from the subjacent, unweathered rock. This delamination occurs because the weathering products (e.g. limonite and hematite) of minerals high in iron (e.g. amphibole, biotite) expand in volume; consequently, this boulder is peeling like an onion, exposing an unweathered, gray layer.
Mixtures of carbonates and clastic sediments are called marl or marlstone. Typically, marlstone incorporates so much sand and silt that it doesn’t become very hard and is thus crumbly. However, without using a petrographic microscope to observe the composition of the rock, I can’t say if it’s 5 percent, 10 percent, or 20 percent terrigenous sediments — so it’s marlstone.
This post isn’t a summary of the geological history of Ireland, so all I will say in summary is that these rocks verify what I suspected already: a broad, shallow sea (e.g. a bay or estuary) began to receive sediments eroded from mountains between 360 and 320 Ma; the percentage of siliciclastic sediments increased to the point that, sometime after 320 Ma, this area had become part of river delta, as we saw at Foynes in the last post.
What Came After: Carboniferous Shales at Foynes
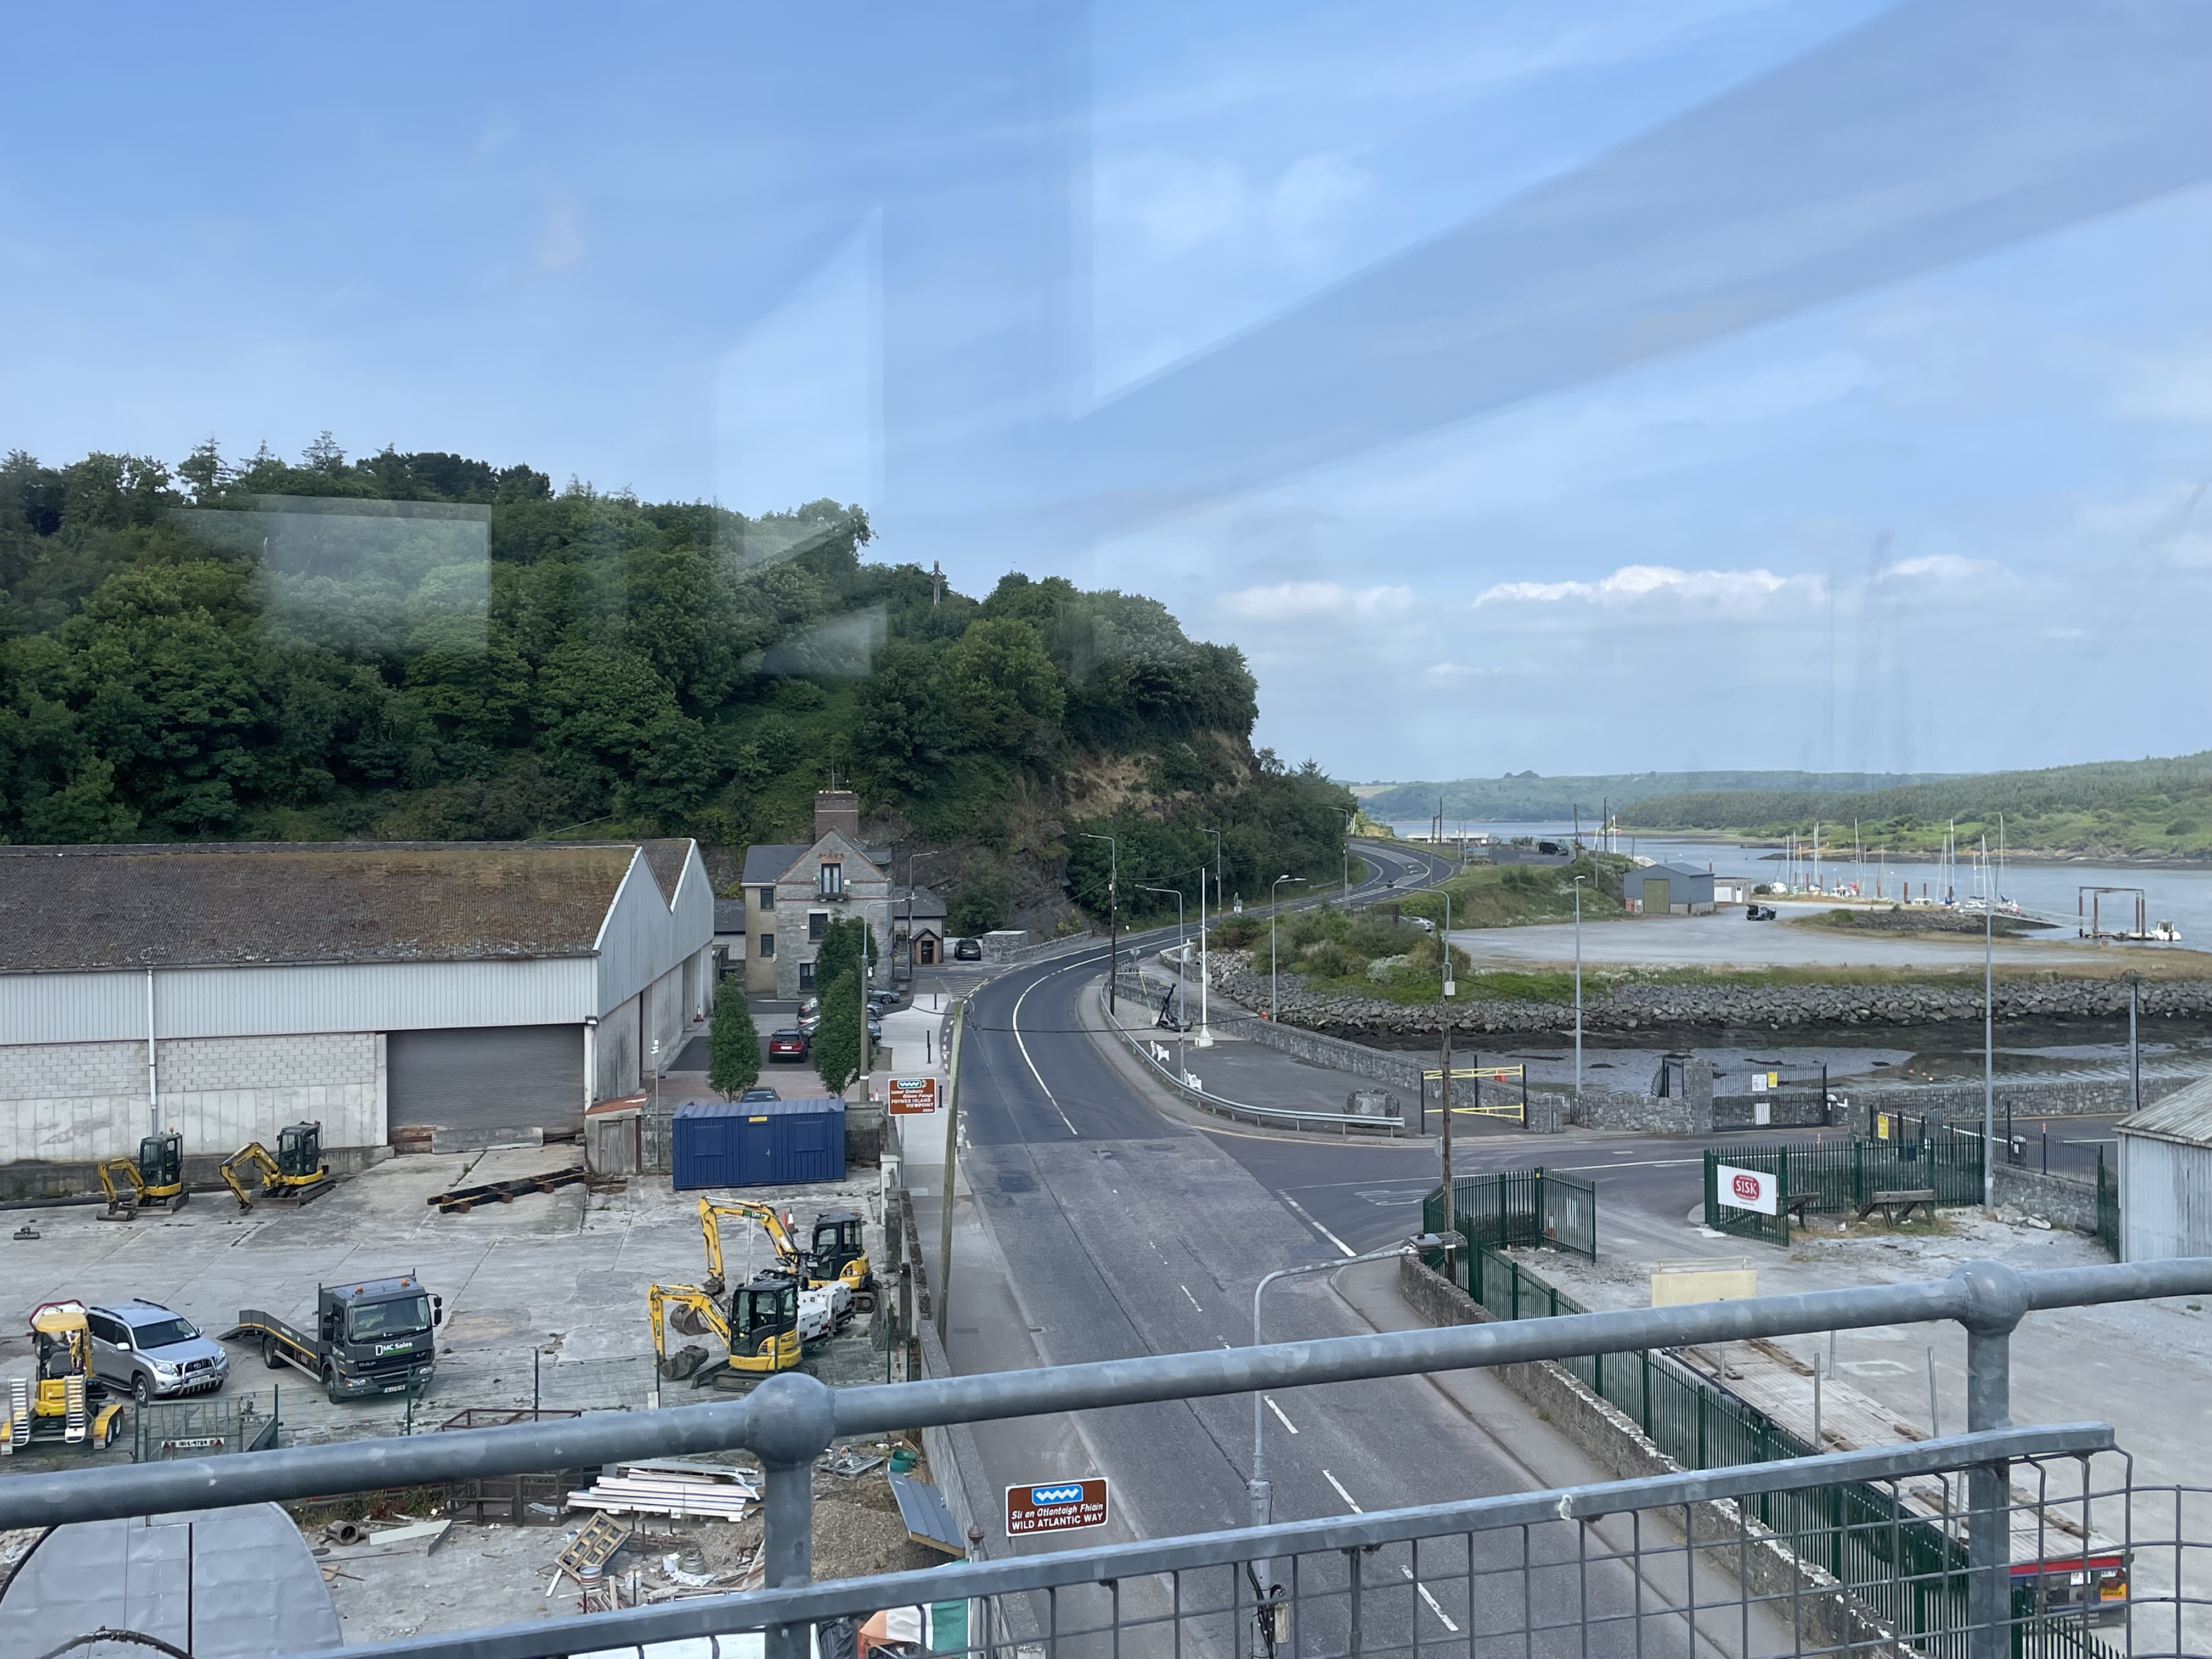
Figure 1. View looking west along the southern shore of Shannon Estuary in the town of Foynes. The ridge in the image got my attention, so I investigated it further. The gently rising land to the right is Foynes Island, which is elevated but not as high as the ridge.
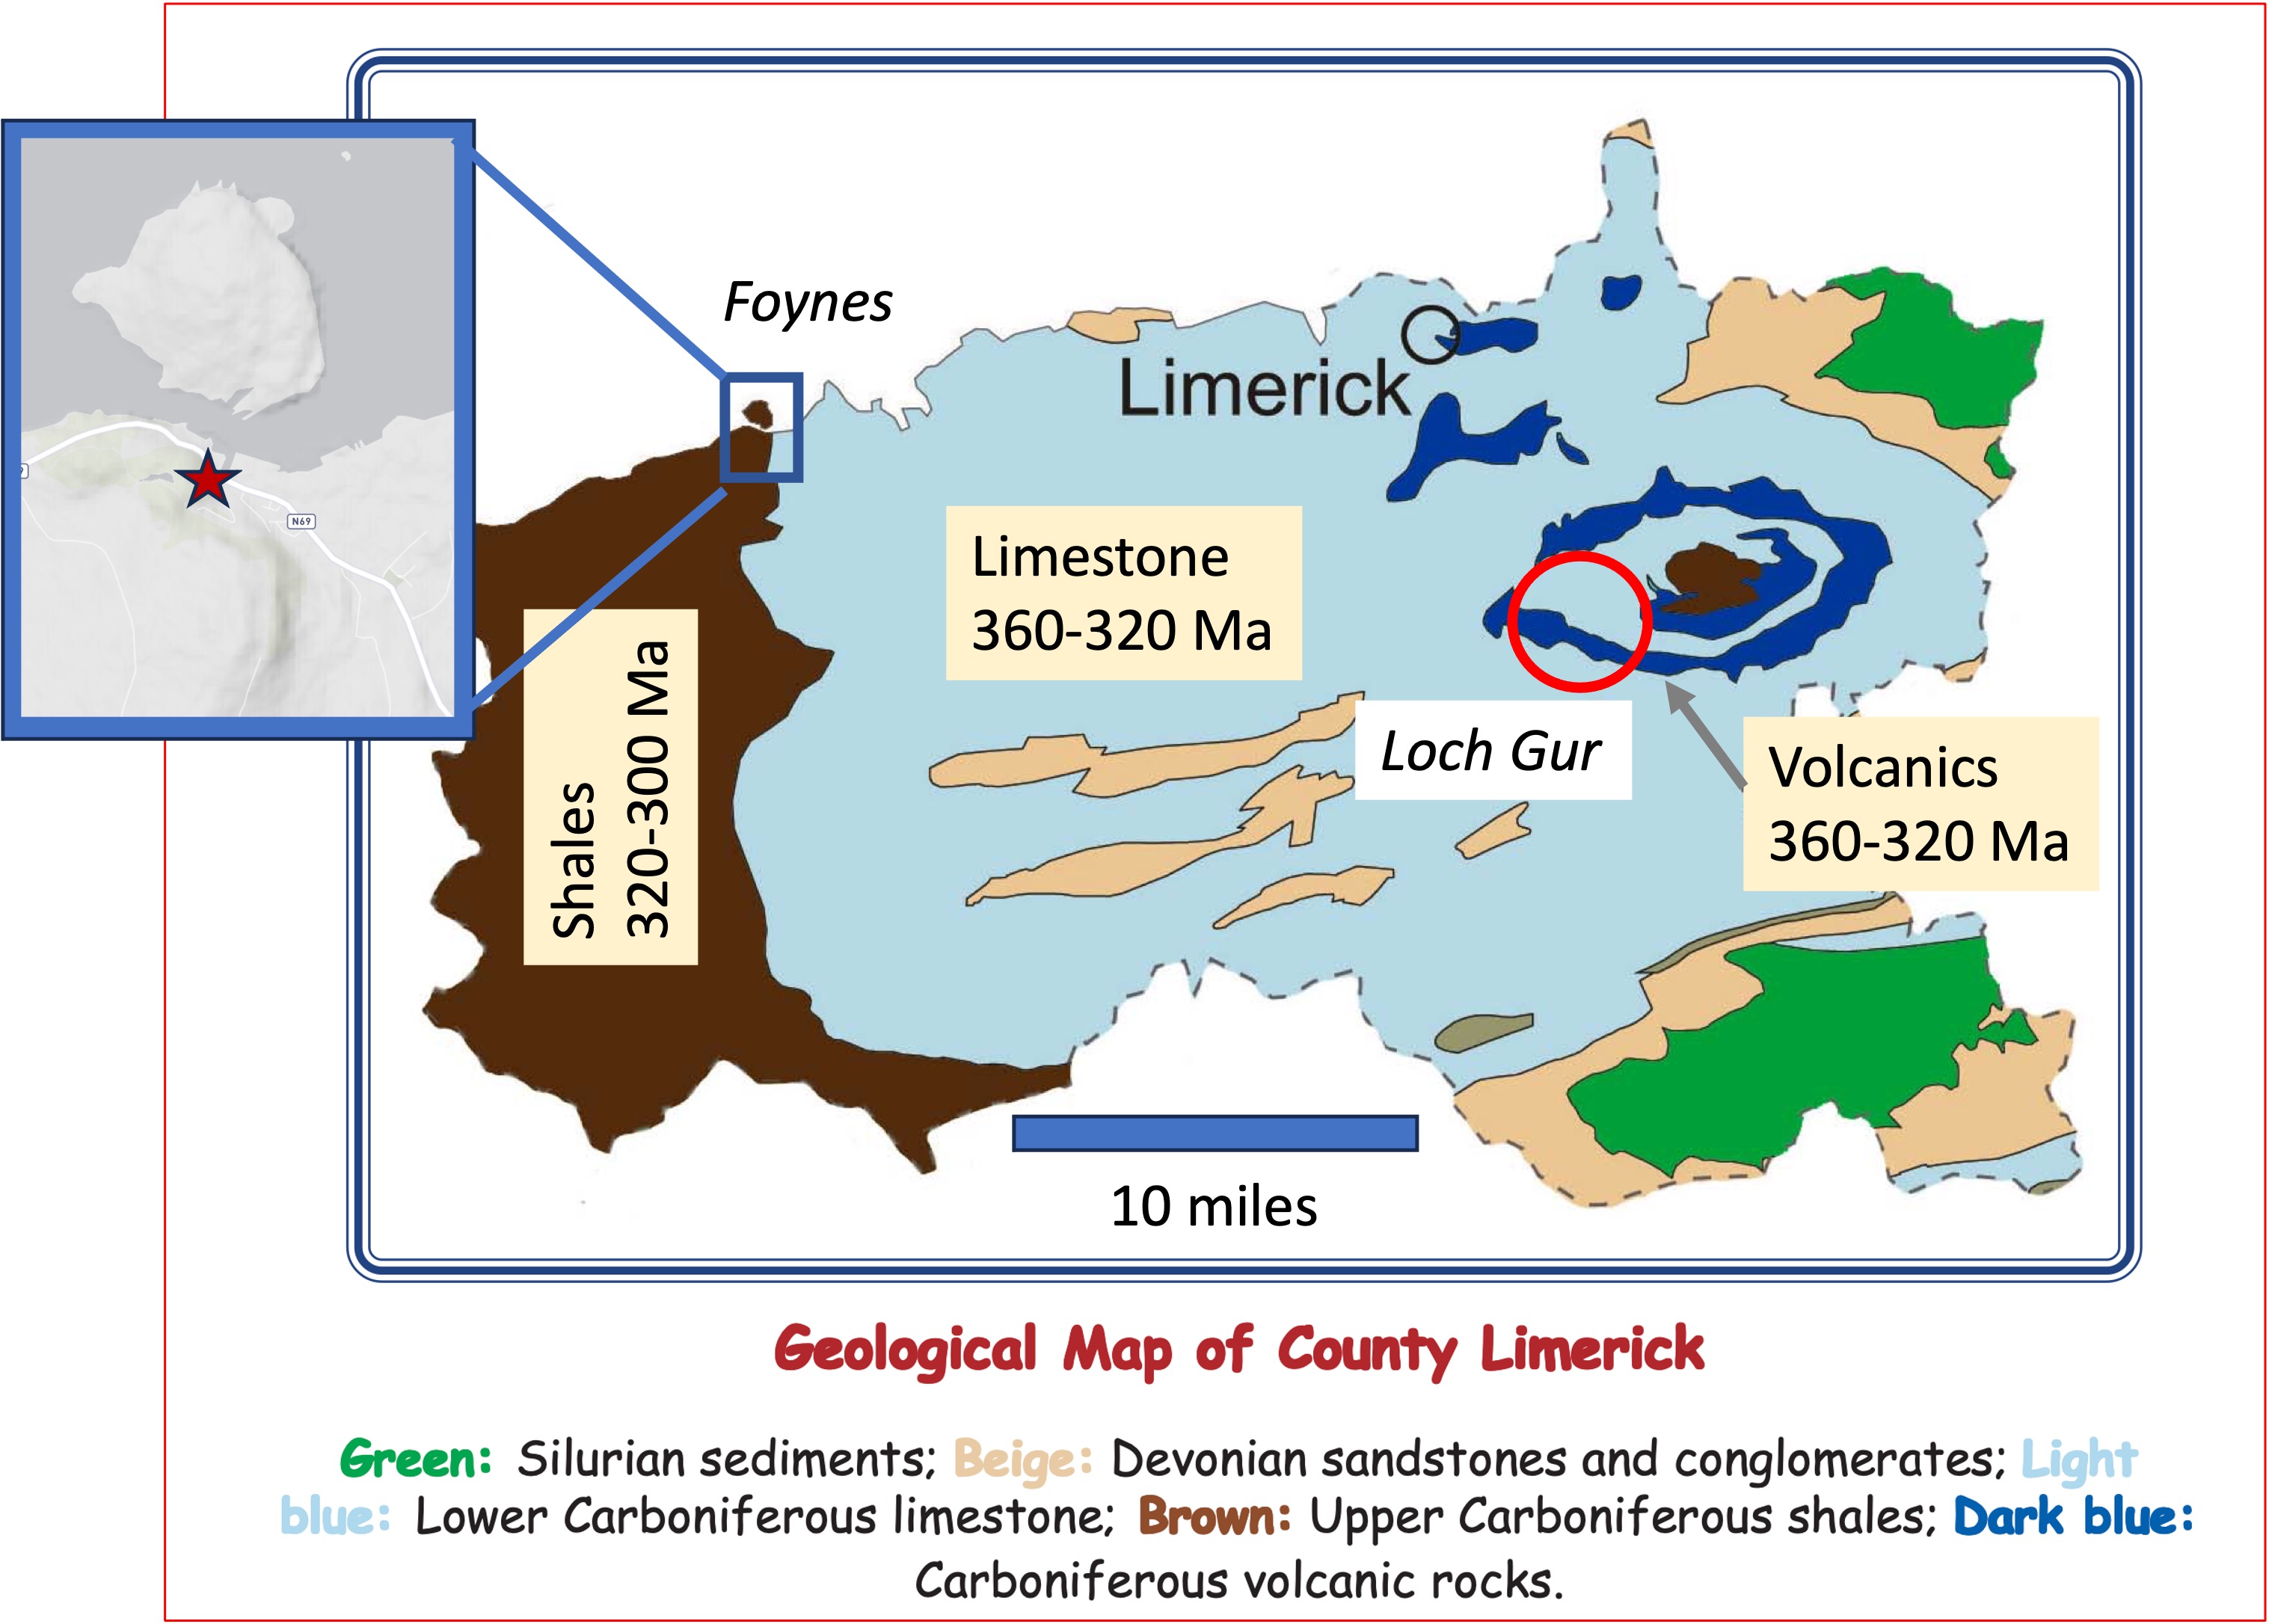
Figure 2. My last post was from Loch Gur (red circle to the right), where we saw limestones with evidence of contamination by terrigenous sediment (i.e. mud) and no fossils. These chemical/biological sediments were deposited between 360 and 320 Ma (Ma refers to mega annums, roughly millions of years ago). This post travels thirty miles westward to Foynes (blue rectangle), where we discovered the ridge in Fig. 1. These are slightly younger shales geologically. The inset map shows the topography of Foynes (the star is the location of Fig. 1); the ridge follows the outline of these rocks on the geological map (brown).

Figure 3. The left image shows the bluff (see Fig. 1), which is composed of mud, sand, and silt. The white circle is shown in more detail in the center photo: Massive sand/silt beds sandwich a thick sequence of thin layers of fine-grained sediment with a dark color, which suggests a high organic carbon content (i.e. decayed plant matter), low-oxygen environment. For example, black shale may form in stratified, shallow seas and is a source of petroleum.
The orange circle was photographed at higher resolution in the right image, which shows thin layers of sand/silt intercalated with fine-grained, dark laminae. Sand balls and lenses (labeled in the figure) suggest that sand was deposited into unconsolidated mud.
One depositional model that is often applied to these kinds of sediments is the Turbidite; coarser sediment slides down steep delta fronts, often activated by wave action, and form discontinuous layers inches in thickness, in deep water. Another, simpler, model is deposition in tidal flats where daily flows slowly sort the fine and coarser sediment into interweaving layers. Without more data, it isn’t possible to choose which is more likely; however, both would occur in similar environments: deltas where rivers debouch into a sea. The brief explanation of these rocks in RockD suggests they are turbidites, although it is likely that the depositional setting changed over time, as we’ll see in the next figure.

Figure 4. This section was exposed about 200 feet from Fig. 3; the rocks here are dipping about 30 degrees away from the camera, so I estimate that this exposure is about 100 feet (this is a “back of the envelope” estimate — a guesstimate) further up-section. These layers are younger than those seen in Fig. 3; using a sedimentation rate of 5 mm/year (I do calculations in metric units), these mixed sediments were deposited less than 10,000 years later.
During that interval, the supply of silt/sand increased substantially; here we see mud at the bottom, then thick (~1 foot) beds of silt/sand appear, first as discrete beds separated by muddy sediment, then as massive layers with no discernible cross-bedding. The white, dotted line is an approximate depositional surface that shows how the silt/sand might have filled low points in the seafloor, or formed sand bars. Turbidite layers as thick as the silt/sand bed at the top of the exposure are uncommon because that is a lot of sand to be mobilized in one event and it is very uniform in thickness.
The photos at the right represent the change in depositional environment that might have occurred during the approximately thousand years required to deposit these sediments. The lower image shows a series of turbidite layers at the bottom of a marine delta; the upper photo shows a typical depositional environment for massive silt/sand beds, with muddy sediment limited to mud flats.
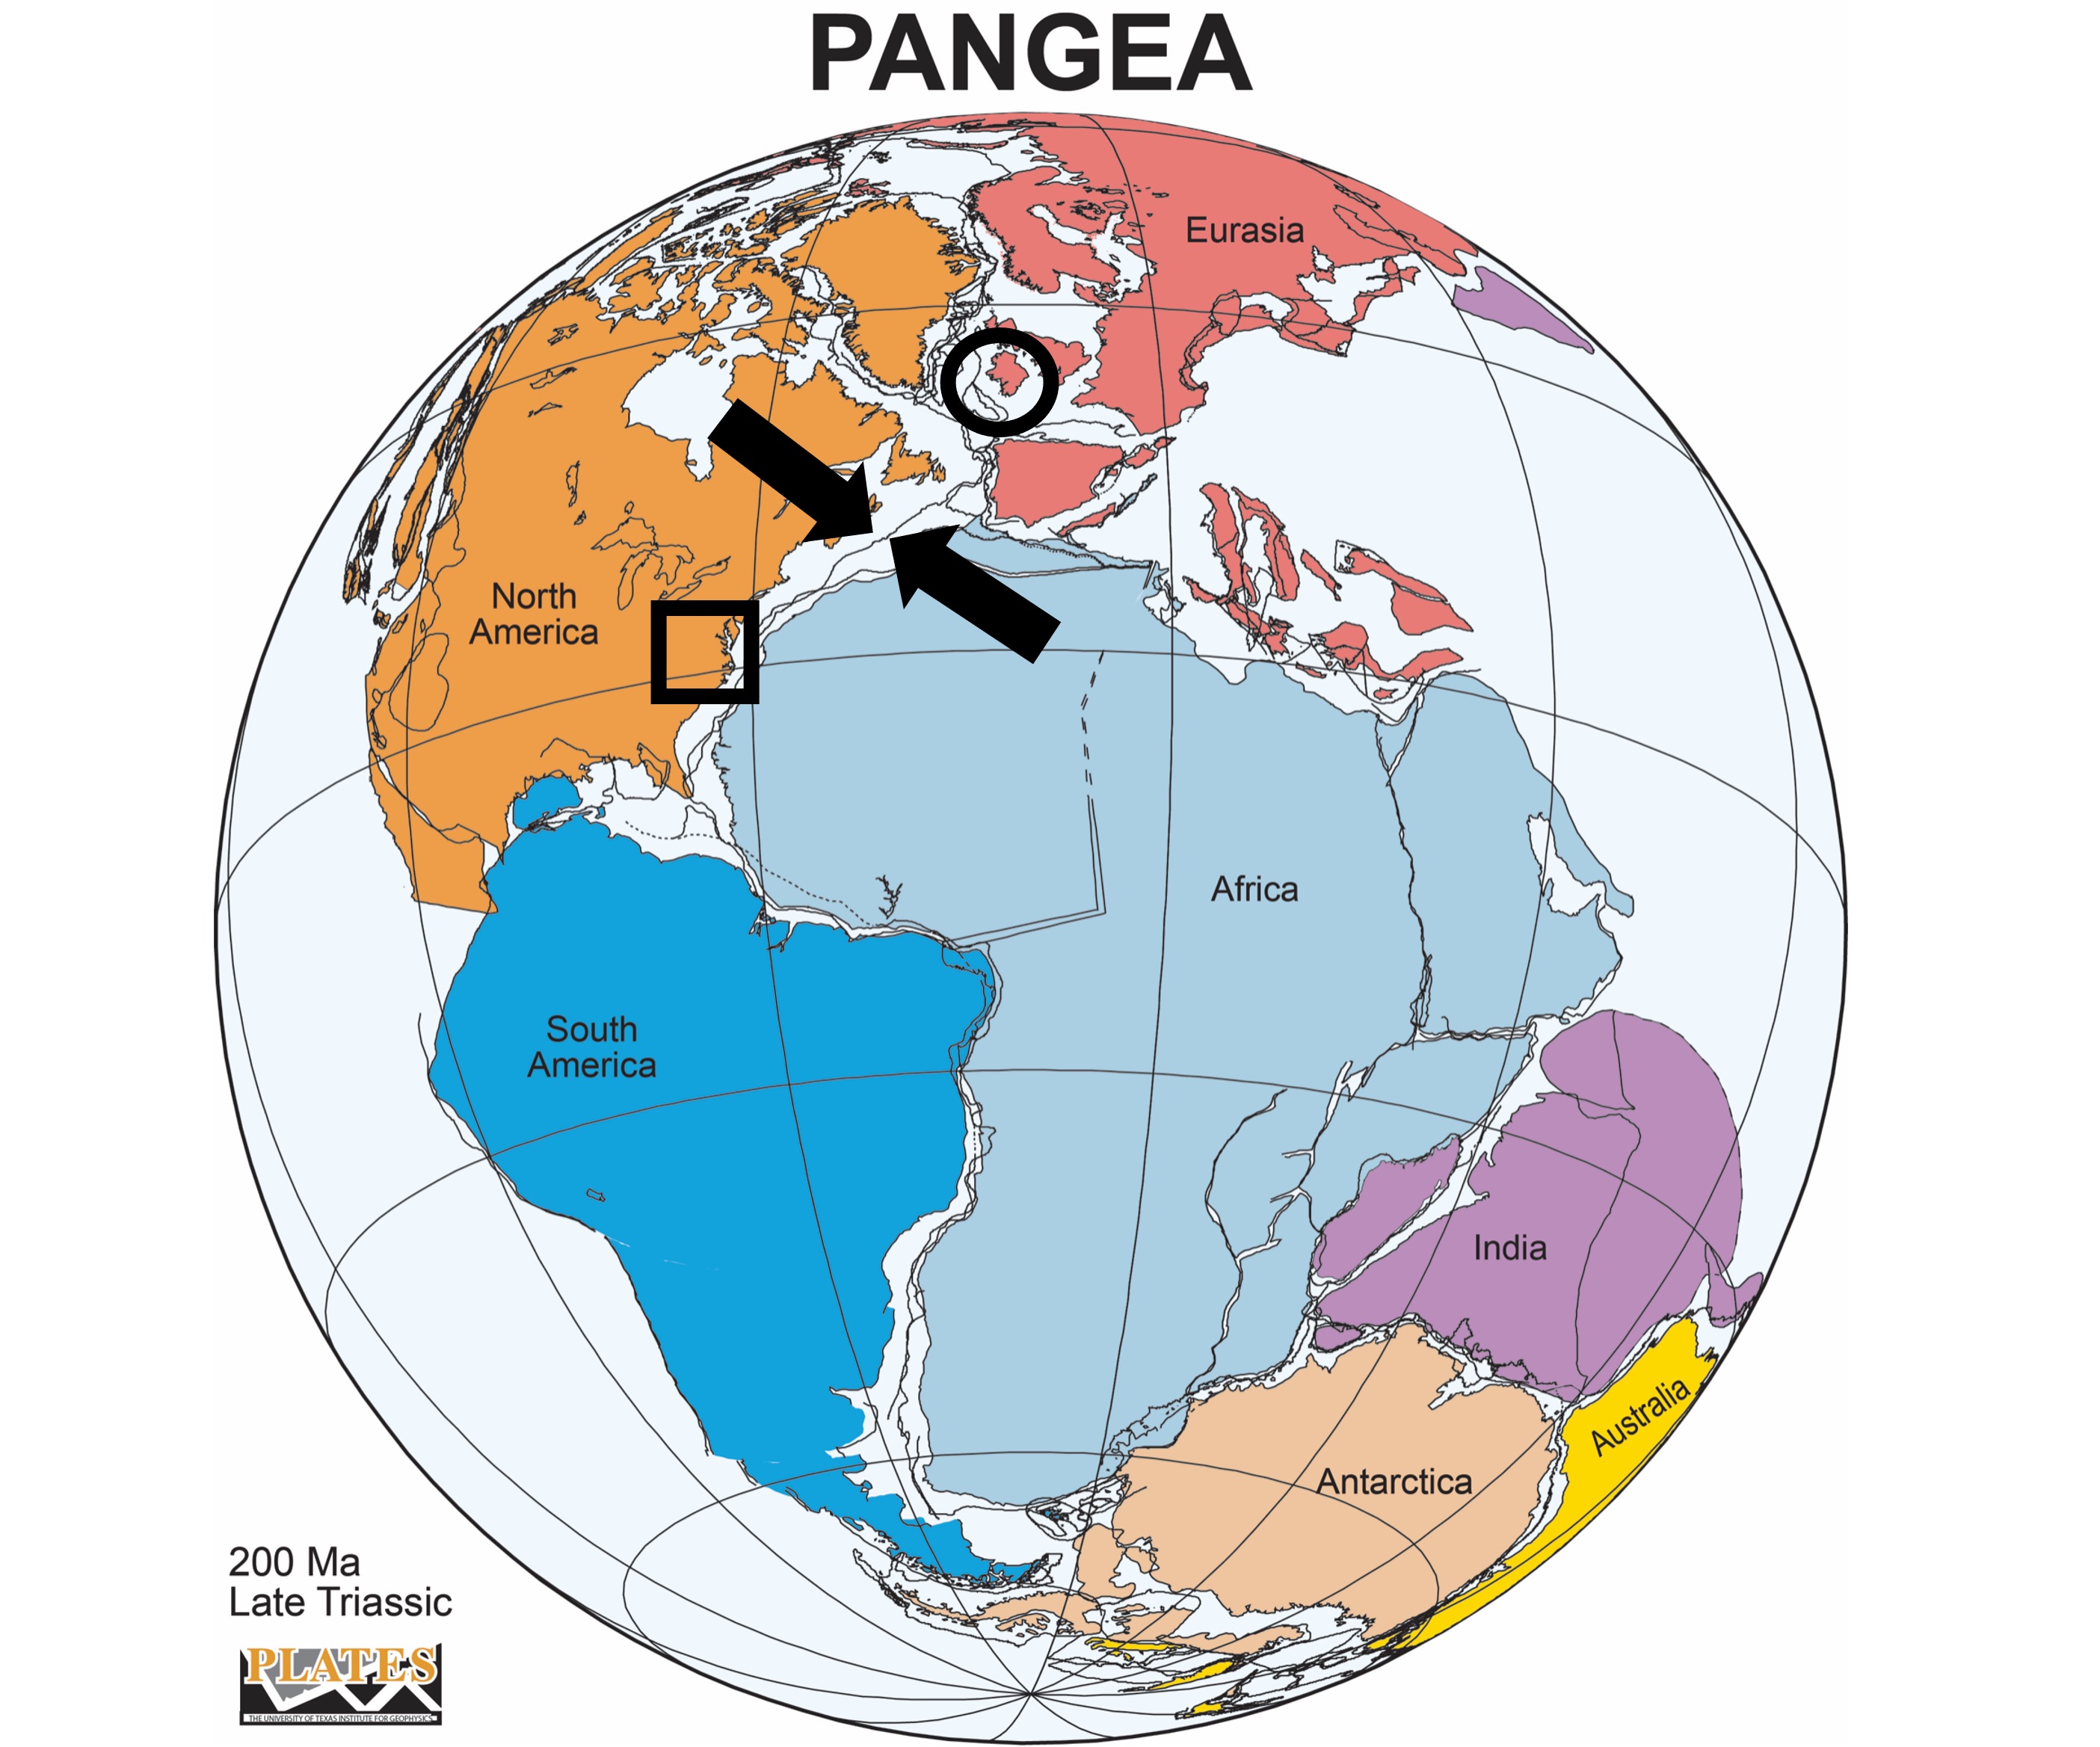
Figure 5. Reconstruction of Pangea 100 Ma after the rocks we saw at Foynes were deposited (circled area).
The section exposed at Foynes represents about 10,000 years of nearshore deposition between 320 and 300 Ma. When we put this together with the rocks we saw at Loch Gur, we see a classic coarsening-upward sequence.
These can be short or long and be caused by many processes: for example, a single sediment source can be rising and dumping larger grains, which cannot travel as far as mud; however, this is a much slower process than the 10,000 years represented in this exposure. It is also possible for several sources (e.g. different mountains in the area) to contribute sediment at different times as they erode. Sea level can fluctuate, changing the potential energy of transporting streams, but this is also a slow process; for example, sea level fluctuations within a ten-thousand year interval wouldn’t be more than a few meters. It is also possible that, as mountains erode, different rocks are exposed and contribute to the sediment load.
I favor the turbidite model with this caveat: Sandy event beds, especially thin ones as we see here, can be deposited in relatively shallow water where sediment input is high and produce gravity flows generated by waves or earthquakes. This model would allow the relatively rapid change in environment, to one more like the delta seen on the upper right of Fig. 4.
One fact is indisputable, however, over millions of years this location evolved from quiet water, where calcium carbonate (primarily from the shells of marine plants and animals) collected, to a deltaic environment with large volumes of terrigenous input.
In other words, what happened in Northern Virginia (square in Fig. 5) about 500 Ma reached Ireland 200 million years later.
The sediment didn’t come from the same mountains — not that far away — but something new …
First Look at Ireland: County Limerick
Here I am on the other side of the Atlantic Ocean, seeing what the rocks say from this side of the still-expanding sea that split Pangea in two, creating North America and Europe. I have written a lot about the long-lasting collision of land masses during the Neoproterozoic and Paleozoic eras in many posts from Northern Virginia (NOVA) and surrounding areas, but only from the perspective of North America.
Jumping ahead a little, after hundreds of millions of years of tectonic stability (geologically speaking), the earth’s crust fractured about 200 million years ago and another Wilson cycle began.

Figure 1. View of Loch Gur near the city of Limerick. Such irregular, often deep, lakes are common throughout Ireland and Scotland. They are the product of extreme glaciation; thick ice sheets shaped the topography in ways unrelated to erosion caused by rain and river transport of sediment. To get to the bottom line, we have to first recognize the discontinuity between the topography and the geological history of the area.
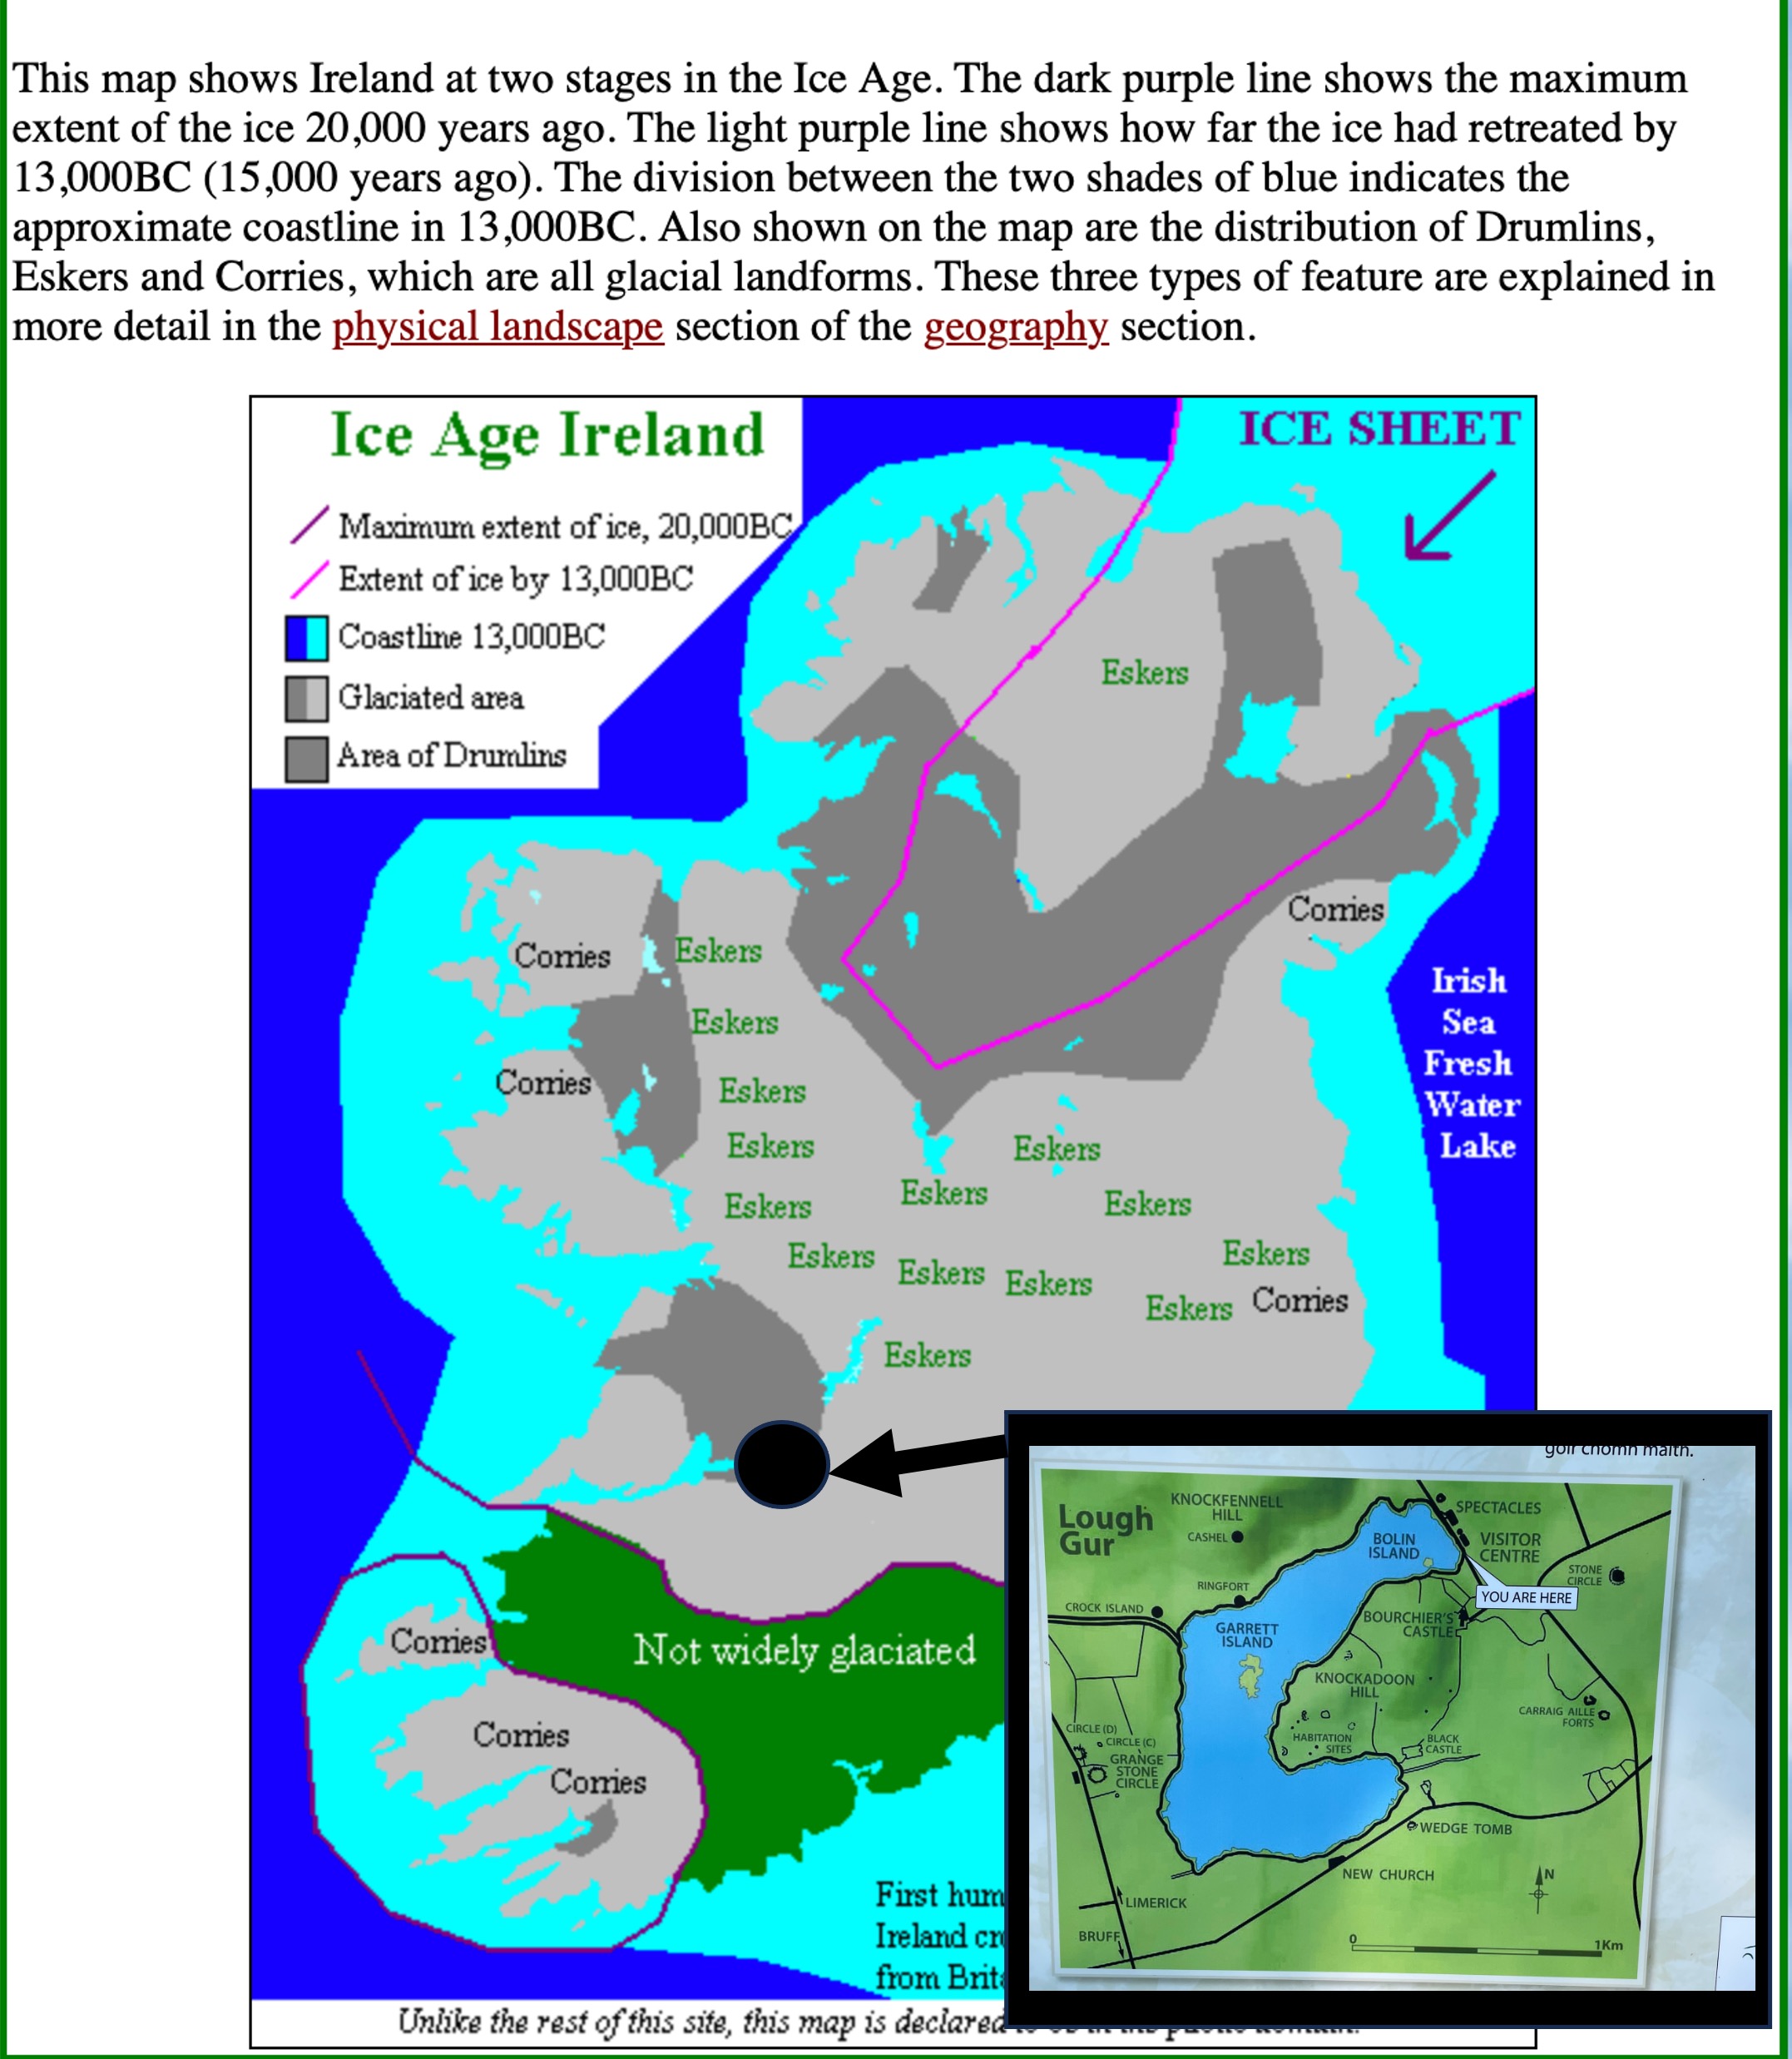
Figure 2. Ireland was almost completely covered by ice, almost a mile thick at times, which didn’t melt until about 15,000 years ago. The study area (inset map) is located SE of the end of the Shannon Estuary, in a region that contains drumlins; however, the hills seen in Fig. 1 are not unconsolidated glacial till, but instead limestone which is the bedrock of this region. Eskers are similarly unconsolidated glacial debris deposited by rivers that run under the ice, carrying away meltwater and sediment. Corries, on the other hand, are what North American geologists call cirques; these are semicircular basins carved out where glaciers form and expand outward. Loch Gur fits this geomorphologic model from its shape and the lack of depositional glacial features.
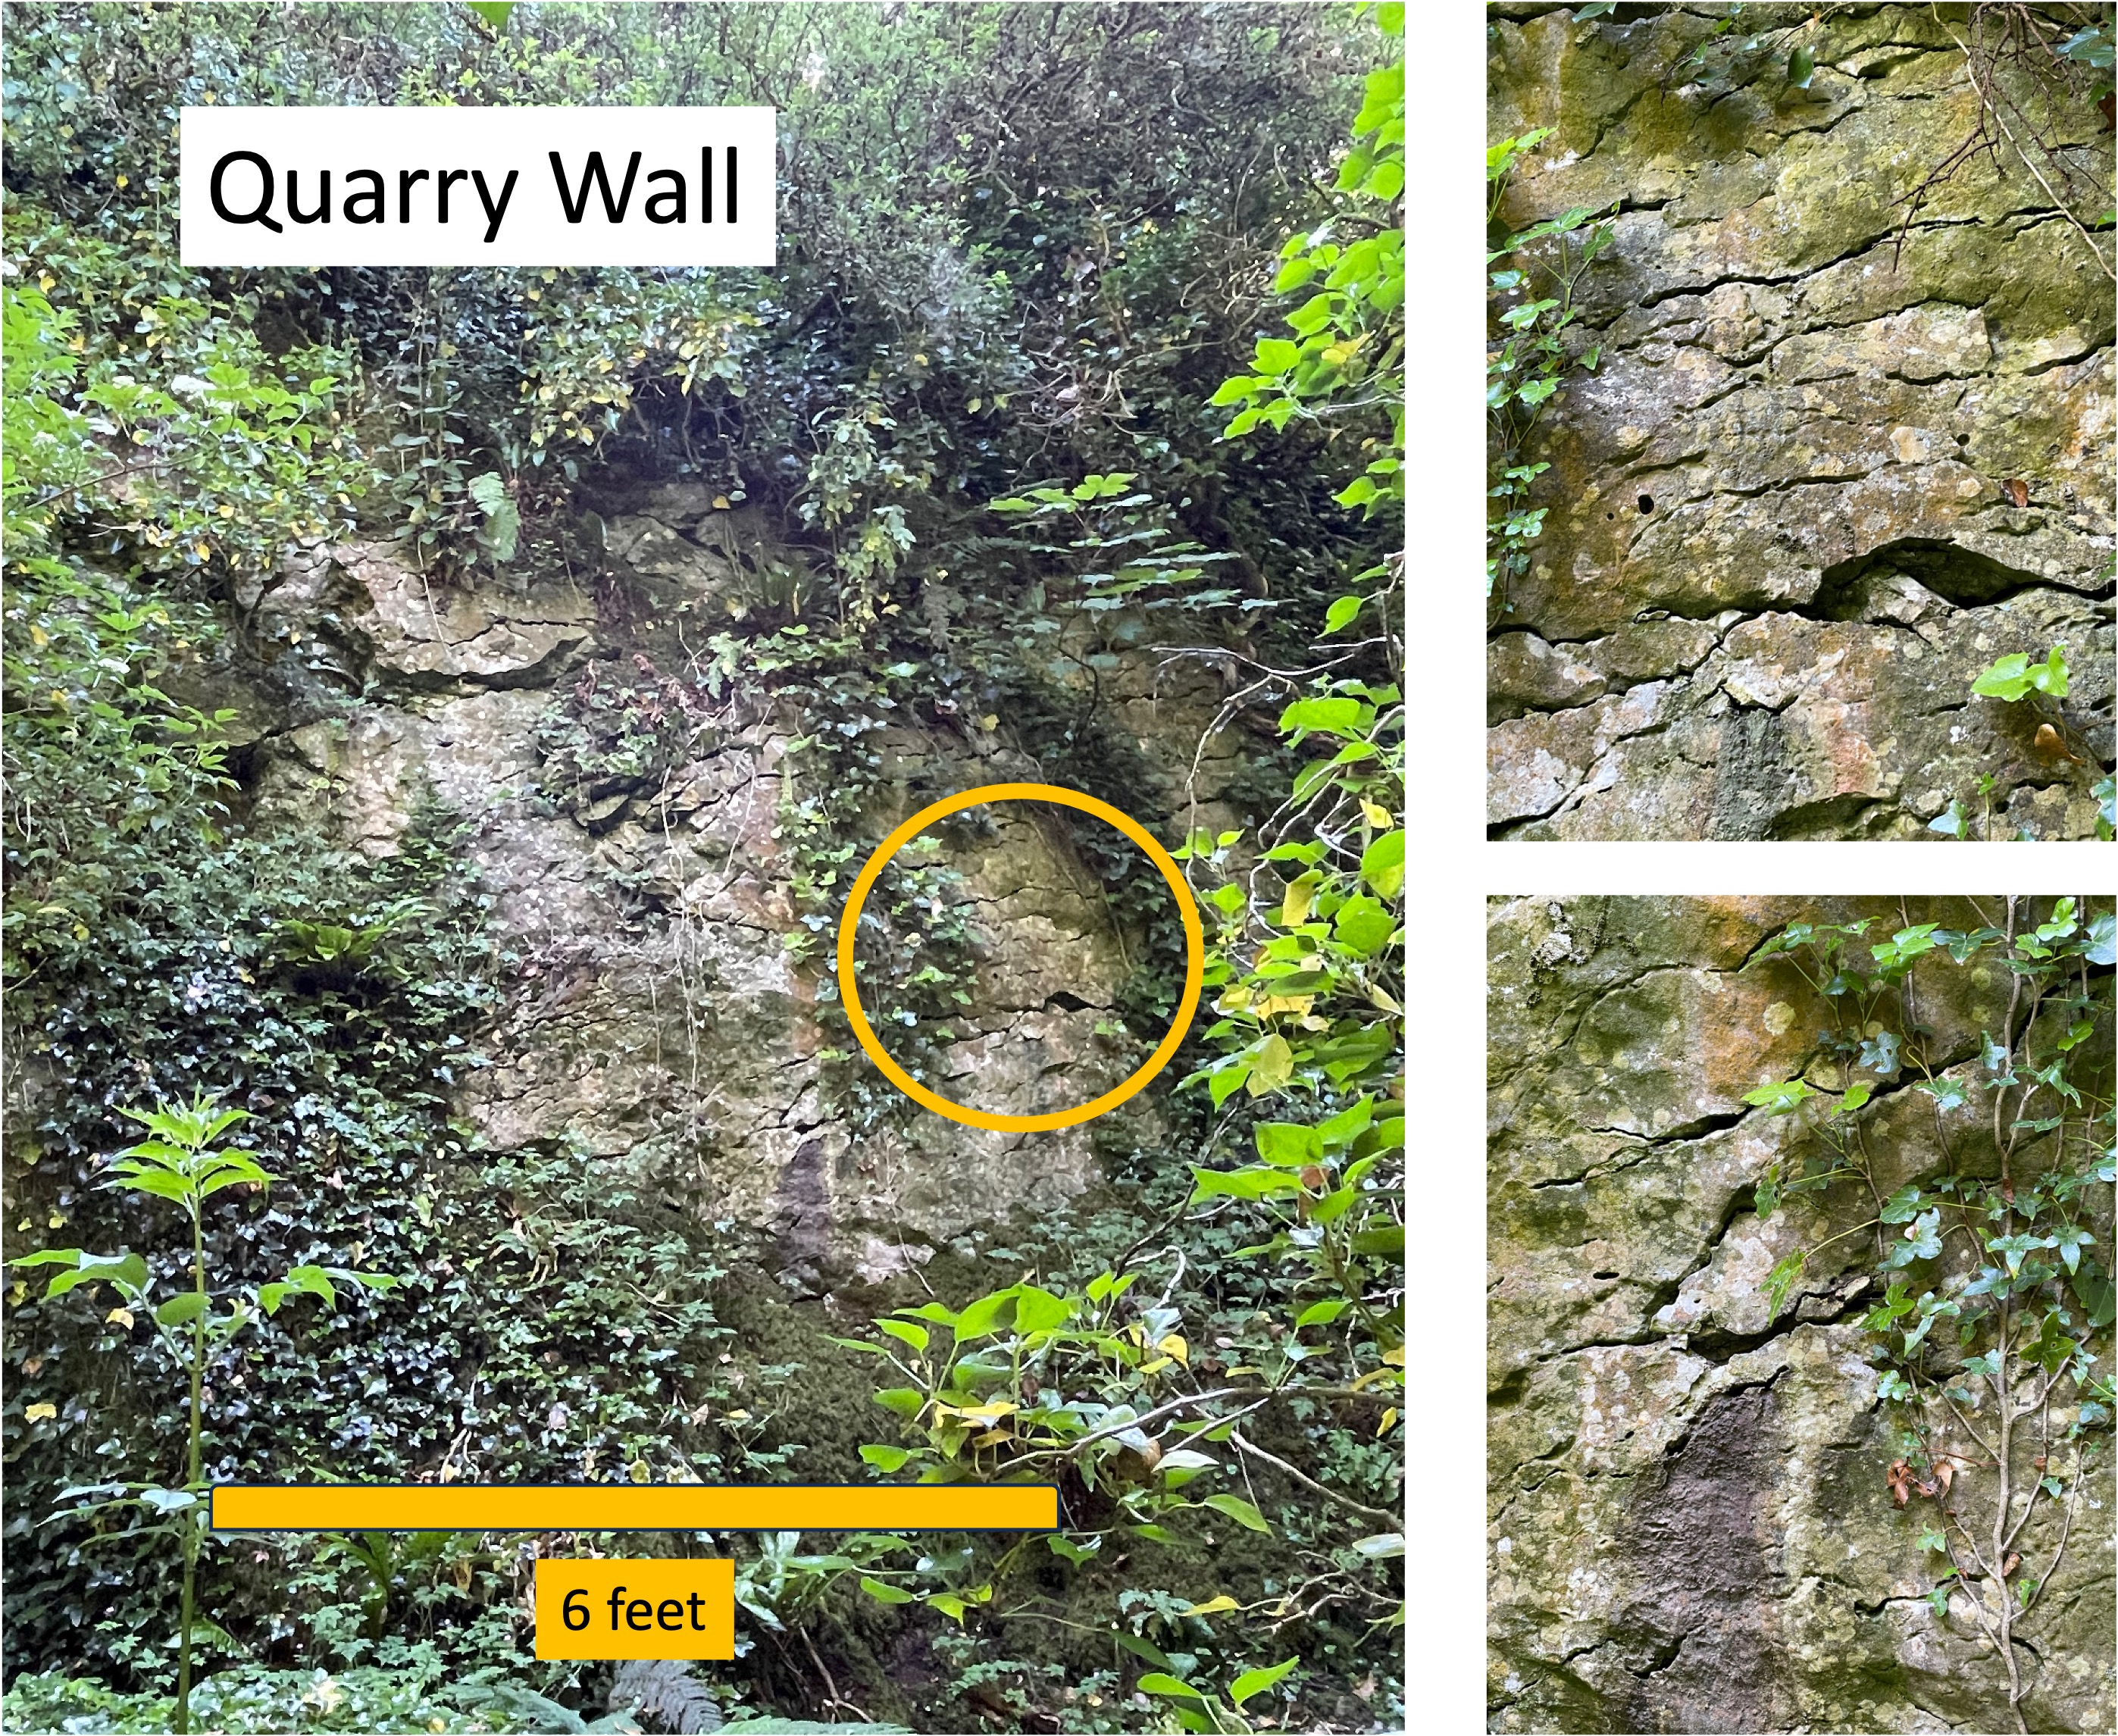
Figure 3. Images of quarry face along south shore of Loch Gur (see Fig. 2 for location), showing dissolution along fractures and bedding (inset photos). This process, if it continues, can lead to the development of karst features such as sinkholes and caves. This doesn’t seem to have occurred in the study area however.

Figure 4. Details of limestone boulders from Loch Gur. (A) Highly weathered block at the current shoreline, showing preferential weathering of dark areas. (B) Dark areas like those in Panel A were present throughout large boulders (> 4 feet across) lying loose at the foot of the quarry cliff. (C) A close-up reveals a difference in grain size between the dark and the light areas. The dark zones may be concentrations of contaminants (e.g., clay) or the product of partial recrystallization with contamination by ground water after deposition. Comparing (B) to (A) suggests that the dark areas chemically weather faster when continuously exposed to water (panel A was beneath the water line until recently). I think (microscopic analysis would confirm this) that the dark splotches contain more clay, a mineral group that weathers faster than most other minerals. The dissolution seen in Fig. 3 may be a completely different process, however; chemical dissolution accelerates in limestone where rainwater is concentrated along fractures (as opposed to clay weathering on exposed surfaces, as suggested by this figure). In summary, I think these limestones were deposited in a shallow-water area with a high inflow of clay minerals, which migrated during diagenesis to form the dark splotches. These carbonate rocks weren’t buried deeply enough to melt and become marble, a metamorphic process that would have removed the contaminants.

Figure 5. One of the many hills present within the study area. This one is capped by a prehistoric site encircled by a stone wall. The limestone to build the original wall and houses was quarried from the hill, which produced the low cliff seen in this image. Other exposures were exploited further down the slope to expand the settlement.

Figure 6. Prehistoric quarry showing thick bedding of the upper layer of sandstone and the thinner bedding of the lower layer (seen in the foreground, partly covered by grass). Any fossils contained within the limestone were destroyed during burial; however, the lack of any macrofossils from these rocks, which were deposited between about 360 and 320 my ago, suggests that they weren’t in the most favorable of environments for shellfish.

Figure 7. Geologic map of County Limerick. The study area is encircled by a ring of Carboniferous volcanic rocks (dark blue), which suggests that there was igneous activity (associated with orogeny) between 360 and 320 my ago, on the east side of the tectonic collision zone; the outcrop pattern suggests that a magma chamber was venting through a caldera. I didn’t see any evidence of the timing of this volcanism, so it may have been into unconsolidated sediments or later, when they were lithified. The limestone we saw in Figs. 3-6 is indicated by the light-blue areas on this map. As a side note, there is a 4500 year-old stone circle (Grange Stone Circle) at the western limit of the dark blue ring; it contains large blocks of volcanic breccia that I couldn’t identify in the field, because all of the blocks comprising the prehistoric circle were weathered to the same gray color. The identification is from a detailed archaeological map of the site that I did not photograph.

Figure 8. Reconstruction of Pangea about 200 my ago. The arrows indicate the collision of two tectonic plates. The square is where I have been reporting from NOVA; the circle is Ireland, where I am reporting now. Note that the two areas are offset by more than a thousand miles along the suture zone.
Comparison to North America. The rocks in the areas I have reported on in NOVA (square in Fig. 8) are either from the late Proterozoic eon and early Paleozoic era; or from the Triassic period, which is the time represented in Fig. 8. The Lower Carboniferous period (about 360 – 320 my)falls within a hiatus of more than 300 my in NOVA. Cambrian sediments were deposited unconformably on Proterozoic volcanics about 540 my ago there — the youngest being conglomerates exposed at Weverton Cliff.
The limestones exposed at Loch Gur were deposited in quiet water during this hiatus, which represents mountain building and subsequent erosion. The lack of evidence of this orogeny in NOVA while carbonate sediment was accumulating in Ireland makes sense because the latter was far removed from this Neoproterozoic/Paleozoic mountain range.
However, when we look further to the west and north from NOVA, we find thick layers of shale, sandstone, limestone and even coal beds; the states of Pennsylvania and New York reveal this orogeny in a continuous sedimentary sequence that contains rocks like those we’ve seen thus far in Ireland. I have reported on those in a previous post.
It is the nature of orogeny that crustal upheavals don’t leave direct evidence because high mountains are eroded by water, and produce a blanket of sediments in an immutable process.
We’ll see what else the Irish rocks have to say about that …
The View from Maryland

Figure 1. This post describes the geology along a short hike along the Appalachian trail (see Fig. 2) to the top of Weverton Cliff, in Maryland. This photo is looking west from the top, towards Harpers Ferry, West Virginia . The Potomac River runs below Weverton Cliff and through the pass in the distance.
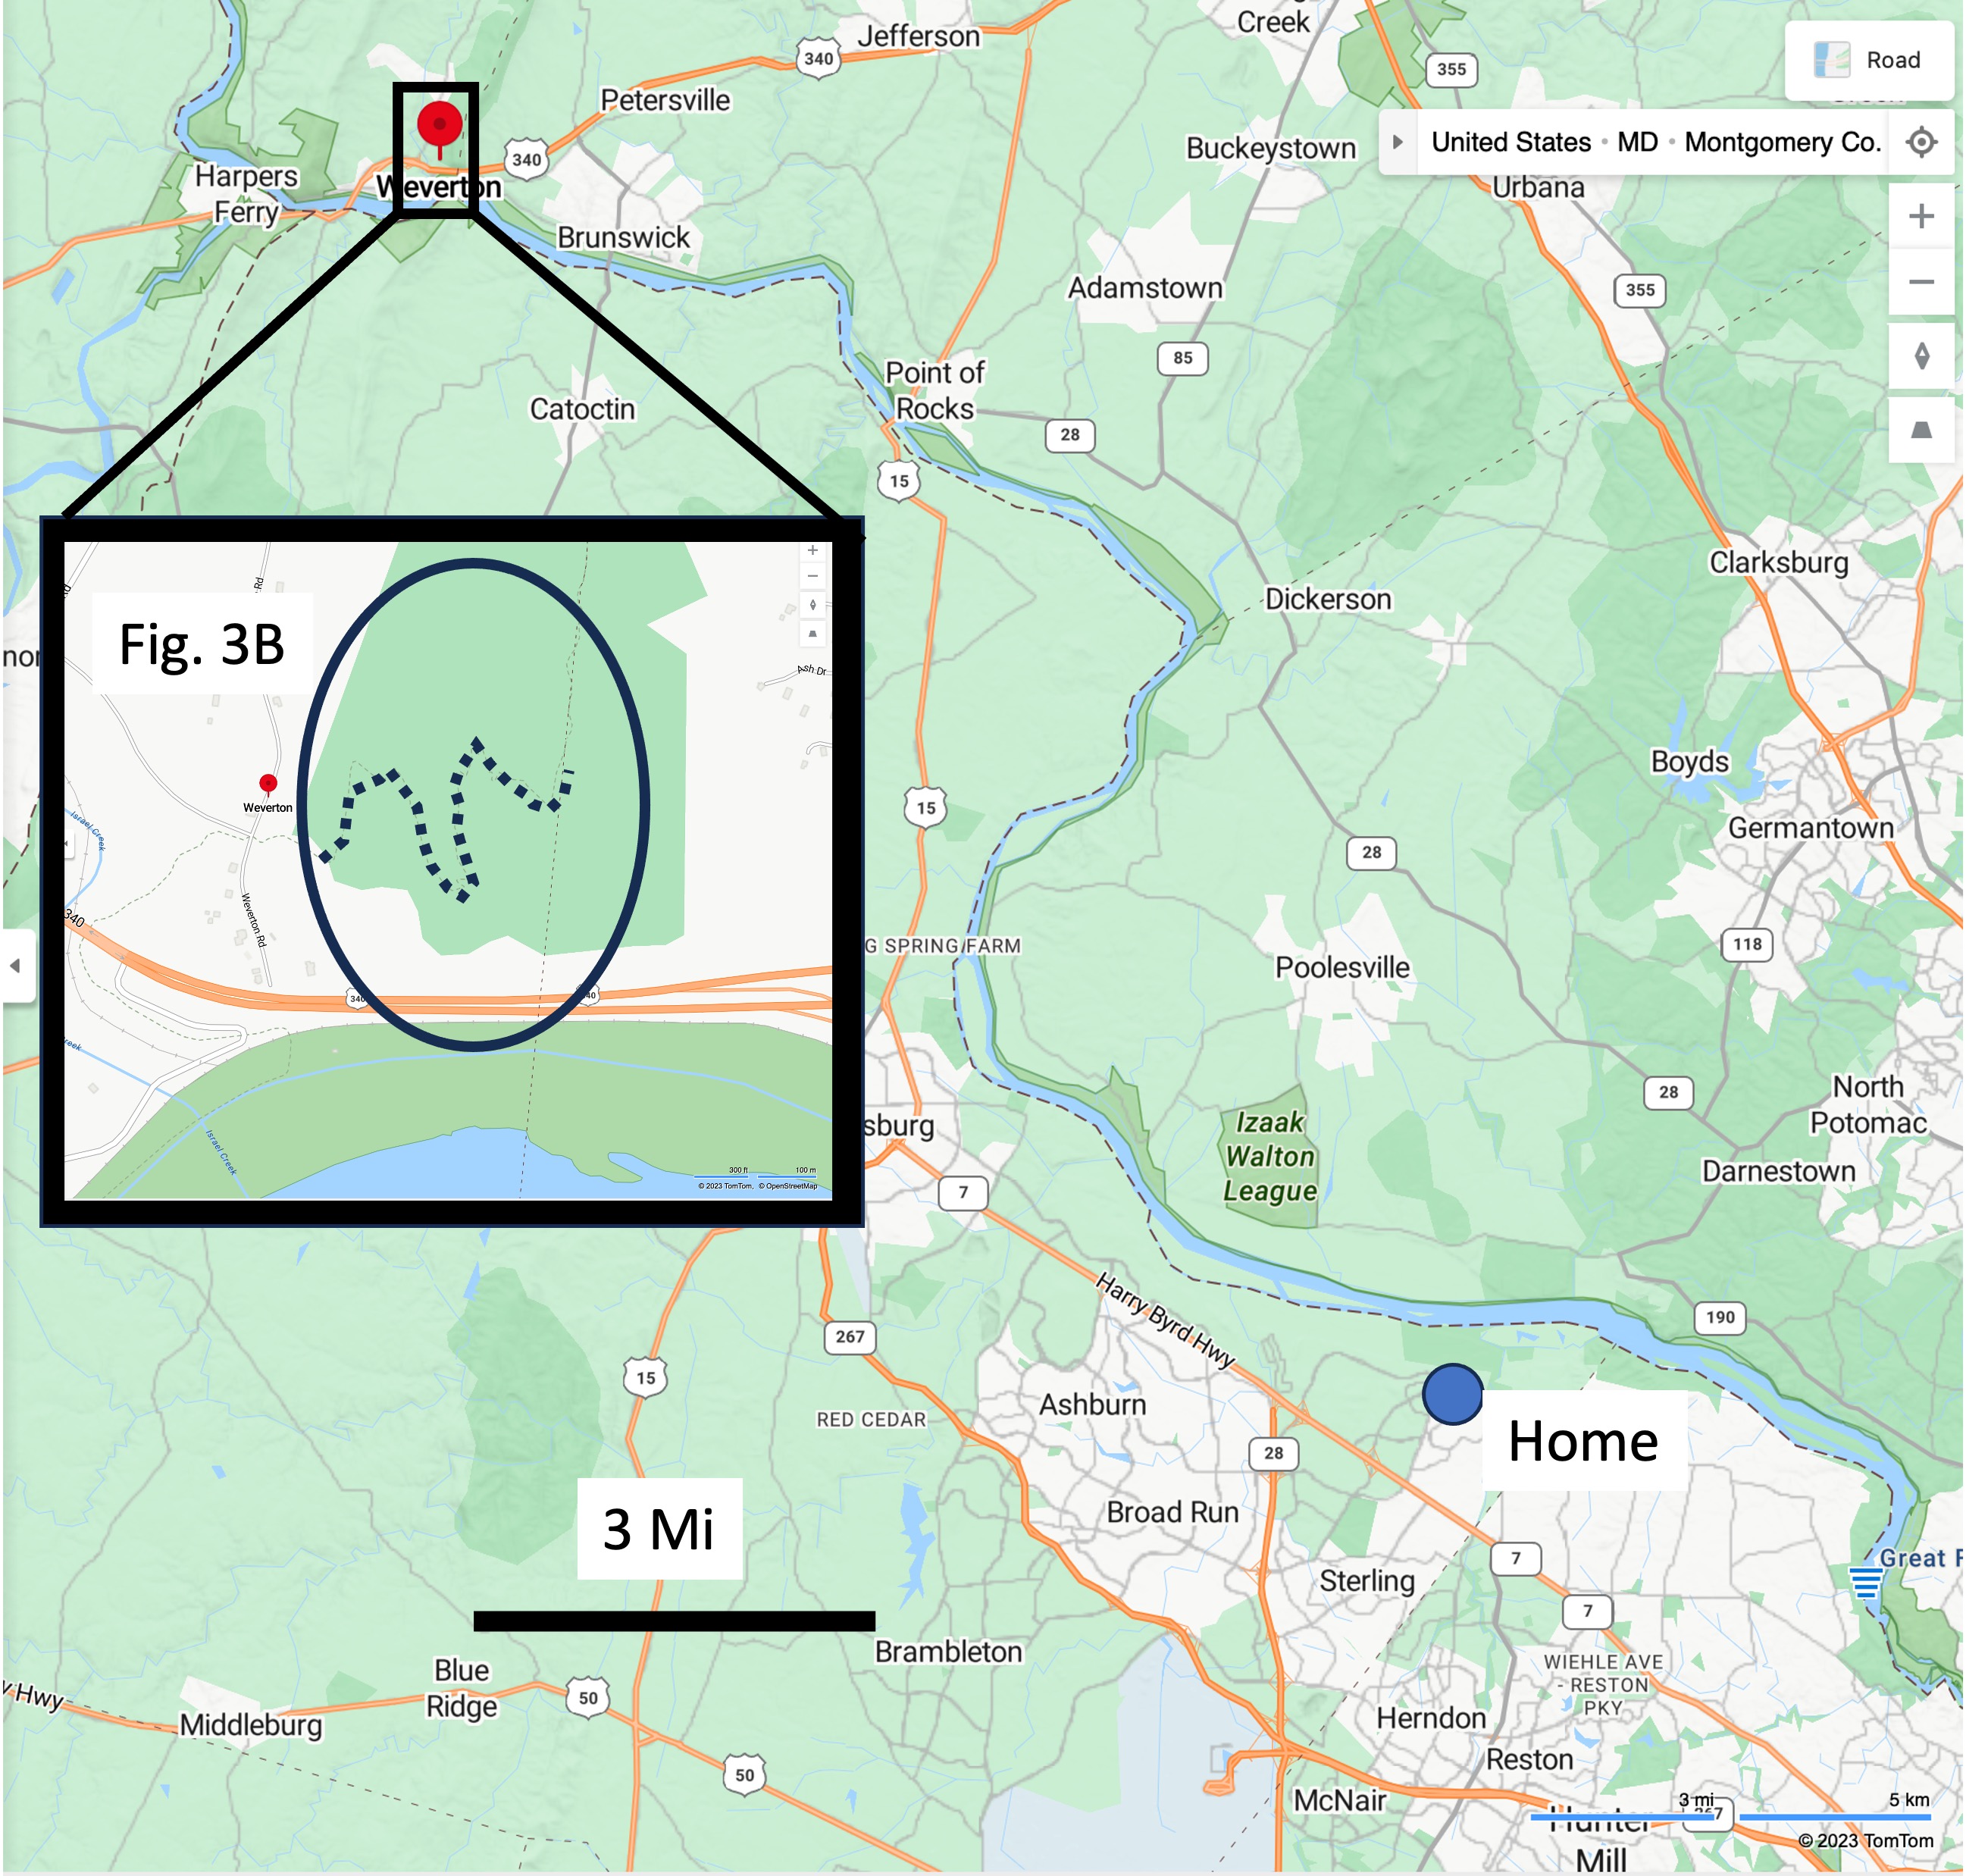
Figure 2. The study area is located on the Maryland side of the Potomac River near the border with West Virginia (inset map), only a few miles as the crow flies from my home in Sterling. The trail climbs the ridge through a series of switchbacks (dotted line in inset map).

Figure 3. Geologic maps of the study area. (A) This larger scale image shows the structural trend common to this part of the Appalachian orogenic belt. The green colors are Paleozoic metasedimentary rocks, which hold up better to erosion than Precambrian metavolcanic rocks (pink shades). (B) The Appalachian trail (dotted line) traverses Proterozoic rocks before crossing a normal fault (dashed line), and encountering Cambrian schist and metasedimentary rocks (Ch and Cw). The rocks are oriented with approximate strike (long line of T-shape at upper center) of 30 degrees east of north; and a dip (short line segment) to the SE of about 45 degrees.
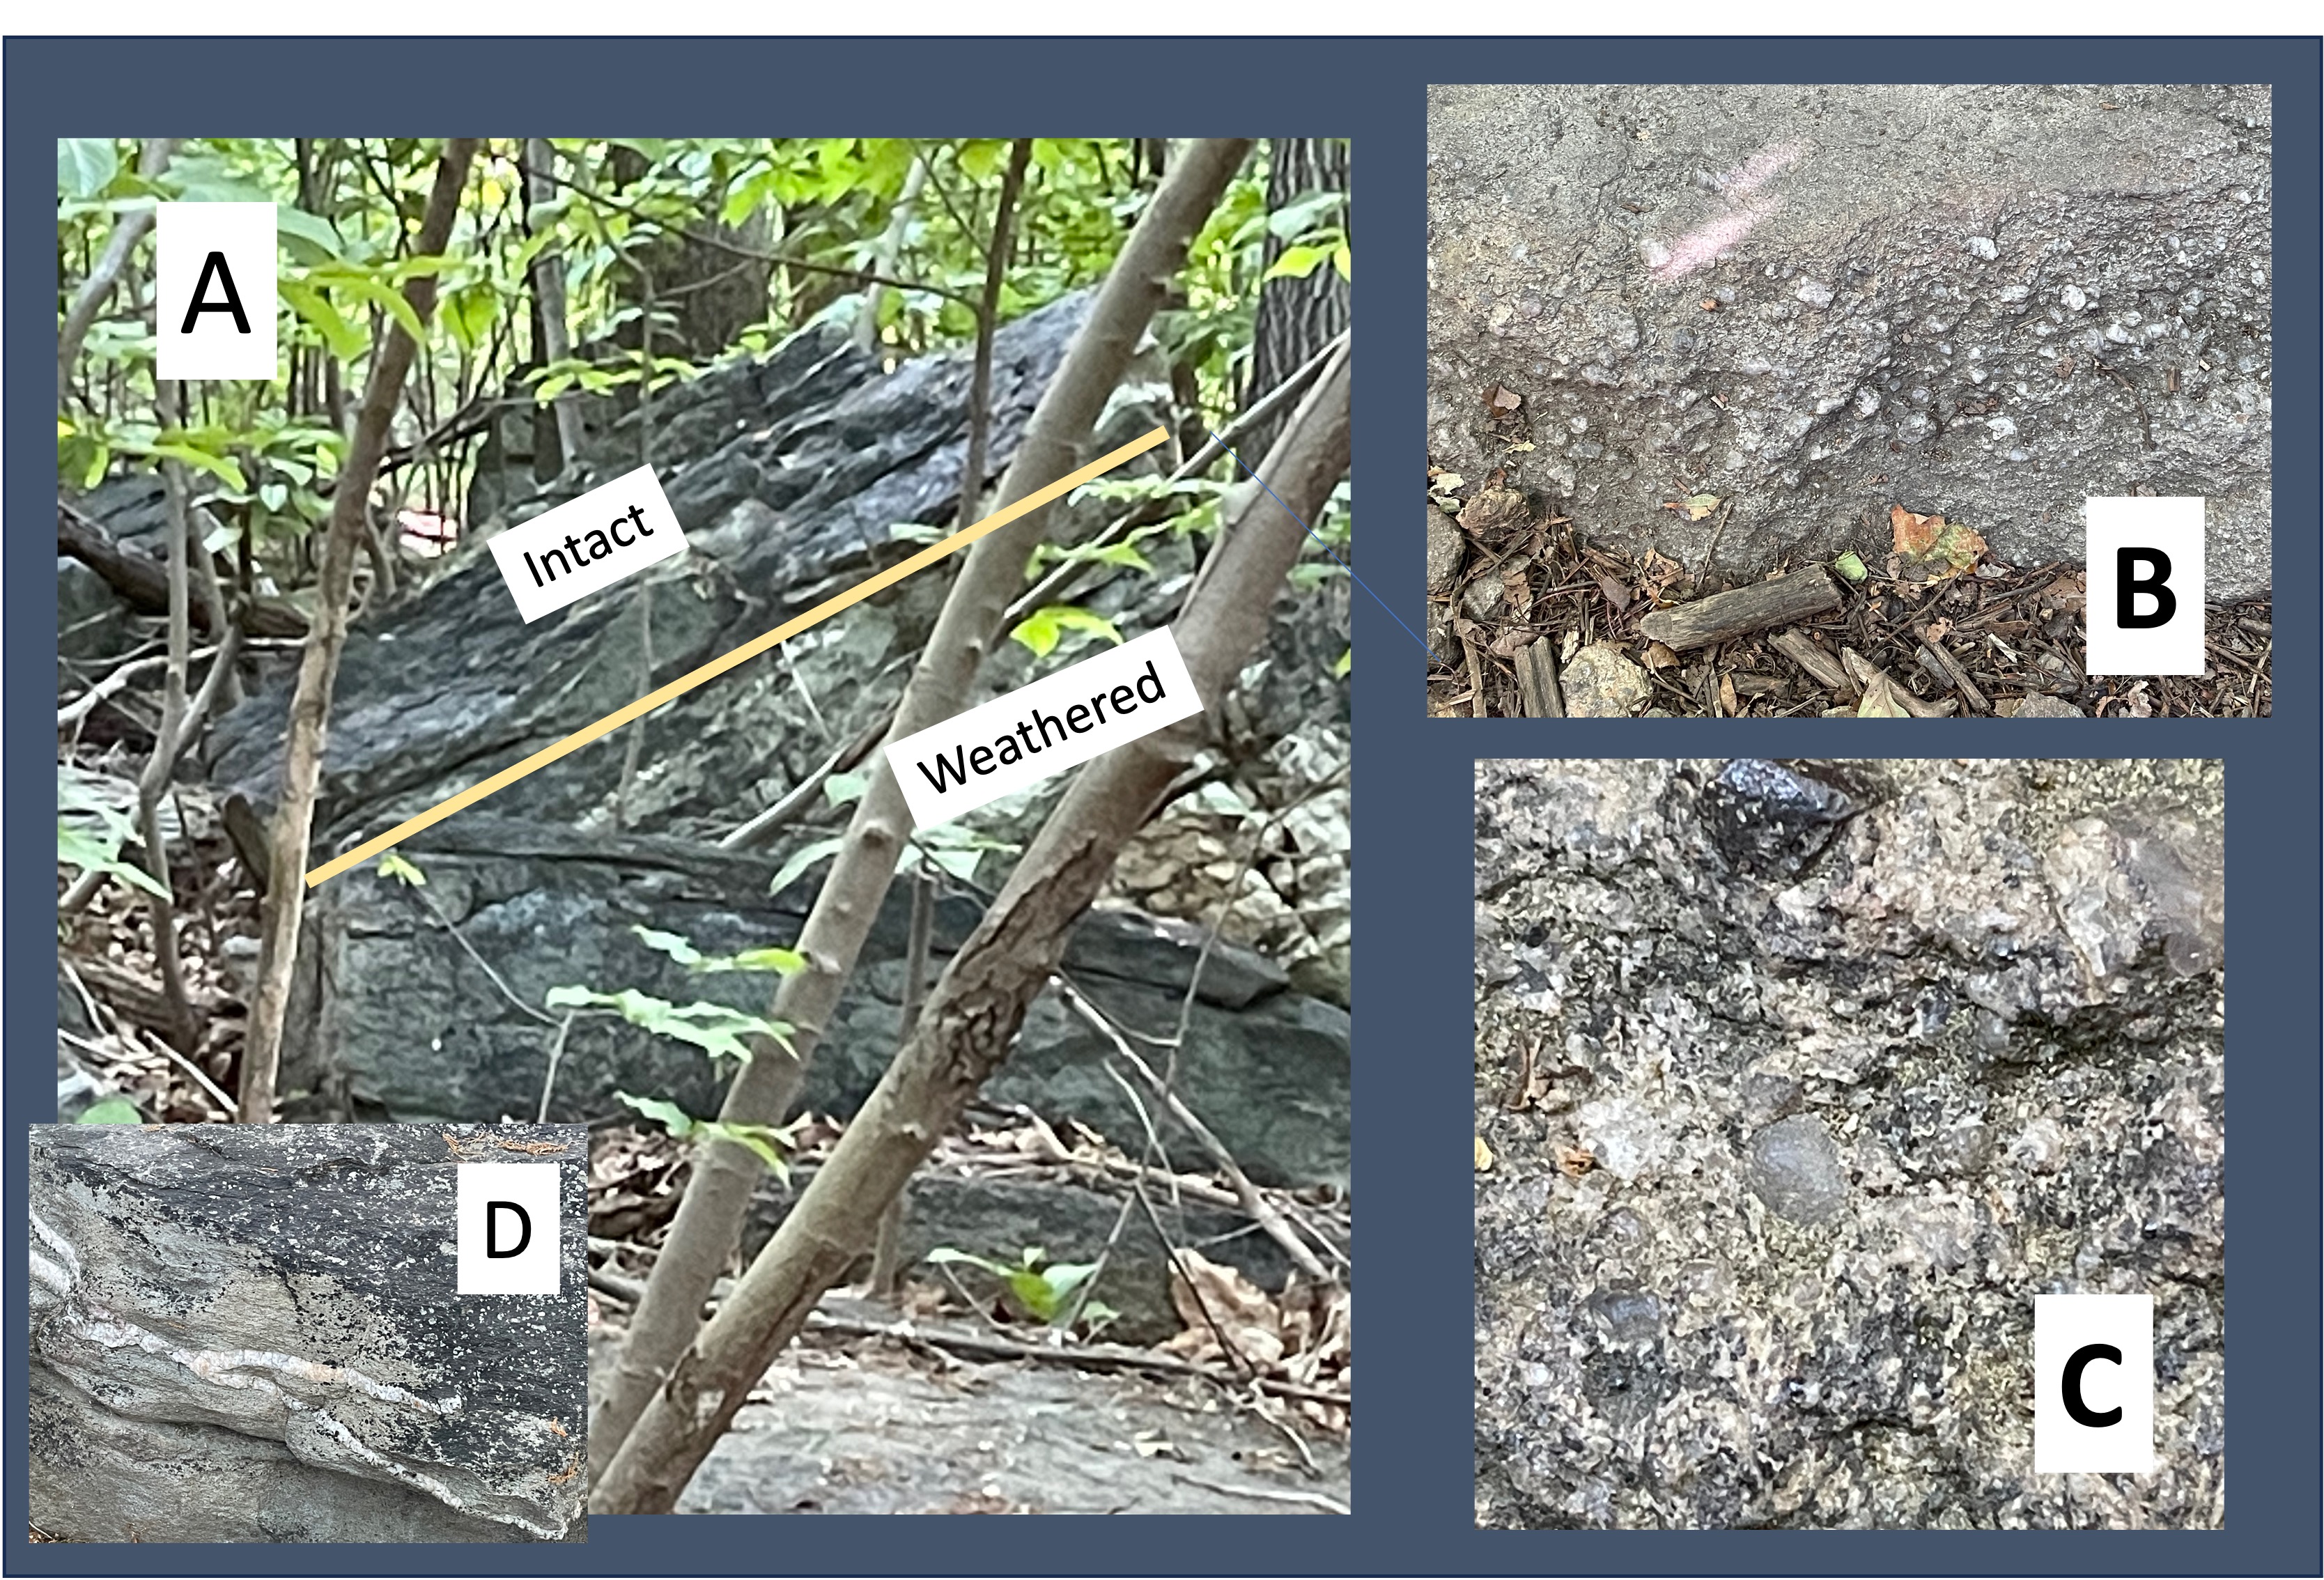
Figure 4. Images of the Harpers Formation taken at site 1 (see Fig. 3B for location). (A) Outcrop showing highly weathered schist at the bottom of the tilted section, similar to what we saw at Bull Run Nature Preserve. The rocks above are relatively intact but show fissility typical of metamorphosed sediments with a relatively high clay content. (B) Close-up of a loose boulder of conglomerate. Note the concentration of larger particles within a layer, with finer grains above and below. This suggests episodic high-flow transport events that transported gravel (there weren’t any land plants to reduce erosion 538 million years ago, when these sediments were originally deposited). (C) Image at 5X magnification of some of the larger grains: the gray is quartz; the irregularly colored clasts are rock fragments; and the dark one at the top may be a metamorphic mineral like garnet. (D) Light-colored minerals like quartz fill fractures and joints throughout the study area, especially within the Harpers Formation. This implies that the sediments had been buried and lithified, then uplifted; jointing occurs during stress relief, like mud cracks; then magma intruded the area and injected liquid (not thick magma) into every available crack.

Figure 5. Photos of Weverton Formation at Site 2 (see Fig. 3B for location): (A) The total exposed section is at least 100 feet thick, comprising mostly sandstone and siltstone with thin layers of shale (identified by being eroded to look like soil). Note the steep dip of the bedding. (B) Conglomerate similar to the Harpers Formation, but with a larger range of sizes, and less matrix. (C) Close-up (5X magnification) of the sandy matrix; the poorly sorted nature of the sediment is evident in the finer sizes, including silt and sand, as well as (originally) clay; this range of particle sizes produced the irregular surface seen in this photo. (D) The exposure at Site 3 shows original bedding warped during burial and deformation; the sediment layers were squeezed like a sponge and produced the lenticular bedding seen in this image.

Figure 6. The bed of the Potomac River reveals resistant layers, which produce the rocky sections seen in this photo taken from Site 3 (top of Weverton cliff).
We saw the Harpers and Weverton Formations before but this is the best exposure so far, which isn’t surprising because the Weverton Formation was named after this location. Let’s see what this field trip adds to what we already learned about the geologic history of the tri-state area (VA-WV-MD).
The proto-North American and Europe plates were moving towards each other during the Proterozoic (~2.5 by to 540 my ago), closing the Iapetus Ocean and smashing any intervening islands onto their margins. Metavolcanic rocks (pink in Fig. 3) were produced during this time, spewed into submarine trenches or along continental margins. Vast quantities of clay were deposited in shallow seas as the continents converged, deposited as the Harpers Formation. The conglomerate of the upper Harpers and Weverton Formations were deposited from rapidly rising mountains and deposited on top of these much older rocks, which may have been exposed to erosion during the millions of years this process required. More sediments were deposited on top of these, burying them as much as ten miles, as the continents continued to collide.
Then … silence … the resulting mountain range stopped rising and began to erode; the sediments had become rock and they fractured, producing joints like we see in Fig. 4D. However, the magma produced by this titanic collision hadn’t cooled, and the joints were filled with hot fluids that flowed into every nook and cranny.
The transition from a collisional margin to an extensional one lasted from 538 my to 200 my ago (that’s 338 my!), at which time Pangea was torn apart by irresistible mantle convection. That is when these rocks were tilted along a series of faults like the Bull Run fault, as they slid into grabens produced by the stretching crust.
My next post will be from Ireland where we’ll see what the rocks tell us from the other side of the still-widening Atlantic Ocean …
Multiple Faulting at Bull Run Nature Preserve
This post takes us a few miles south of Banshee Reeks Nature Preserve along Bull Run Fault. We’re going to see several faults and rocks that together represent the closing of Iapetus Ocean and opening of the Atlantic. This is a geologically complex area and my explanations will get speculative, but that’s what we do at Rocks and (no) Roads!

Figure 1. Geologic maps from the Rock D app, which I recommend to anyone with the slightest interest in geology. It shows the latest data, road maps, trails, your position, and descriptions of the rocks. It even has a Brunton compass tool. (A) Map of study area, which is less than 10 miles south of Banshee Reeks. As we discussed earlier, the pink rocks to the west of Bull Run Fault (BRF) are Proterozoic (between 1 billion and 538 million years old) whereas the blue shades are Jurassic (~200 – 145 my); the brown shades are Paleozoic rocks from the Cambrian period (~538 my). (B) Close-up map showing rocks and faults as follows: Zc = Proterozoic metamorphosed basalts with minor quartzite; Ch = Cambrian schists, phyllite, quartzite, conglomerate and siltstone; Cw = similar to Ch but dominated by quartzite; Jm = conglomerate, sandstone and siltstone interbedded. In addition to BRF another fault has been identified in the area, which I have tentatively identified as a Cambrian thrust fault (CTF).

Figure 2. The blue dot in the inset map shows the location of the images. This was a large boulder that is rounded from erosion but not finished (like for building houses); it is too big and heavy to be used for that purpose. The inset photo shows its pink hue with an irregular surface, suggesting that this is quartzite; I tentatively assign it to the Proterozoic rocks because the Catoctin Formation (Zc) contains marker beds of quartzite, and it is squarely within the previously mapped outcrop area of Zc.

Figure 3. Image looking at the bottom of interlayered siltstone and shale deposited about 538 my ago. A close-up of a loose boulder (inset) shows the characteristic sheen of phyllite as well as evidence of clasts, suggesting that this sample is a metamorphosed conglomerate. The Harper Formation includes schist lower in the section and conglomerate higher; schist is formed from mudstone whereas sandstone and siltstone, as well as conglomerate to some degree, don’t undergo significant changes in mineralogy at low metamorphic grade. Interbedded schist and quartzite implies rapid changes in either sea level or sediment source when these rocks were originally deposited.
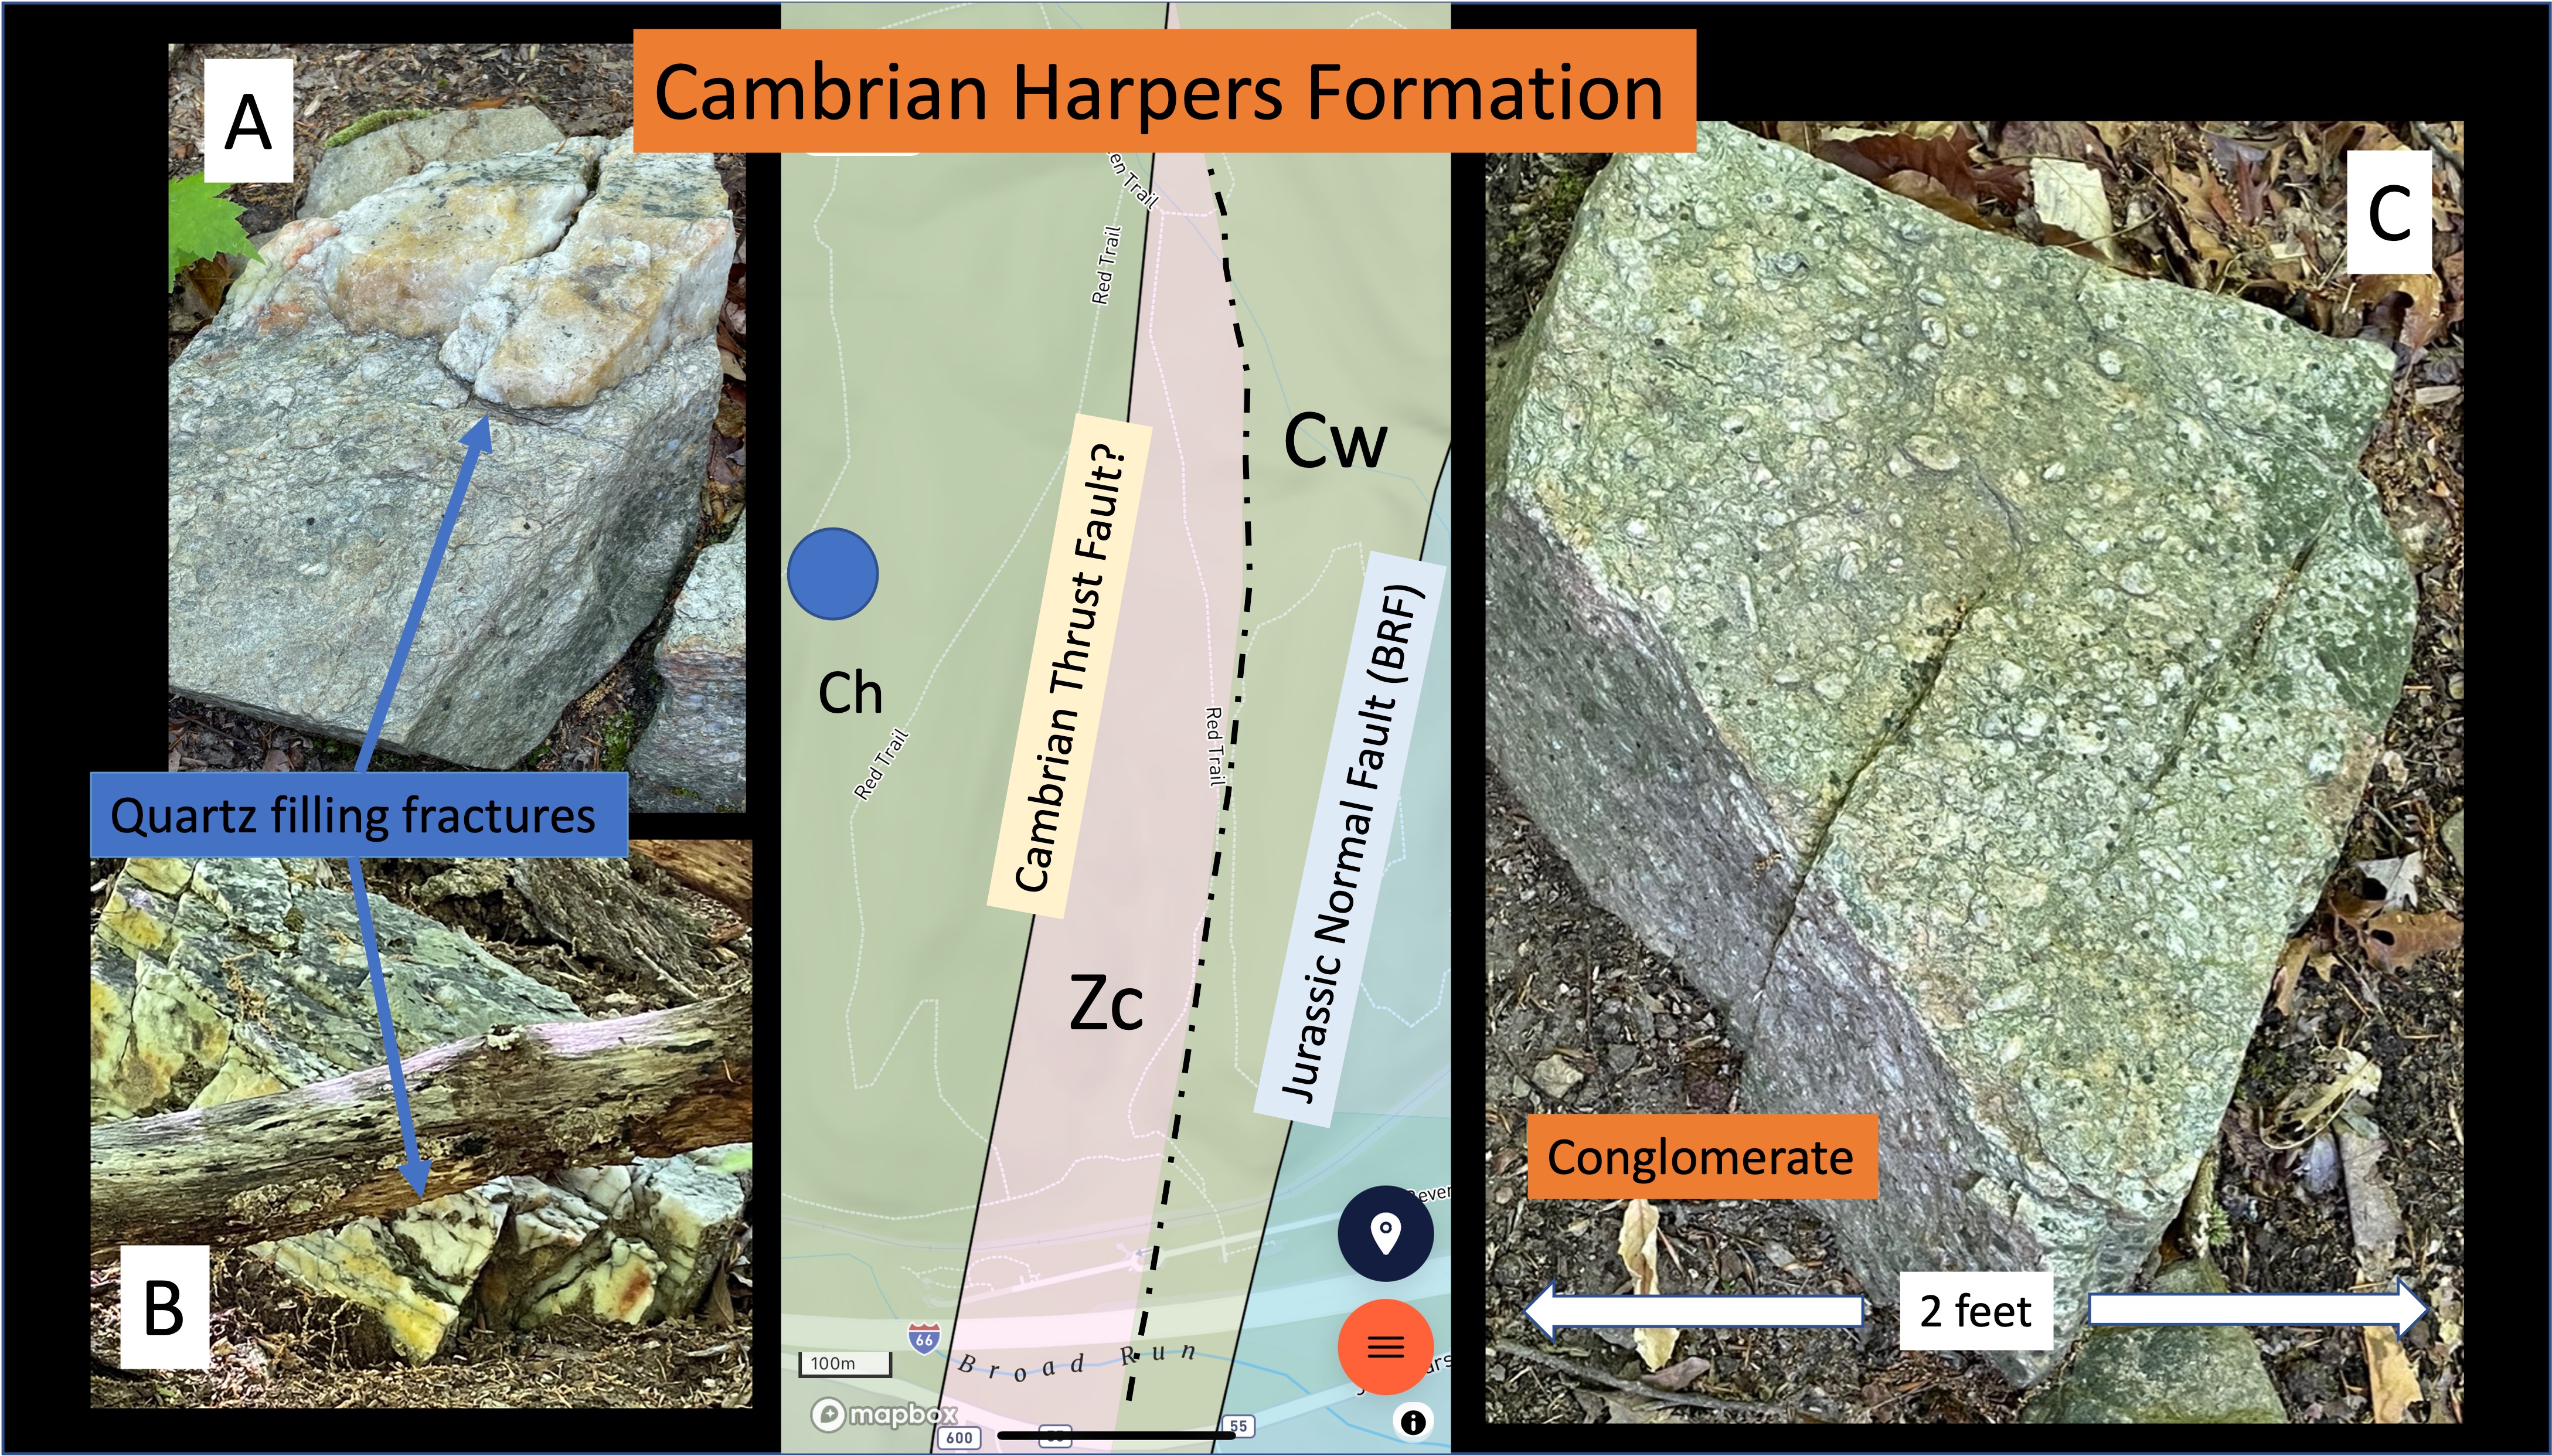
Figure 4. These photos of loose boulders were taken along a trail on a slope covered with soil (see inset map for location). (A) conglomerate with thick quartz deposit along a fracture, which would have been injected during deep burial and metamorphosis, probably originating from interbedded shale; which became schist. (B) Vein containing white (quartz) and yellow minerals along with a black band; the latter two minerals could be stains in the quartz or something else. (C) Good example of conglomerate, showing rounded pebbles less than one inch in diameter in a fine matrix. These rocks are similar to the inset photo in Fig. 3 but reveal less schistose banding, probably because of a higher quartz content in the matrix.
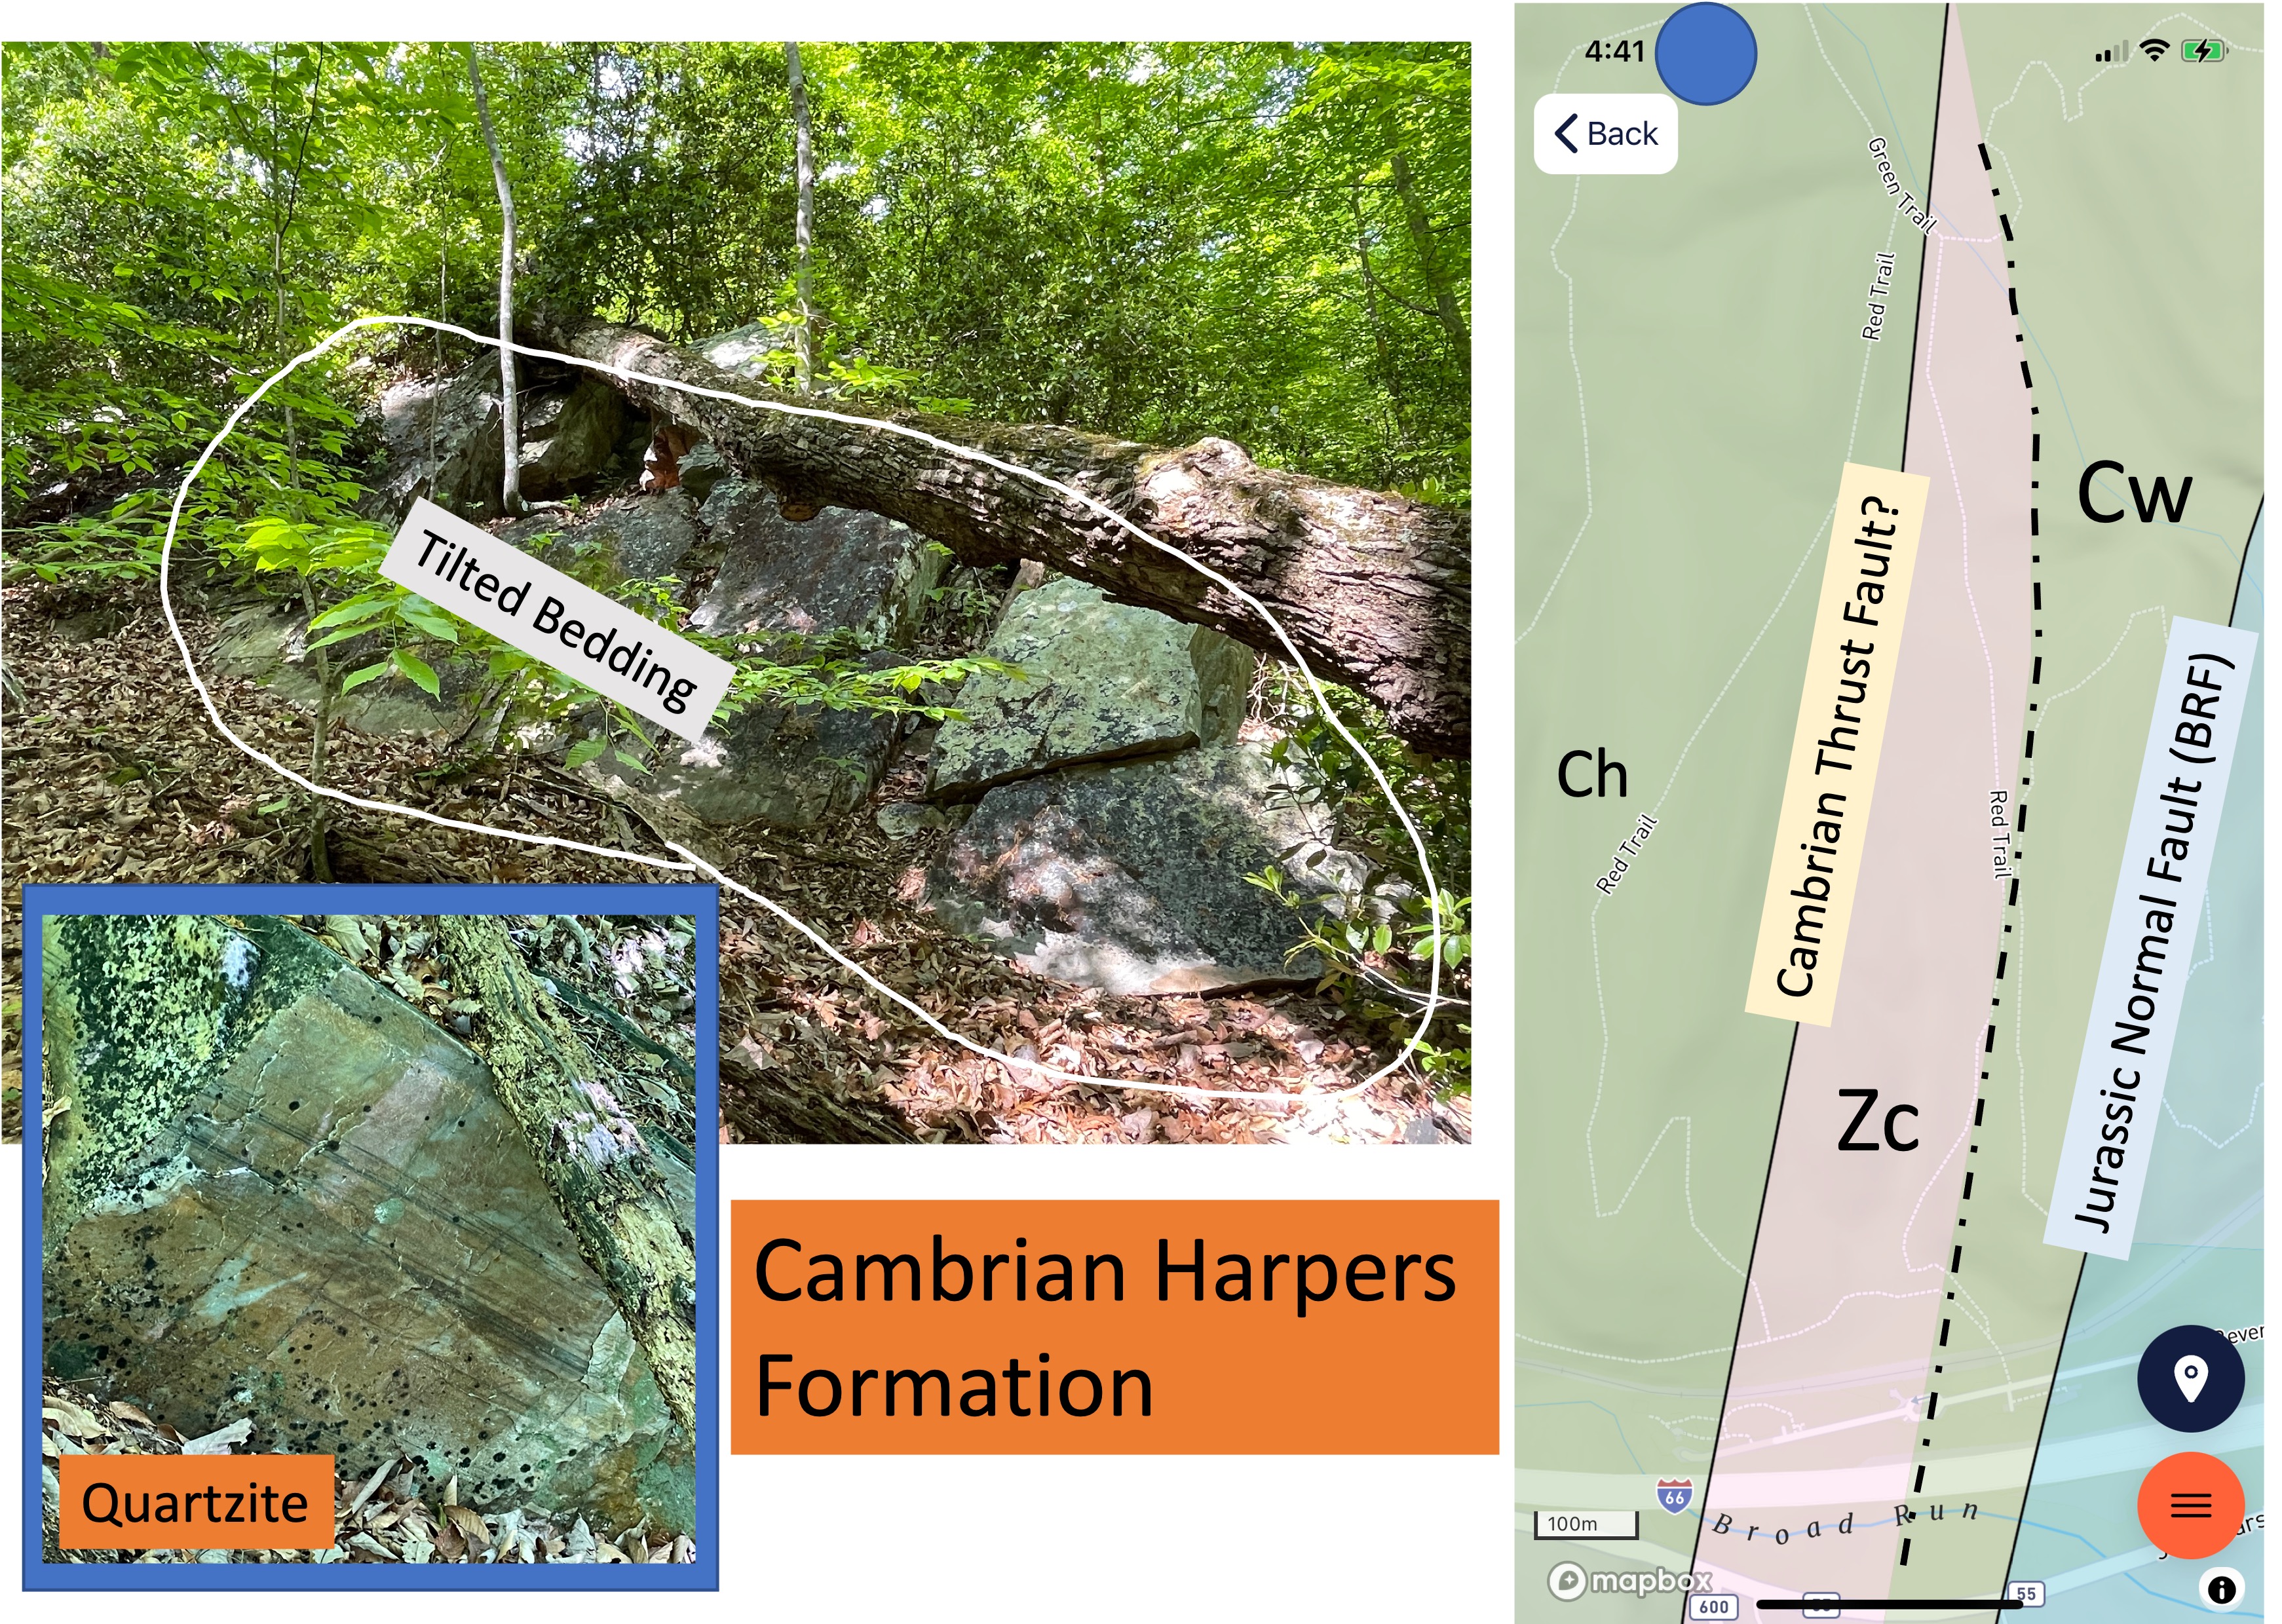
Figure 5. Excellent exposures of the Harpers Formation were found at the northern end of the study area (see index map for location), where beds were tilted about 30 degrees to the east. There were also large blocks more than six-feet across that were horizontal (not shown). They were too large to have been placed there without substantial effort, so my best guess is that they were resistant to erosion and dropped down as easily eroded layers were removed beneath them; that sounds like a flimsy explanation but they were not attached to the tilted beds in this photo. The inset shows bedding in the quartzite (in place) that suggests deposition in a river because there is no evidence of cross-bedding (i.e. wave action). However, the thin laminae (dark lines) suggest a quiet environment, possibly a delta.
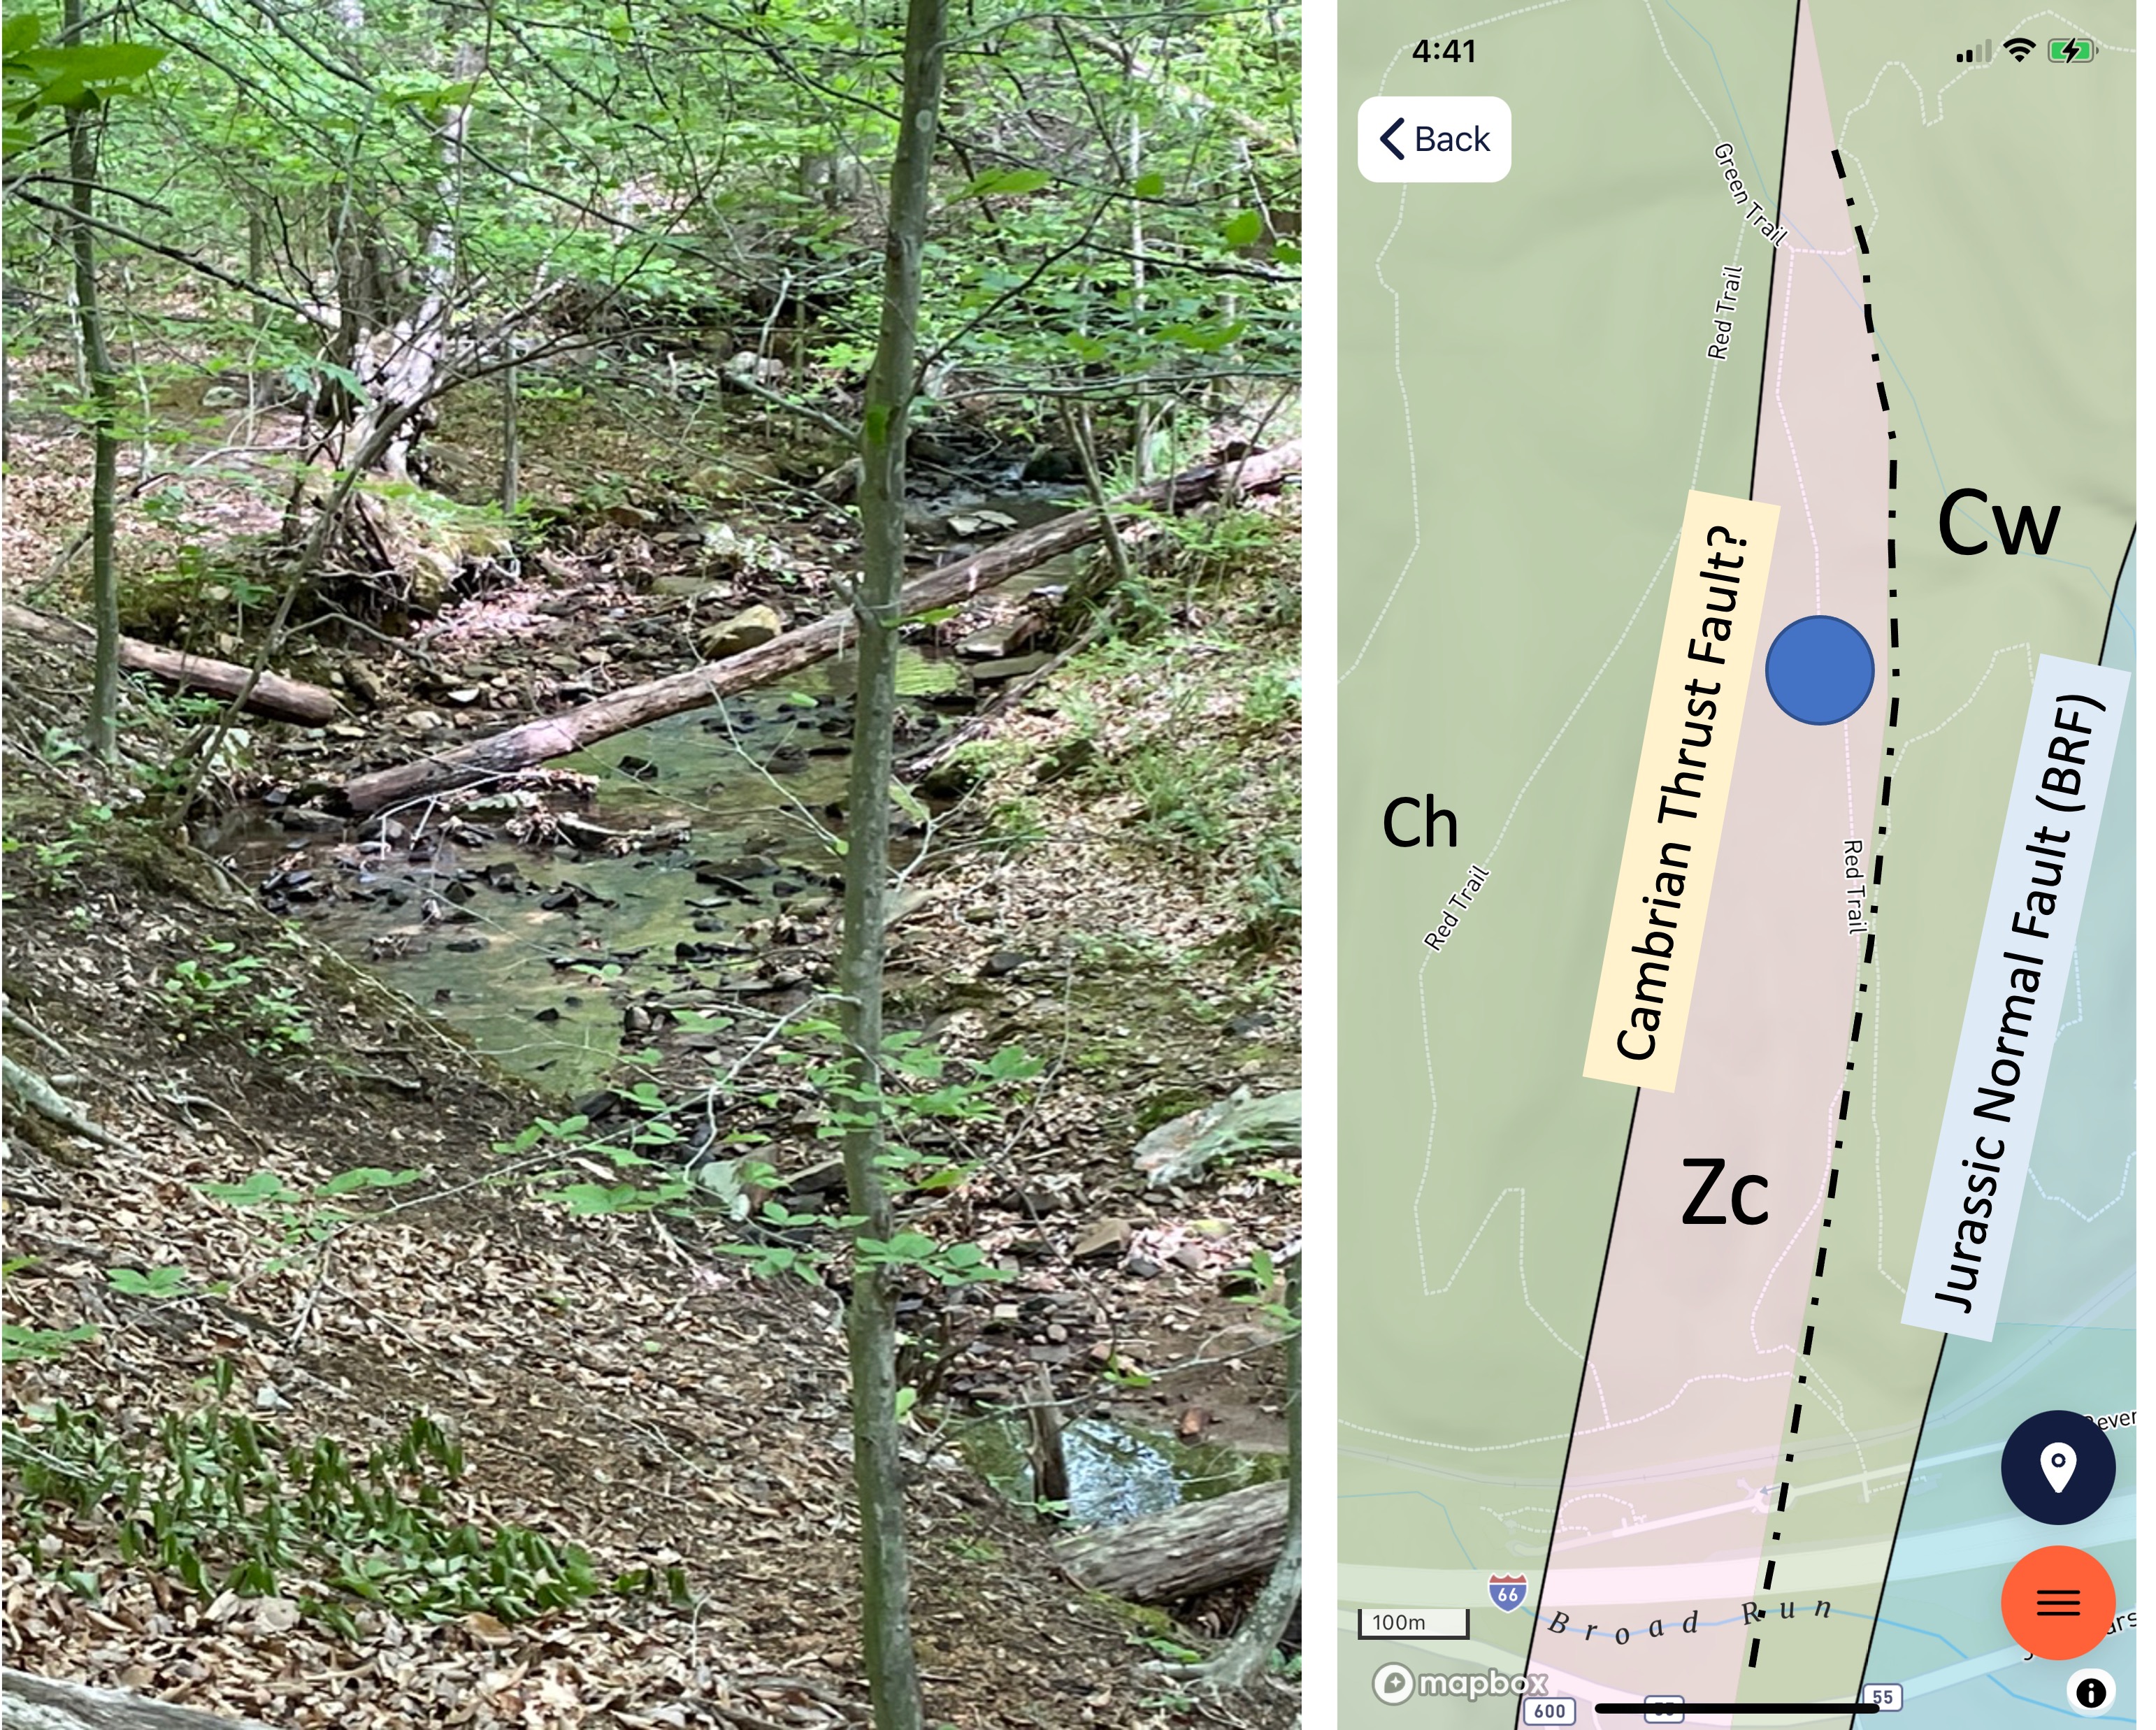
Figure 6. Sometimes you can recognize rocks by their absence. This photo was taken within the metamorphosed basalts of the Catoctin Formation (Zc in inset map), which weather rapidly compared to quartzite and even schist. The entire area shown as Zc in the inset map formed a broad, flat, shallow valley with a stream meandering through it. All of the rocks I saw along the stream were quartzite eroded from the surrounding ridges. The contact between the older rocks (Zc) and the younger ones (Cw) cannot be ascertained in this area because we didn’t find any Catoctin Formation rocks in place to check their orientation. The contact is therefore shown as a dot-dash line; the Cambrian rocks may have been deposited directly on the Proterozoic sediments, or after a period of erosion (disconformity), possibly even after deformation (angular unconformity).

Figure 7. Along the eastern side of the study area we encountered the BRF, which juxtaposed Jurassic conglomerate against Cambrian quartzite, forming an outcrop consisting of large protrusions of bedrock. As can be seen in the background of this photo, a steep slope fronted the outcrop. The bedding in the inset photo suggests that they are dipping to the west, opposite of the older rocks seen in Figs. 3 and 5. These conglomerates were probably deposited after BRF began to move but before faulting ceased, tilting them as they slid down BRF, which is a normal fault.

Figure 8. Schematic thrust fault zone, showing layers (blue) sliding along low-angle reverse faults over time, from top to bottom. We can apply this model to Bull Run Nature Preserve by first reversing the image left-to-right; the blue rocks represent Proterozoic rocks (Zc) deposited between 1 by and 538 my ago; the green representsCambrian rocks (Ch and Cw) deposited between 538 and 511 my ago. This is the only physical mechanism that can explain the presence of Zc east of Ch in the geologic maps. Note the resulting tilt of the rock layers after being thrust over younger rocks; the tilt away from the fault. This is consistent with what we see in Figs. 3 and 5.
Summary. Beginning about one-billion years (by) ago, the Iapetus Ocean began to close, ringed by subduction zones on the east and west. As the distance between proto-North America and proto-Europe shortened, magma began to form within the deepest parts of the crust that was being subducted. Volcanism ensued and, for hundreds of millions of years, this continued; igneous and volcanic rocks formed the Catoctin Formation (Zc in the maps).
As the Cambrian period began about 540 my ago, sandy sediments were deposited on top of this pile of ancient rocks. This huge pile of rock of all types was jammed into proto-Europe and buckled (see Fig. 8), sliding older rocks over younger and forming an overthrust belt, all of this occurring deep beneath a mountain chain as high as the Himalayas. We have seen the roots of these mountains in a previous post.
This collision ceased when the resistance of so many rocks with nowhere else to go overcame the forcing mechanism; wind, water, and ice went to work, eroding these mountains for almost 300 million years. By then what had been deeply buried (e.g. Zc and Ch) was exhumed, exposed to the atmosphere and ocean.
In a magical dance that geologists call “upper mantle processes”, the supercontinent, Pangea, was torn apart along the same suture that had created it from two smaller continents. Bull Run Fault was near the western margin of this rift zone. Conglomerate was deposited within the rapidly subsiding basins formed by this crustal stretching (e.g. Jm). Just as with the collisional cycle that preceded rifting, sedimentation and structural deformation occurred at the same time. Thus the Jurassic conglomerates we saw in Fig. 7 were tilted to the west as they slid into a graben. For the next 200 million years, they sank into the earth as the rift zone cooled, along with Proterozoic and Cambrian rocks (e.g. Zc, Ch, Cw), and waited for isostasy to bring them back to the surface.
This post has awkwardly played a few notes of a symphony that lasted a billion years.
It’s all there in the rocks …
Minor Faults at Banshee Reeks Nature Preserve
This post explores some more around Bull Run Fault (BRF), following up on the previous post. The original motivation was to see if Goose Creek Reservoir was low like Beaverdam Creek Reservoir, but that proved impossible because there is no access. It is surrounded by private land posted no trespassing. So instead, we went to a local nature preserve to see what we could find. We had no problem finding interesting geology to explore.

Plate 1. Geologic map of the study area, showing several features from the last post. This post focuses on Area A (black square) and Area B (purple rectangle). Jurassic and Triassic sedimentary rocks (shown in various green hues) are cut by Jurassic diabase (pink hues). The diabase cuts across the older rocks, forming sills and dikes, which this map shows well; the irregularity of the contacts between the igneous and sedimentary rocks is due to this cross-cutting. In summary: Proterozoic rocks (left side of BRF) were deposited and/or emplaced during collision of proto-North America and proto-Europe about 600 my ago; the resulting mountain chain then eroded and deposited sedimentary rocks; erosion removed this thick section of rock over the following 300 my; the earth’s crust began to stretch and sedimentary rocks were deposited in the resulting low areas as the resulting supercontinent (called Pangea) split apart; the crust finally broke and BRF was a major fracture; magma rising from the mantle filled fractures and weak areas to create extensive diabase sheets and dikes; these sediments/igneous rocks were buried under thousands of feet of sediment until the crust rebounded isostatically, and another cycle of erosion began. This Wilson Cycle is recorded in the geologic map.

Plate 2. Exposure of Bull Run Siltstone from Area A in Plate 1, showing similar variability as at other locations. Silt and sand was deposited in intermontane basins as the crust pulled apart about 200 my ago. This series of sand, silt, and mudstone is a couple of miles thick and varies within the right side of Plate 1; this variability resulted from river deltas switching about during the millions of years represented by these rocks.
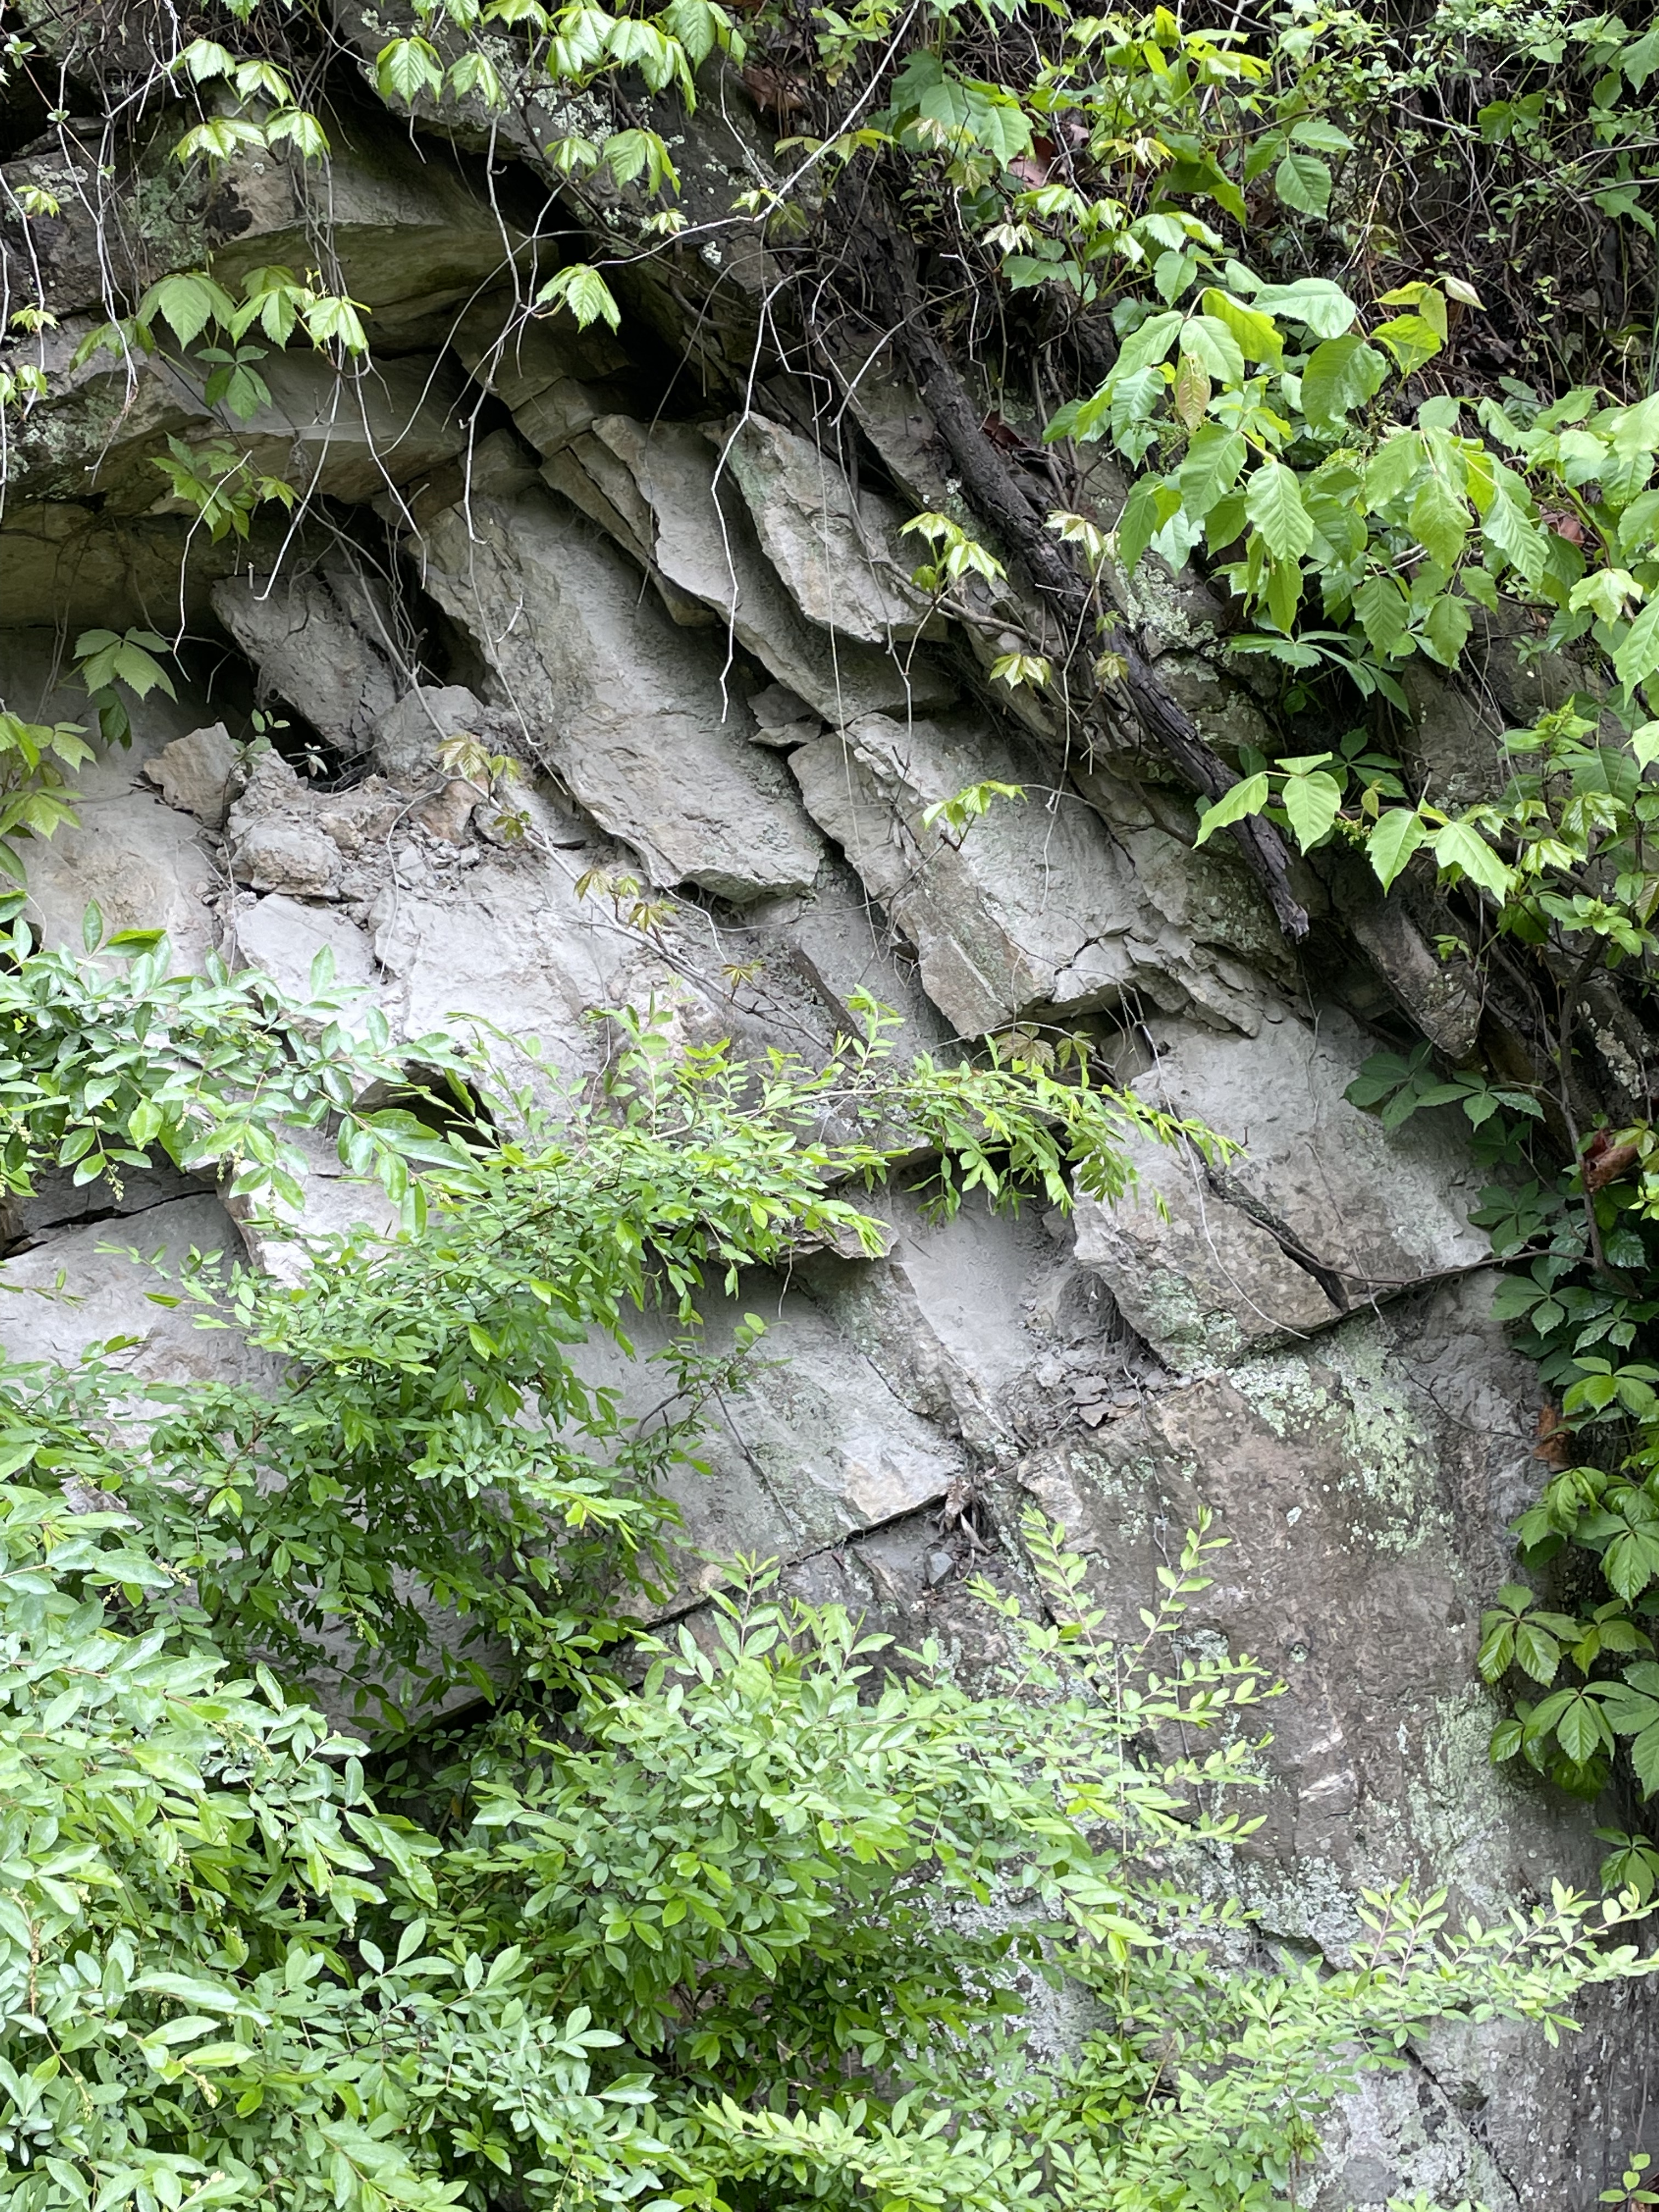
Plate 3. Close-up of rocks from Plate 3, showing powdery material that indicates intense crushing during faulting. In fact, this location is very near a fault (labeled F1 in Plate 2). The fault was not visible along the road, probably because the rocks were highly fractured and weathered faster than those further removed. Note the near-vertical fractures, which are perpendicular to the bedding planes seen in Plate 2.

Plate 4. Geologic map of Area B (see Plate 1). There are two faults running approximated east-to-west in the map. The more-northern one (unlabeled) can be seen to displace the Jurassic conglomerate to the east (pinkish area offset ESE of Oatlands Plantation). The southern fault (labeled F2) displaces this same rock within Banshee Reeks Nature Preserve.

Plate 5. Photo taken where fault F2 crosses a stream bed (see Plate 4). I used a question-mark to identify F2 because I didn’t go down to the stream and dig around to identify displaced sedimentary beds. From the trail we can seen that the sediment to the right of F2 is coarse whereas to the left is finer. At this location, the coarser sediment is Jurassic conglomerate, deposited as BRF began to uplift the plateau to the west (see Plate 1). Minor faults like this one and F1 (see Plate 1) released local stresses and are not necessarily oriented along the regional structural trend of 30 degrees east of north.
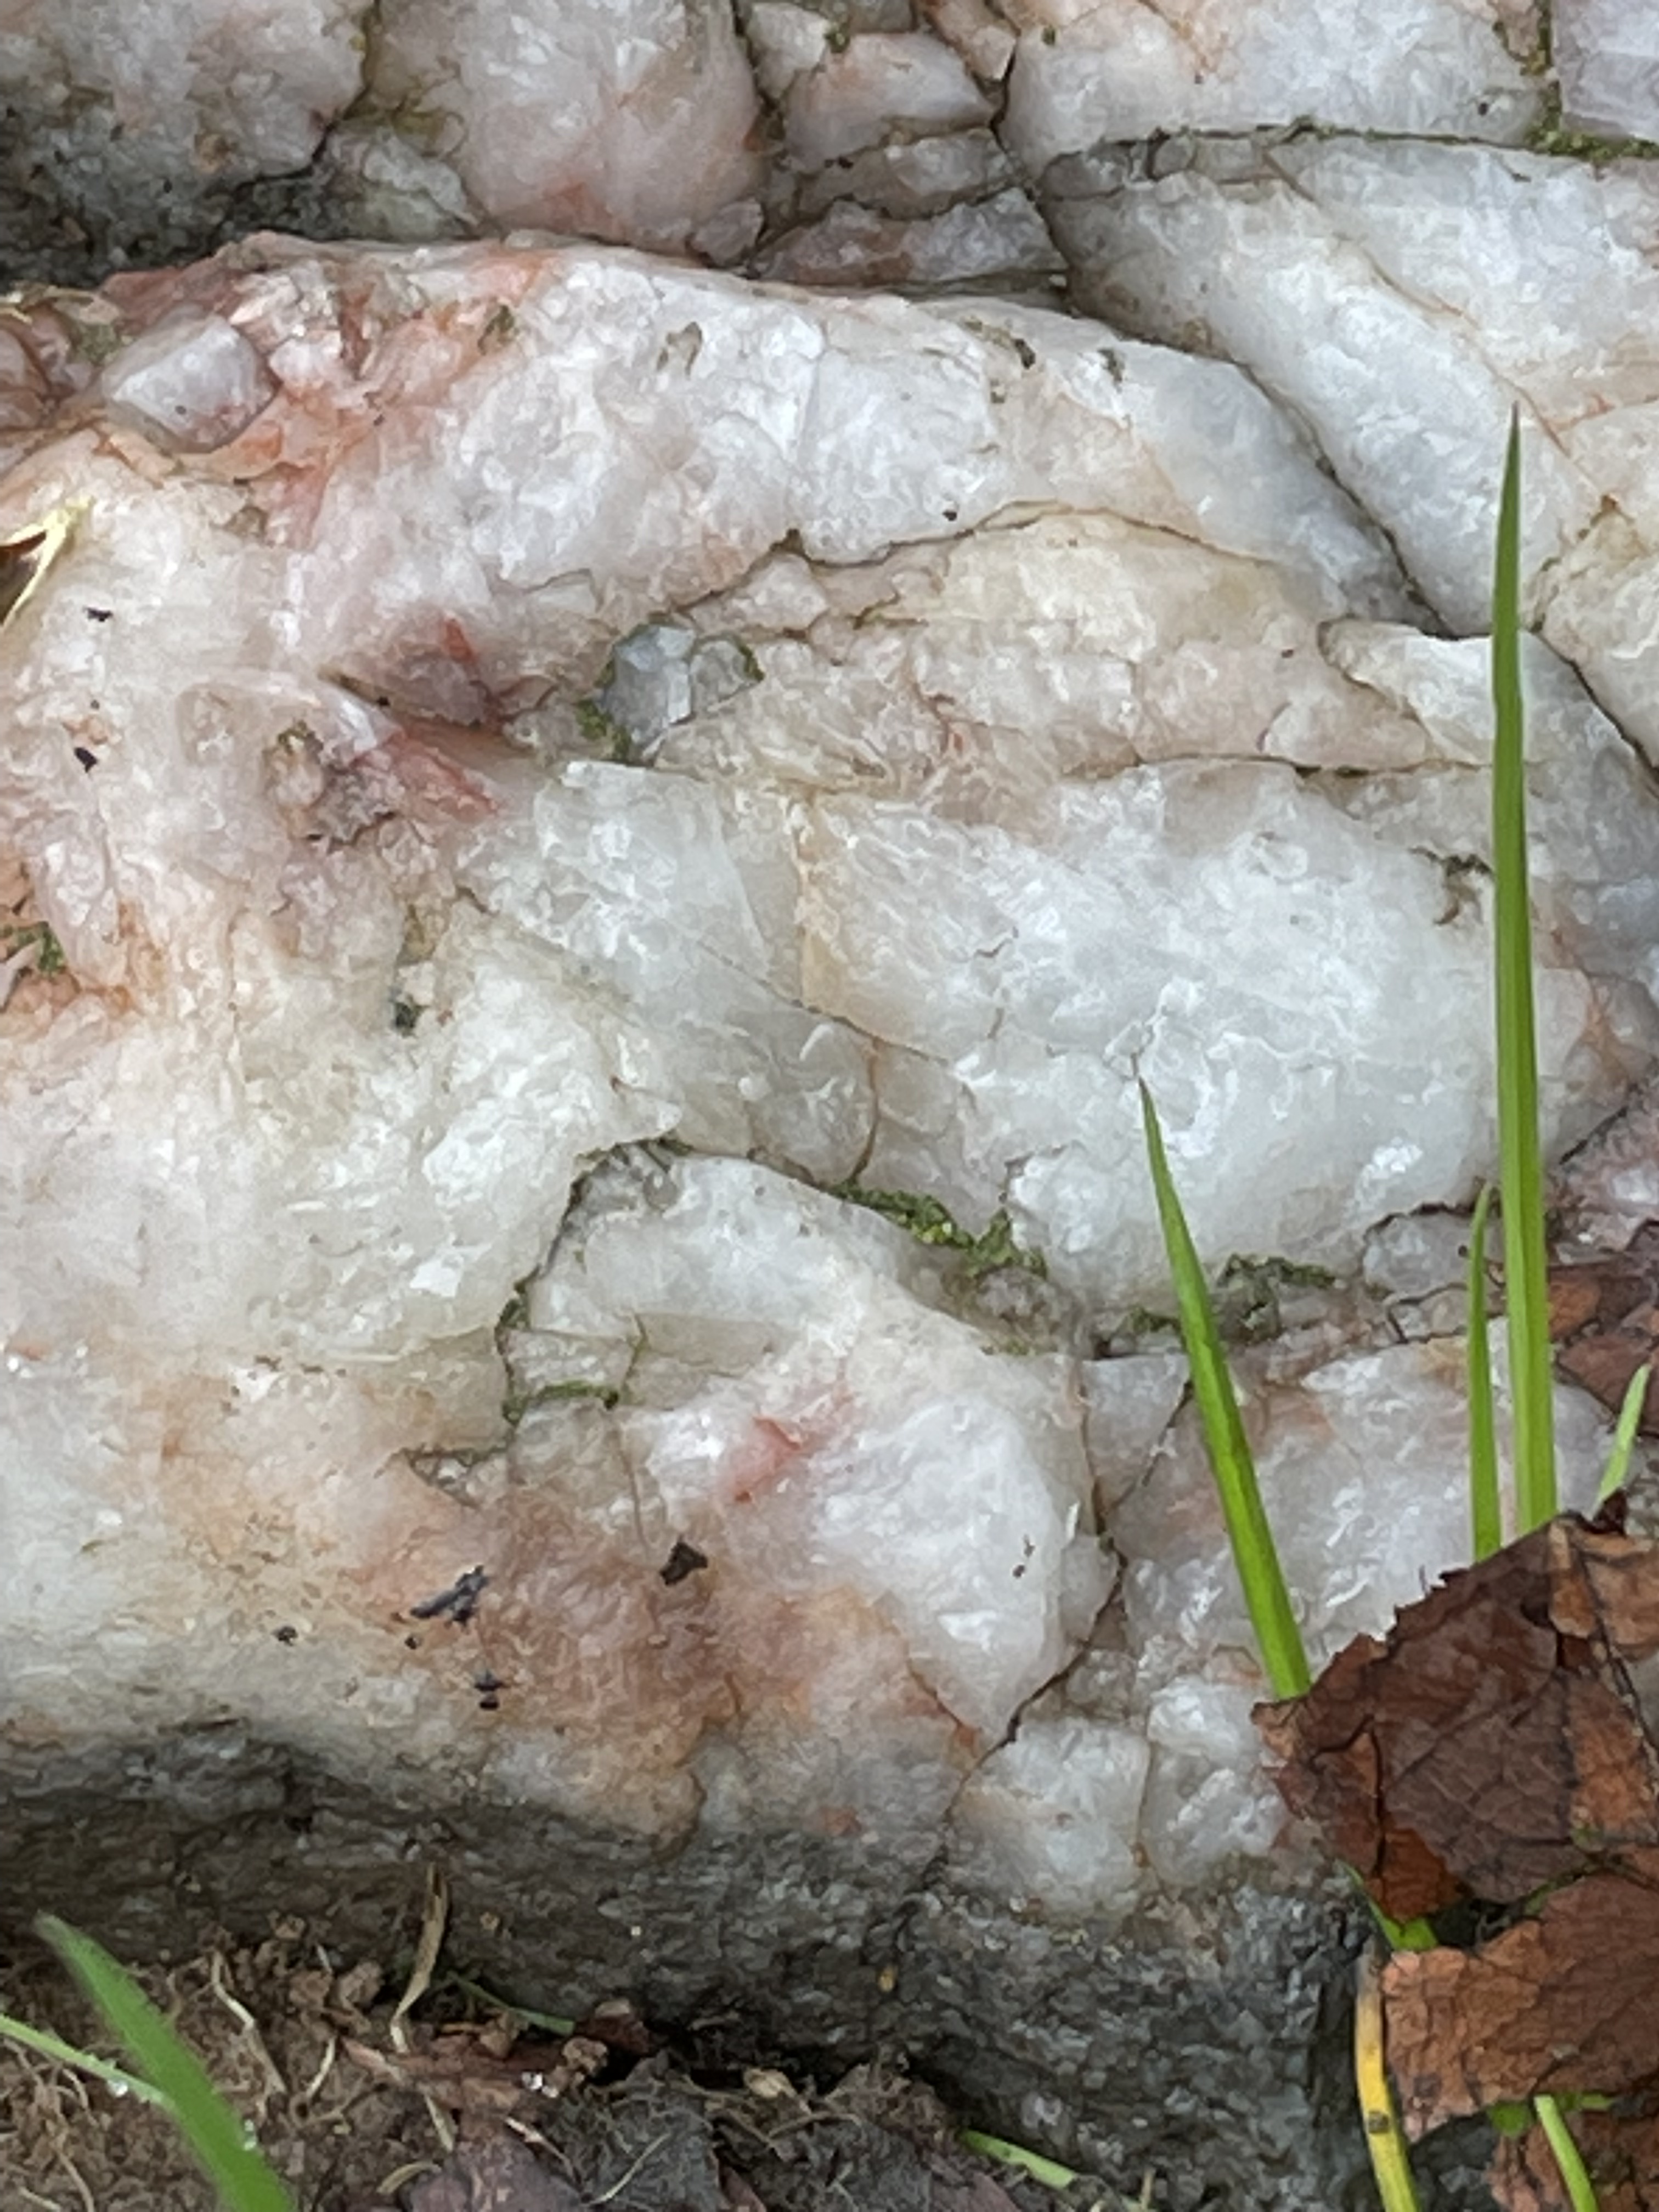
Plate 6. Close-up of a boulder (~1 foot across) of quartz lying on the ground within Area B. The sedimentary rocks do not contain quartz boulders, nor does the diabase that is present east of BRF. This sample must have been eroded from not far away, based on its size, as BRF raised the plateau to the west, and traveled down a long-gone stream, before lowering as the softer Bull Run Siltstone rocks eroded. It rode a geological elevator to its current elevation. Proterozoic granitoid rocks are common west of BRF and quartz is a common constituent of metasedimentary rocks, as we saw in a previous post.

Plate 7. Photo of a stone wall constructed from locally available boulders. The center piece is conglomerate (note the larger clasts in a fine matrix), probably the Jurassic conglomerate labeled in Plate 4. This image also shows pinkish rock (lower-right) that is probably derived from the Jurassic diabase, flaky stones from the Bull Run Siltstone, and a rounded cobble (center) of a fine-grained rock, which is probably diabase.
This hike, in combination with previous outings (Morven Park, Beaverdam Reservoir), allows us to apply Steno’s Laws to gain insight into the geological history of this region because we have a couple of additional clues: the conglomerate was deposited as BRF displaced older rocks thousands of feet vertically, but it was in-turn displaced by more faulting as the rocks adjusted to the major regional displacement. In other words, the geology of Loudoun County shows that the rifting of Pangea was an ongoing process that cycled through uplift, sedimentation, intrusion of igneous rocks, etcetera, for millions of years.
Jurassic Diabase Exposed by Drought!

Plate 1. View looking south from the northern end of Beaver Dam reservoir, which serves as a secondary water reserve for Loudon County, Virginia. According to signs posted around the shore, it was drained for maintenance. This photo shows an outcrop of Jurassic diabase that is unusually leucocratic (light colored minerals).

Plate 2. Geologic map of the area around Beaver Dam Reservoir. The outcrop seen in Plate 1 is a high-titanium, quartz-normative tholeiitic diabase, which occurs in dikes and differentiated sheets throughout the map area labeled as Jdh on the map (Jurassic age). The high titanium content and available quartz indicate that this intrusive rock originated within a larger magma chamber (deeper within the crust) and multiple intrusions were emplaced over a period of time as the chemistry evolved. Tholeiitic magma is associated with mid-ocean ridges, which indicates a mantle source rather than melted crustal rocks. A different diabase (Jdg on the map) is younger and was injected into the pre-existing diabase (Jdg) as granophyre, an intrusive rock that indicates a highly evolved magma chamber. These intrusive rocks were injected along bedding planes, faults, and fractures within the Jurassic-Triassic Bull Run Siltstone (JTrtm on the map). Two other Jurassic diabase units (Jdl and Jd) are indicated by circled areas where they cut across Triassic sedimentary rocks (lower area where Jd cuts JTrtm) and Jurassic diabase (upper circled area where Jdl cuts Jdh).

Plate 3. View of the reservoir showing the man-made shoreline and boulders scattered on a sandy-muddy substrate. The title of this post is intended as geological humor disguised as a newspaper headline. I wondered why the reservoir was so low.

Plate 4. This image (approximately 2 feet across) reveals a medium-sized crystalline texture and color similar to granite, which was the initial field identification. An important difference between these rocks and granite is the lower quartz and alkali feldspar content, which isn’t visible in this exposure. Note at least one set of joints, indicated by the weathered “X” rotated slightly to the left, in the center of the photo; then let your eye go down a little and you will notice another X, this time rotated to the right. This second X is repeated throughout the exposure. This type of joint is associated with fracturing of the rock as it cools and pressure is reduced because of erosion of overlying rocks. The suggestion of multiple patterns (I admit it isn’t that obvious) implies several steps in cooling; however, interpreting joints is complex, requiring many detailed measurements, and beyond this post. I just wanted to mention it because joints tell us about the geologic history of a rock after its formation, millions of years later.
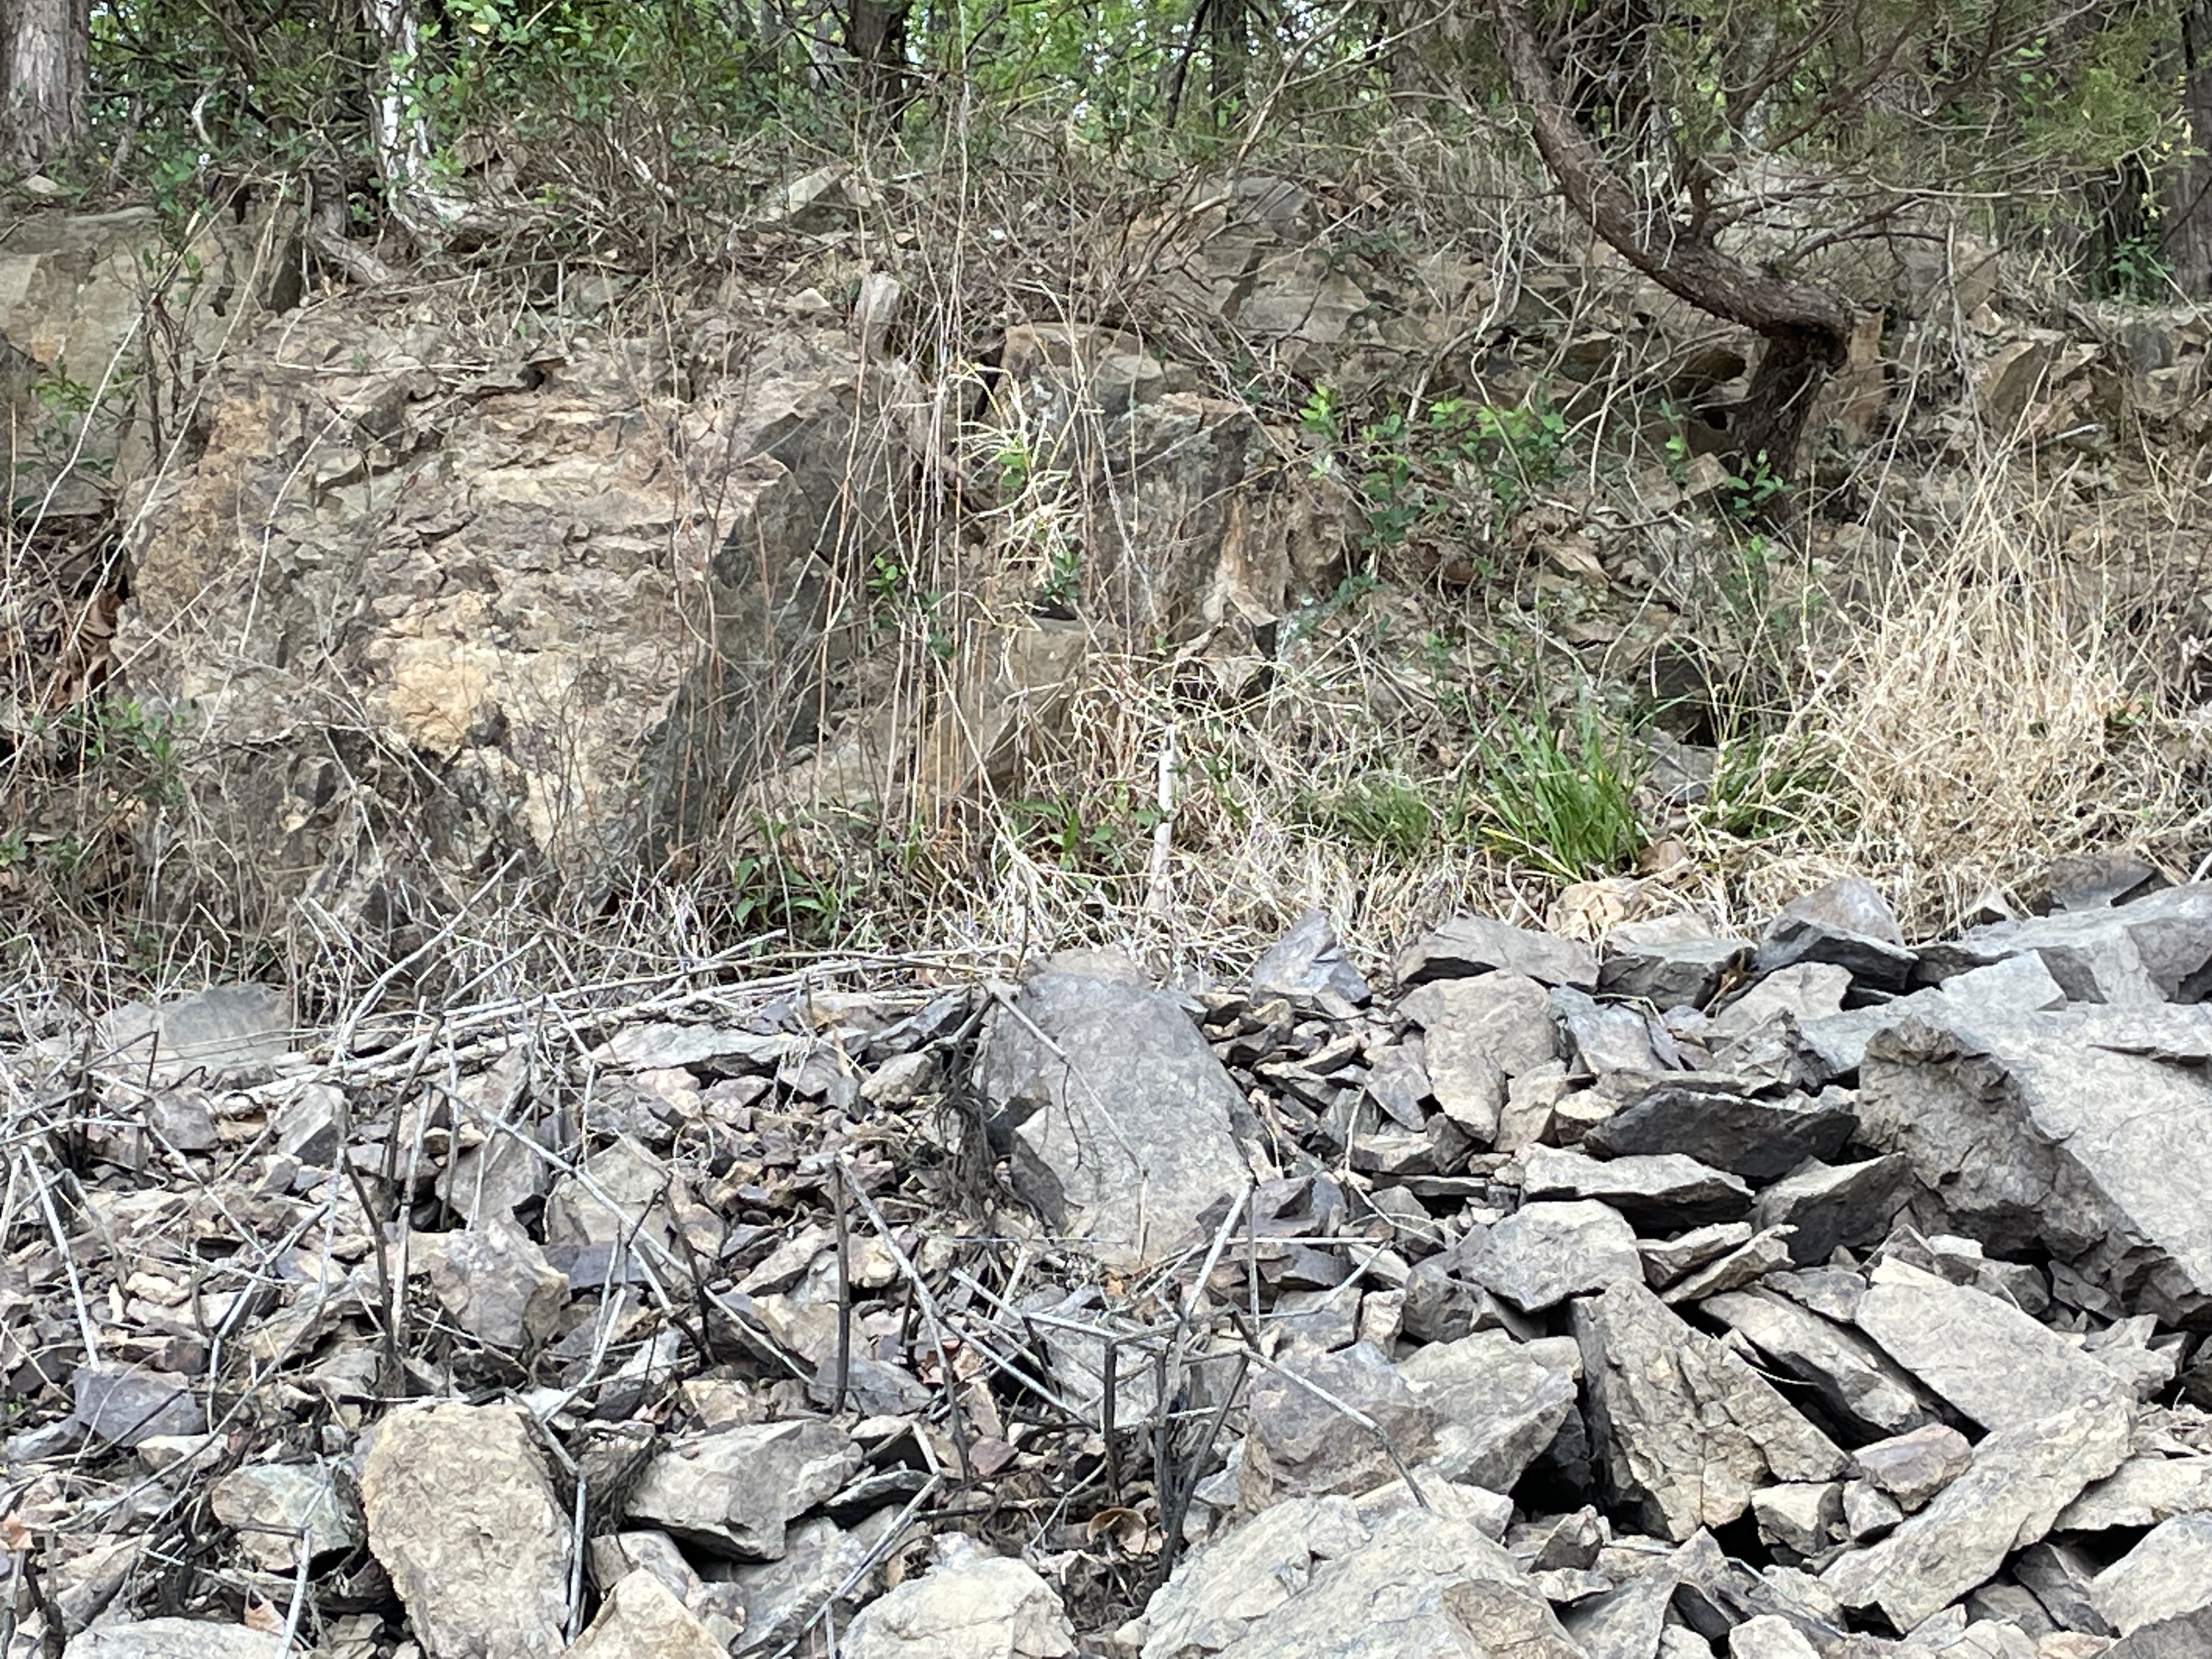
Plate 5. This photo shows a large outcrop at the high-water mark of the reservoir. Note the angular structure of the outcrop (lighter rock at the upper left of the image) and the pieces broken off during construction of the reservoir.
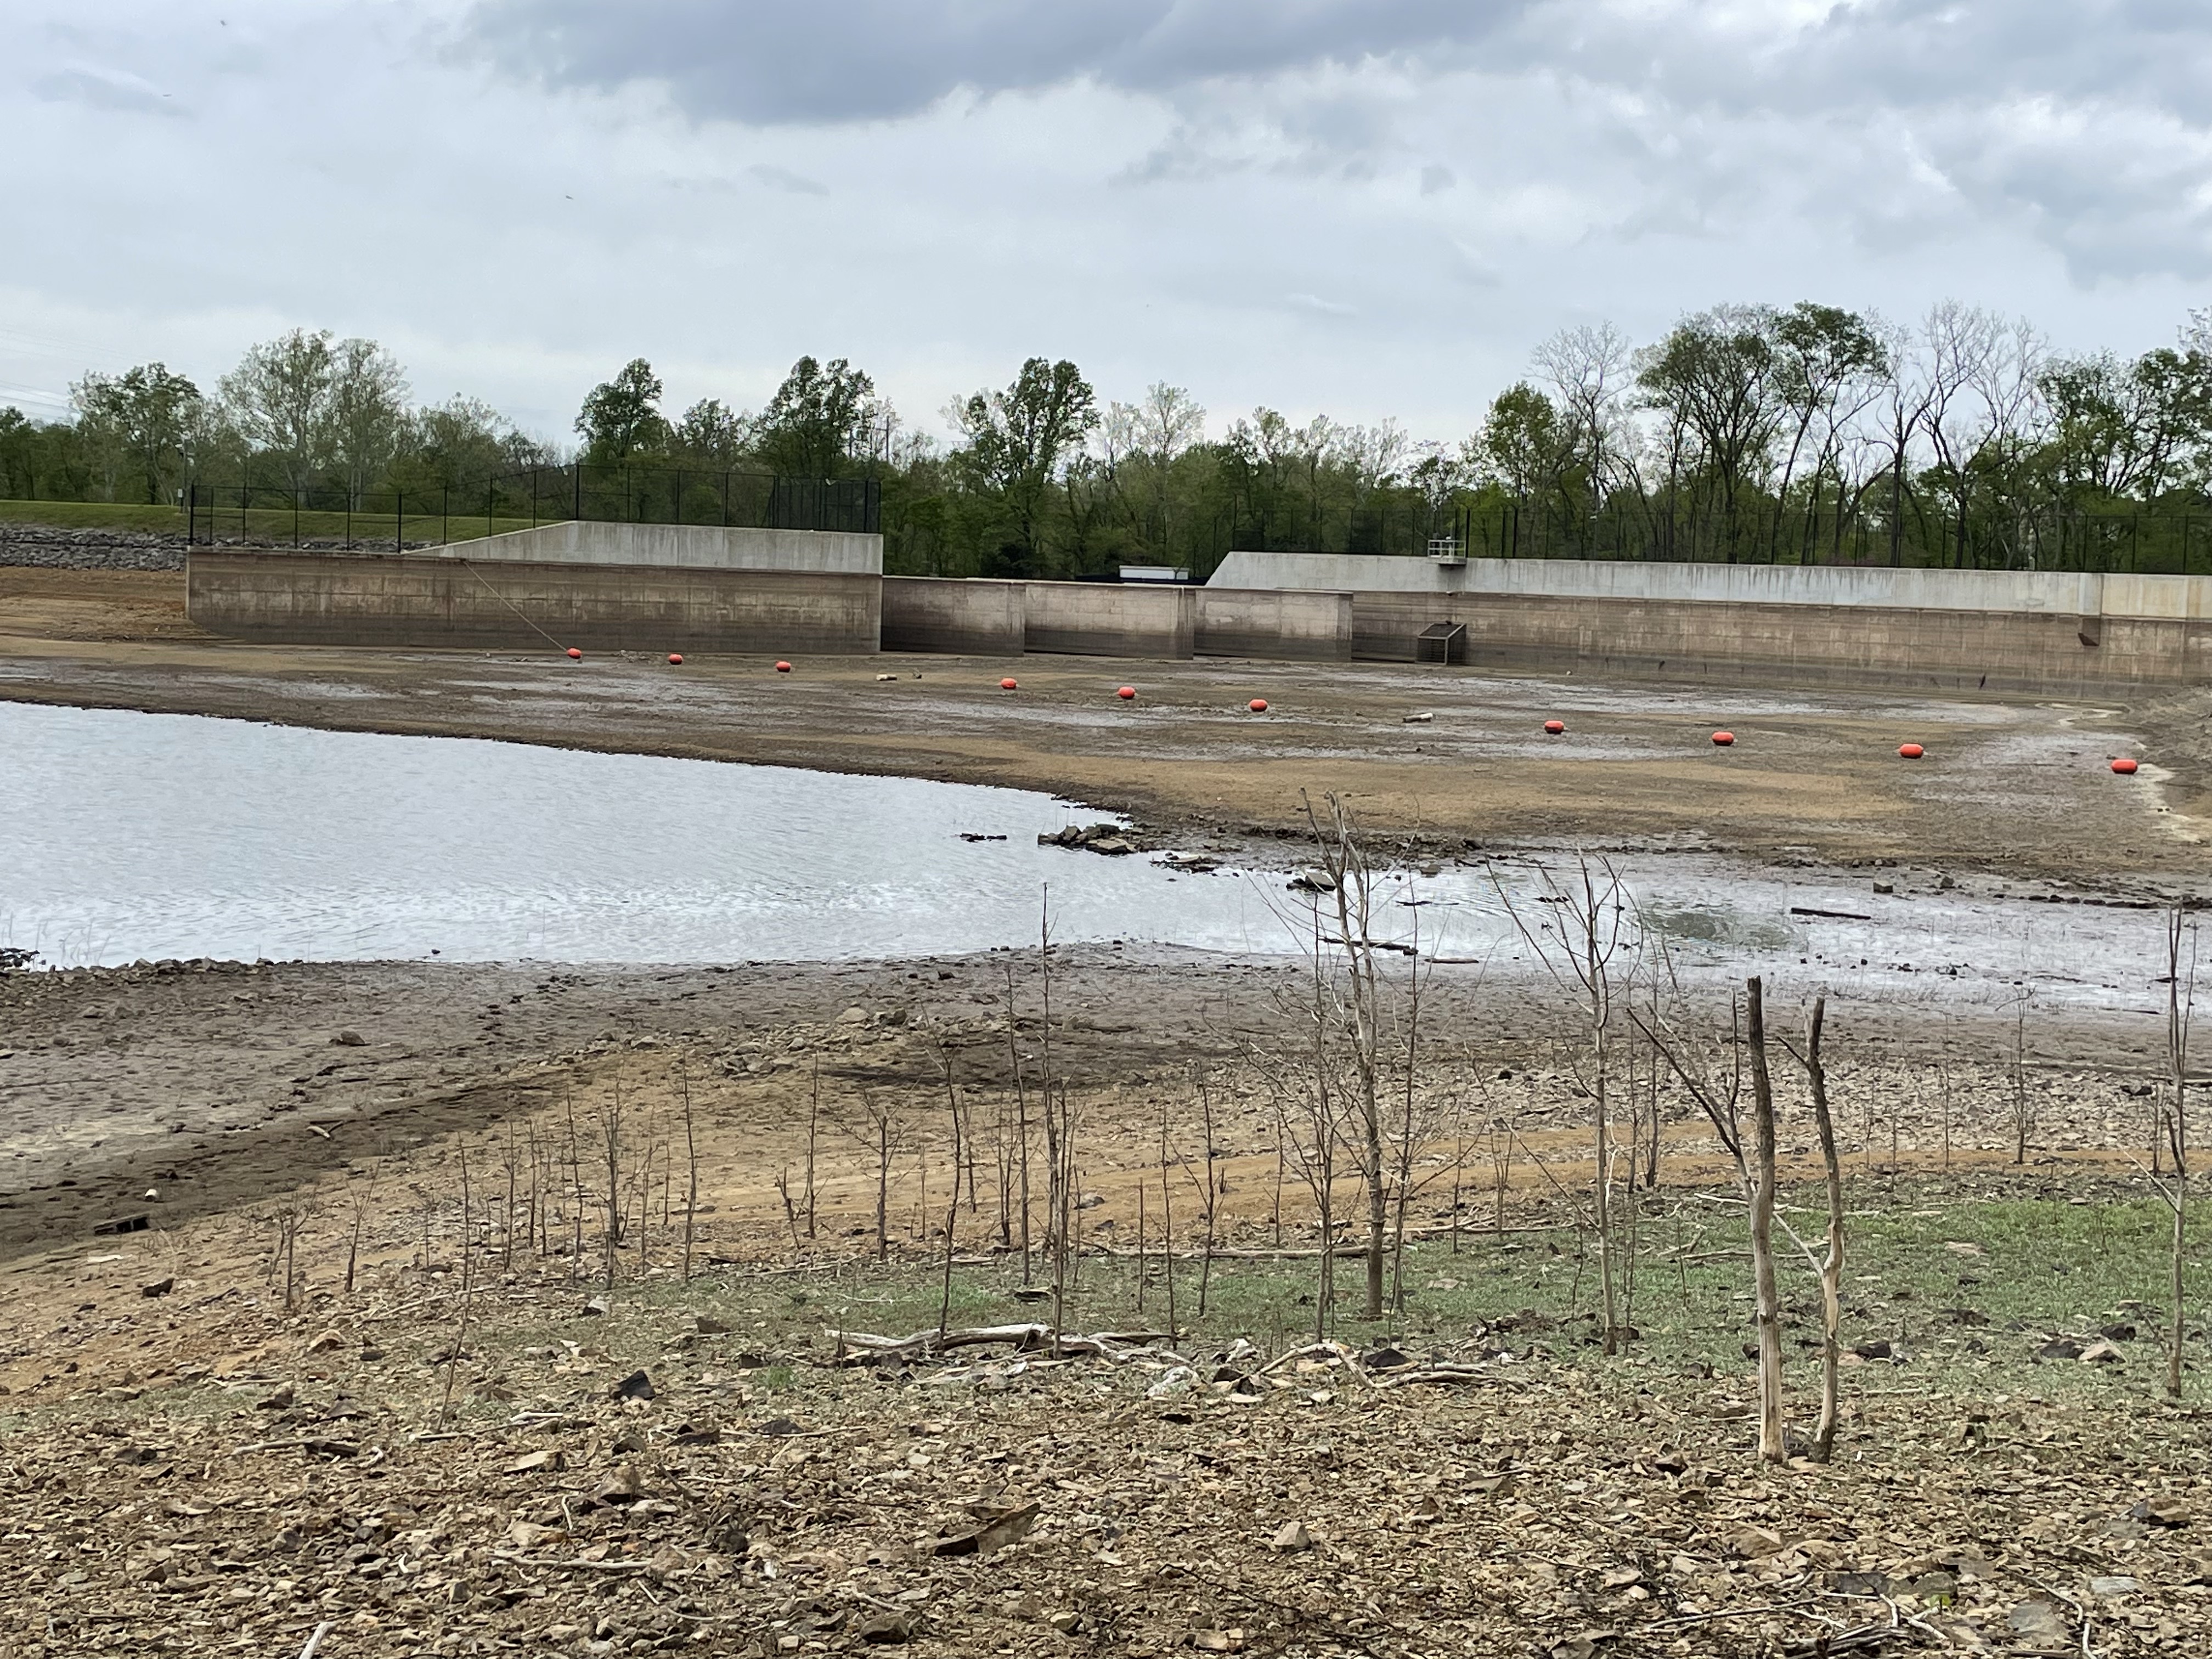
Plate 6. View looking north towards the outflow gate of Beaver Dam reservoir, showing the weirs and maximum water level (about fifteen feet above present level). The low water level suggests that evaporation and ground-seepage (not much with the subsurface comprising diabase) exceed local run-off. This is the reason for the post title. Rainfall has been low enough that the water level keeps dropping, even after the reservoir was emptied. Is it a drought?
The last post reported a generic Jurassic diabase (Jd) west of the Bull Run fault (BRF), less than 10 miles NNW of Beaver Dam reservoir, which was intruded into Precambrian sediments. However, Jd also occurs as small intrusions throughout Loudon County (not shown). In other words, it wasn’t emplaced as sills or sheets, but rather filled fault and other fractures in older rocks. Using general principles of stratigraphy (e.g. Steno’s Laws), we can speculate about what we’ve seen in these two recent field trips.
The unspecified Jurassic diabase dike we saw at Morven Park (Jd in Plate 1 of the last post) cuts through Proterozoic sediments but wasn’t seen east of Bull Run fault in that area. The younger (Triassic) sedimentary rocks in the area of Beaver Dam reservoir (JTrtm in Plate 2), as well as Jurassic intrusive rocks (e.g. Jdh on Plate 2) are cut by dikes of diabase (Jd and Jdl, circled areas in Plate 2) that suggest the continuous chemical fractionation of a magma chamber, which produced smaller amounts of magma that had less space to fill.
I propose that magma with a composition like most of the world’s ocean floor formed (tholeiitic basalt, or Mid-Ocean-Ridge Basalt–MORB) beneath the oldest rocks in the area (more than 500 million years old) when Pangea was stretched by upper mantle convection during the early Jurassic (about 200 million years ago), sending tentacles of molten rock to fill every weak point in the overlying rock, sheets and dikes were created, possibly even laccoliths, between layers of sediments. This stage created the large area of diabase in the study area (Jdh in Plate 2). As the magma chamber lost material and cooled, it injected smaller volumes of magma into even smaller fissures and weak points in the overlying rock, including earlier diabase. These late-stage injections are seen as dikes of Jd and Jdl in Plate 2.
Finally, the crust throughout this area stretched to the breaking point and Bull Run fault formed, with the east side sliding downward and to the east. All of the Paleozoic and Mesozoic rocks on the west side of Bull run fault, including diabase sills and dikes, were eroded by wind, water, and ice, leaving only the final, highly fractionated late-stage magmatic dikes (e.g. the granophyre of Plate 2) protruding out of the Precambrian sediments. The deep source of all of these diabase plutonic rocks remains buried deep beneath western Loudon County.
Finally … the only Jurassic diabase I found on the USGS geologic map of Loudon County occurs as thin exposures parallel to Bull Run fault and within a mile of it, which suggests that BRF defines the western limit of the fault zone associated with the break-up of Pangea.
That’s my story and I’m sticking to it …
Morven Park: Making and Breaking Pangea
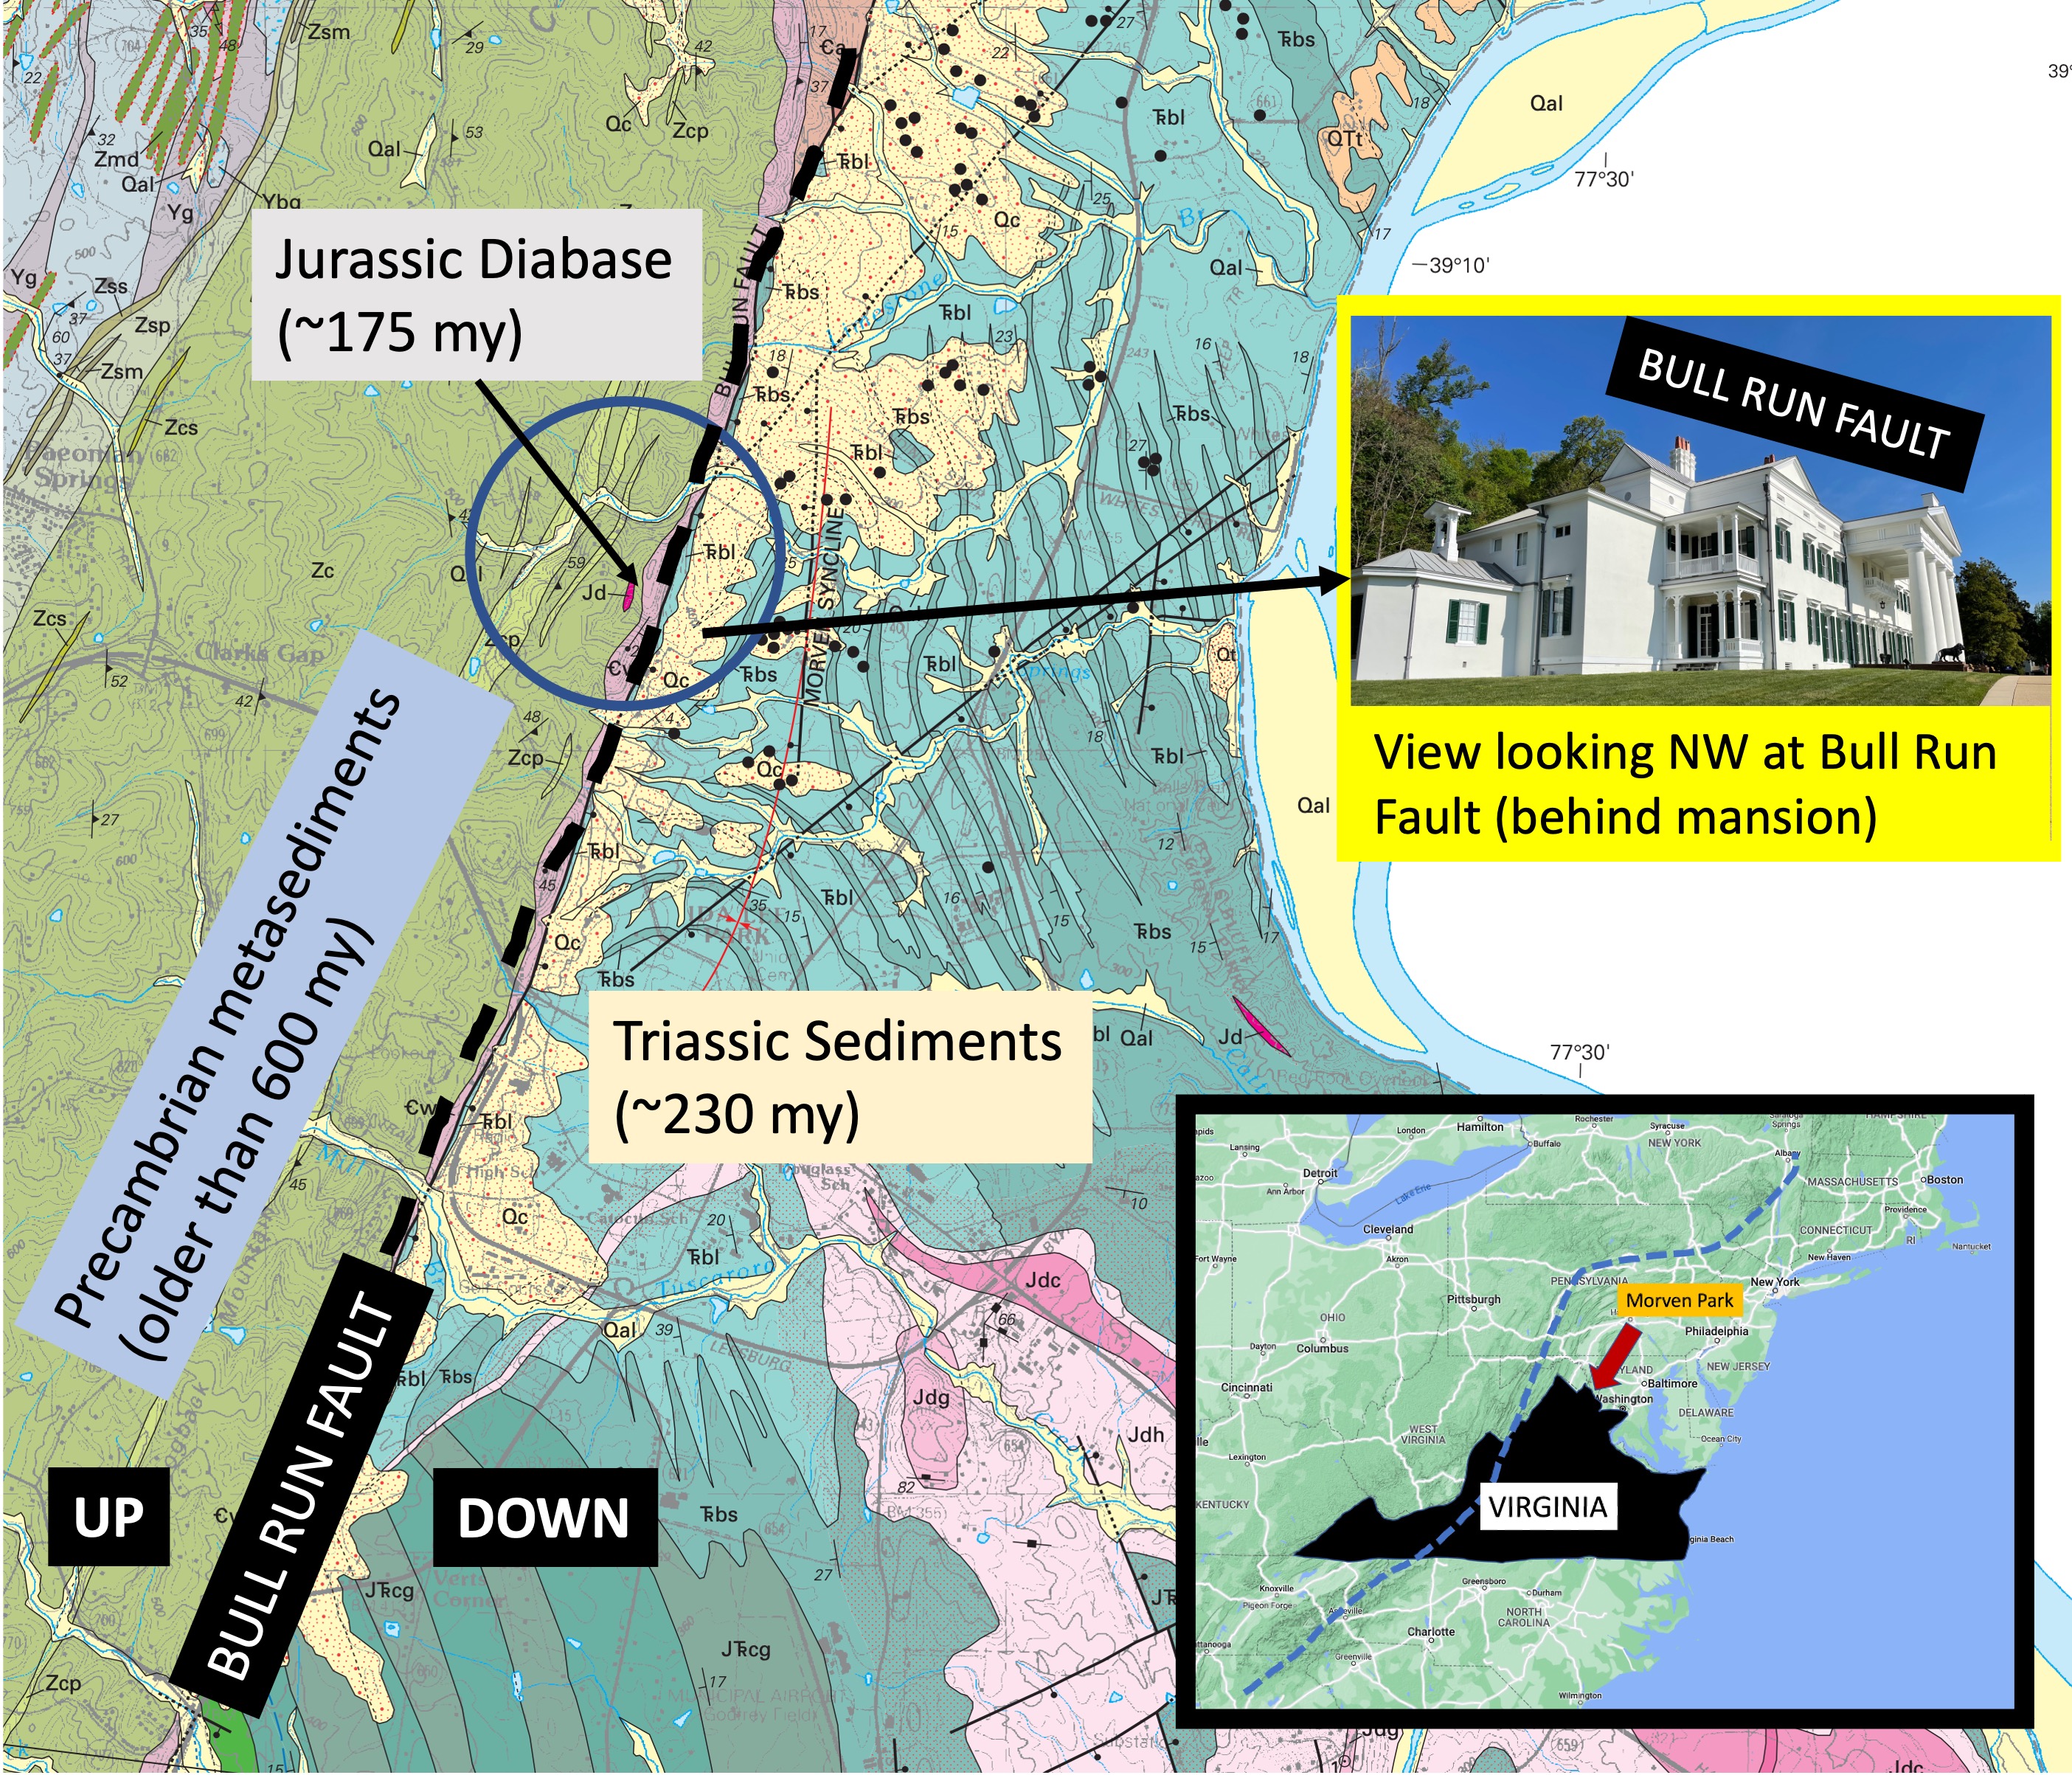
Plate 1. Geologic map of study area in northern Virginia (see inset map). The area is bisected by the Bull Run Fault (BRF, dash line), which separates older metasedimentary rocks from younger sedimentary rocks. The west side of BRF has moved upward relative to the east side, following the regional trend along the east coast of North America (dash line in inset map). The inset photo shows how BRF appears today, forming a topographic rise with less than 100 feet of relief. The study area (blue circle) is located on the western part of Morven Park, which is the location of a mansion (inset photo) occupied by an early twentieth century governor of Virginia, now a historic site, museum, and equestrian park. The image is approximately 4.5 miles across.

Plate 2. photos of an outcrop of Catoctin Formation metamorphic rocks from the southern end of the study area (see Plate 1). These rocks are between 1 by and 540 my old; they were originally basalts, tuffs, sandstone, siltstone; before being buried and metamorphosed into their current lithologies. This plate shows the outcrop along strike (A) and along dip (B), revealing sedimentary structures and grain sizes that suggest this is a cross-bedded sandstone with intercalated siltstone. These sediments (and associated volcanics not seen in the study area) were deposited when proto-North America collided with proto-Europe during the late Proterozoic. They were then buried deeply enough to be altered but not so much to become gneiss, or melt to become igneous rocks. Their current orientation has a strike of 35 east of north, and a dip of approximately 30 degrees, but this deformation was not caused during the collision that formed Pangea.

Plate 3. Close-up of the outcrop in Plate 2. The top of the sequence is a bed 12 inches thick. Below this is are several cross-bedded layers (identified by the lines that dip to the left) that are discontinuous, and intercalated with thin, massive (no lamination) beds. The lowest visible beds are lenticular in this view. This kind of cross-bedding suggests that these sandy sediments were deposited in a river, where one-directional currents create uniform cross-beds. There is no evidence of gravel and the sand is fairly well sorted (as best as I could tell from the outcrop), suggesting that this was not near the source but in an alluvial fan. The heterogeneous lithologies of the Catoctin Formation are likely due to delta switching, i.e., the main channel moving across a relatively flat area before entering either a sea or lake. There are no fossils in these rocks because they predate the appearance of shell-forming invertebrates like clams, snails, etc. There were no land plants either, so their organic carbon content is practically zero.
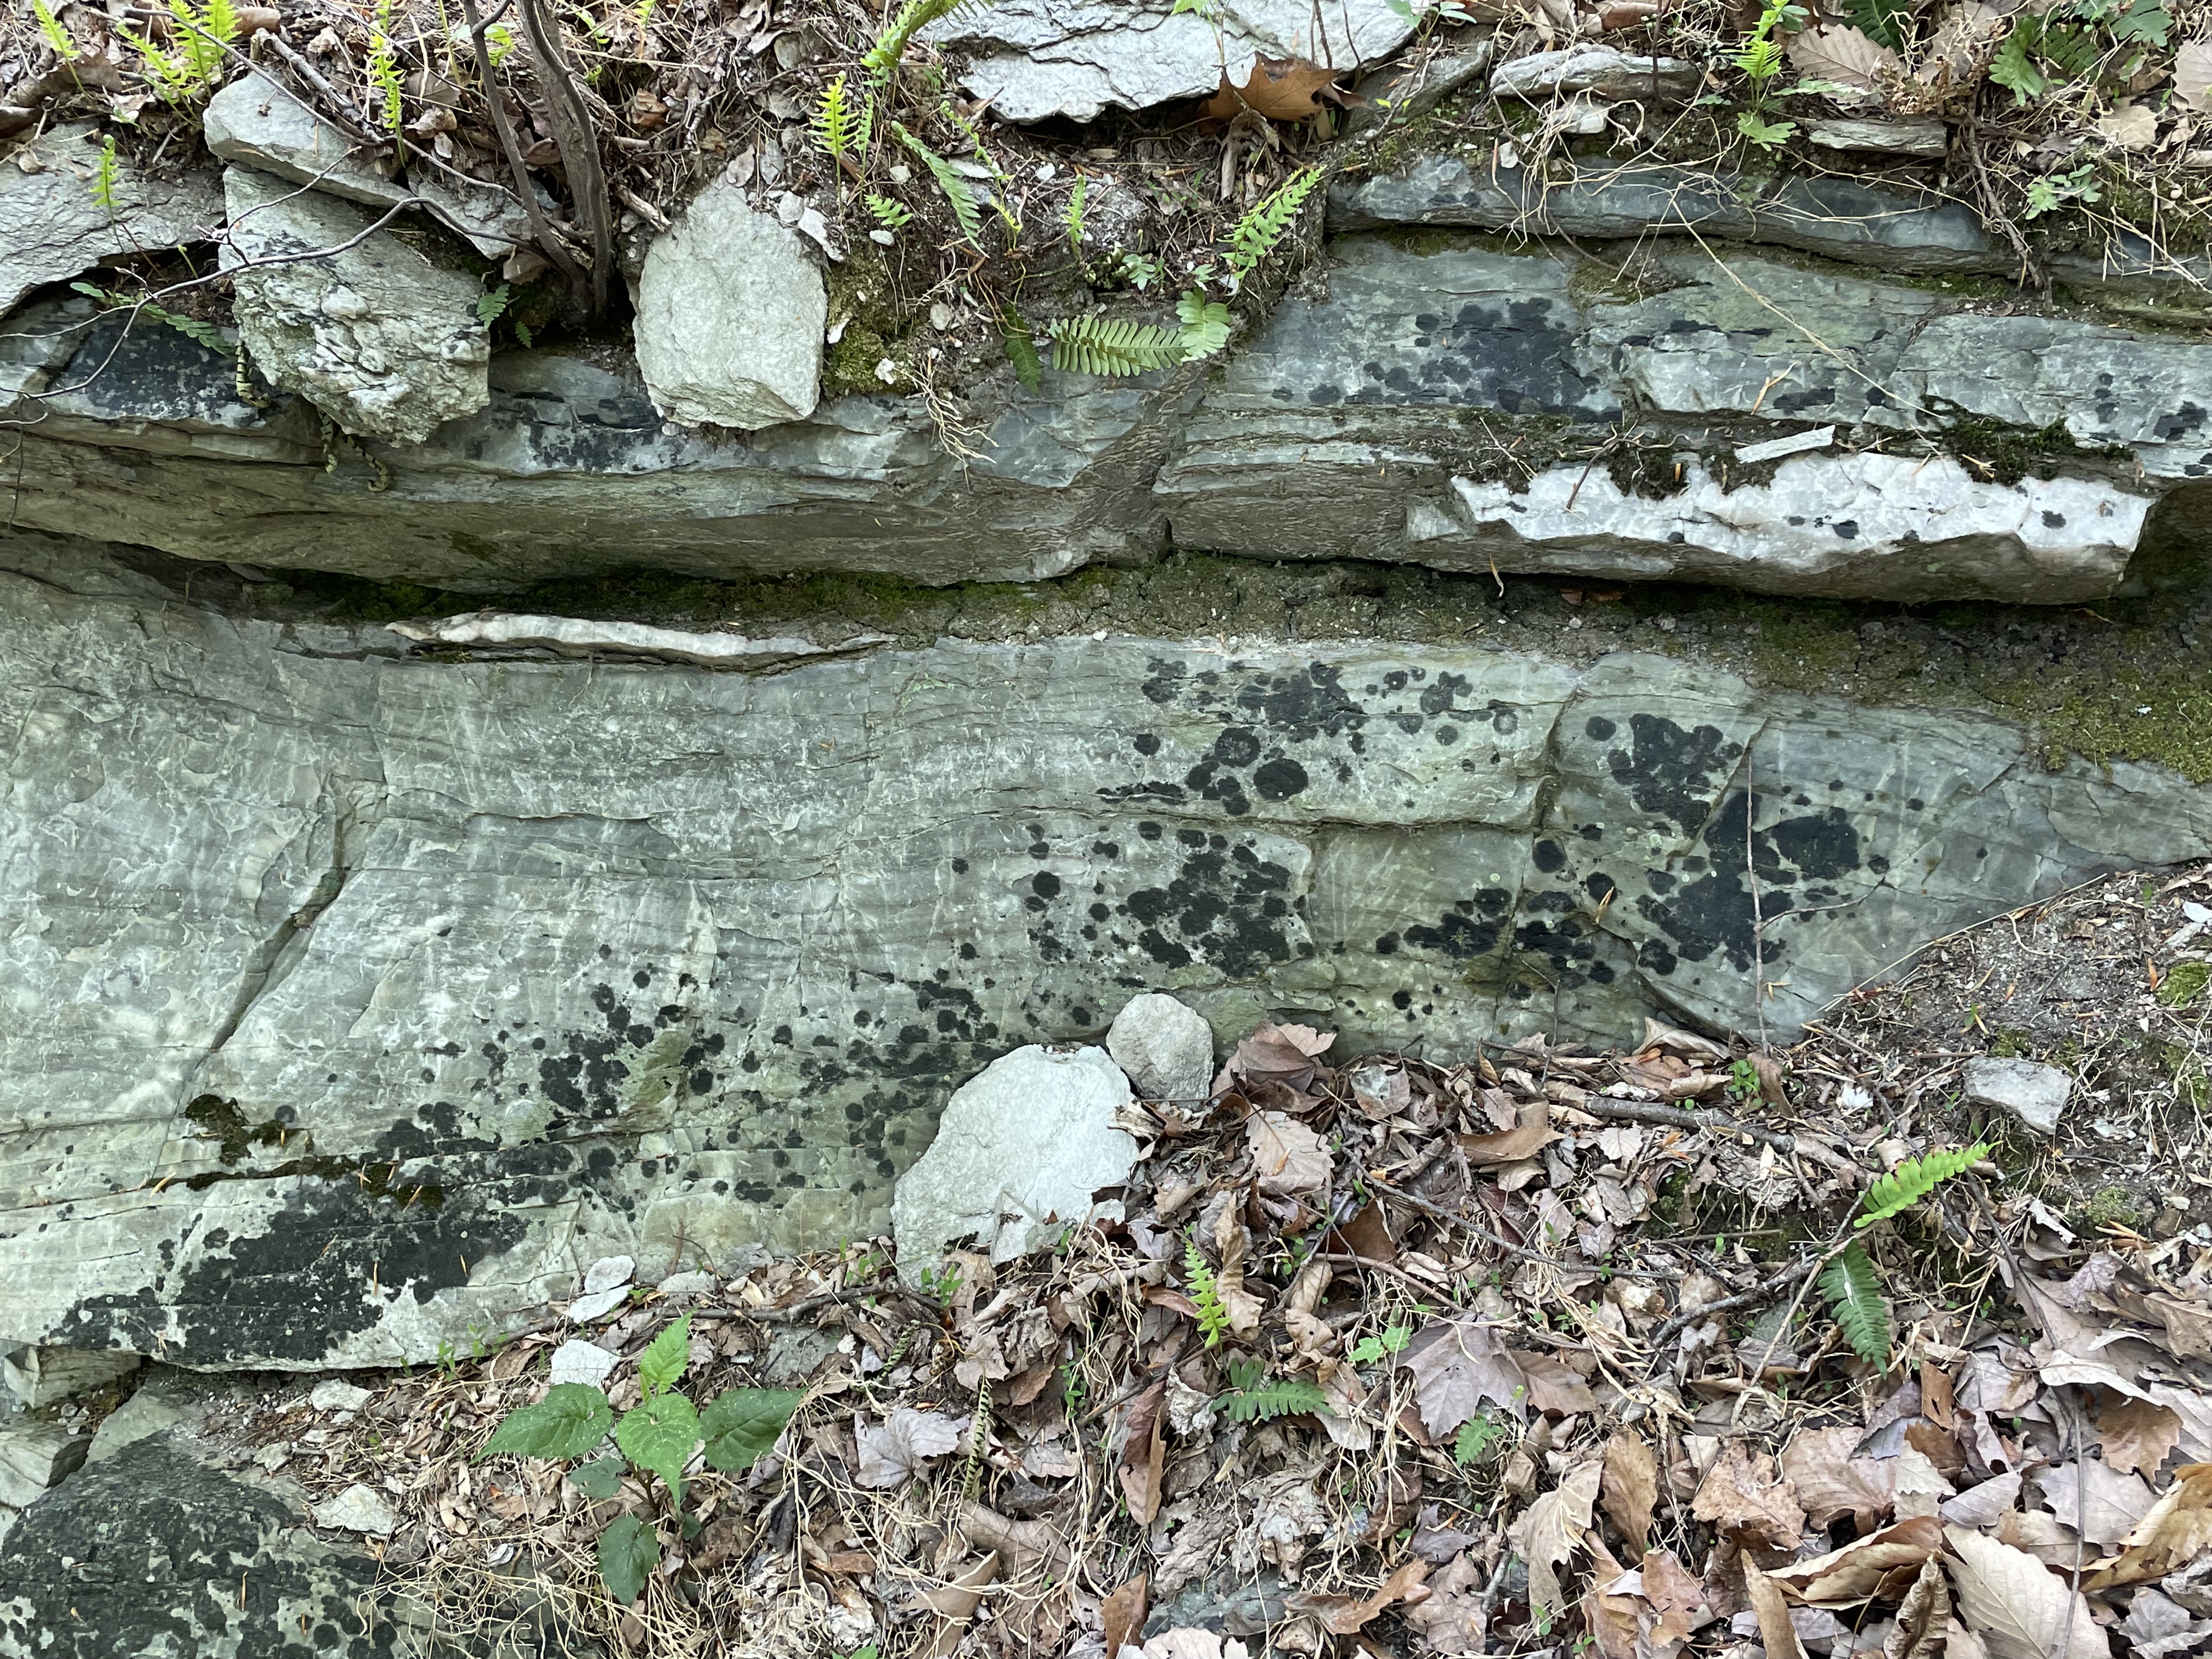
Plate 4. Close-up from the outcrop in Plate 3, showing lenses of white minerals within laminated, slightly folded sandstone beds. Such lenticular bedding is common in metamorphic rocks because of the high heat and pressure caused by deep burial. Incompatible elements (e.g., calcium or silicon) are squeezed out of the rocks and form blebs of new minerals, such as calcite (excess calcium) or quartz (excess silicon). There were no shell-forming animals (invertebrates form their shells of calcium minerals) when these sediments were deposited, but carbonate rocks have been produced by abiotic processes as long as 4 billion years ago; not to mention algal mats created by stromatolites. Marble (metamorphosed carbonate rock) is reported as lenses within the Catoctin Formation. These lenses would have been originally deposited as either algal mats or chemical sediments.

Plate 5. Close-up from Plate 3, showing details of one of the lenses. Note the lamination in the sandstone and transition between the two mineralogies where they are in contact in middle of the photo. I didn’t use acid to test for calcite (it fizzes under dilute HCL) because the motto of Rocks and (no) Roads is to use our eyes and available information. However, note the white rectangle at the top-center of the photo; it is very similar to the shape of calcite crystals. Other such shapes are visible if you open the image, zoom in, and pan around. I am going with this being a lens of calcite, crystallized from mineralogically incompatible calcium, because that is consistent with the official description of the Catoctin Formation lithologies.

Plate 6. Photos of phyllite found loose on the ridge west of the Bull Run Fault (see Plate 1). (A) The sheen of this sample is caused by aligned muscovite minerals during burial. (B) A close-up reveals the platy texture typical of phyllite, which typically forms from shale and is intermediate in metamorphic grade between slate and schist. The chemistry of these rocks suggests that they were originally deposited as tuff (a fine-grained volcanic deposit) rather than mud. Of course, once the ash settled it would have been transported by rivers and become intercalated with the sandstone seen in Plate 2. This sample shows no sign of stream transport (e.g. rounded into a cobble), so it is probably a remnant of eroded, overlying (i.e. younger) volcanic sediments, after the quiescent period represented by the older sediments from Plate 2.
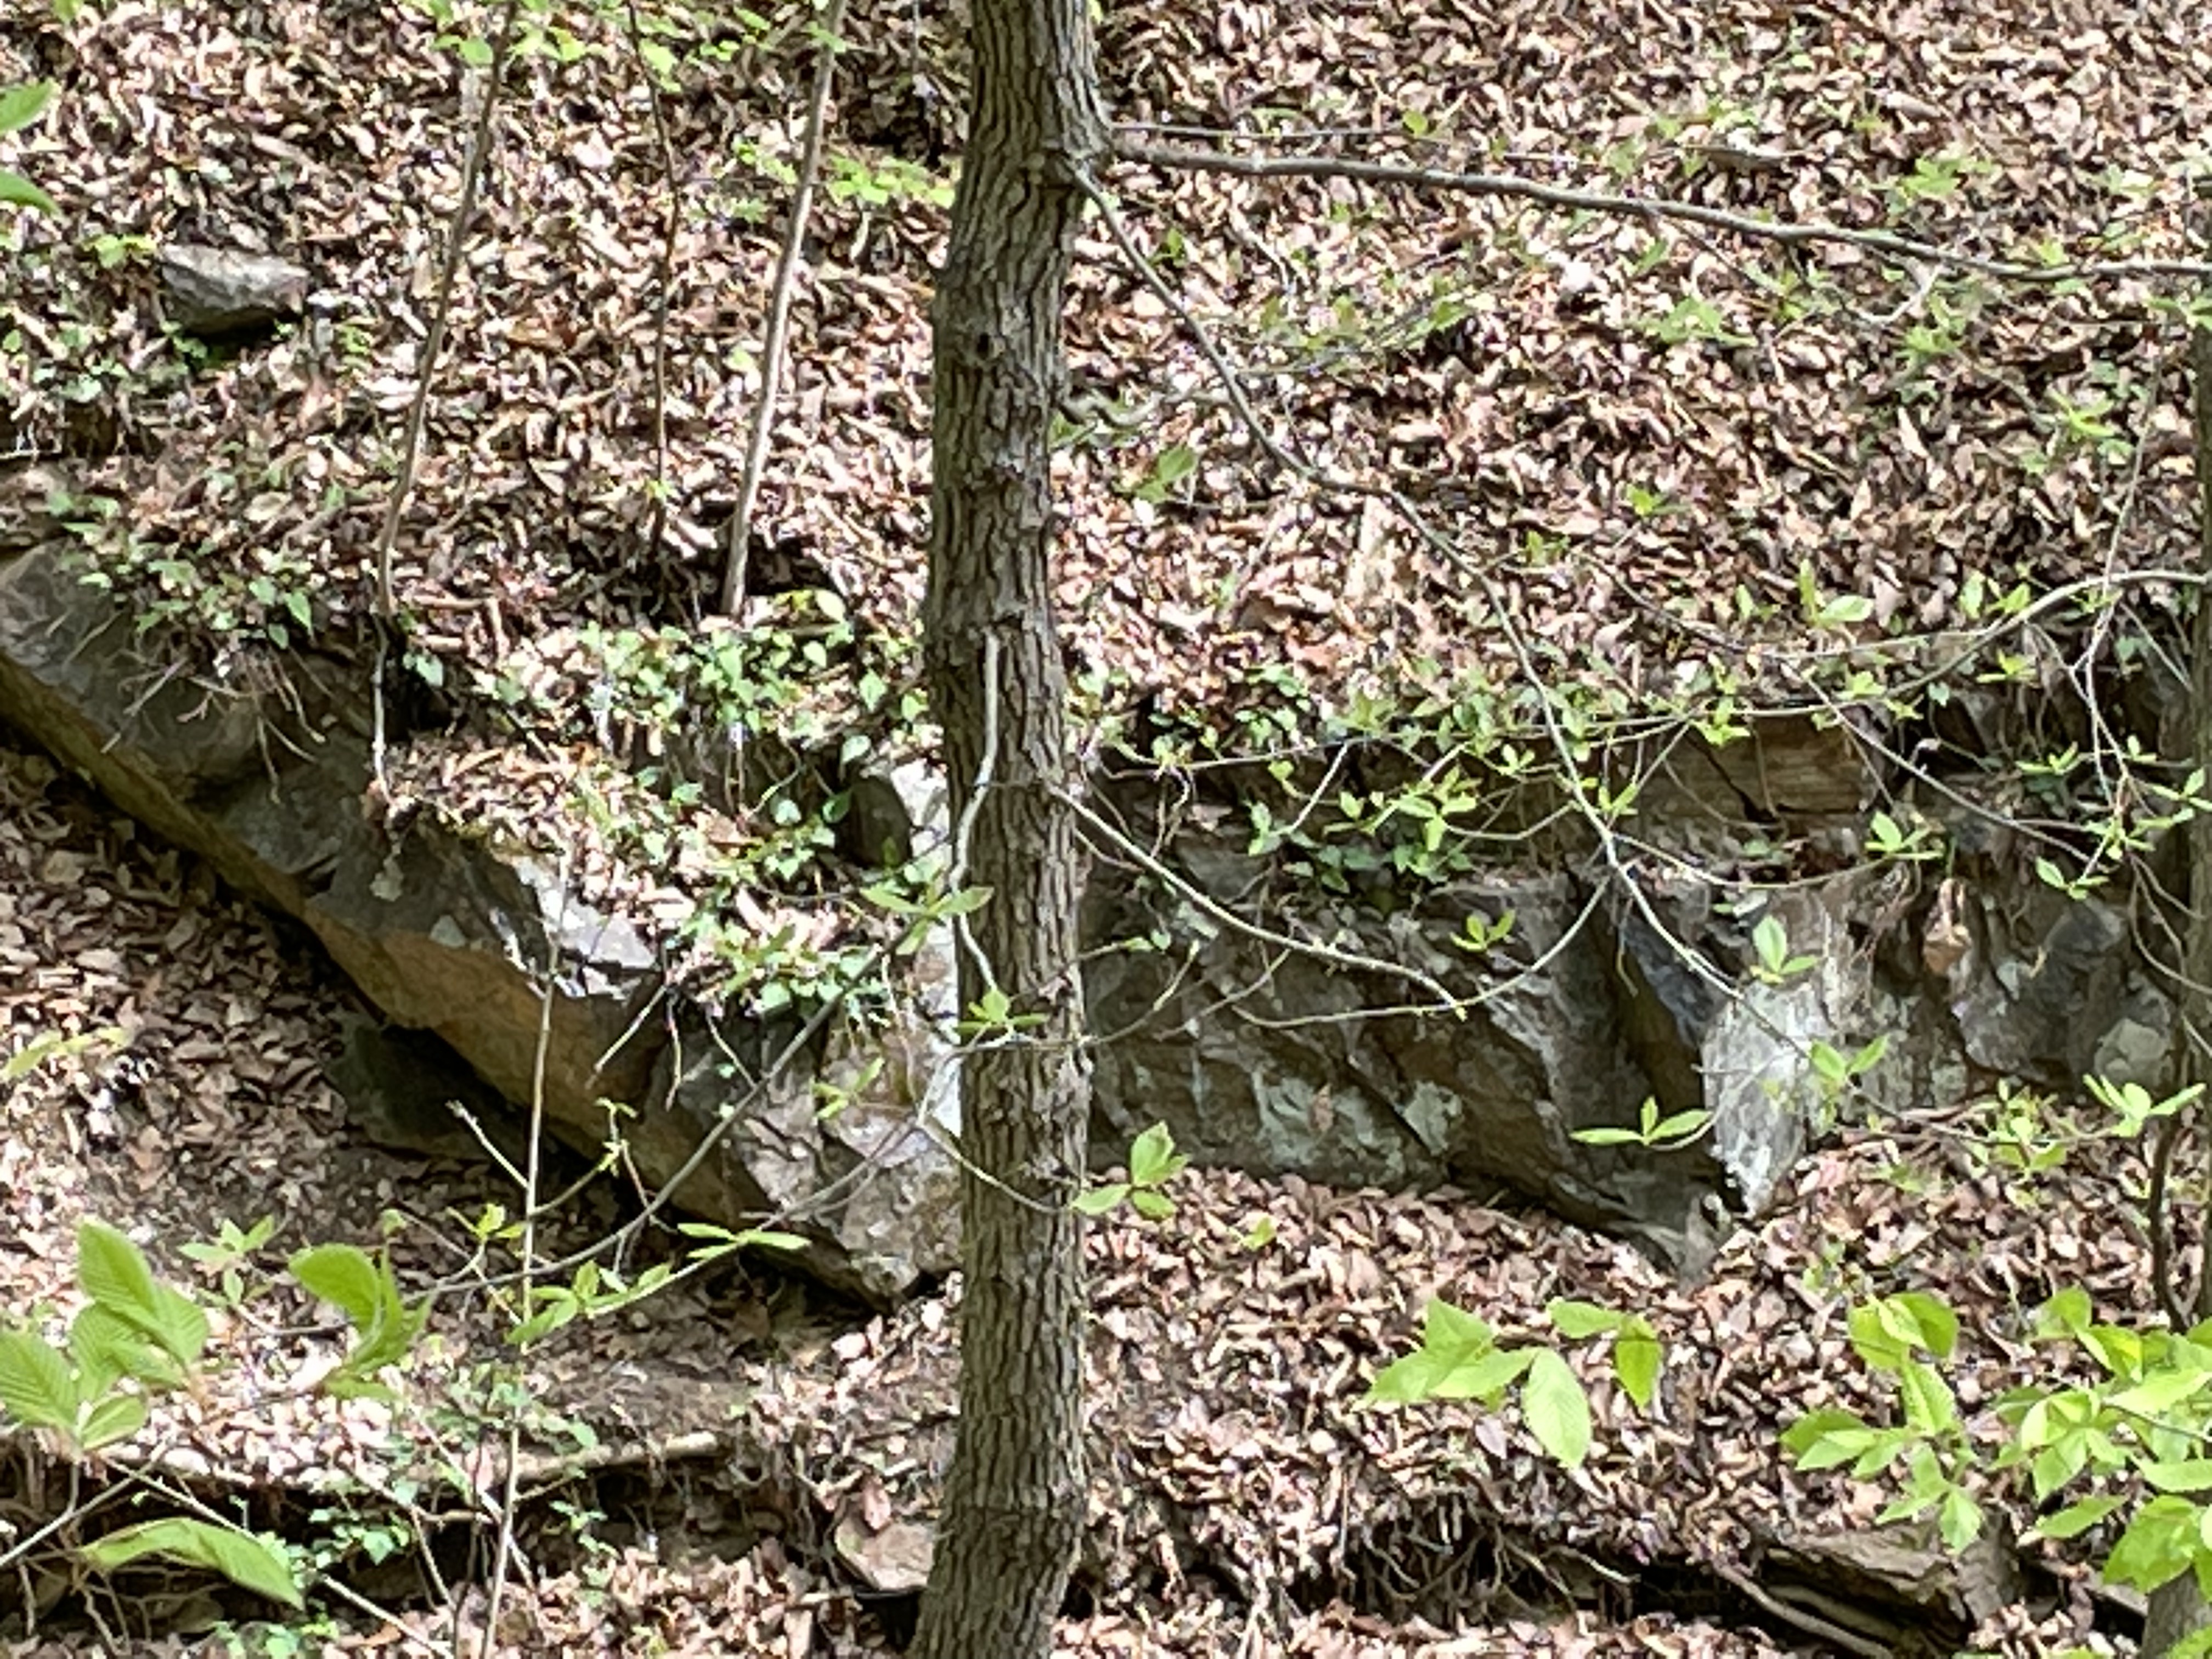
Plate 7. Photo looking north at an outcrop of the Jurassic diabase (age ~175 my) indicated in Plate 1, exposed by a stream that cuts across the Bull Run Fault. These are the youngest rocks within the region after rifting of Pangea had begun. Deeply buried rocks melt and some of the magma rises, following joints and weak lines in the overlying, solid rocks. Diabase, which has a composition similar to basalt, is formed like this although it often feeds volcanoes. The continental crust was stretched thin and fractured, allowing the diabase to work its way towards the surface. It only appears as lenses like those seen in Plate 2 in this area.

Plate 8. This image shows the typical growth for trees along the rocky crest of the hill seen in Plate 1. These large trees started out growing in fractures in the rock and, in some kind of enhanced biochemical and physical weathering, thrived and grew to be tall trees, probably almost a hundred years old. I’ve seen trees growing from large joints in rocks before, but never a forest that looks like it is set in concrete. There is absolutely no soil on these ridges but that didn’t stop Mother Nature.
Plate 9. Cross-section across Loudon County, Virginia, from west to east. Bull Run Fault became active during the rifting of Pangea as the supercontinent stretched. The younger rocks on the east (right side of BRF) slipped down this fault surface, leaving the older rocks several thousand feet higher than where they belong stratigraphically (beneath the younger rocks). The arrows indicate the relative movement along BRF. The current erosional surface is indicated by the blue, horizontal line. This displacement has juxtaposed sedimentary and volcanic rocks that were created during the closing of an ocean basin (e.g. Plates 2-6), more than 600 my ago, with sedimentary and igneous rocks emplaced during the opening of another ocean basin, about 200 my ago (previous post ). The diabase intrusions (Plate 7) were emplaced during the latter event, cutting through rocks that weren’t much older than them (if you call 20 my a short time interval). The earth’s crust moves slowly over a semi-molten mantle, but it never stops moving back and forth; and the result is there to be seen if we’re looking for it.
Sugarland Run: Reaching Towards the Potomac
The confluence of Sugarland Run (left) and the Potomac River (right). This is where today’s trip ends. The trees haven’t recovered their foliage yet because it is late March. We’re going to start upriver about a mile and end up here.

The last post covered the area inside the blue ellipse. We encountered 200 Ma shales and sandstones of the Balls Bluff shale. we expect to see similar rocks today, but we’ll be entering the Potomac flood plain. The red ellipse is where we are in this post. The numbers will be referred to later as the locations where photos were taken. The dashed lines for “rock” and “gravel” are approximate locations where the bed of Sugarland Run changed composition. It should be interesting.

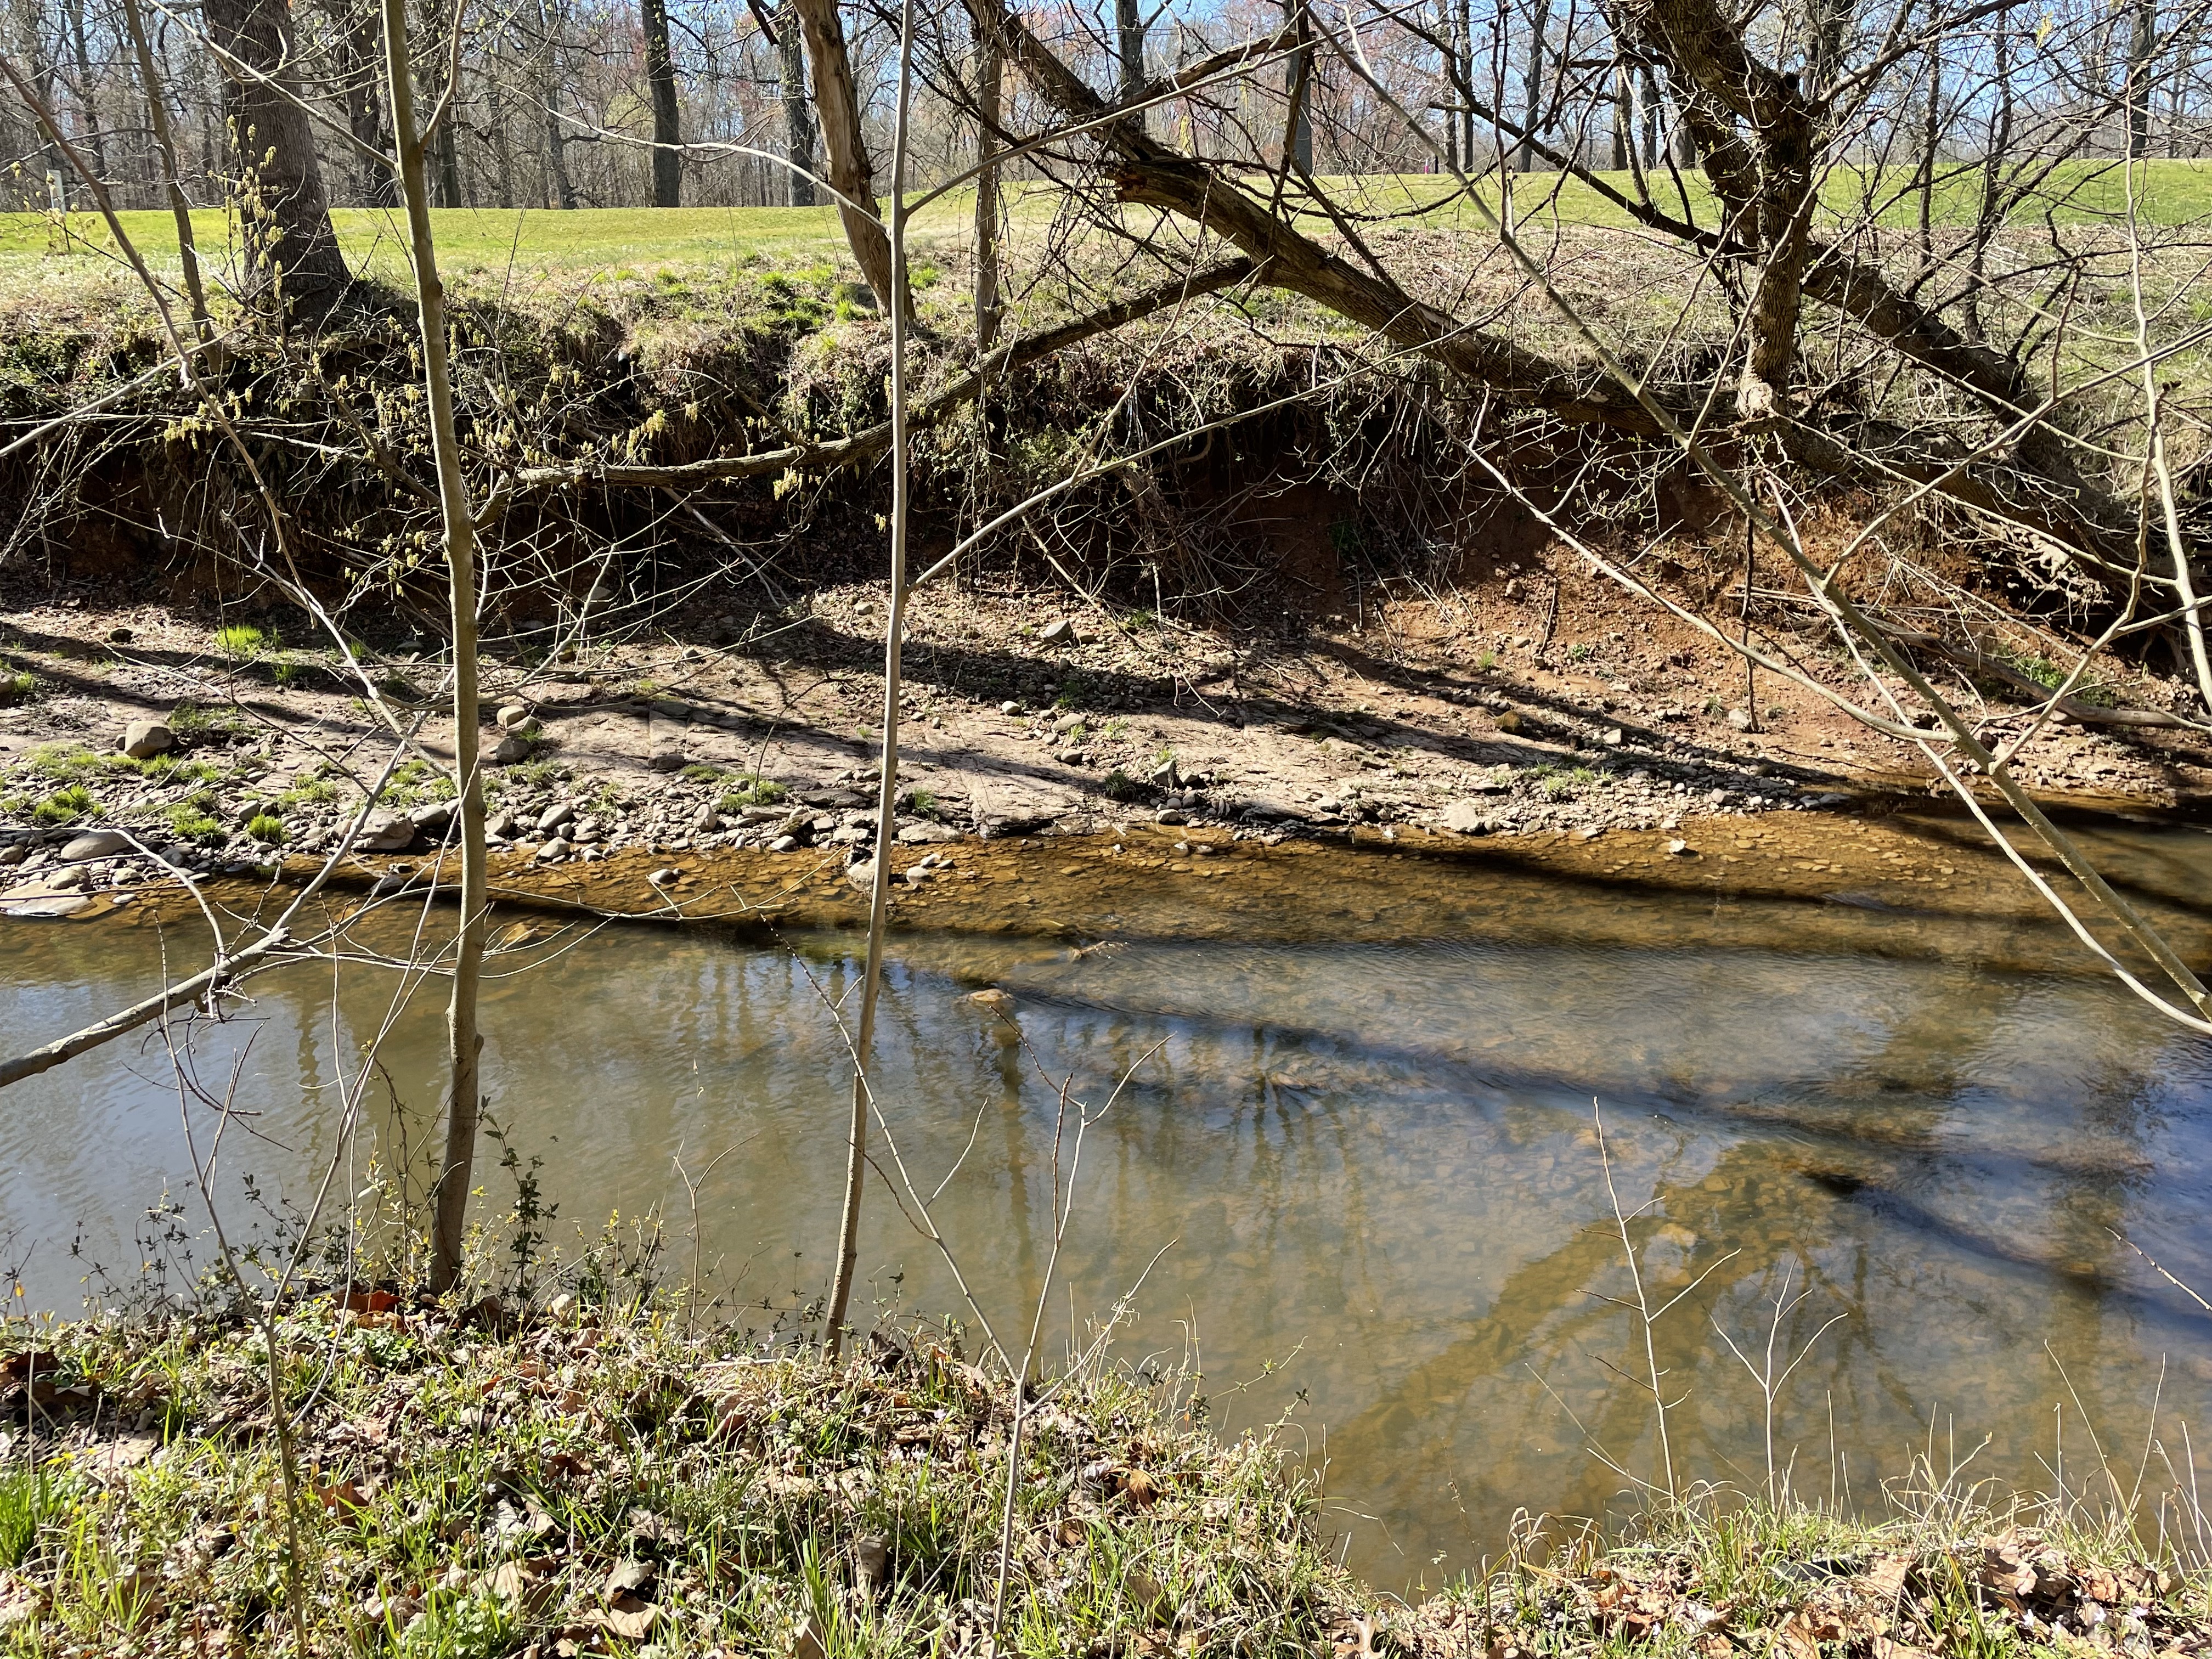
Here at Site 1, the bed consists of large, angular boulders with rounded corners. These rocks didn’t travel far, probably eroded from now-gone cliffs like we saw upstream. This location, as with similar rocky transits we saw upstream, represents a point where the stream flows over an exposed ledge of bedrock. This is very common for streams in this area.
View looking downstream (north) at Site 1. Note the dramatic change in stream bed composition. The bar on the right consists of silt and gravel. Note also the eroded, soft bank on the left. We have entered the ancestral Potomac flood plain.
At Site 2 (see map above for location) gravel bars like this were found where a smaller stream entered Sugarland Run. It is probable that the current stream is cutting through ancient sediments because there is no source for gravel like this anywhere around. These are recycled deposits.

Confluence of Sugarland Run and a side channel at Site 2. Channels like this criss-cross the ancient flood plain. These are larger than those we saw further upstream on the Potomac in a previous post.
This photo from Site 2 is the last appearance of bedrock in the stream bed. Note the flat surface across the stream that tilts slightly towards the camera. This is a bedding surface for the Balls Bluff Siltstone. Upstream, these rocks form low cliffs and are tilted away from the modern stream. It is likely that overlying beds have been eroded after tens-of-millions of years by the ancestral Potomac River. The change in dip suggests, further, that there is a structural feature between this location and a mile upstream. There is some evidence for a fault that runs along Sugarland Run several miles upstream. It was probably part of regional adjustment during uplift over the last 200 my.

As with other streams on the Potomac River flood plain, there has been rapid erosion. This example from Site 3 can be dated by the age of the tree. I don’t know how old it is, but it is certainly less than a century. What is unusual is that this erosion is occurring inside a bend. Usually streams cut on the inside of a meander and deposit point bars on the outside. We’ve seen this at every scale in previous posts. From what I’ve read there has been rapid erosion in the last few decades because of urbanization. We saw an extreme example in the last post. The field data suggests that Sugarland Run is widening but not meandering. This is not a natural process in unconsolidated sediments like these. The ancestral Sugarland Run certainly does meander (see map above), but this rapid erosion unaccompanied by channel migration is not natural.
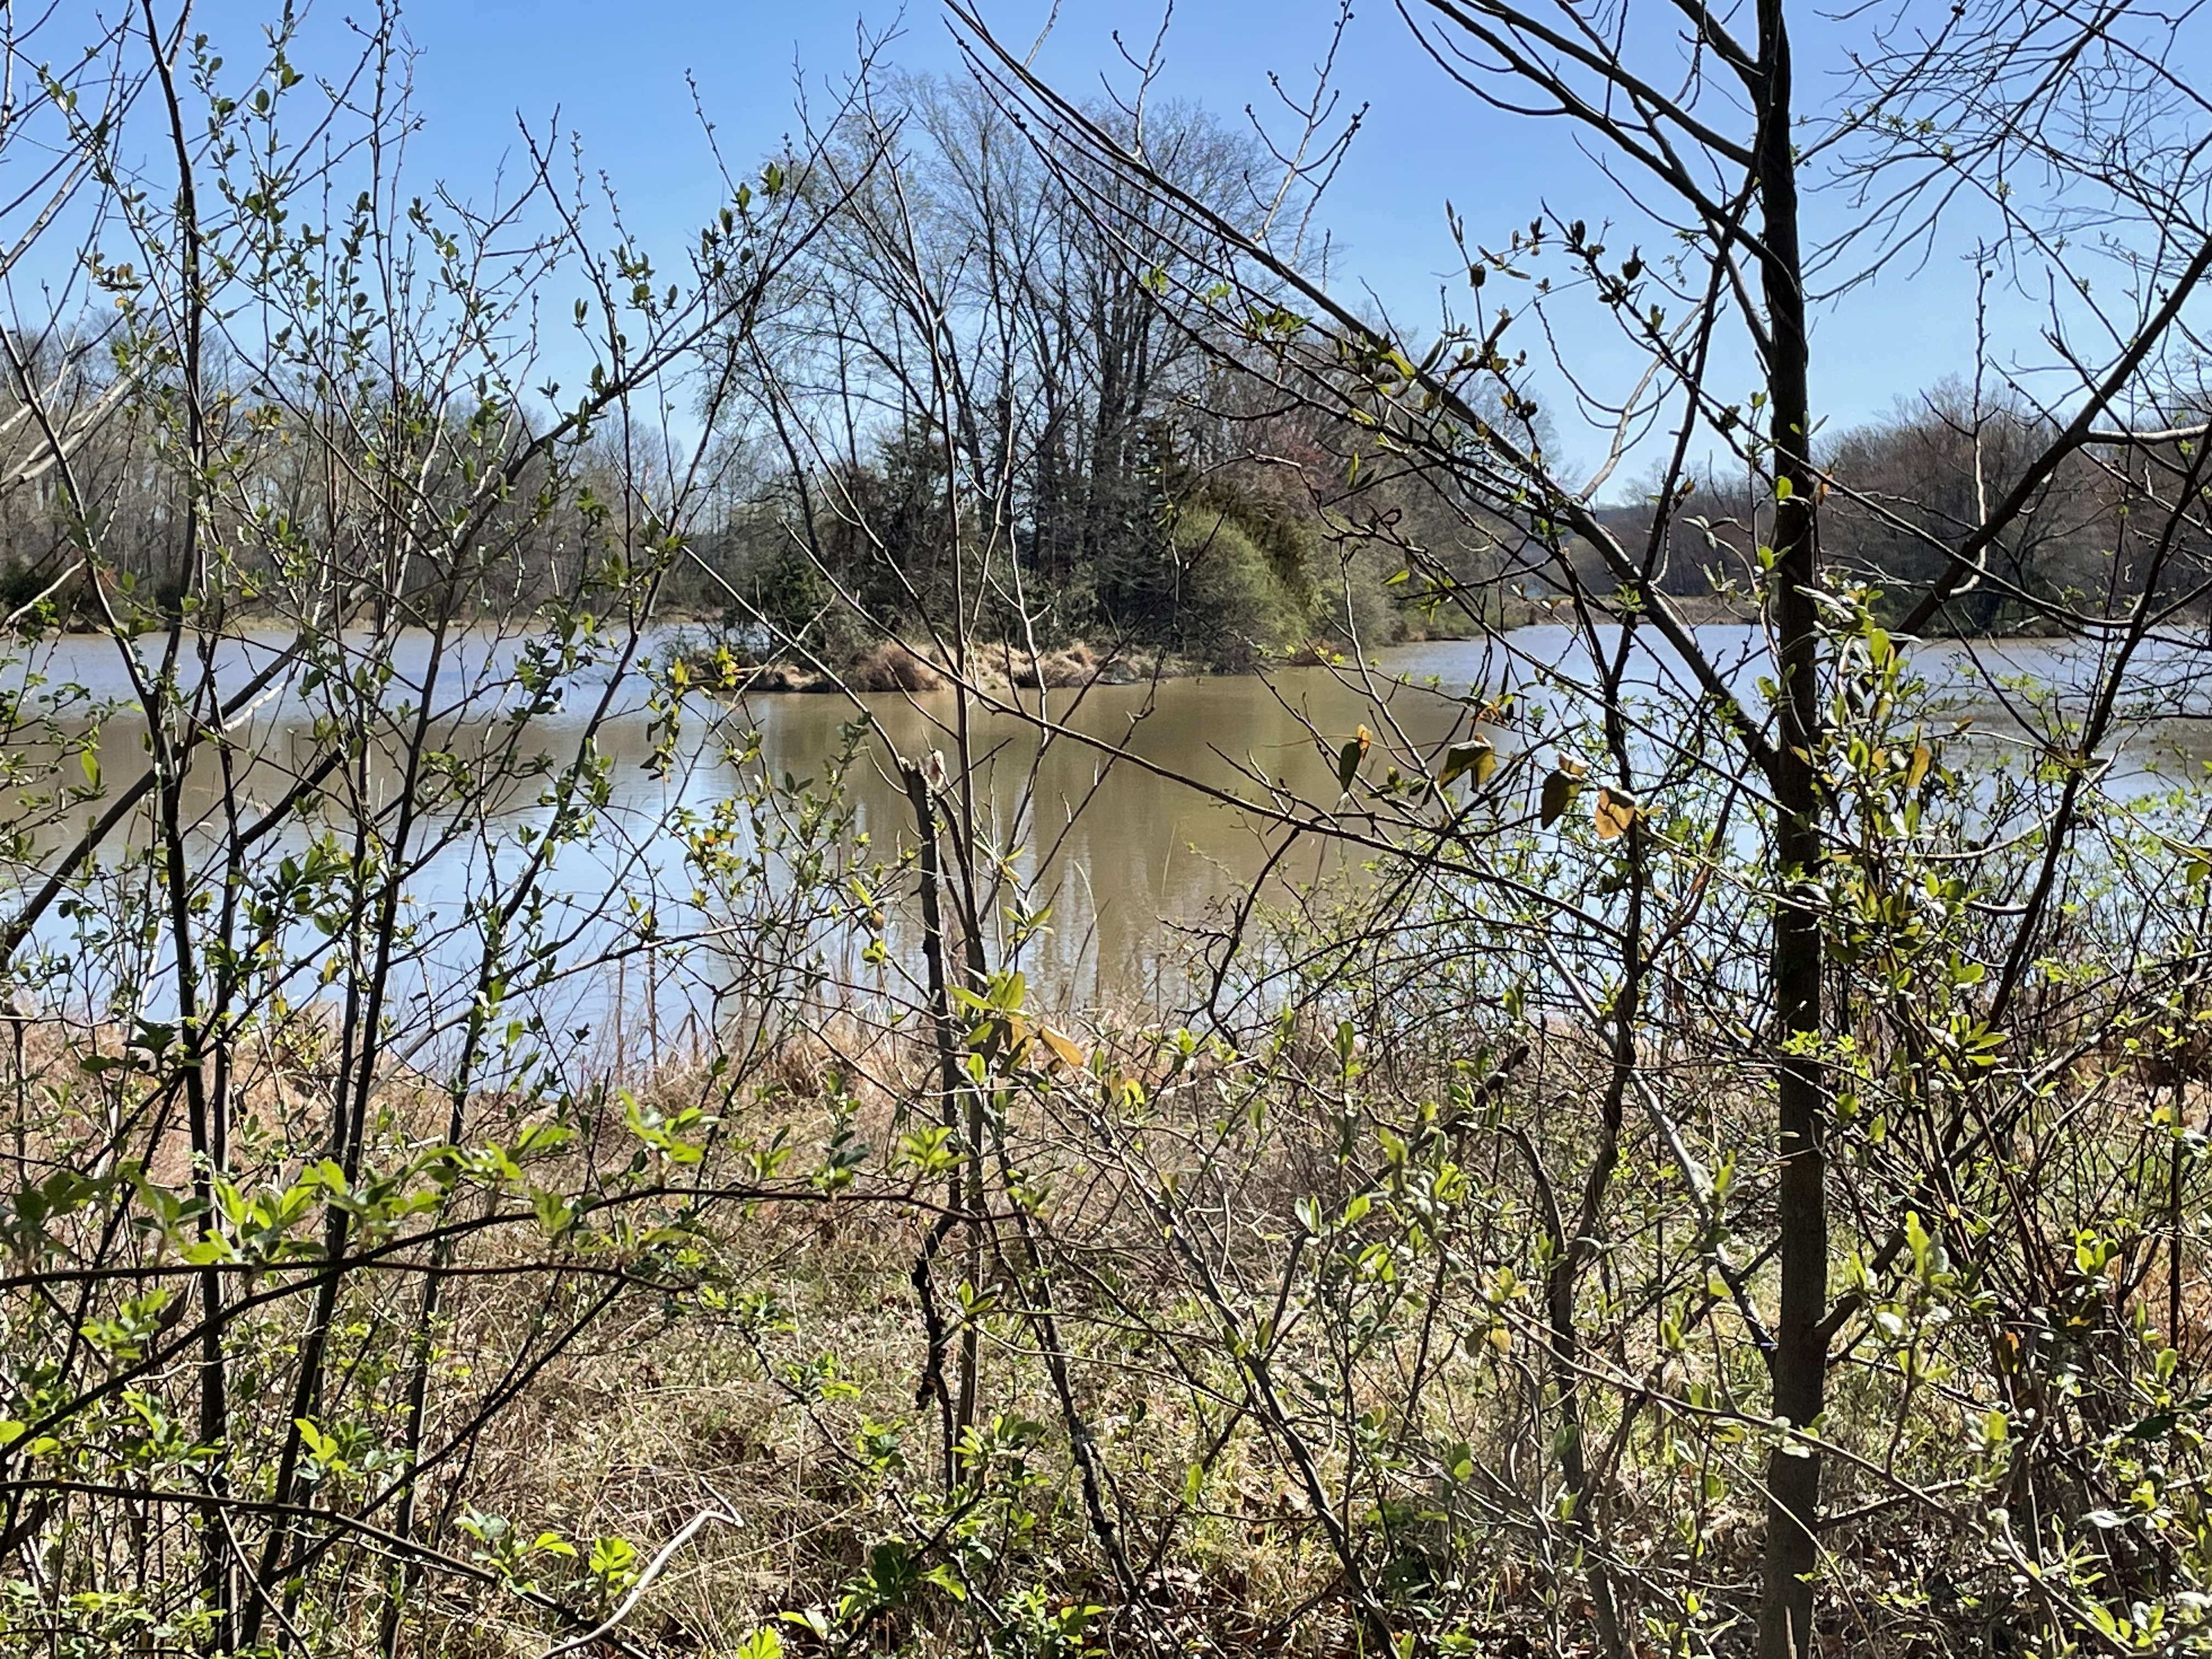
There are several small lakes near the modern Potomac River, such as this one (just north of the Site 3 label in the map above). Sugarland Run passes it within 100 yards, through unconsolidated muddy sediments. Features like this are difficult to understand because the age relationship between the stream and lake cannot be unambiguously identified through radiometric dating. Both developed in sediments of the same age, older than either feature. These lakes (see map above) don’t look like oxbow lakes. Given the common occurrence of depressions throughout the area, which form small ponds and lakes during the wet season, the geological fact that the Potomac floodplain has wandered across a wide swath of the area (see for example a previous post), and the lack of any outflow to a modern stream (see map), it is probable that these lakes represent undulations in the ancient flood plain and Sugarland Run is younger. It just happened to miss the lake as it cut down through the soft sediments without meandering.
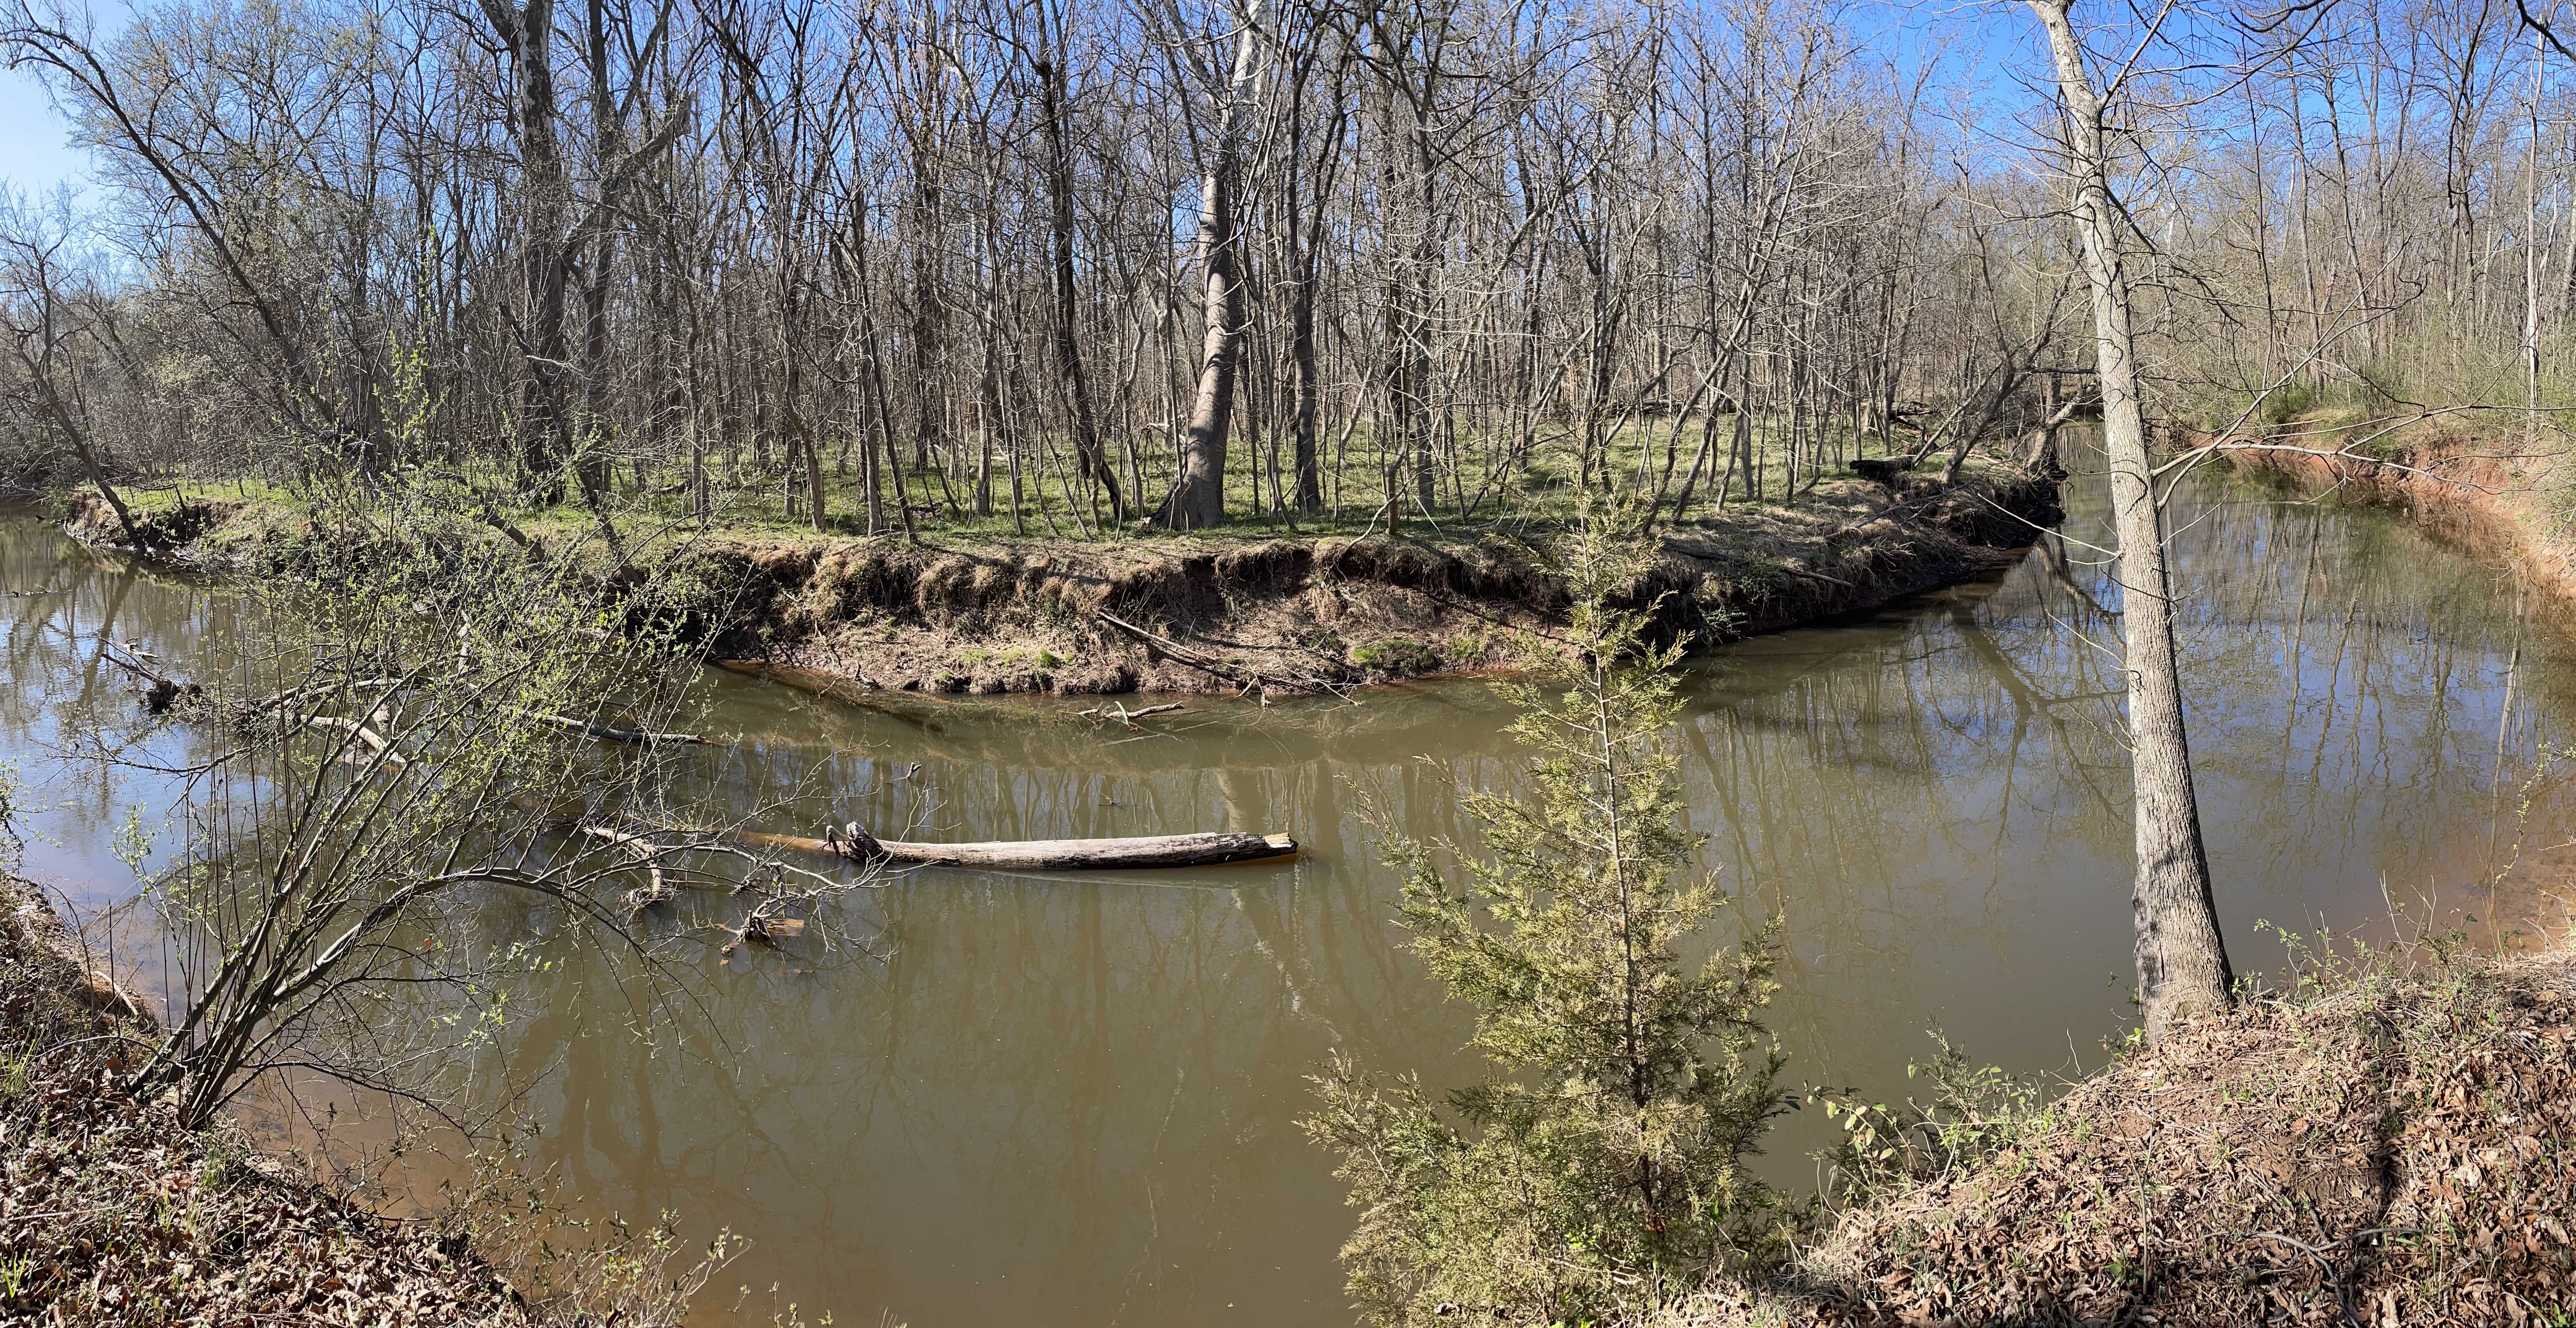
This meander at Site 3 shows how Sugarland Run is becoming incised rather than following a typical meandering trajectory, as at Horseshoe Bend on the Colorado River. The scale is drastically smaller but the processes are similar; the stream lacks the energy to erode the banks and becomes “trapped”, so it cuts downward as the upriver source is uplifted relative to the outflow. In addition, this small stream appears to be widening, as seen in the eroded tree on the bank in a previous photo.
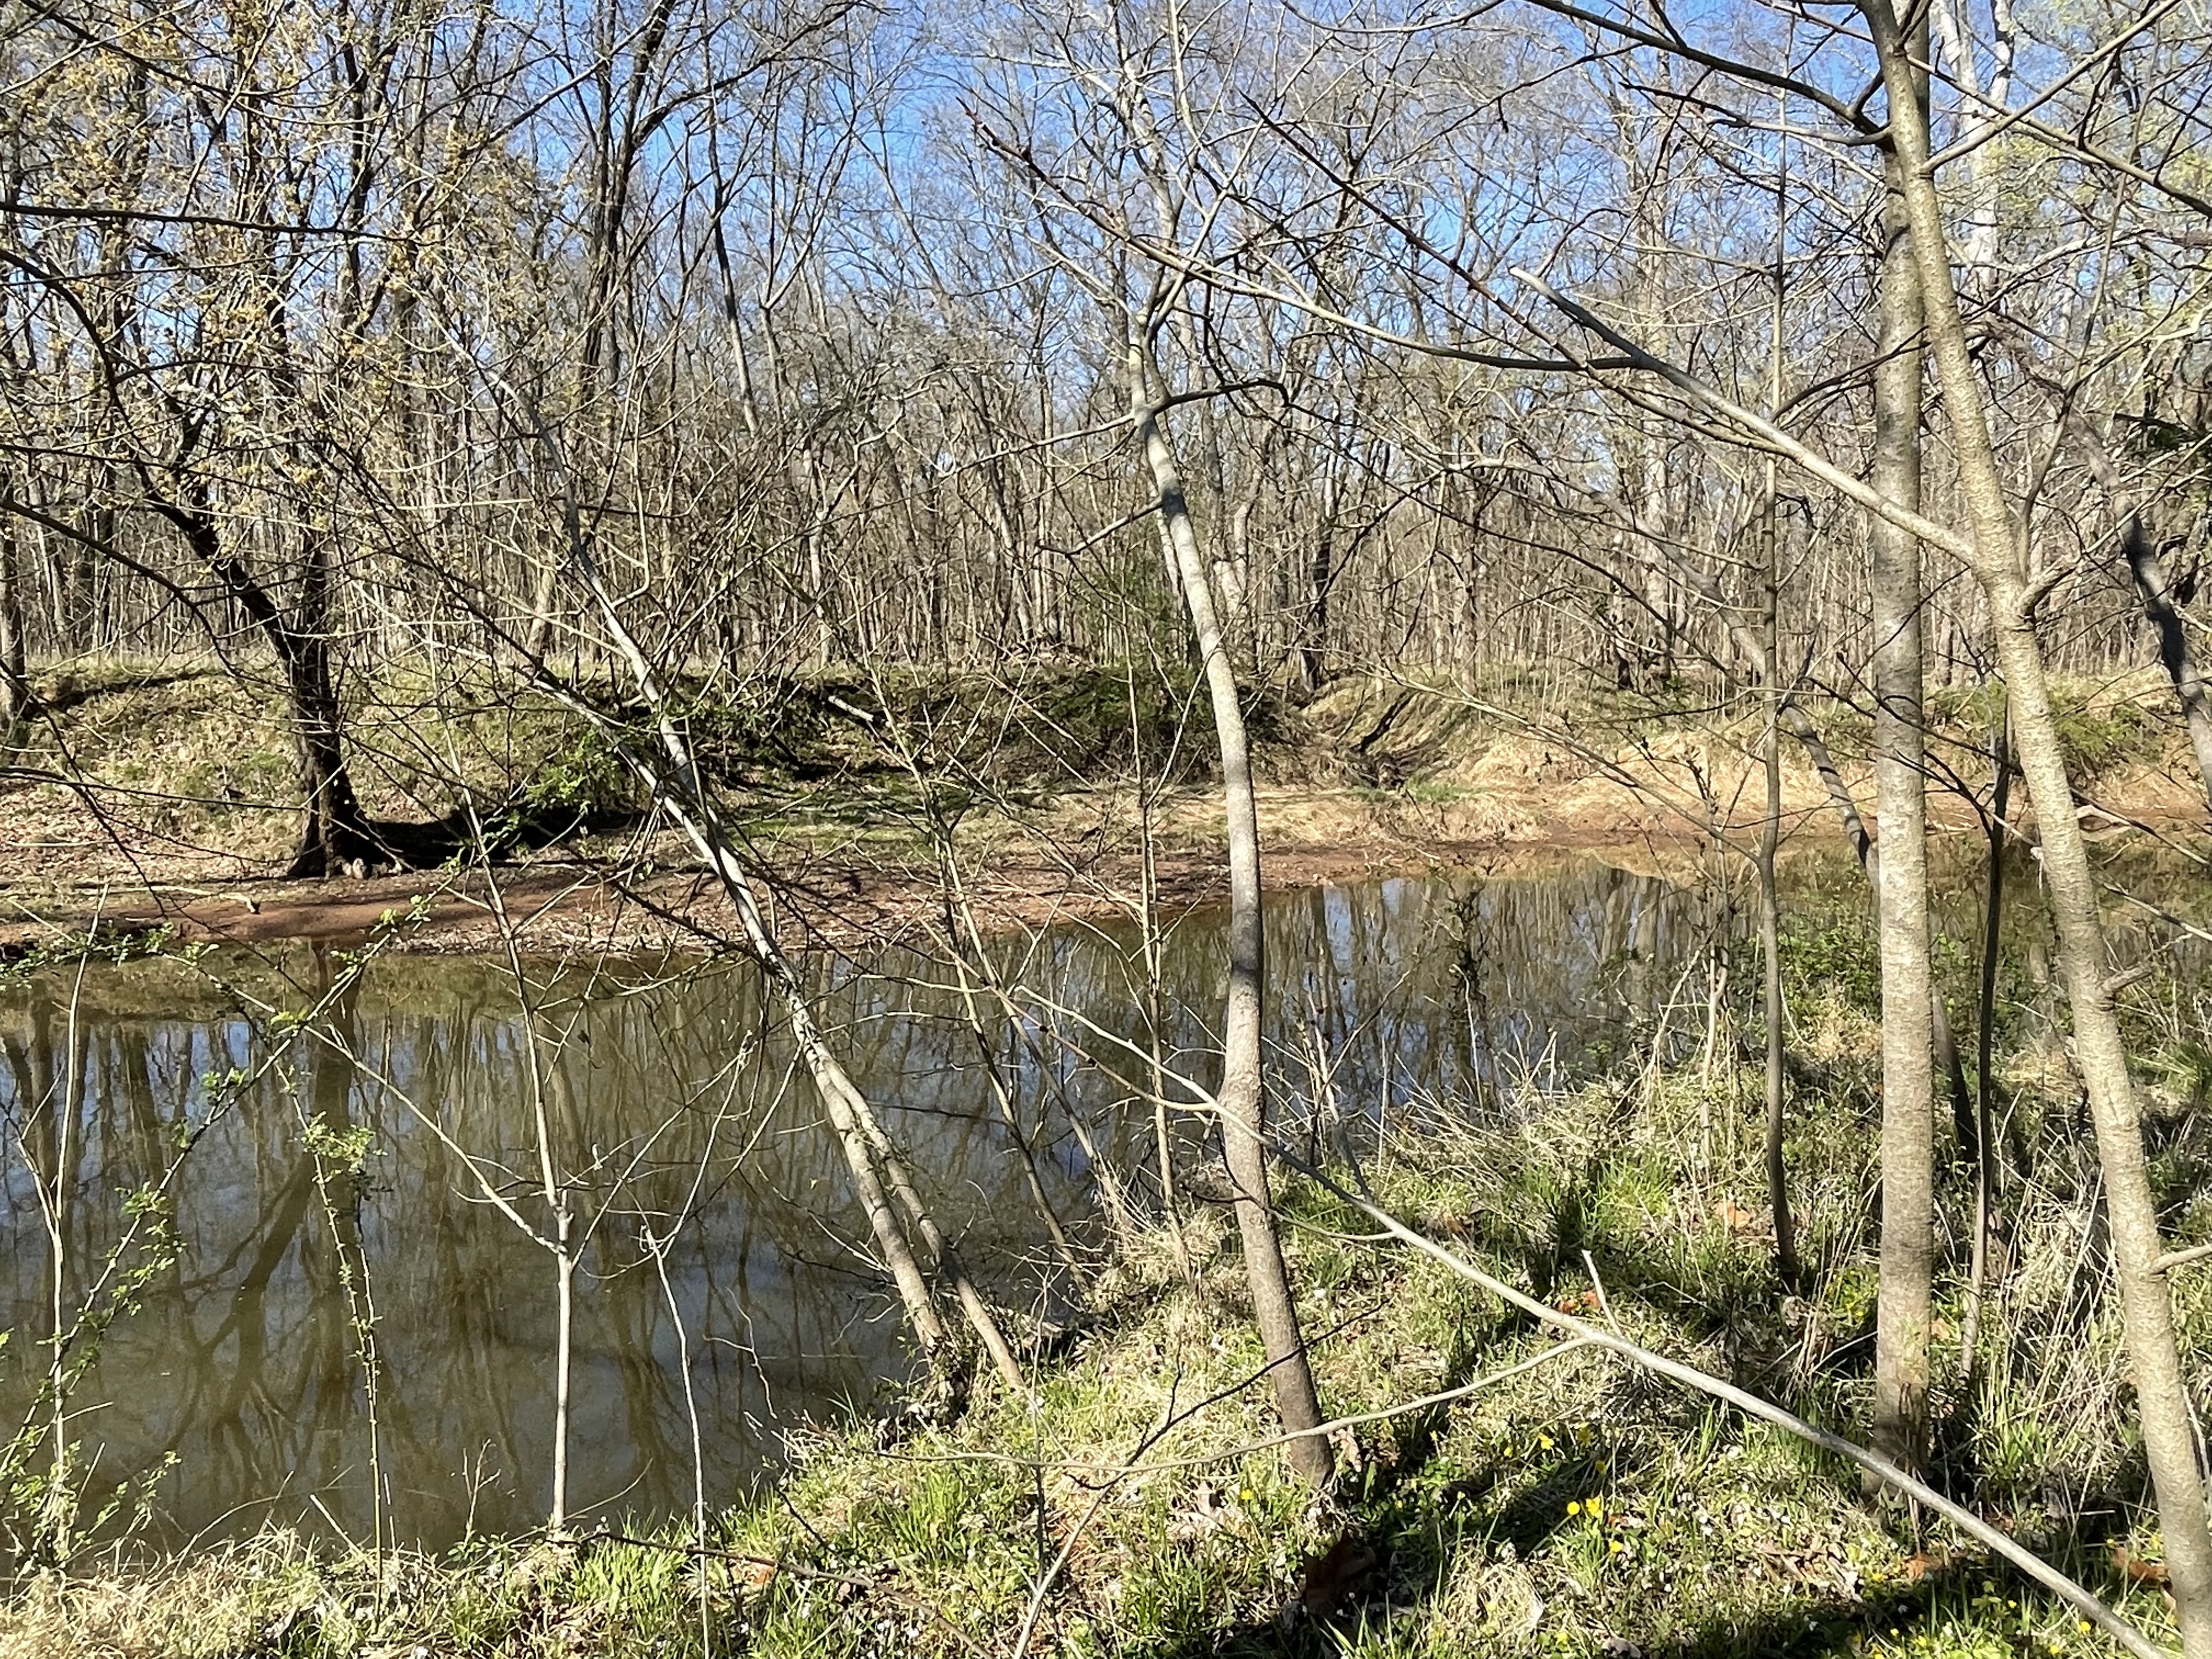
Another interesting feature we saw between Sites 3 and 4 was a couple of elevated flat surfaces like this one, seen in the center-left of the photo, about halfway between the current stream bed and surface. These benches were small in area (less than 100 feet) and at the current water level of the stream. My best guess (a common occurrence in geology) is that they were point bars when Sugarland Run was smaller and are relict features on the modern Potomac flood plain.

Here we are about 100 yards from the Potomac. There is no delta associated with Sugarland Run but there is a bar at its mouth (see first photo).
Sugarland Run is an intermediate-sized stream flowing into the Potomac River. Goose Creek is one of the larger ones, which supplies drinking water for the region, whereas Horsepen Run is a small one. Despite the difference in flow between these tributaries, they display similar geomorphic features (e.g. meandering, point bars, gravel and muddy beds, recent erosion and entrenchment) because they all cross the wide, ancient Potomac floodplain composed of mixed sediment types. The modern Potomac River itself is less than four-million years old although there is evidence of the ancestral river flowing though this area back 20 my. The supply of sediment has decreased over the eons as the ancestral Appalachian Mountains eroded, so we don’t see the kind of sedimentation today that would have been occurring several million years ago.
The sediments being eroded by modern streams like Sugarland Run record a climate and topography very different from what we see today. However, the physical processes were the same and the landscape was shaped, ultimately, by geological processes occurring deep within the earth’s crust. These same constraints produced the ice age that is closing in our times and associated fluctuations in sea level, adding nuances and new themes to the unfolding story of our Earth.
Sugarland Run: Downstream at Algonkian Parkway
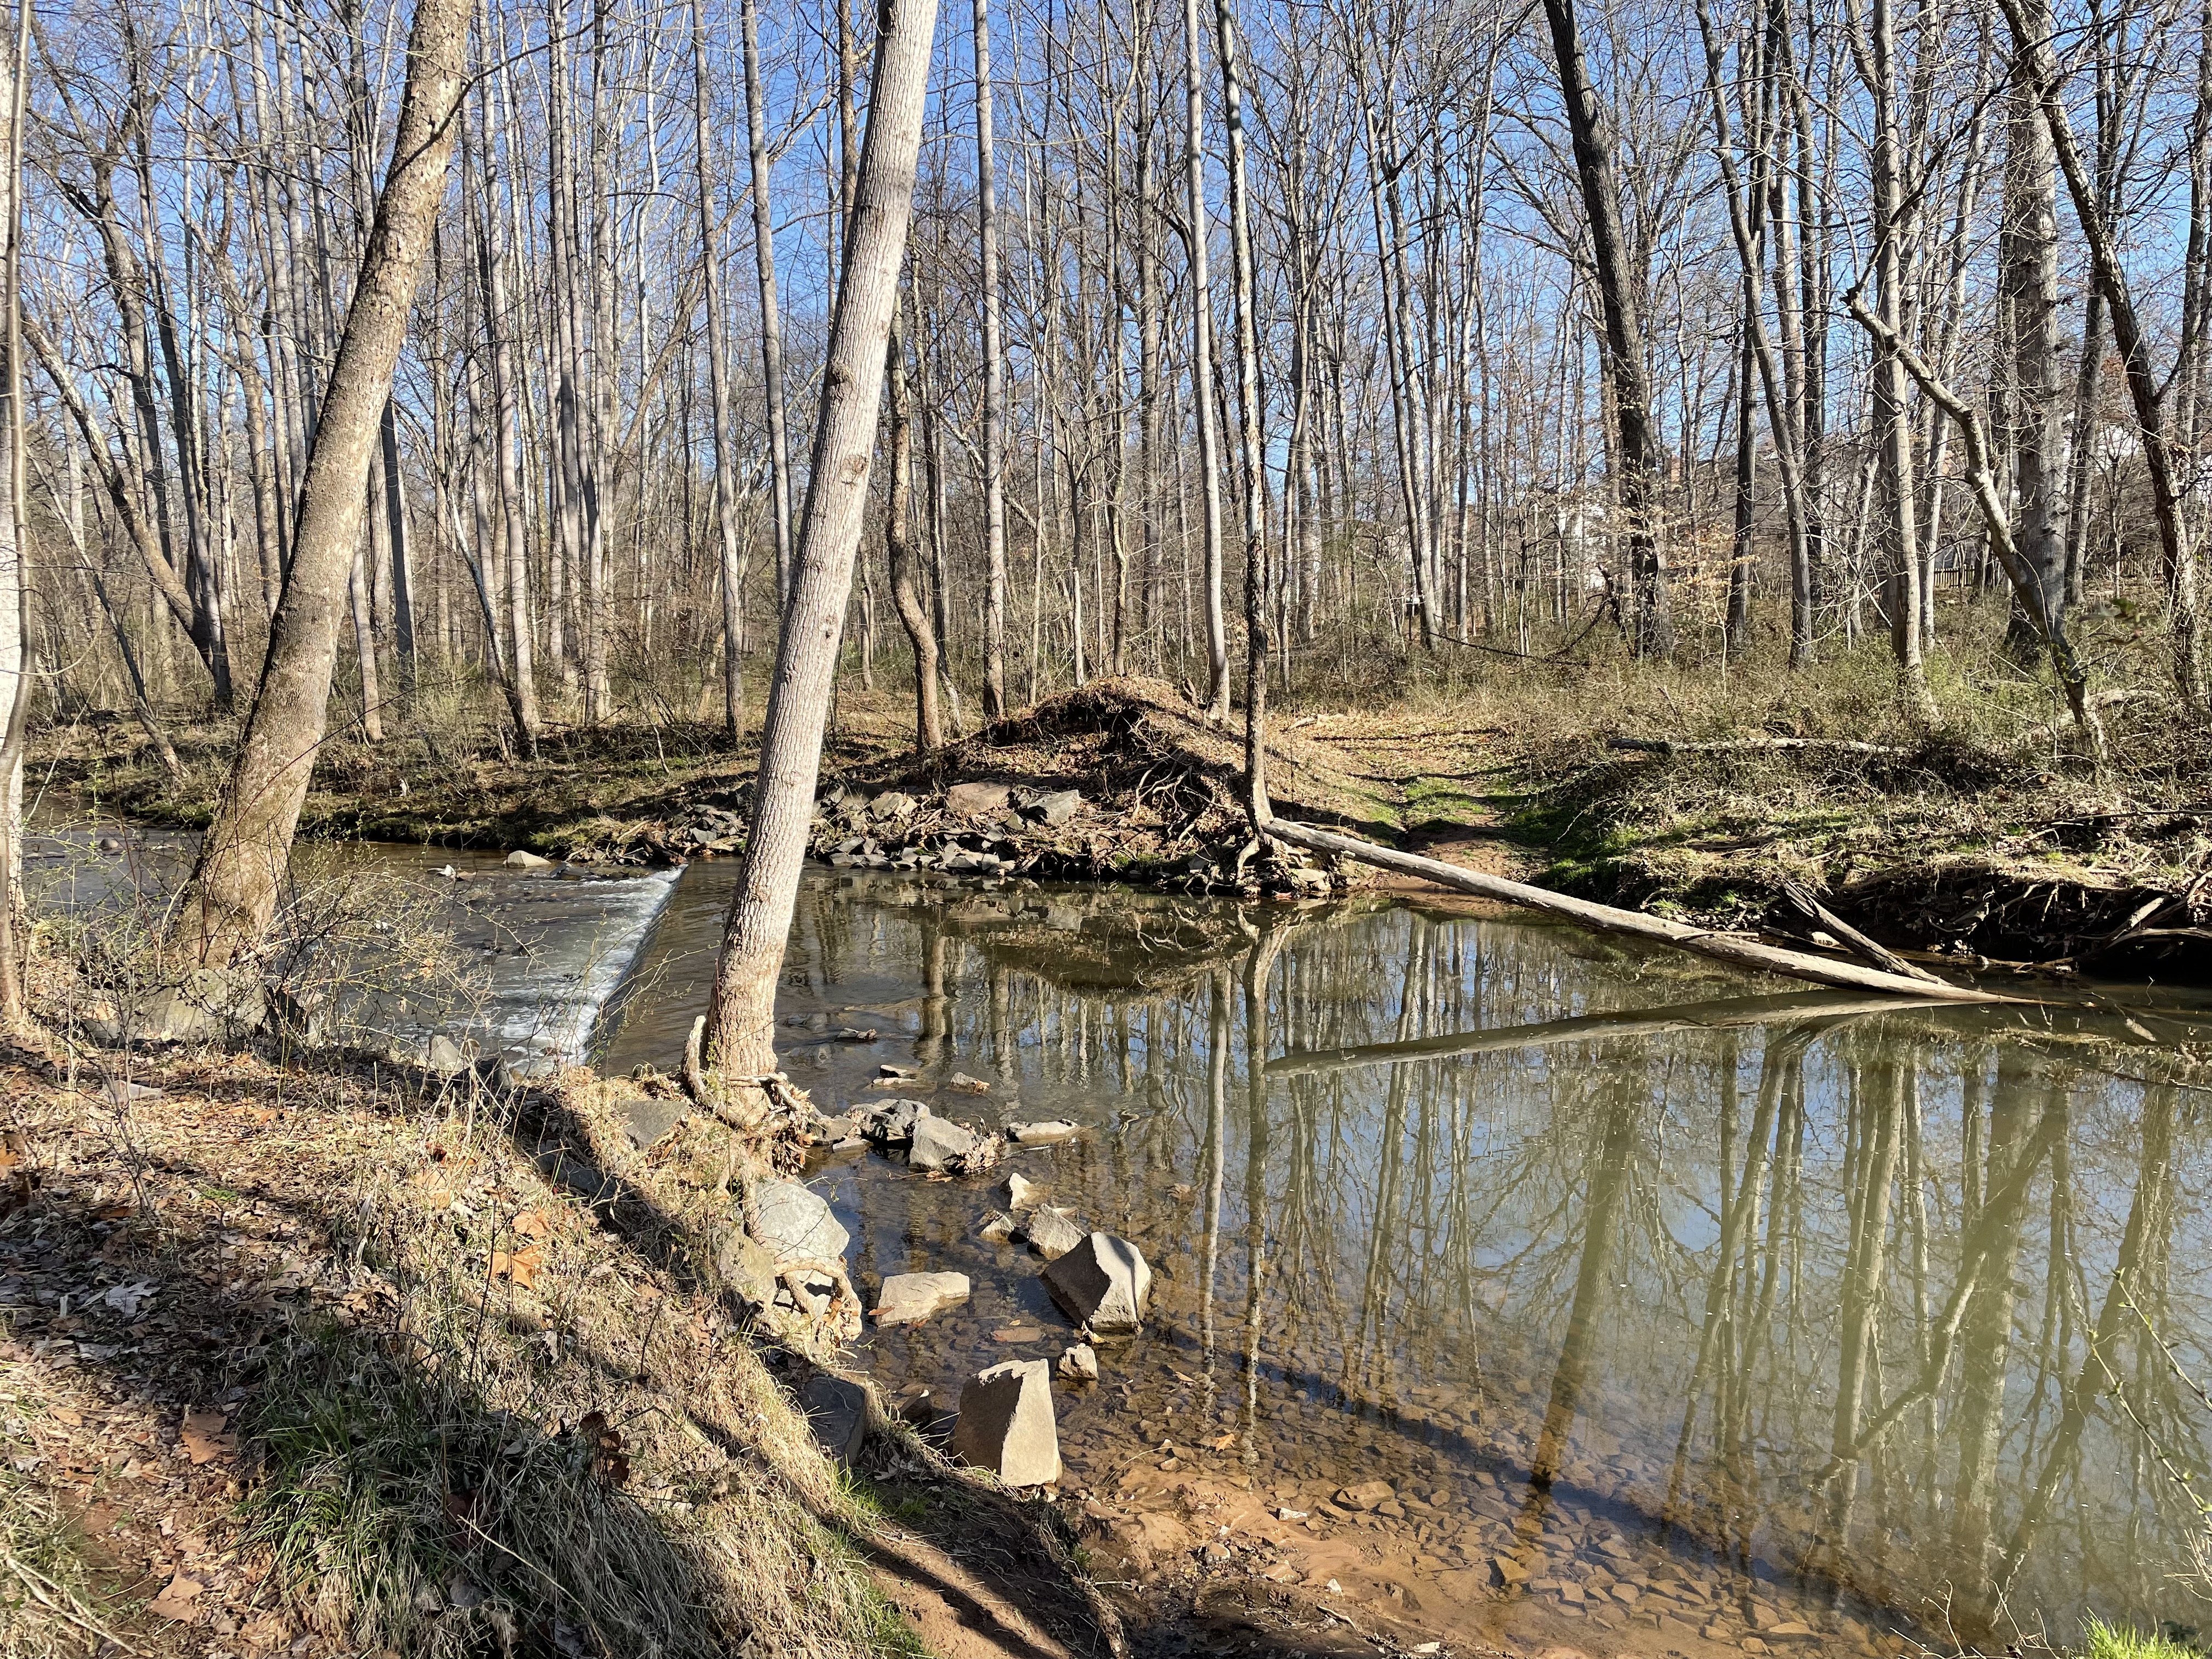
This adventure followed Sugarland Run (aka Creek) a mile or so, where it flows through a wide spot between ledges of sandstone. The area has been developed for a long time and the creek is crossed by weirs (white water in this photo). I don’t know if they were to maintain water levels or as roads.

This geologic map from Rock-D shows the starting point our walk (blue circle), which ends at Route 1582 (Algonkian Pkwy). The pink rock seen to the left of the creek (tan color running N-S) is Balls Bluff siltstone. It consists of of predominantly shale but we’ll see some coarser sediments today. These sediments were originally deposited in lakes during the early stages of rifting of the supercontinent Pangaea about 220 Ma (million years ago), when the modern Atlantic Ocean was first opening. We encountered this rock at its type locale, and again in Goose Creek.

This is our first glance of Balls Bluff siltstone. Note how it holds up the ridge that borders Sugarland Run.
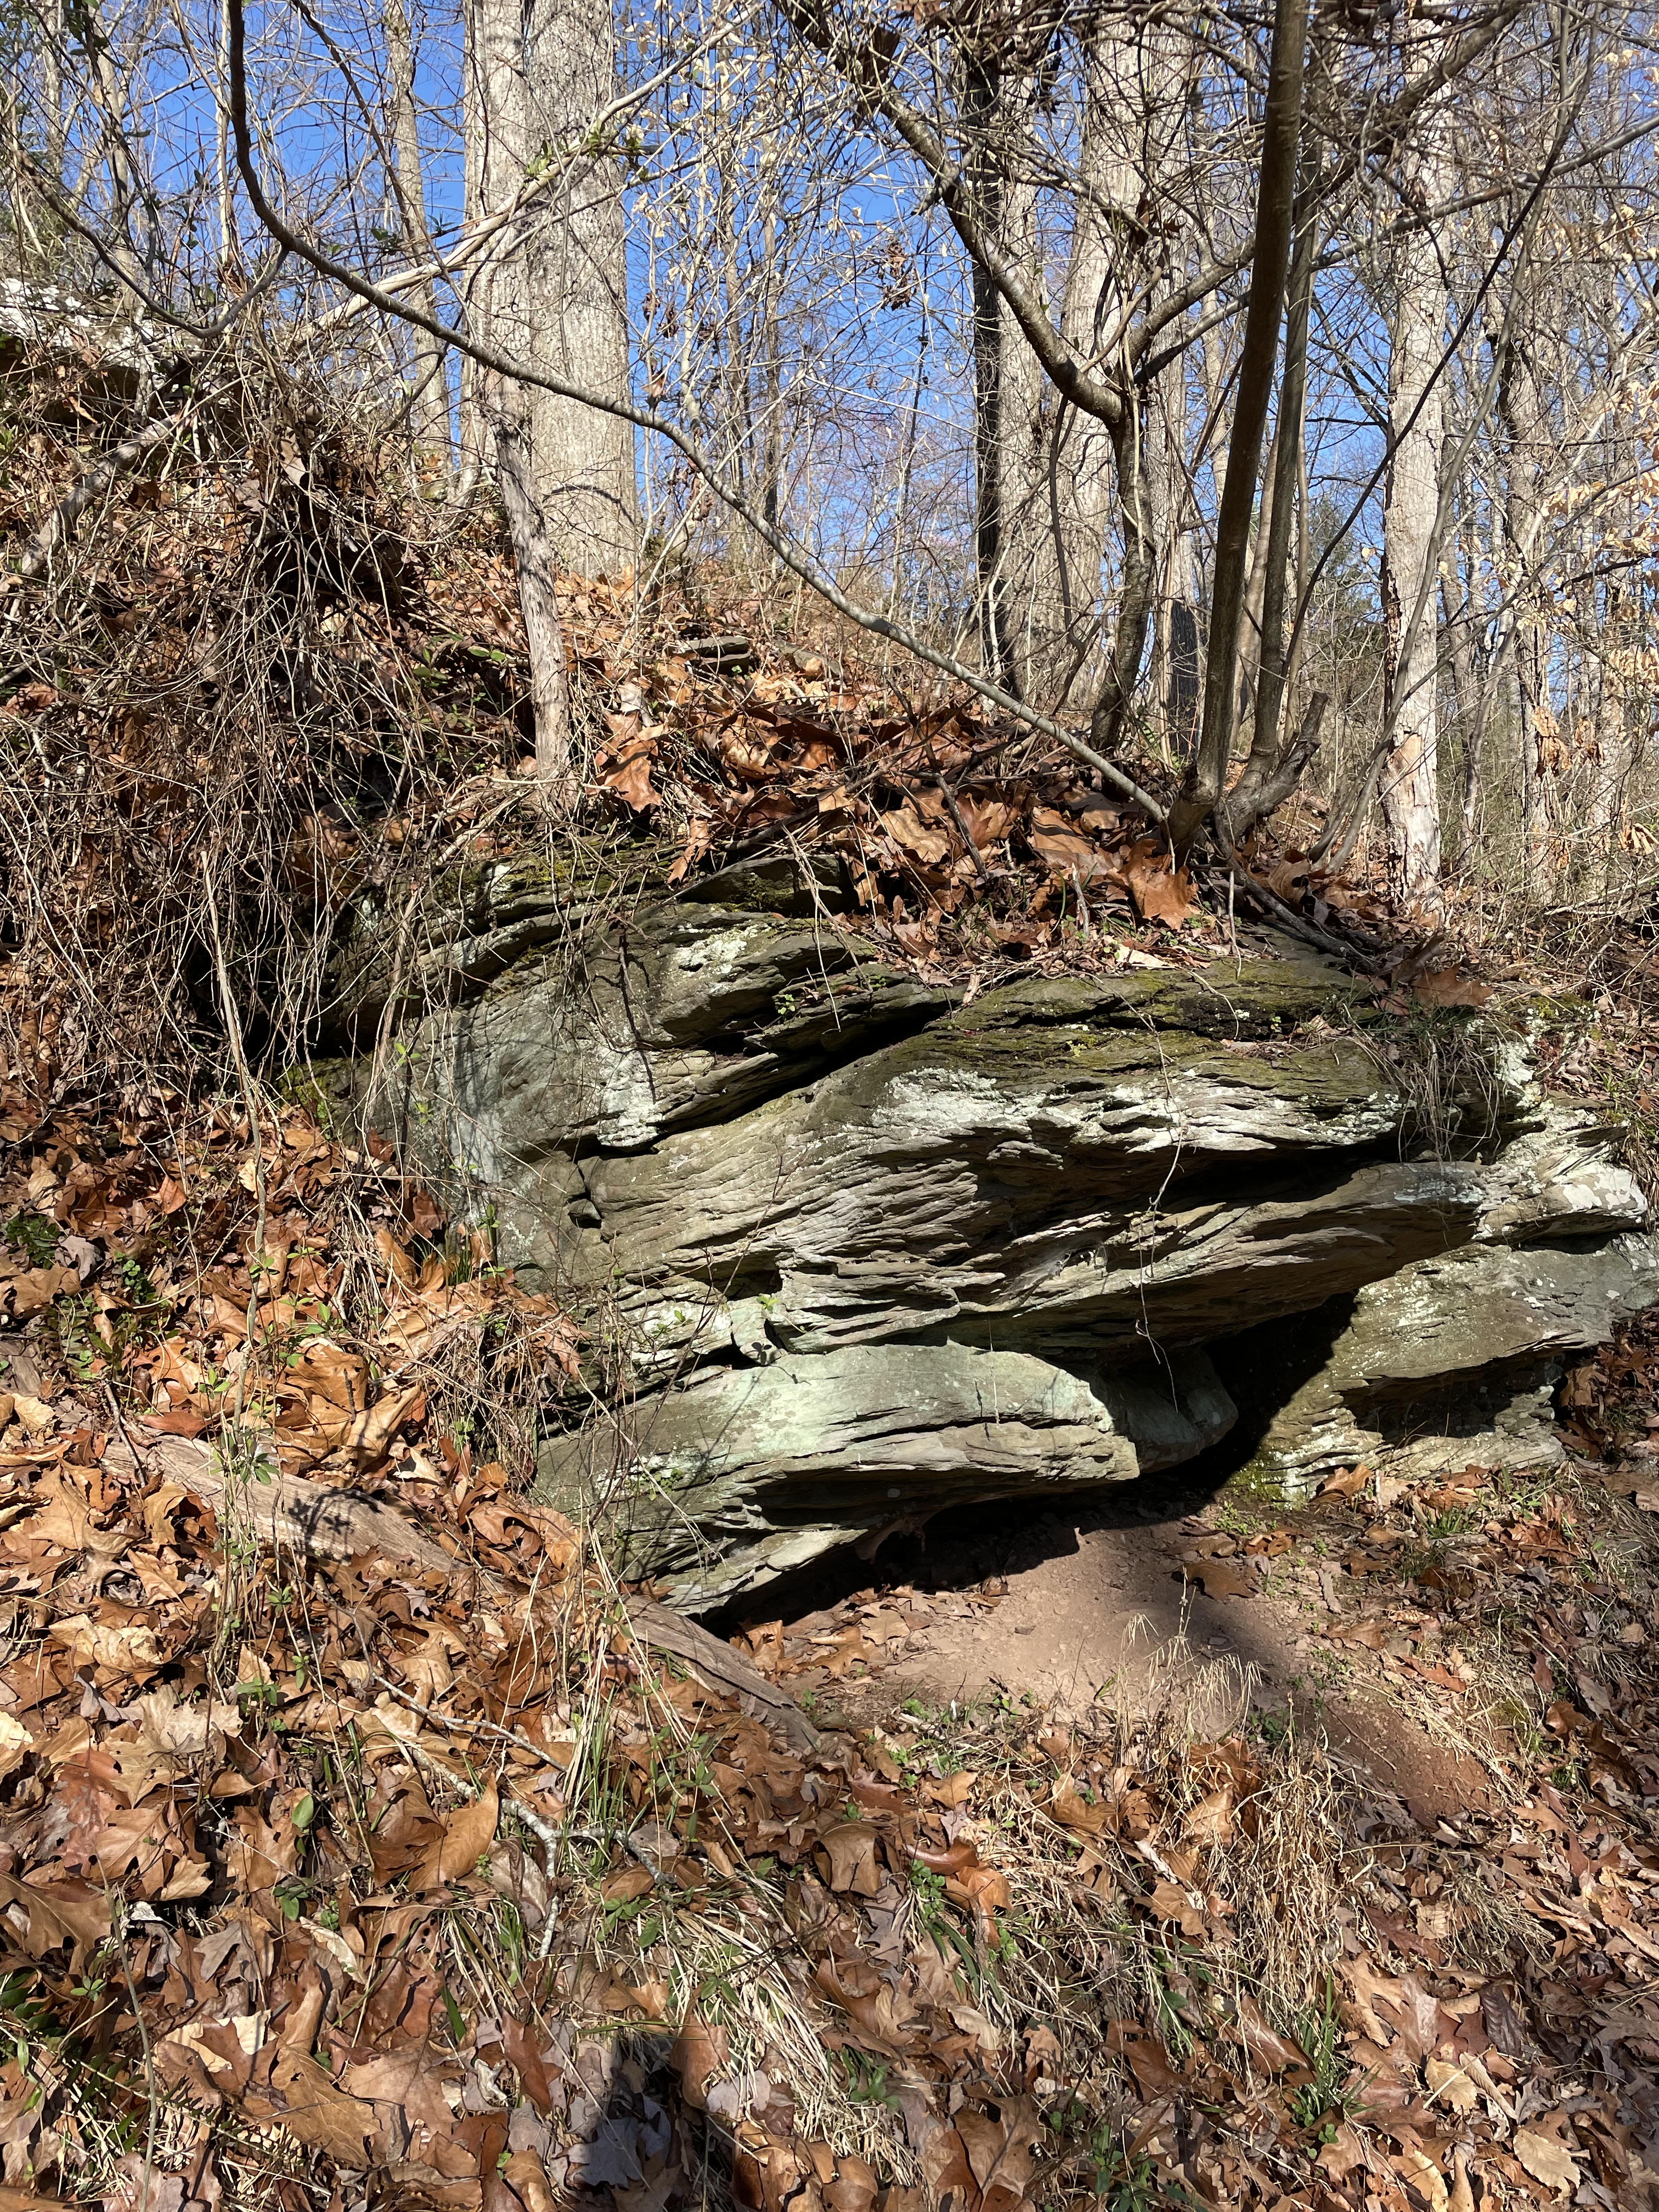
Exposure of cross-bedded siltstone about twenty feet above the creek level. Note that it is dipping to the west at less than 30 degrees west. The strike follows the regional trend of ~30 degrees northeast. This is the orientation (rotated over the last 200 my) of the rift that tore Pangaea apart.

This close-up of the previous image reveals a well-sorted sandy texture. There are no large pebbles or angular rock fragments visible and it was rough to the touch. Like sandpaper.

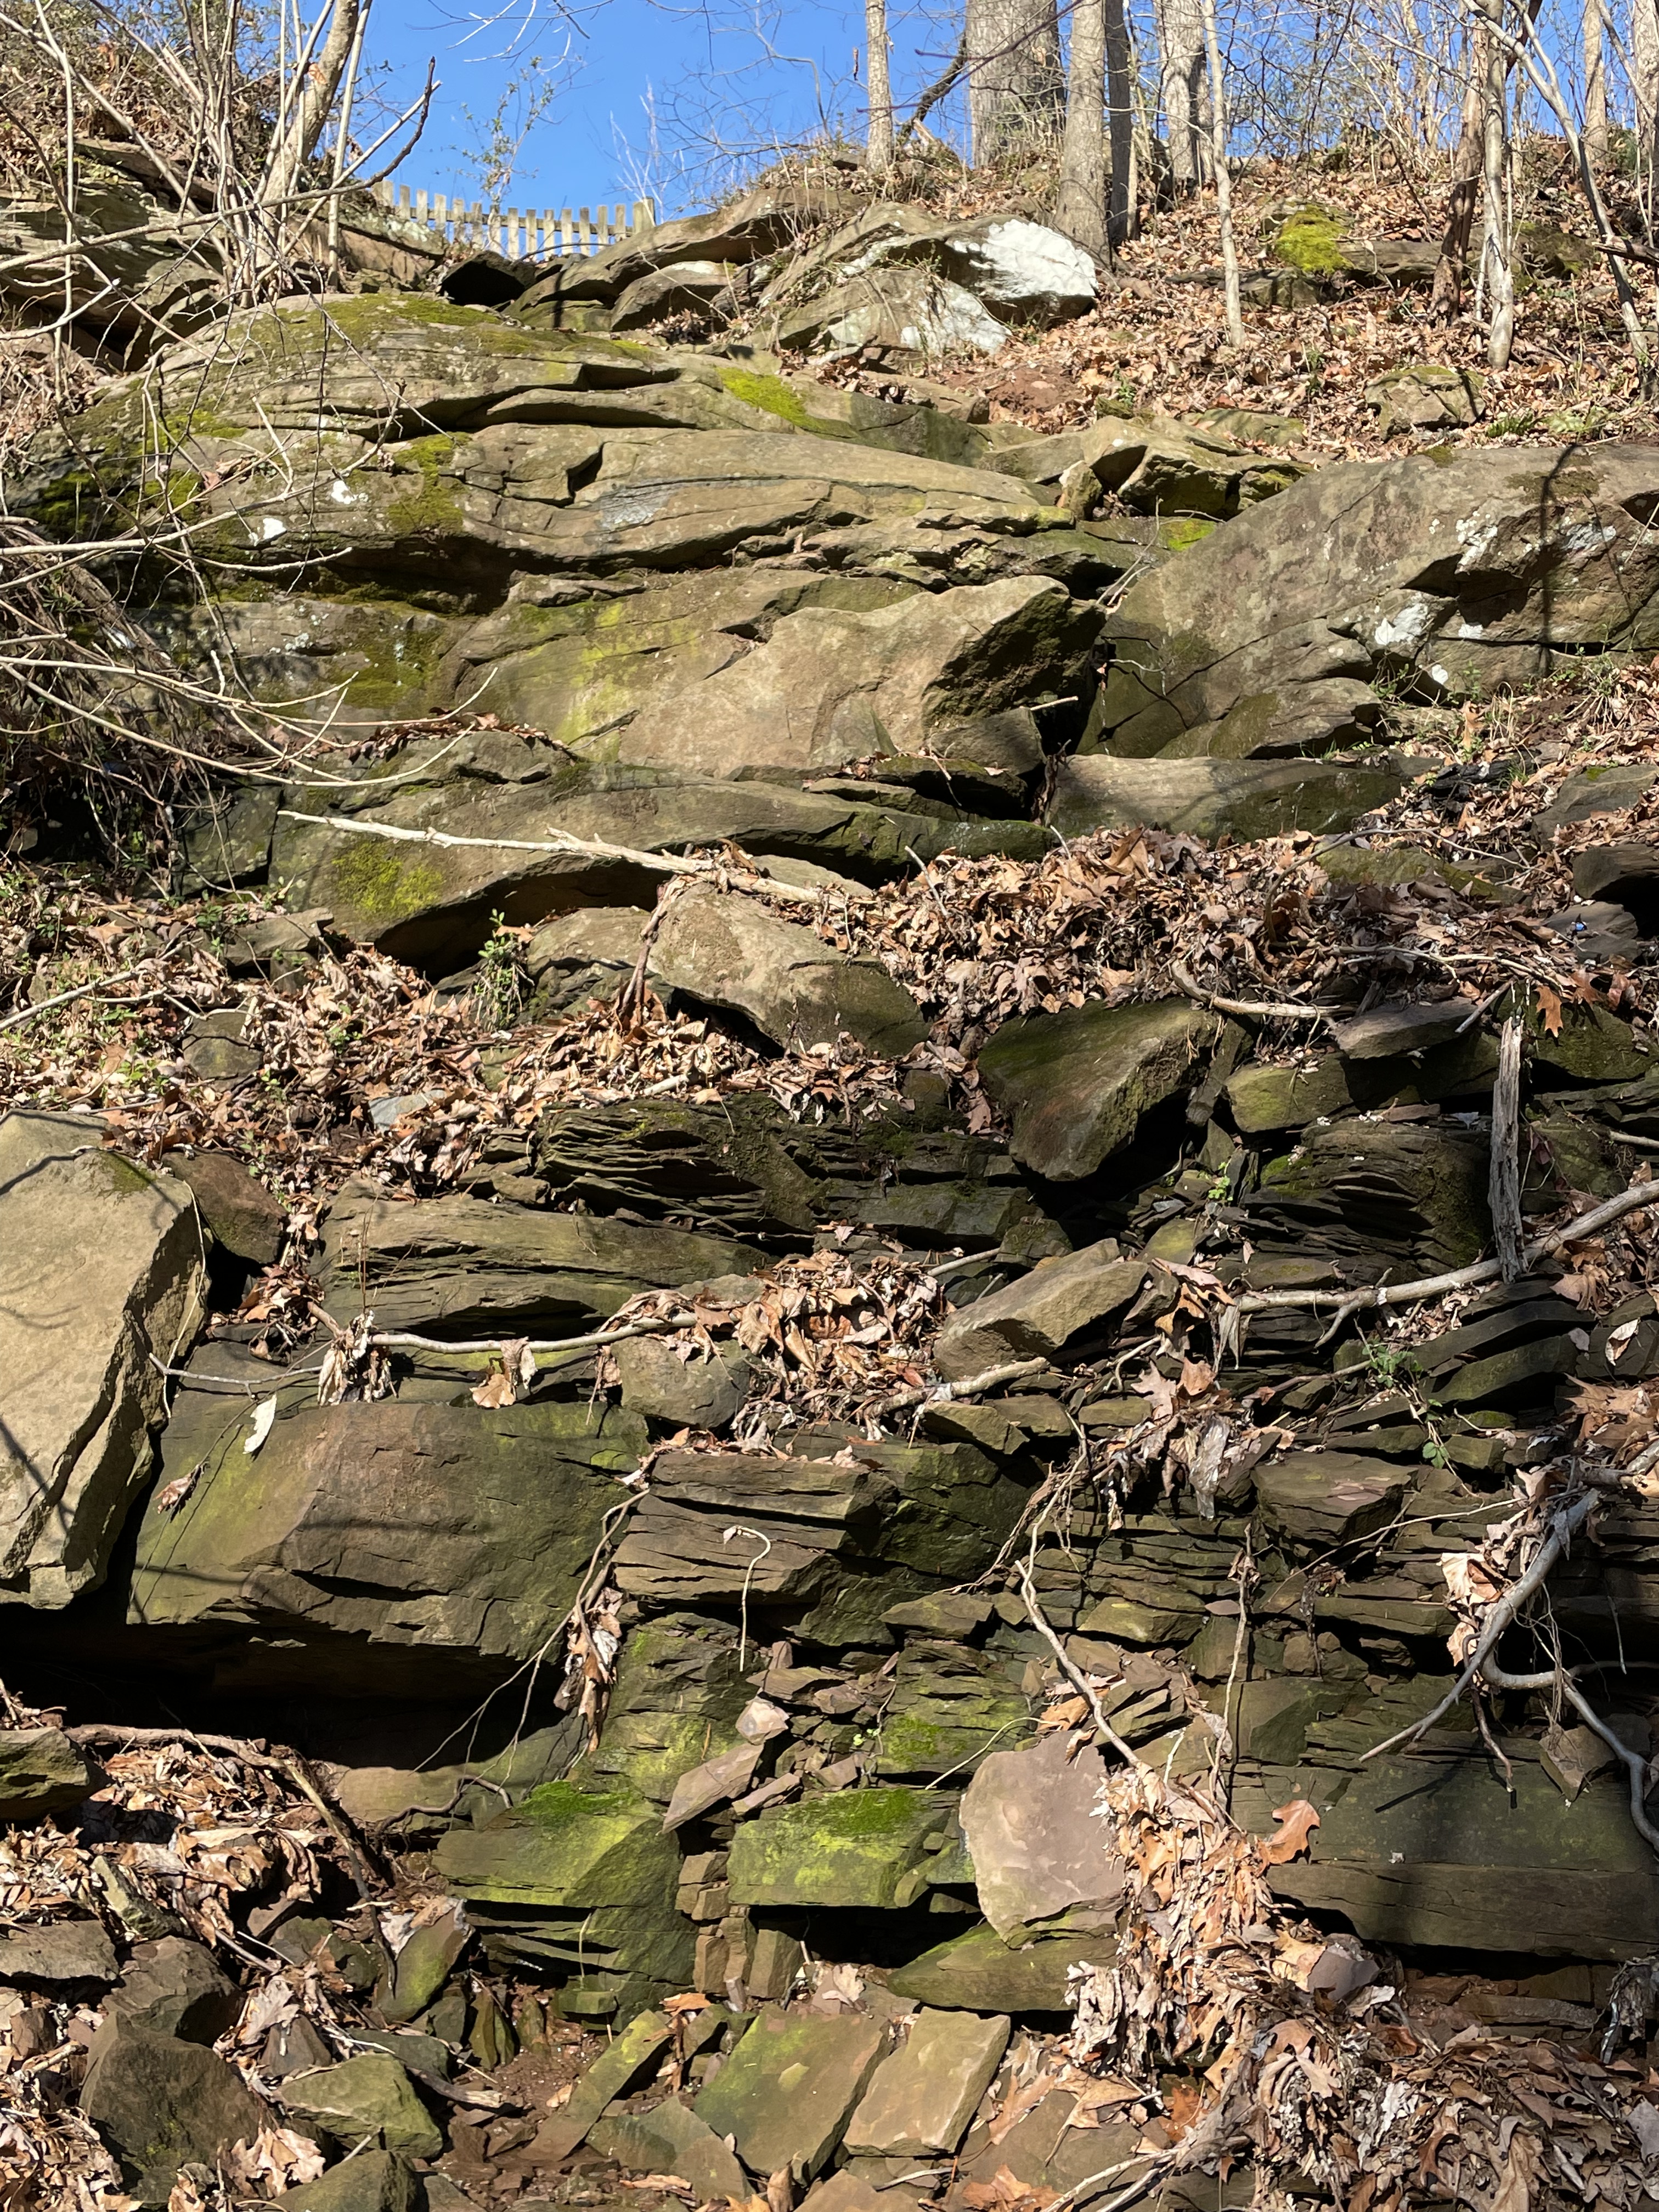
This is a nice view looking up-section. The total thickness represented in this side-creek/drainage channel is more than 50 feet, which is not available in exposures elsewhere in the area. The lower part (note the stream bed near camera) is blocky sandstone whereas shale predominates up the section (noted by slopes rather than ledges). The sandstone/siltstone beds become thinner up-section but are present.
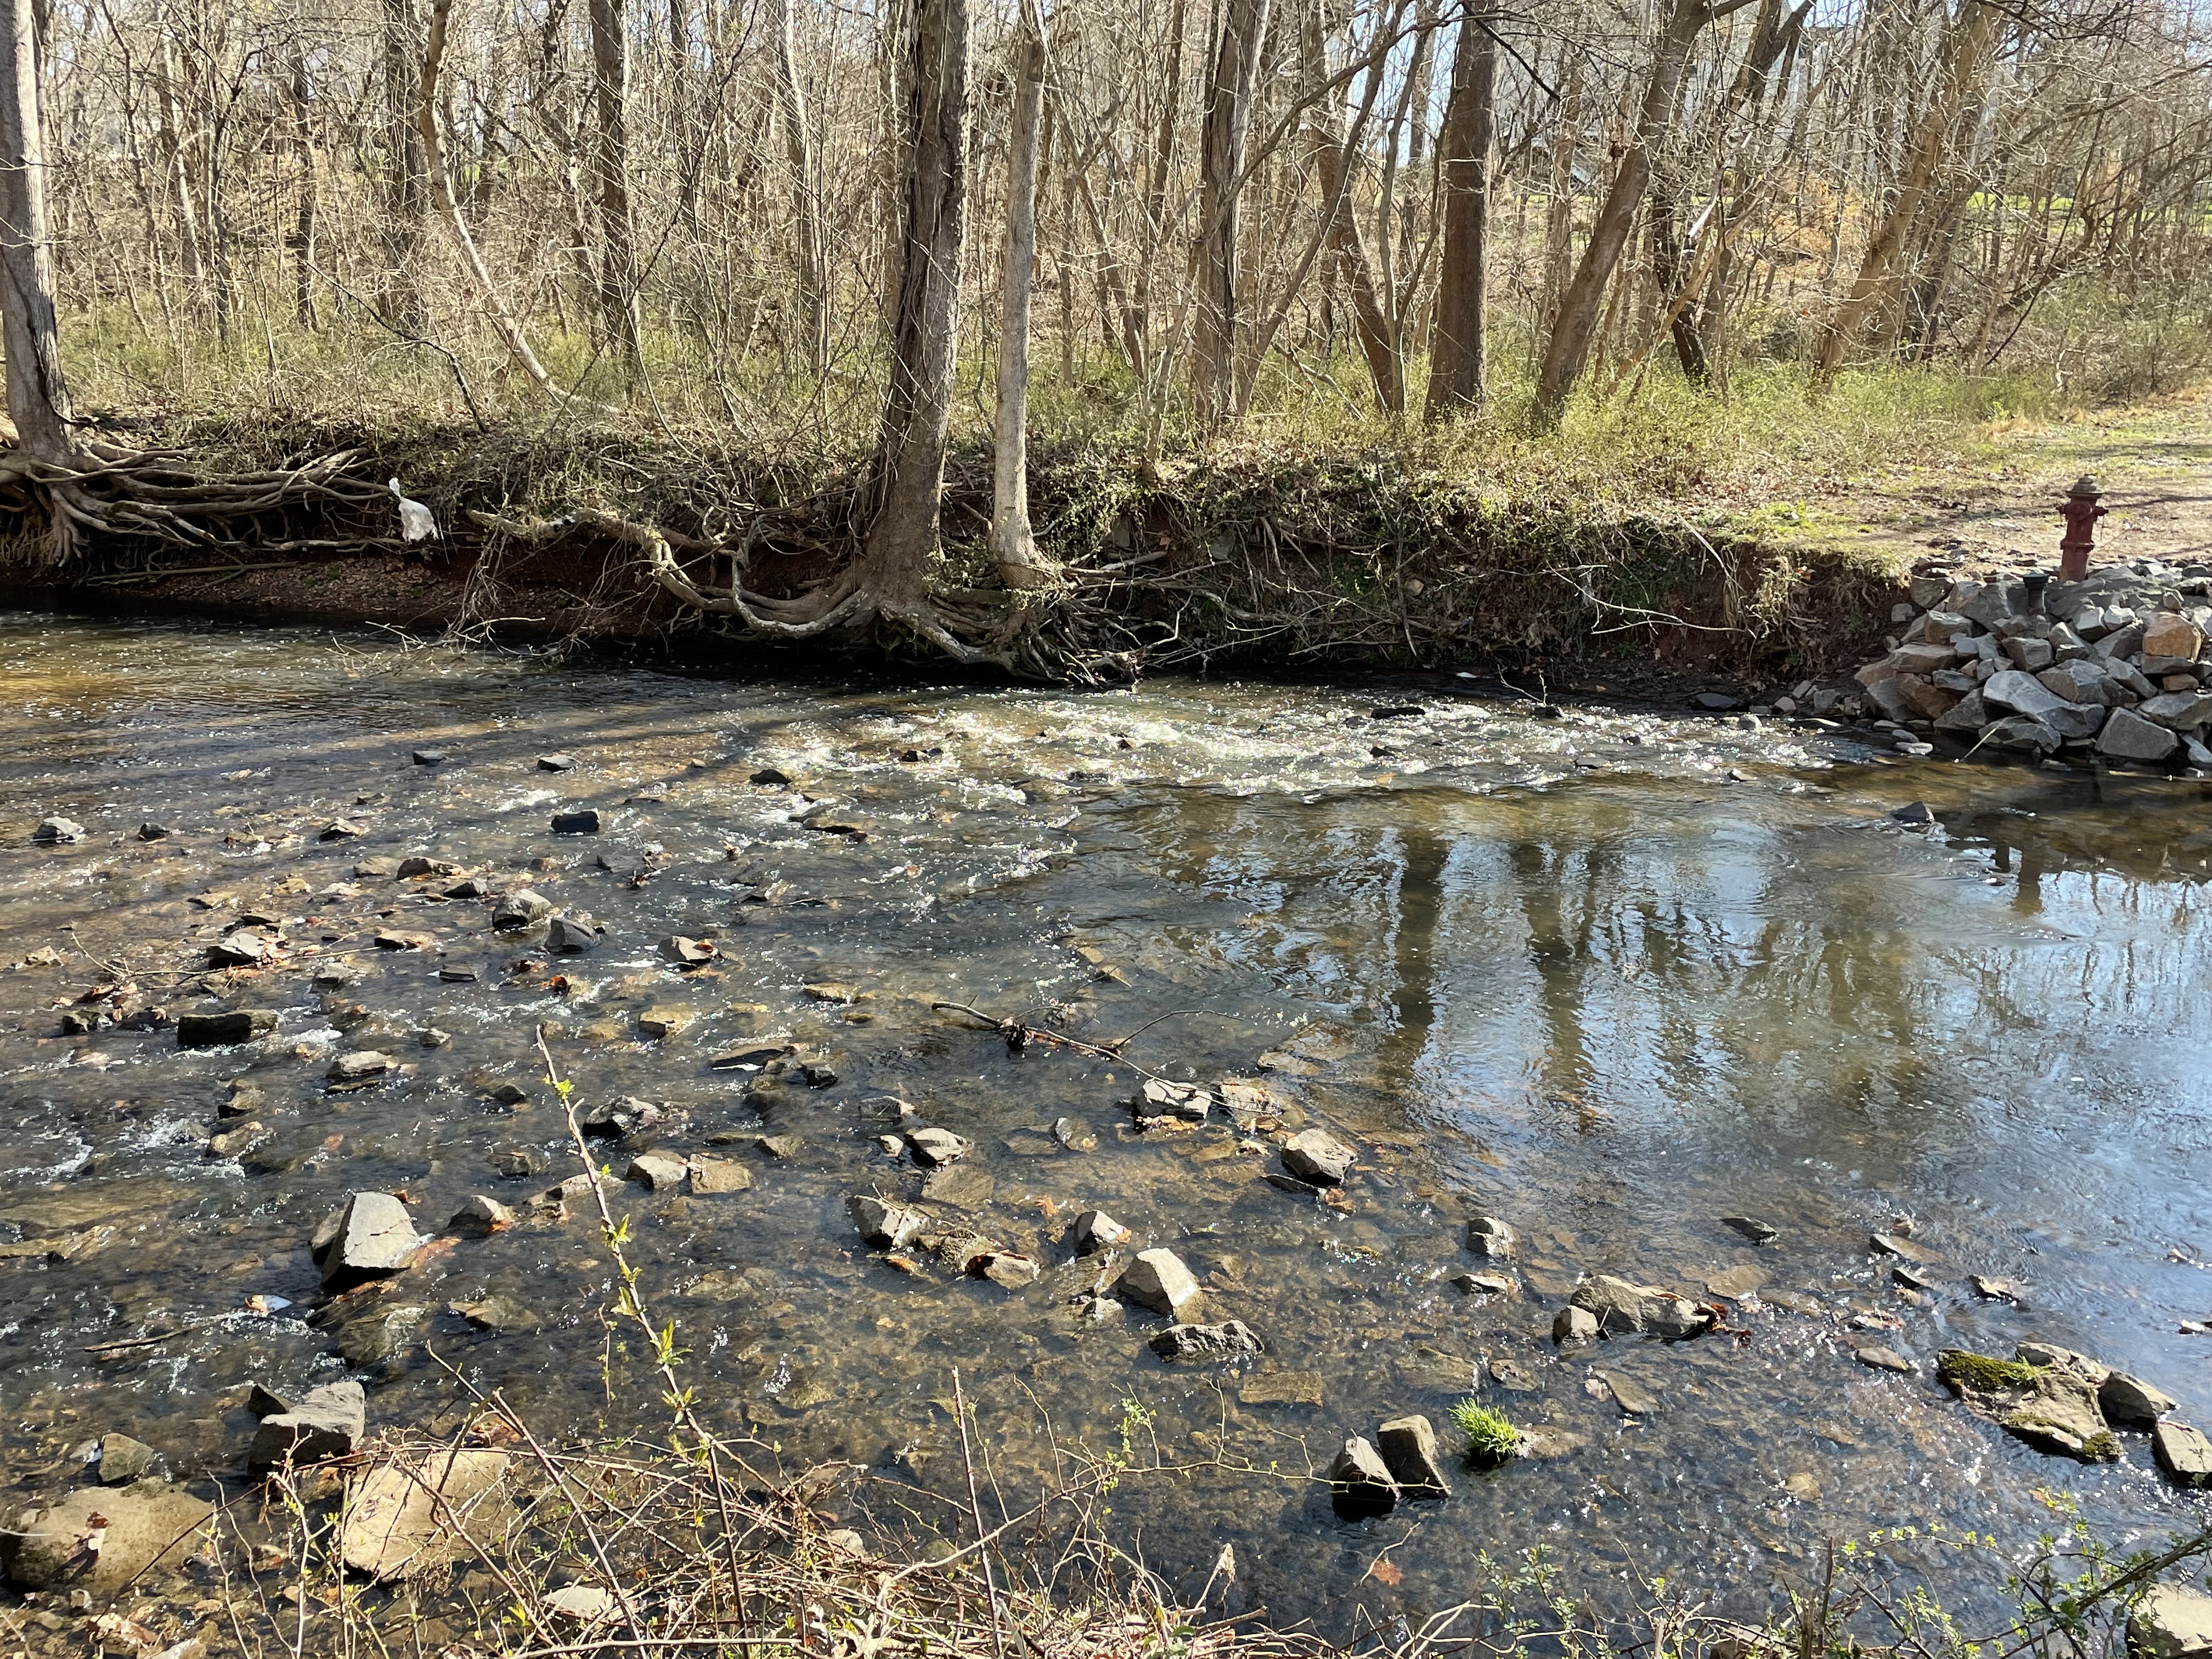
We didn’t only encounter 200 Ma lake sediments along Sugarland run; this photo shows a fire hydrant and a road that has been eroded by recent erosion. Apparently, someone wanted to keep the hydrant because the bank has been stabilized with blocks of riprap. Note the rounded, angular boulders lining the creek bed. They were eroded from the nearby cliffs.

The stream bed is defined by periodic rapids (see above photo) and pools of quiet water, as seen in this image. The flood plain is a couple hundred yards across here and the creek is meandering in soft sediments. The underlying rock is not uniform, which leads to this alternating pattern.

This photo shows the thin-bedded coarser sediments (upper left) at the top of the section.
The thick-bedded sediment in the lower section can be seen in this image to consist of both cross-bedded layers (lower right) and massive beds (just above the center and left-lower). This variability could be due to thin layers of mud, which weathers easily distributed irregularly when the sediments were deposited; or the thick layers could be channel deposits, for example. This kind of variation at the outcrop-scale suggests a dynamic environment; a likely scenario is rapidly changing channels at a delta where a stream originally entered a lake. These channels can change during a single flow event (e.g. a heavy rain) or every few years.
Many of the processes recorded in these rocks are at work today. This image was taken from a gravel point bar, looking upstream. The gravel clasts were rounded and probably were transported many miles from upstream, in the recent past. They are not from the original sediment, but were broken loose from exposed rocks within the last few million years and transported to this location. Note the large, fallen tree forming a temporary dam in the upper part of the image.

Because of the obstruction seen in the previous photo, flow and sediment delivery downstream is reduced temporarily (until the tree rots and collapses). The creek bed is exposed, showing multiple channels that predate the obstruction. Creeks never follow a single channel like a canal. Sugarland Run is a braided creek at this locality. This morphology is dynamic because of high sediment load and can change rapidly, unlike a more stable anastomosing river. The Potomac is an example of the latter. Of course, a river can change character in different sections of its channel, which we’ll see in my next post.

Much of Sugarland Run’s banks are deeply eroded, reflecting rapid erosion because of regional uplift. The previous image shows this on the east (right) bank. However, erosion and deposition in braided streams occurs at many time and space scales. This photo shows erosion of the stream bed on very short time and spatial scales, probably in response to the reduced sediment flow caused by the fallen tree obstructing sediment more than water.

At the end of our walk we met Algonkian Parkway, where the Balls Bluff sandy sediments have been removed (or were absent to begin with), creating a wide flood plain near a point where another creek joins Sugarland run (not shown). This major boulevard follows a natural rise to the south, the dividing point between highlands and the ancient flood plain of the Potomac River.
Today’s walk followed a braided stream about a mile between ridges supported by sandy sediments that were deposited about 200 Ma in lakes, when the supercontinent Pangaea began to split apart. It is very likely that this stream is following an ancient fault zone associated with that event. The orientation of these rocks and their lack of folding supports the inference that this area was being stretched and the rocks, which were still buried many miles beneath the surface, fractured to accommodate the crustal extension. In fact, intrusive rocks cut through the Balls Bluff sediments elsewhere in the area.
The sedimentary processes occurring along Sugarland Run today are not that different from when these sediments were first deposited in lakes more than 200 my ago. There is one critical difference in their depositional regimes, however; this region is experiencing uplift today whereas this was a sinking basin when Pangaea was torn asunder. Consequently, the original sediments were fine-grained, eroding from distant mountains whereas the gravel and boulder seen today is the crumbling remains of those ancient sediments.
We’ll see what happens when Sugarland Run reaches the Potomac next time …

.jpg)
Recent Comments