Marine Regression in the Tertiary
It was a beautiful day to go to the beach, so we joined our neighbors on the foreshore. We headed SE along the coast, looking for some cliffs that we read about. We found them a half-hour drive from home. The geology that will be presented in this post has been discussed knowledgeably on weekendgeology.com, which I recommend because I’m limiting my comments to only what I’ve seen with my own eyes.
 Fig. 1
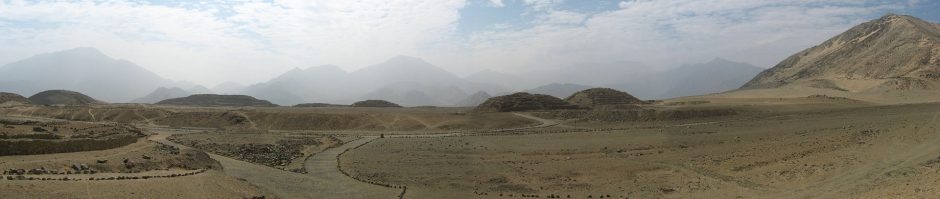
It was a nice day for a drive along the coast. The bicyclists were out in droves but traffic was light and we made good time, finally arriving in the coastal town of Bayside, which overlooks the Southern Ocean from cliffs about 100 feet in height (field estimate). Figure 2 looks out on Beaumaris Bay/Half Moon Bay.
 Fig. 2
At the bottom of a paved path, we found a sandy beach filled with sun seekers. It was a well-sorted medium quartz sand (field estimate) with shell fragments in the swash zone, with dark, fine-grained sedimentary rocks exposed during low tide (Fig. 3).
 Fig. 3
According to weekendgeology, these rocks have been dated using fossils to about 10 million years ago (MYA), which is within the Upper Miocene epoch. They looked pretty horizontal at this point. Turning around, to face the cliff, we discovered that they are conformably overlain by a reddish sandstone that gives the location its name (Fig. 4).
 Fig. 4
The contact is weathering faster than either of the two lithologies in Fig. 4, a pattern not repeated in a slightly different location (Fig. 5).
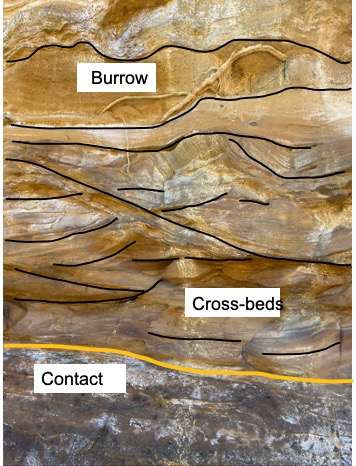 Fig. 5
The upper, yellow-reddish lithology is younger and there is no unconformity between them, so it’s only a little younger. Fossils within it have been used to place it within the late Miocene/early Pliocene (~5 MYA). A burrow is visible at the top of the photo. A trace fossil like this can be used to identify depositional environment and even age (roughly). This burrow was created by a worm of some kind, probably marine. The cross-bedding is typical for a nearshore marine setting, where waves are present but not dominant. This was not part of a submarine bar or a river, but an area influenced by both waves and steady currents. Possibly a sand bar in a river mouth.
The structures in Fig. 5 suggest that the sediment was being constantly reworked, possibly by tides and episodic flooding from a river. For example, Fig. 6 reveals irregular cross-beds that suggest more uniform transport to the left. But they do not occur in sets, only as individual beds, as if sediment were moving across the area briefly, followed by a quiet period.
 Fig. 6
Slumps of semi-firm sandy mud are outlined in Fig. 6 immediately above the primary color transition from green (marine) to reddish (terrigenous). The contact does not represent a sudden change over time but rather a horizontal shift; probably from a quiet, possibly lagoon, area represented by the green; to a more open channel flow where the river actually met the sea. Note the greenish areas in the younger rocks. Color in rocks has to be treated with caution, especially at scales less than the thickness of a major bed.
I’ve mentioned diagenesis several times in this blog. As sediments are buried slowly, over millions of years, and heated, the complex organic molecules they contain are slowly cooked. It’s like breaking down crude oil in a refinery; gunk goes in, and a variety of products come out at different stages of heating and pressure. Except, diagenesis isn’t as controlled, so the gunk produces byproducts of the diagenetic process intermittently and irregularly. The red-green color differentiation of terrestrial-marine sediments is like that. Red is due to oxidized iron and green is caused by reduced iron.
There’s a simple rule: red is land and green is sea. But it only works at large scale. When I first looked at the younger (red) rocks in Fig. 6, I assumed they were terrestrial, deposited in rivers. What probably happened is that sediment was deposited in a river delta, with sand spits, bars, and other transitional sand bodies.
Let’s return briefly to the slightly older “green” fine-sand sediments from ~10 MYA. They contained irregularly distributed, sub-round hollows where a dark inclusion may have existed (Fig. 7).
 Fig. 7
This is not a fossil, but a remnant of the irregular diagenetic chemical processes I alluded to above. They are very similar in origin to the concretions that we saw in an earlier trip. They are not like the burrow seen in Fig. 5.
Let’s estimate how fast sediment was accumulating here about 5 MYA. That’s not so easy to do because we’re not working with millions of years in this example; nevertheless, let us attempt to see what kind of depositional environment we’re looking at. First we observe that Fig. 6 is about 2 m (we’re using SI units now) in height. To constrain our estimate, let’s use a sedimentation rate of 2 mm/yr like before to calculate how much sediment would accumulate in a million years. We multiply 0.002 m/y and one million years, to find that a steady depositional rate of 2 mm/y would have produced 2 km of sediment. Obviously, that didn’t work. We’re looking at 2 m of sediment, so let’s estimate the apparent sedimentation rate using observations (treating the given ages of the rocks as observations because of the complex radiometric methodology used to constrain the geologic time scale), rather than guesses. We divide 2 m by 1 million years to estimate that (overall) there was very little sedimentation occurring (0.002 mm/y). A meaningless estimate for a geological process.
I alluded to accommodation space in previous posts. There doesn’t appear to have been much in this area about 5 million years ago. What was happening?
There was a lot of sediment available, as shown by the slumping sediments in Fig. 6. We get a clue from the lowest part of the exposure (Fig.8), near the contact with the reddish sediments in Figs. 4-6. The sunglasses (for scale) show that gravel particles (>2 mm in diameter) were sparsely mixed with fine sand. Note that the large grains in Fig. 8 are what is called sub-angular to sub-round in shape. These particles travelled along a river bed for less than 100 miles (wild guess); the point is that the source rock for these grains wasn’t hundreds or thousands of miles distant. There were mountains near the field site 5 MYA.
 Fig. 8
It isn’t just that there were mountains. This is a lot more complex than a developing foreland basin…no way…Australia was separating from Antarctica (according to current thinking) during the Tertiary period (Fig. 9).
 Fig. 9
Note that this map is dated at 94 MYA; the reason for including this model result is to show that Australia, Victoria to be specific, was moving away from other land masses (to the NW in the image) and there was no regional compression, like during the Paleozoic.
The sandy matrix seen throughout these rocks is consistent with the reworking of quartz-rich sediment for millions of years. However, Fig. 8 suggests that a new source of angular gravel was available in small amounts intermittently. There was uplift and erosion of rocks containing either igneous (plutonic) rocks or sediments deposited near a source in antiquity (e.g. during the Paleozoic). This probably occurred during isostatic adjustment, which would explain the low sedimentation rate we estimated.
Before addressing this question, I’d like to return to the rocks. Figure 10 is included in this post to make my point that stratigraphers deal with rocks at the scale of ten’s of meters but sedimentologists and geochemists are forced to get closer to the action.
 Fig. 10
I have nothing in particular to say about Fig. 10, other than this is an example of remineralization at small scale (image size is ~3 inches), which impacts observations at larger scales. Enough said. I debated whether or not to annotate Fig. 11…no reason to.
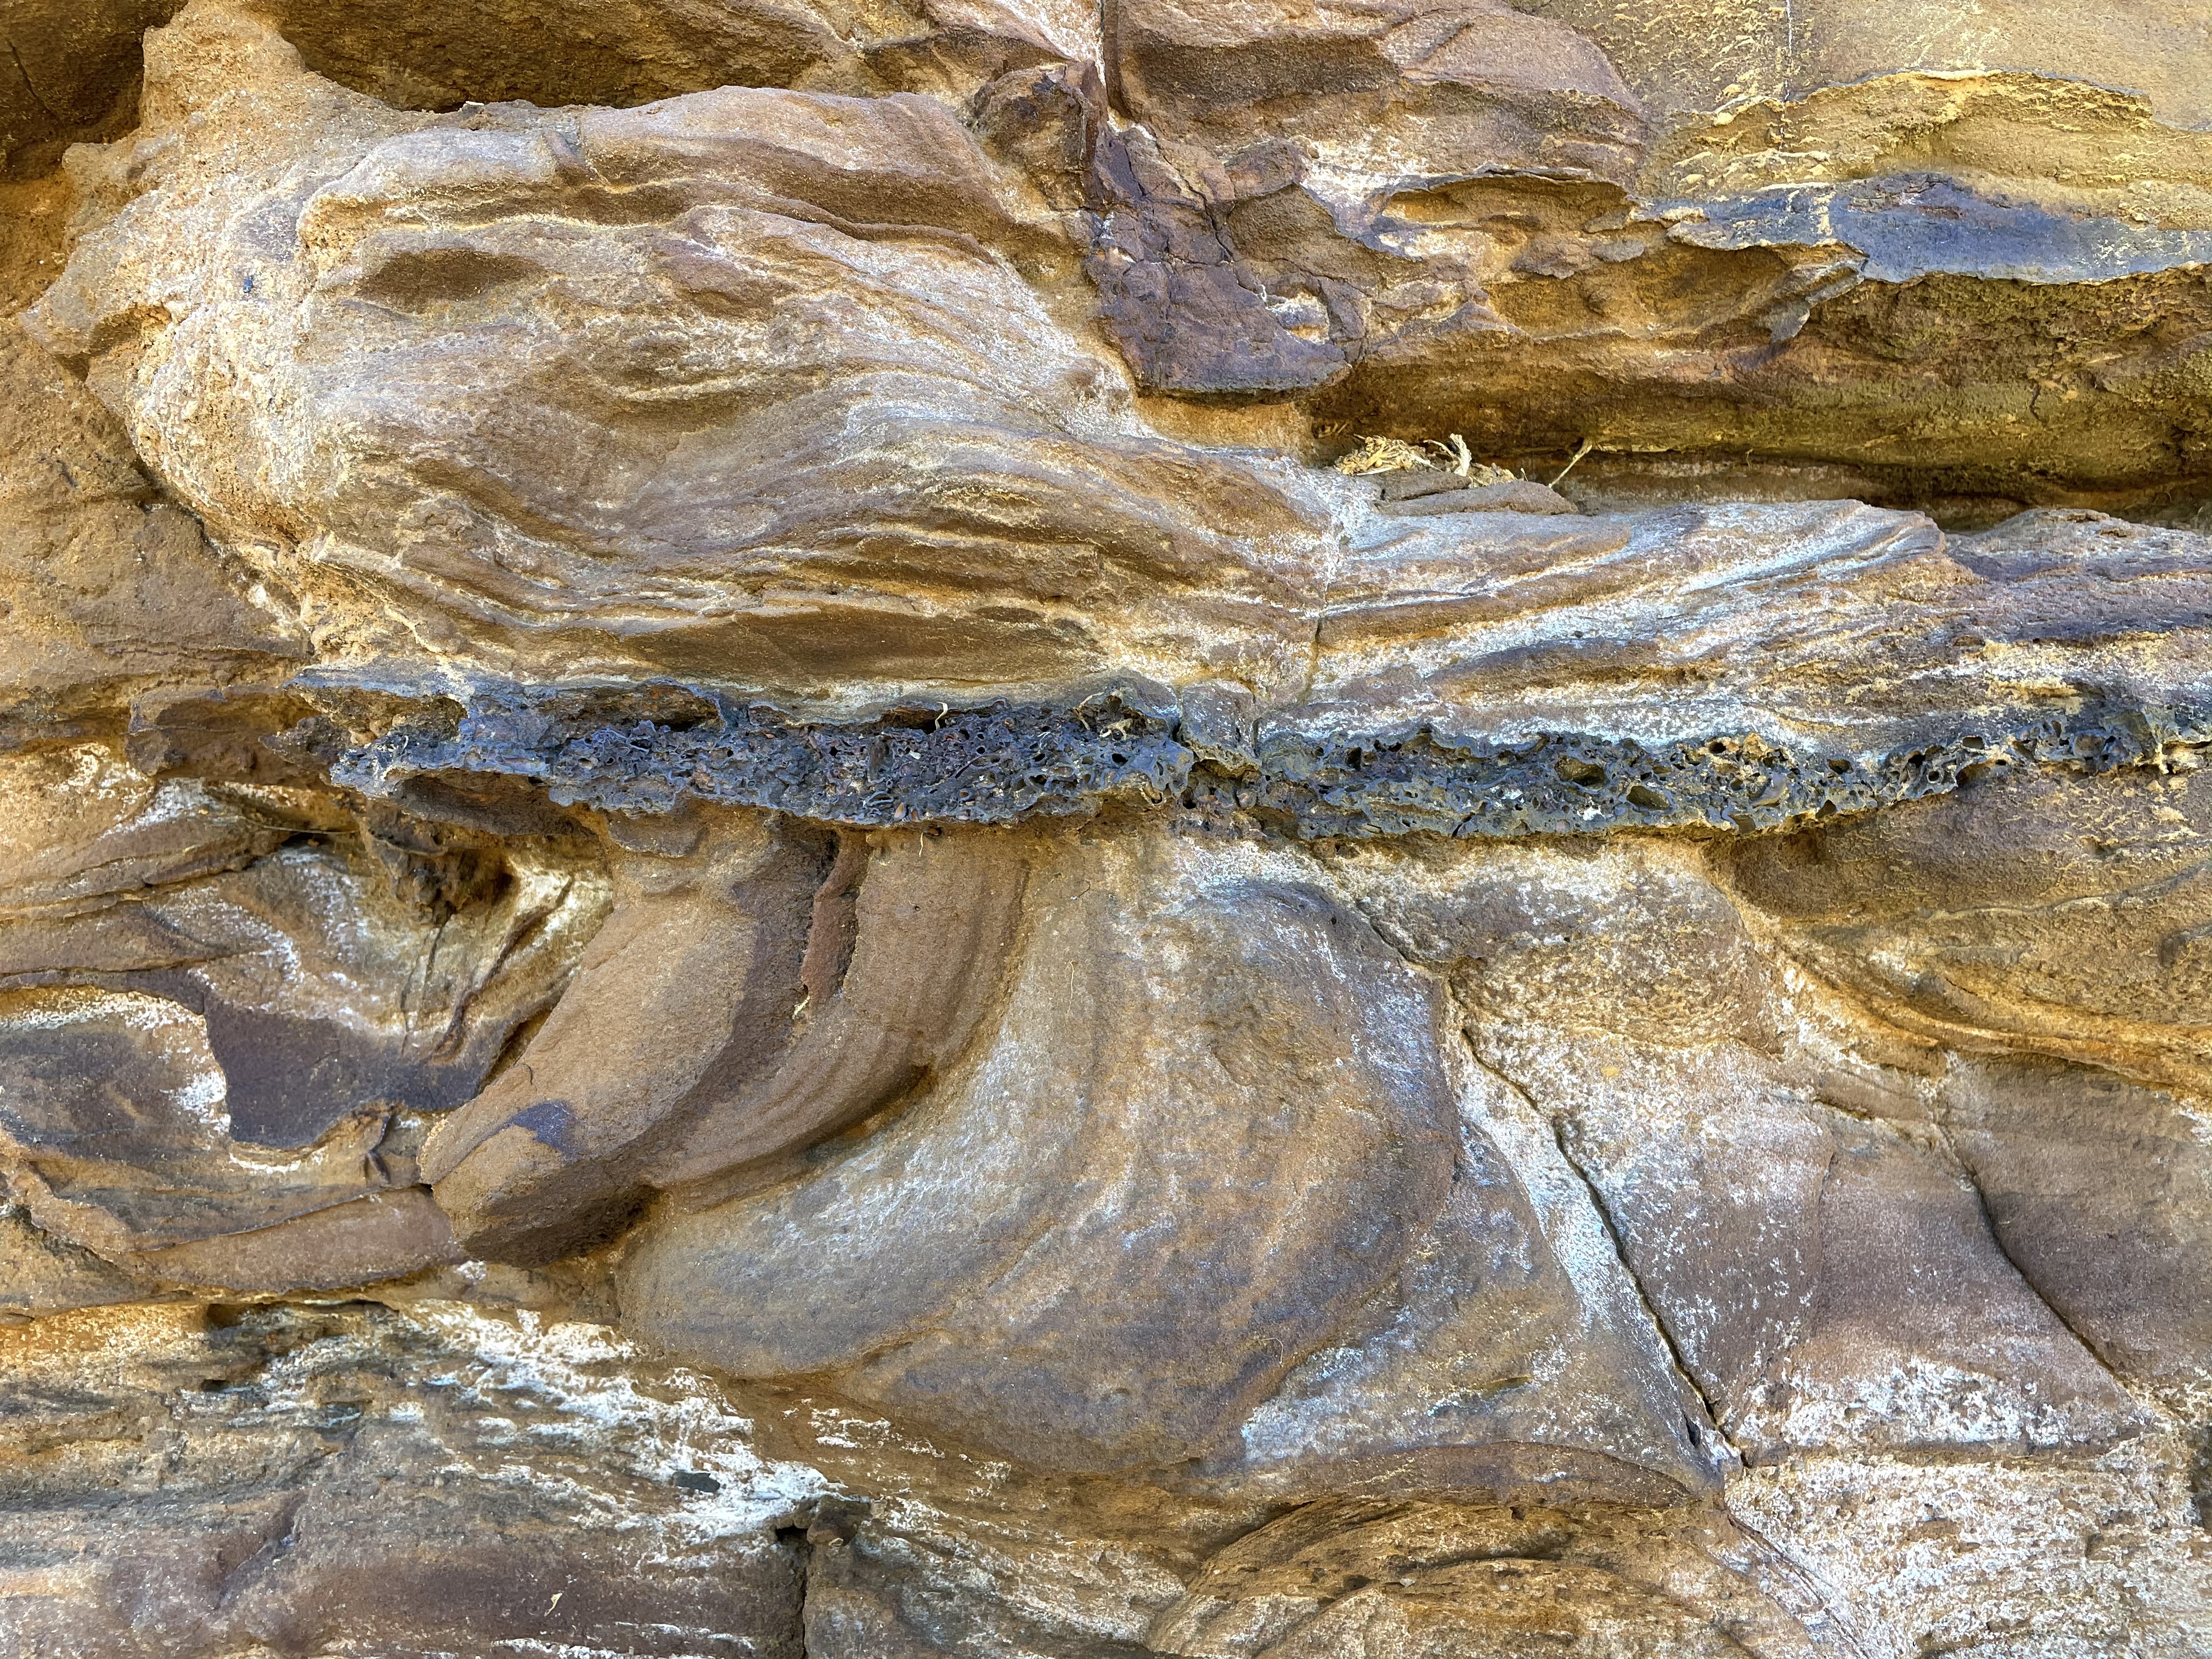 Fig. 11
The image size is less than 3 feet. These sediments were deposited during the change in location of the river mouth. The black layer that truncates cross-bedded sediments below and is overlain by them above, was an anomaly. A quiet period maybe. I have to look closer however.
 Fig. 12
These are trace fossils. The worms went crazy for a few years (maybe only months), burrowing and eating everything organic within this dark layer. They didn’t make it (at least not here), but that’s life. Spatiotemporal adjustment. The depositional environment became firmly planted in the terrestrial sphere (removed from the ocean) with no more quiet water, by the time poorly cemented and poorly sorted sands were deposited.
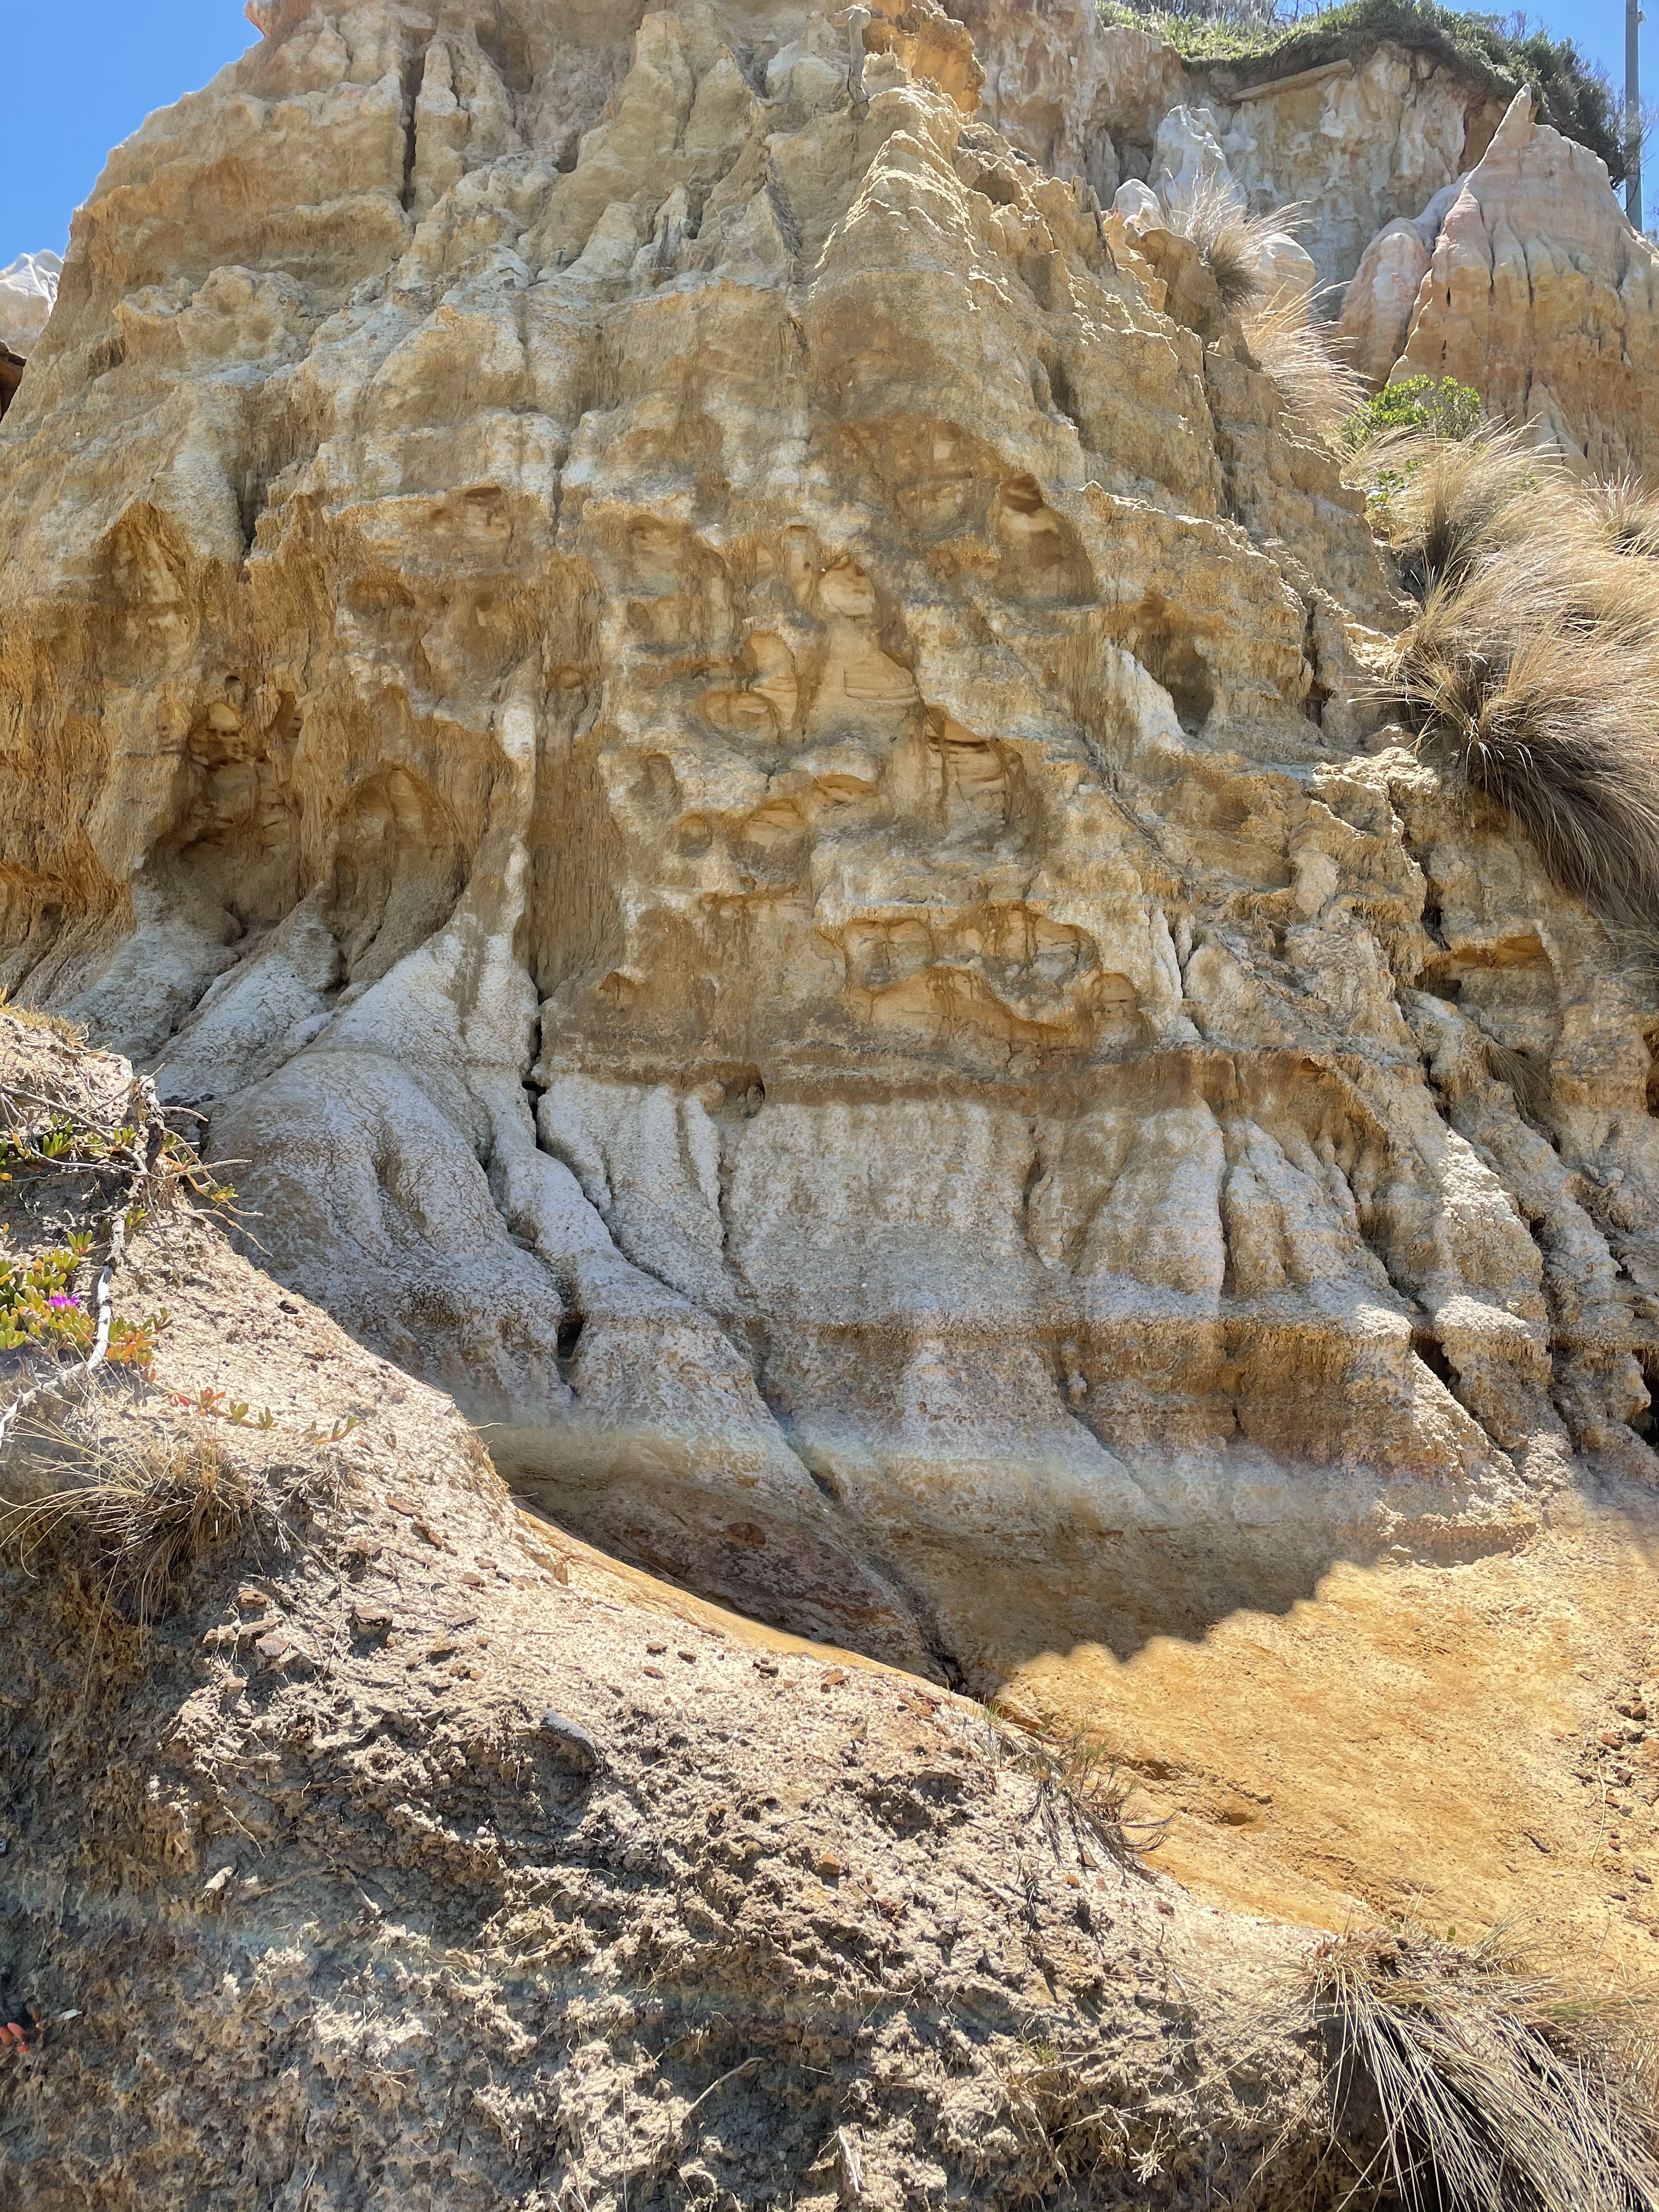 Fig. 13
Figure 13 shows the thick layer of weak sandstone that supports the bluffs, and mostly produces steep slopes. Here, at Half Moon Bay, they are a little stronger. The white layer could be nothing more than salt being concentrated during burial. They are the same rocks. But, what do they look like?
 Fig. 14
Figure 14 shows the contact with the nearshore marine sediments we’ve been examining. Obviously, this is a different depositional environment. Guessing, I’d say it was already arid, from the white deposits (salt is the most common of a few white chemical deposits, whether depositional or diagenetic), but there were flood events, just as several million years earlier.
 Fig. 15
Compare Figs. 15 and Fig. 8 to see that this region (probably a delta near a source of sediment, i.e. mountains) was in dynamic equilibrium for several million years; sometimes there was more coarse sediment (from an unidentified source), but one has to ask: Why are the sediments so poorly mixed and the coarse grains showing no layering?
 Fig. 16
Figure 16 was taken from the same area as Fig. 15, but from a greater distance. The image is about 3 feet high. It has been marked up to show the general lineation of the angular gravel deposits. The lines are not meant to imply a clear bedding; not by any means, but they are real because diagenesis does not recrystallize silica into new crystals at the shallow burial depths these rocks have seen (maybe 5 km?). I have seen exactly the same distribution of coarse fragments in a sand matrix in both rocks and recent fluvial sediments. Each marked line in Fig. 16 indicates a weak episodic depositional event, strong enough to move some gravel around but not sufficient to form cross-bedding. Nevertheless, the (admittedly crude) analysis suggests that flow to the left (i.e. river transport) was important.
We made one more stop on our field trip into the Tertiary, another cove within Half Moon Bay. We had hoped to follow an unimproved path down to the shore, examining beds rich in fossils; but our plans had to be modified when we found the path closed because people had been destroying the cliff in a search for the very fossils that made it a treasure trove of life here 5-10 MYA. We drove further south (the dark-blue dot in Fig. 1) and hiked along a path as far as we could. Figure 17 shows the beach here.
 Fig. 17
This particular cove, for oceanographic reasons (e.g. waves and coastal currents) collects seaweed from throughout the eastern shores of Half Moon Bay. There was a sign announcing a project to “save” the shore from what is probably its natural state. Fig. 17 reveals the cause of my cynical analysis; the pathetically small amount of sand deposited (at great cost) has not and cannot prevent the algae (dark area larger than the beach) from collecting. Some beaches are not meant for human occupation.
We came here to get a look at evidence of deformation after these Miocene/Pliocene rocks were deposited. Let’s start with Fig. 18,
 Fig. 18
Figure 18 has been marked-up with yellow lines indicating bedding surfaces estimated from along the coast (see the inset map). This is the stretch of coast that we couldn’t access because of the trail closure. To my eye, there is a low-amplitude anticline visible in these Tertiary rocks. The orientation of the compression that would have created such a feature (in modern coordinates) was apparently from the SW. Study the inset map, assuming that the anticline marked in Fig. 18 is approximately orthogonal to the coast seen in the inset.
As noted above, Victoria was not in a compressional stress regime after these sediments were deposited. Nevertheless, we cannot argue with the rocks. I’ll add here that a map of anticlines is consistent with our observations. There was mild compression in this area at about the same time as basalts were being created and flowing over the land to the west. We discussed those already.
The deformation seen in these rocks occurred less than 5 million years ago, when Australia was in a tensional tectonic regime, being dragged by upper mantle convection to the NW (see Fig. 9). I would propose that the mild fold seen in Fig. 18, and reported en mass,are nothing more than drape folds. These coastal/fluvial sediments were being buried suddenly, as the upper cliff sediments were deposited, probably during a period of volcanism that was sporadic in Victoria about a million years ago.
It’s all consistent, which is a critical criterion in any geological study. These rocks record a transition from shallow marine to deltaic and then to riverine, the transition having accelerated when the upper, poorly consolidated, sands were deposited. In My Opinion (IMO), this was the result of Australia being picked up by a mantle plume, which lifted this area and created a lot of volcanism. Half Moon Bay slid off the elevated mantle plume before the sediments, produced by erosion of isostatically uplifted granites, could properly lithify.
2 responses to “Marine Regression in the Tertiary”
Trackbacks / Pingbacks
- - January 13, 2021

All fascinating although over my head as a lay person! I hope you are enjoying your exploration in Australia ❤
LikeLike