The Olympic Peninsula: Quinault Rainforest to Cape Flattery
This is the first in what I hope will become a regular series of blogs from my travels around the Pacific Northwest (PNW) as well as trips throughout the world. This series accompanies my main blog, Rocks and (no) Roads, which reports on the geology of various places to which I travel. You could see I’m expanding my horizons; in addition to posting about general sights in this post, I will also be including environmental and ecological observations that are of interest to me. My background is in geology, but I’ve become aware of a lot more since moving to the PNW. So this is a learning experience, thanks in large part to the availability of expert assistance from CoPilot, Microsoft’s version of ChatGPT. I’ll be turning to it to identify plants and evidence of animal activity in future posts.
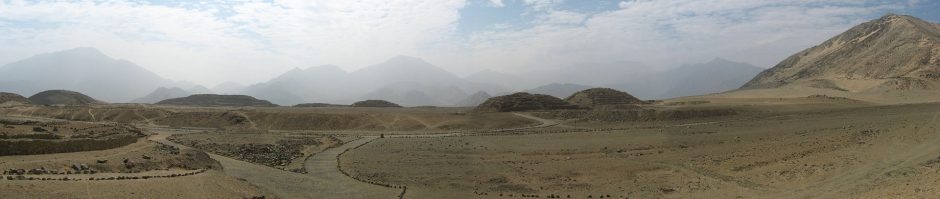
This is the base map I’ll be using in many of my posts from the PNW. The star indicates my base in Tacoma. Today’s post describes a two-day trip to circumnavigate the Olympic Peninsula. Although this area is the wettest in the contiguous United States, with annual rainfall up to twelve-feet, it was clear for the duration of my visit. The labeled areas indicate where the photos described below were taken.
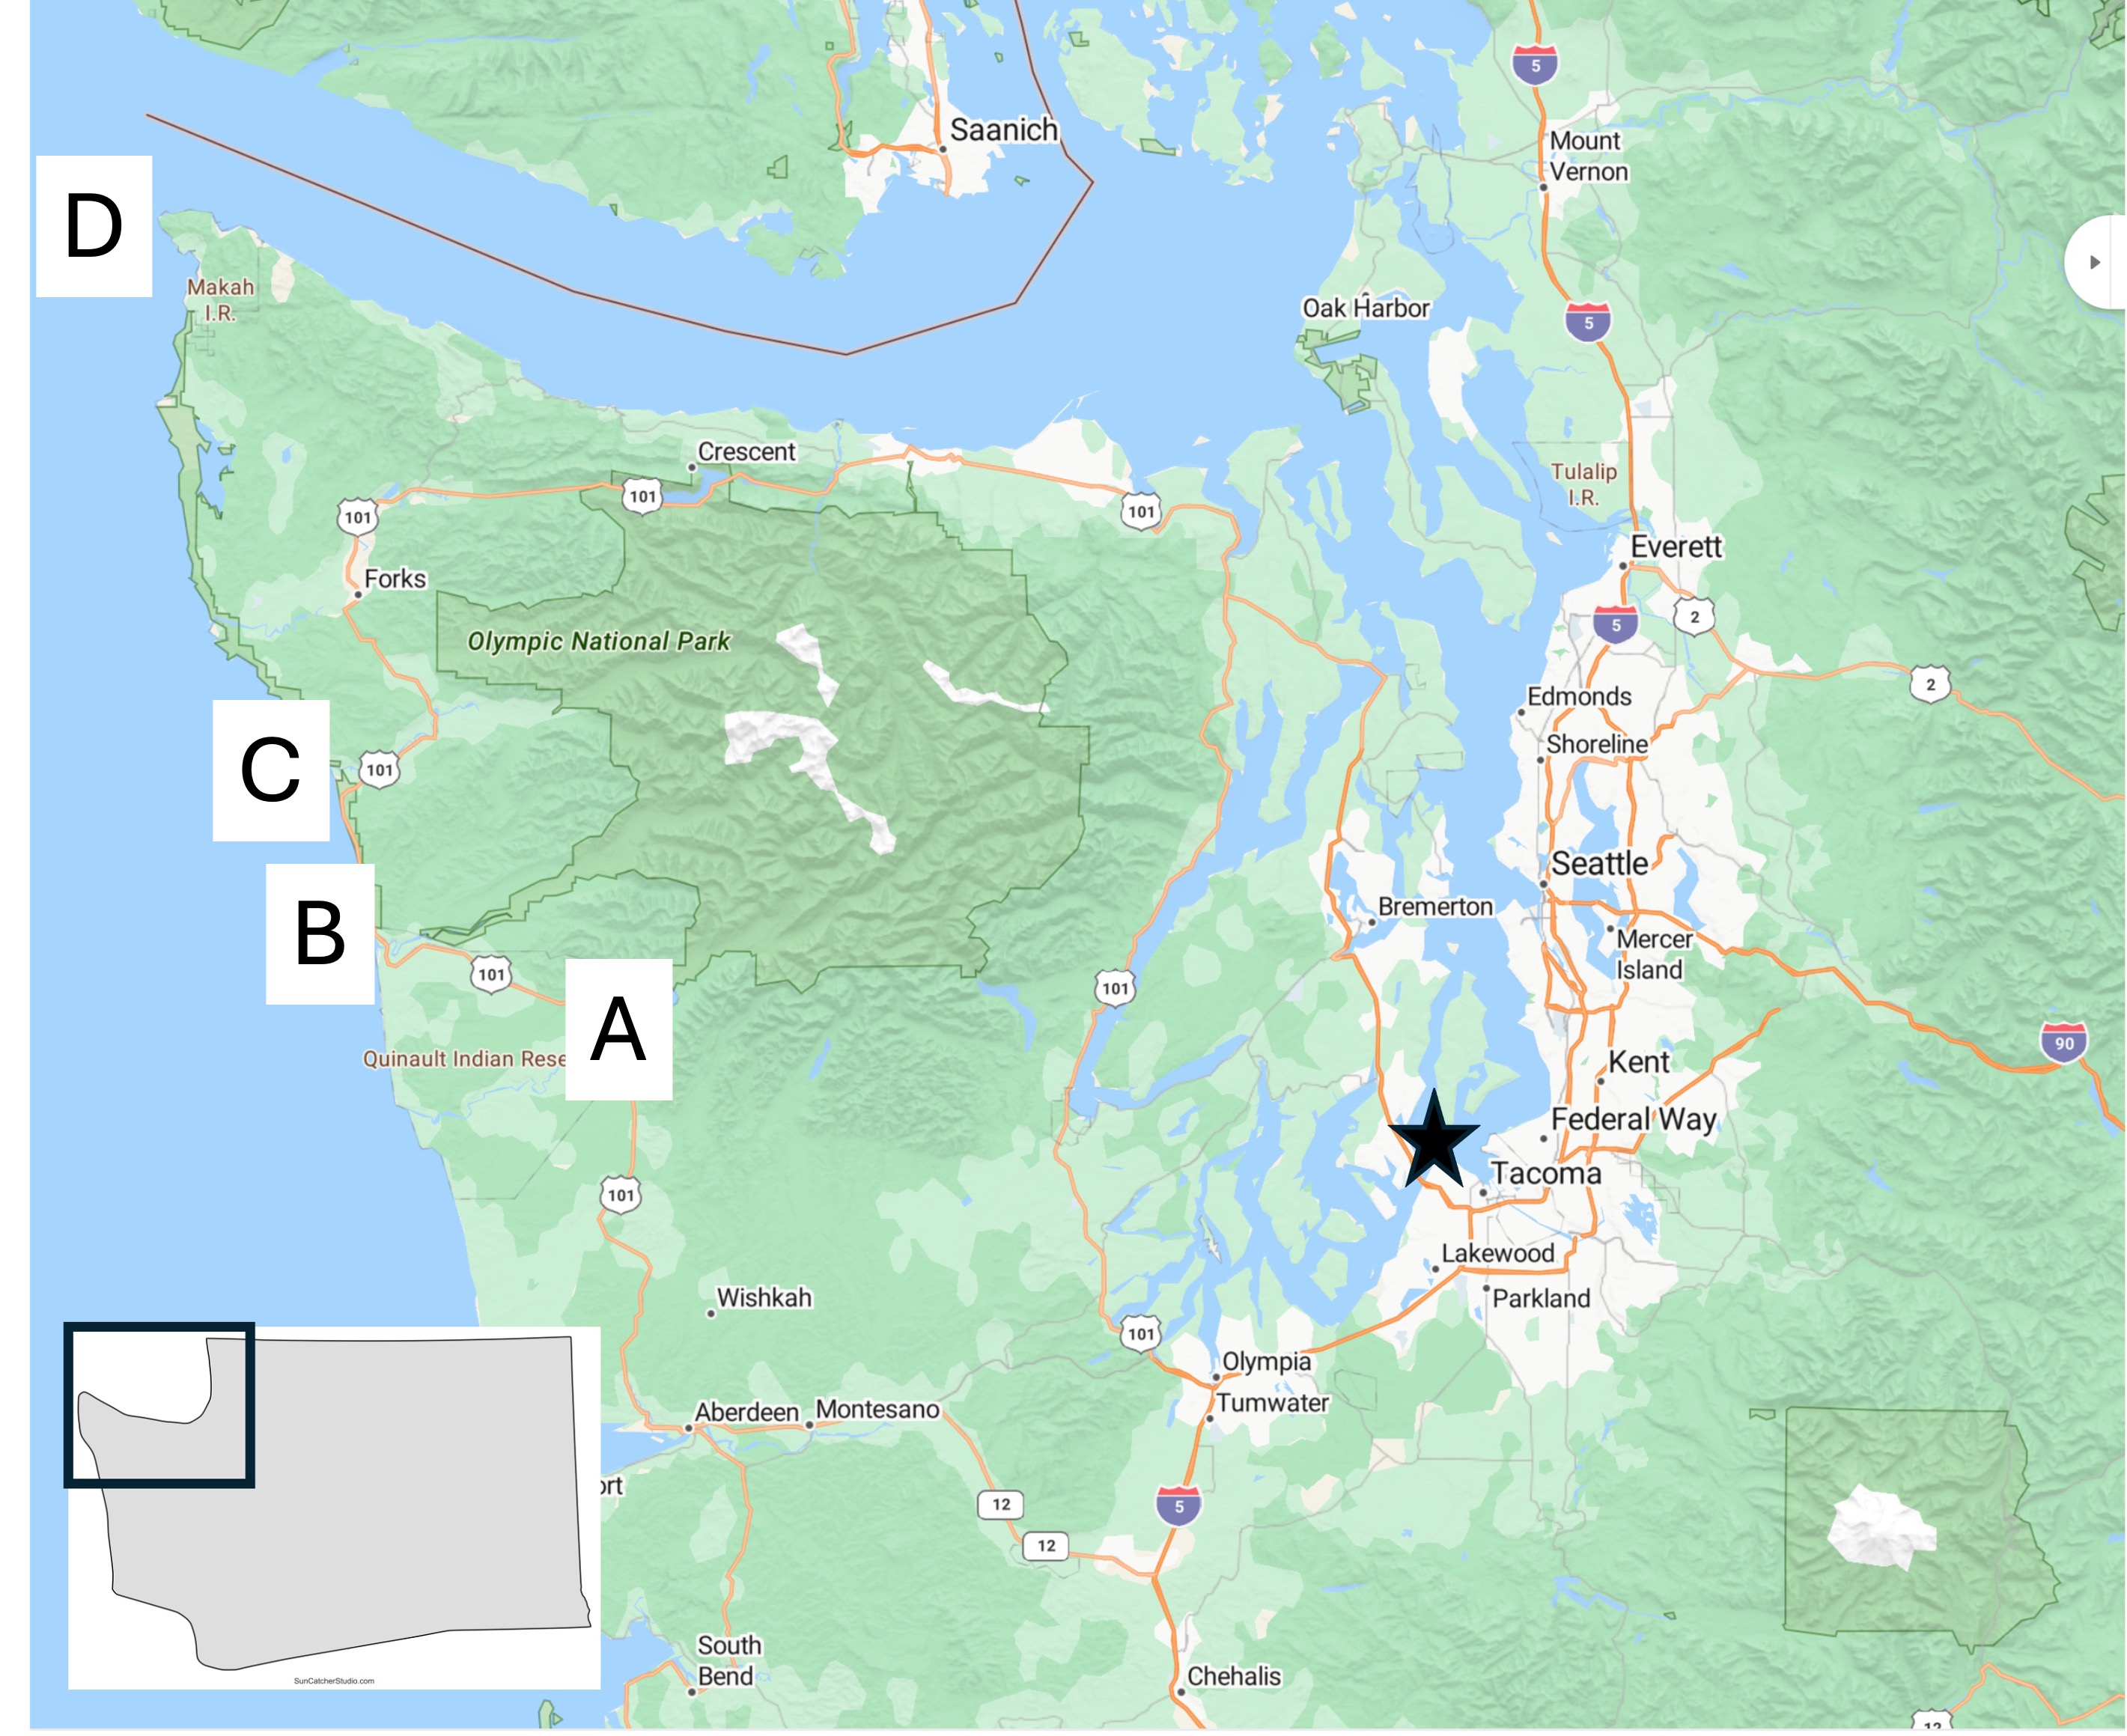
Location A: Quinault Rainforest. Photographs can’t do justice to the experience of being surrounded by a temperate rainforest. There are many trails of different lengths, but I followed a shorter one (about one mile) that followed Willaby Creek for a while before turning into the depths of the forest. This image shows the creek rushing by about 50 feet below the trail as it races to the south shore of Lake Quinault.
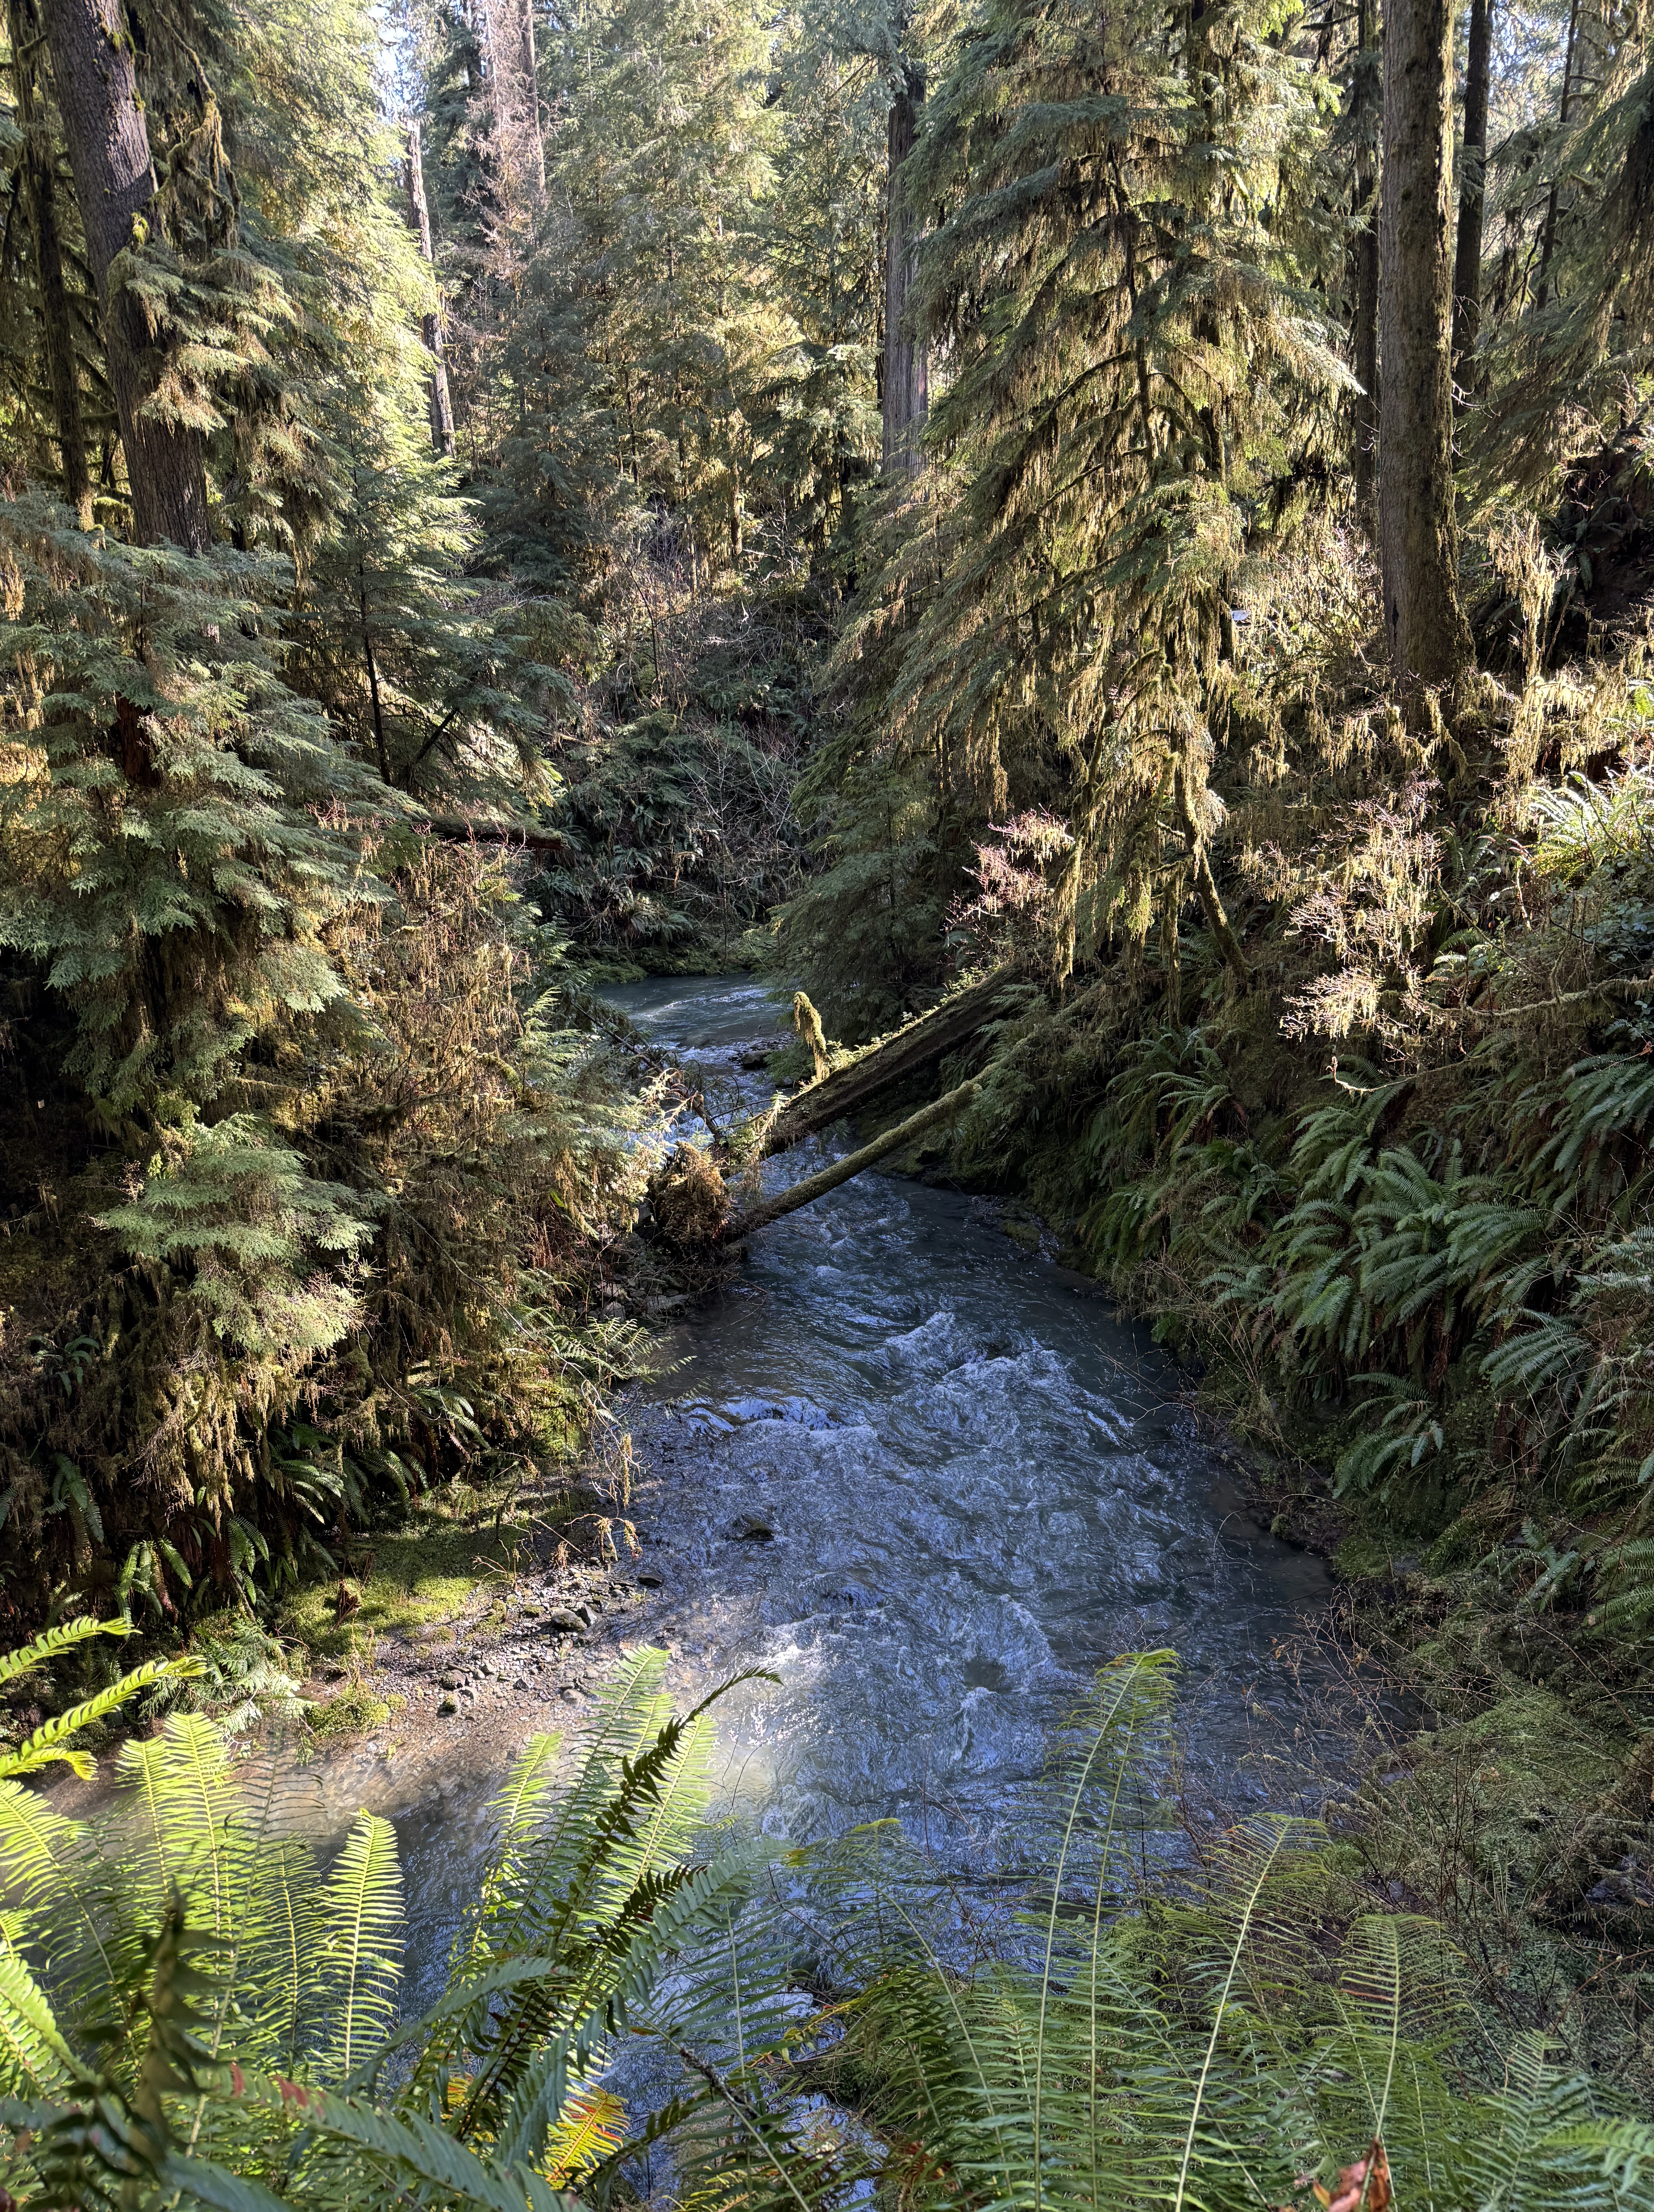
Location A: Quinault Rainforest. This rotted log is about six-feet in diameter. It is representative of the ongoing decay and rebirth of the forest. I’ll talk more about that in another post. Note the ferns growing out of the decaying wood.
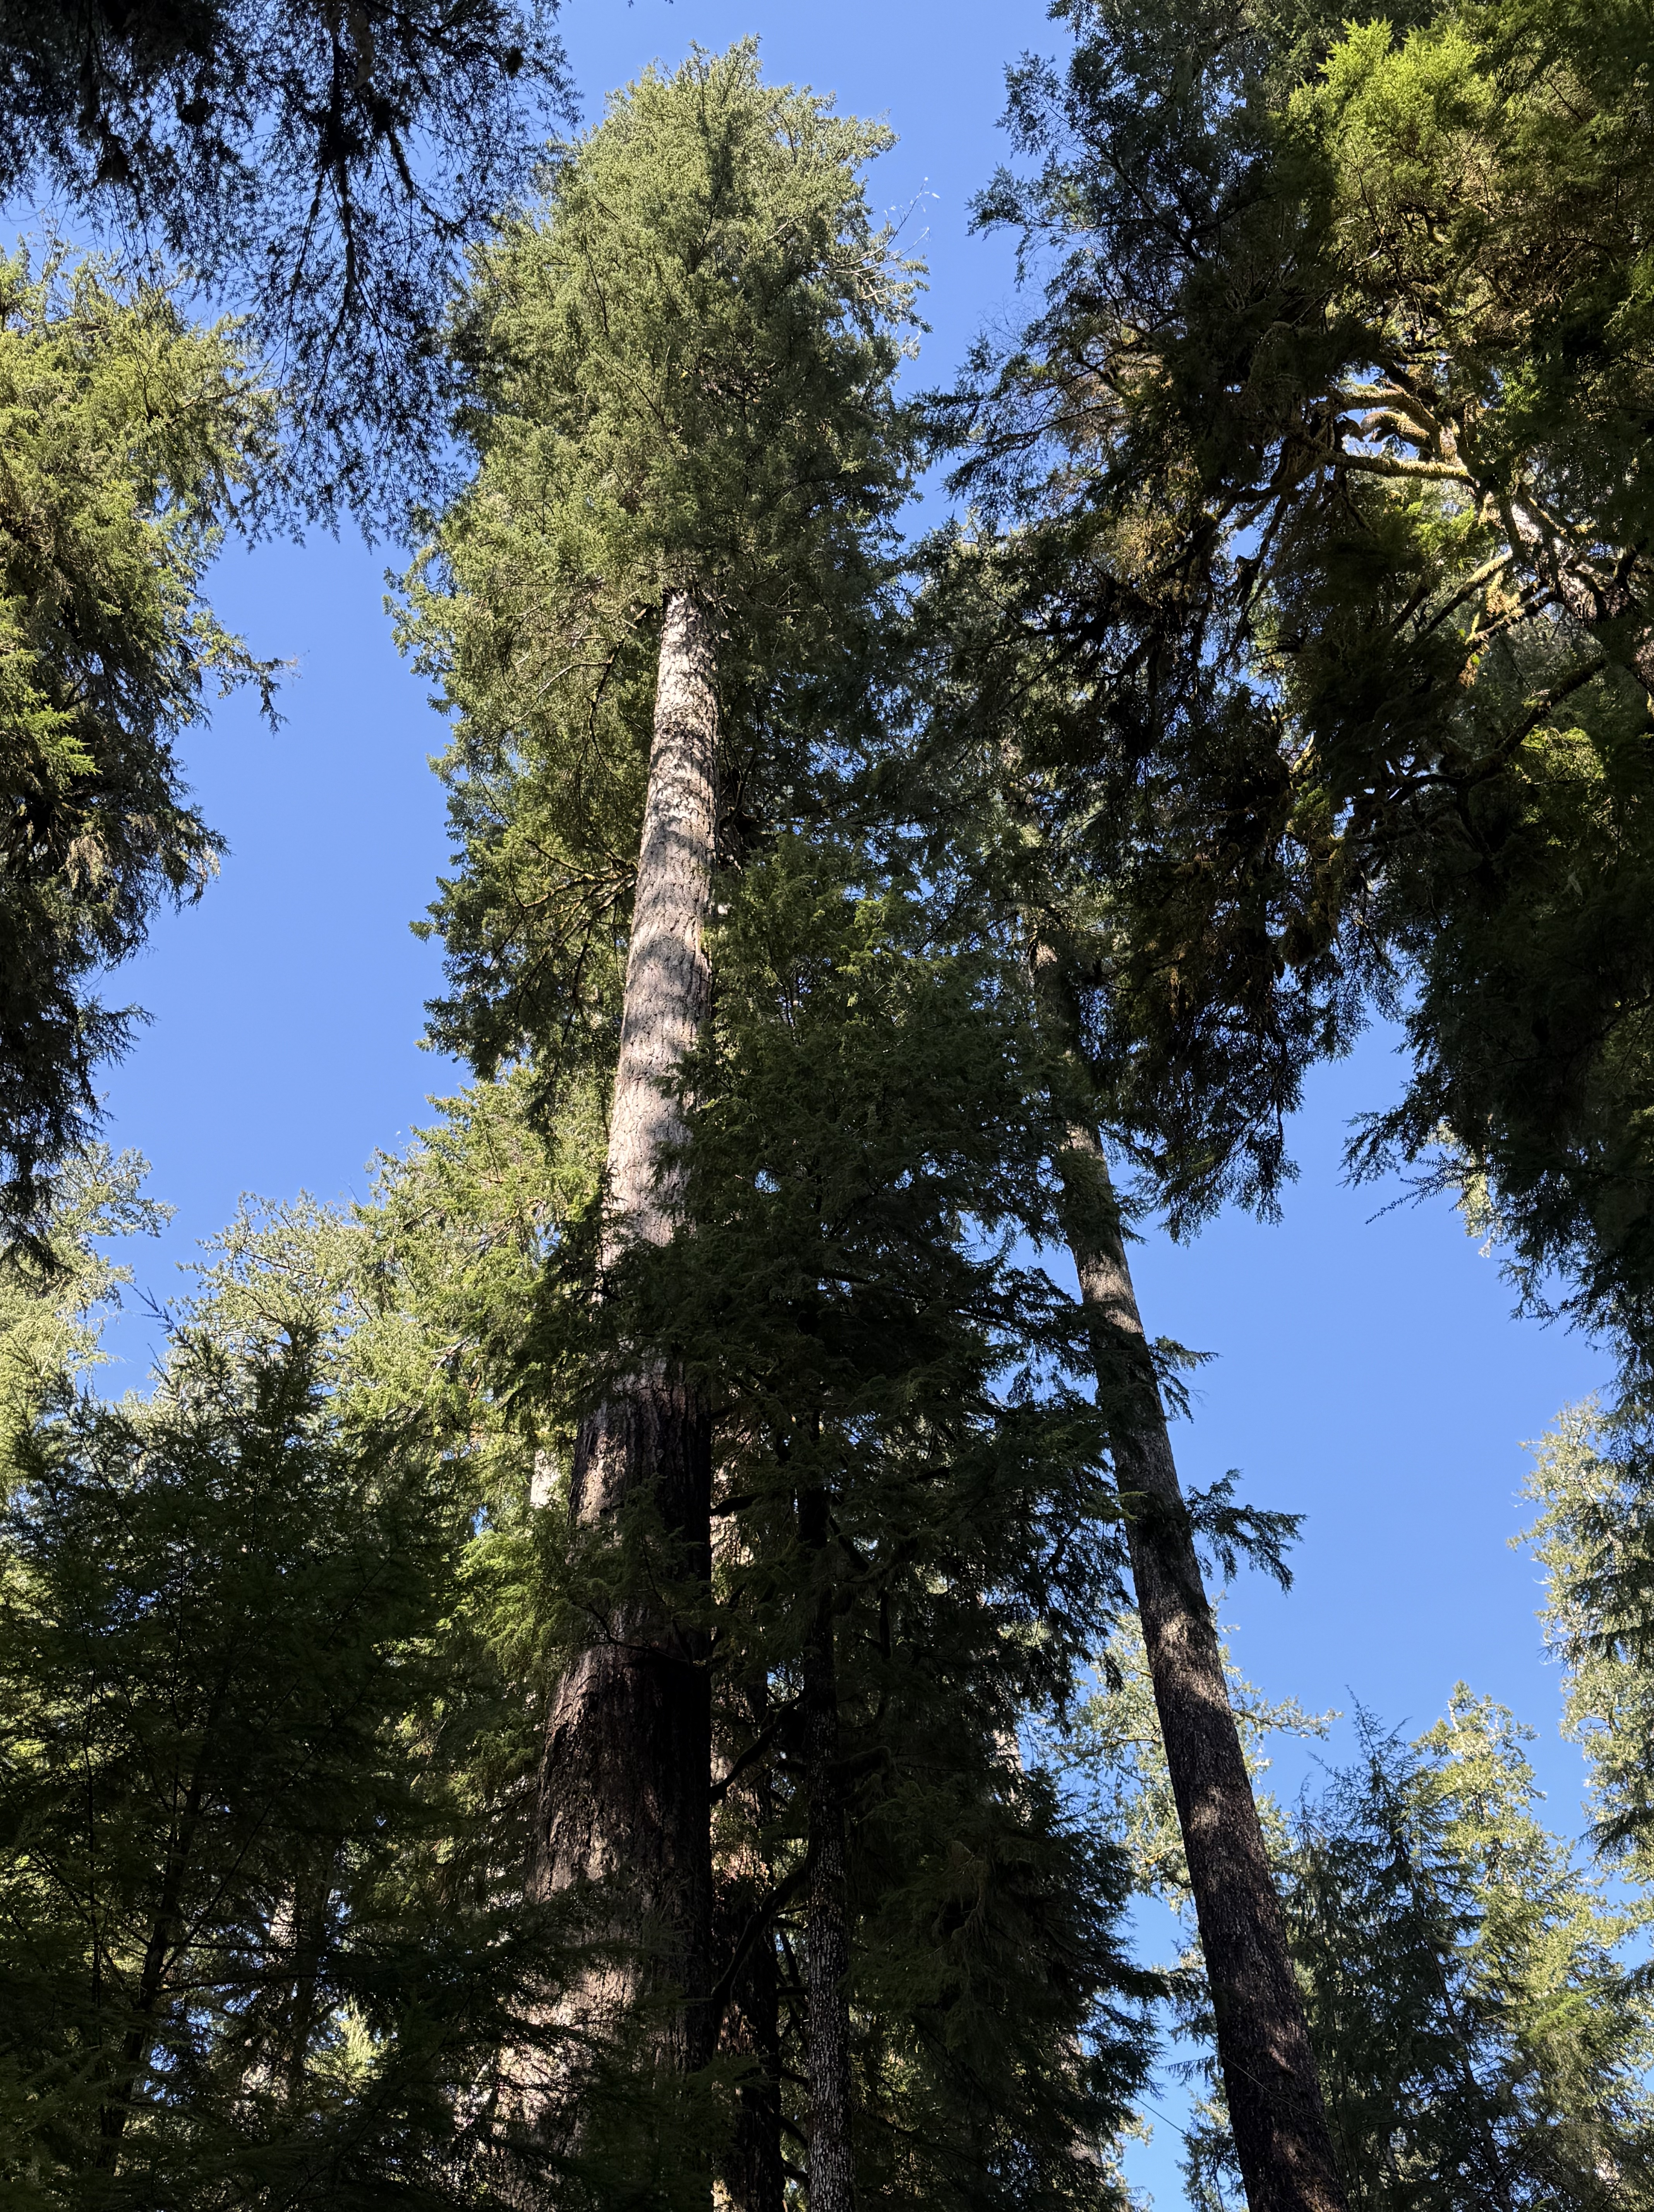
Location A: Quinault Rainforest. There are at least half-a-dozen species of giant evergreen trees in the rainforest, and I can’t identify any of them; but CoPilot suggests it might be a Coast Redwood, part of a local population found in this area. This example is typical in an area known for its “Champion Trees”. We’ll get to that in the next photo.
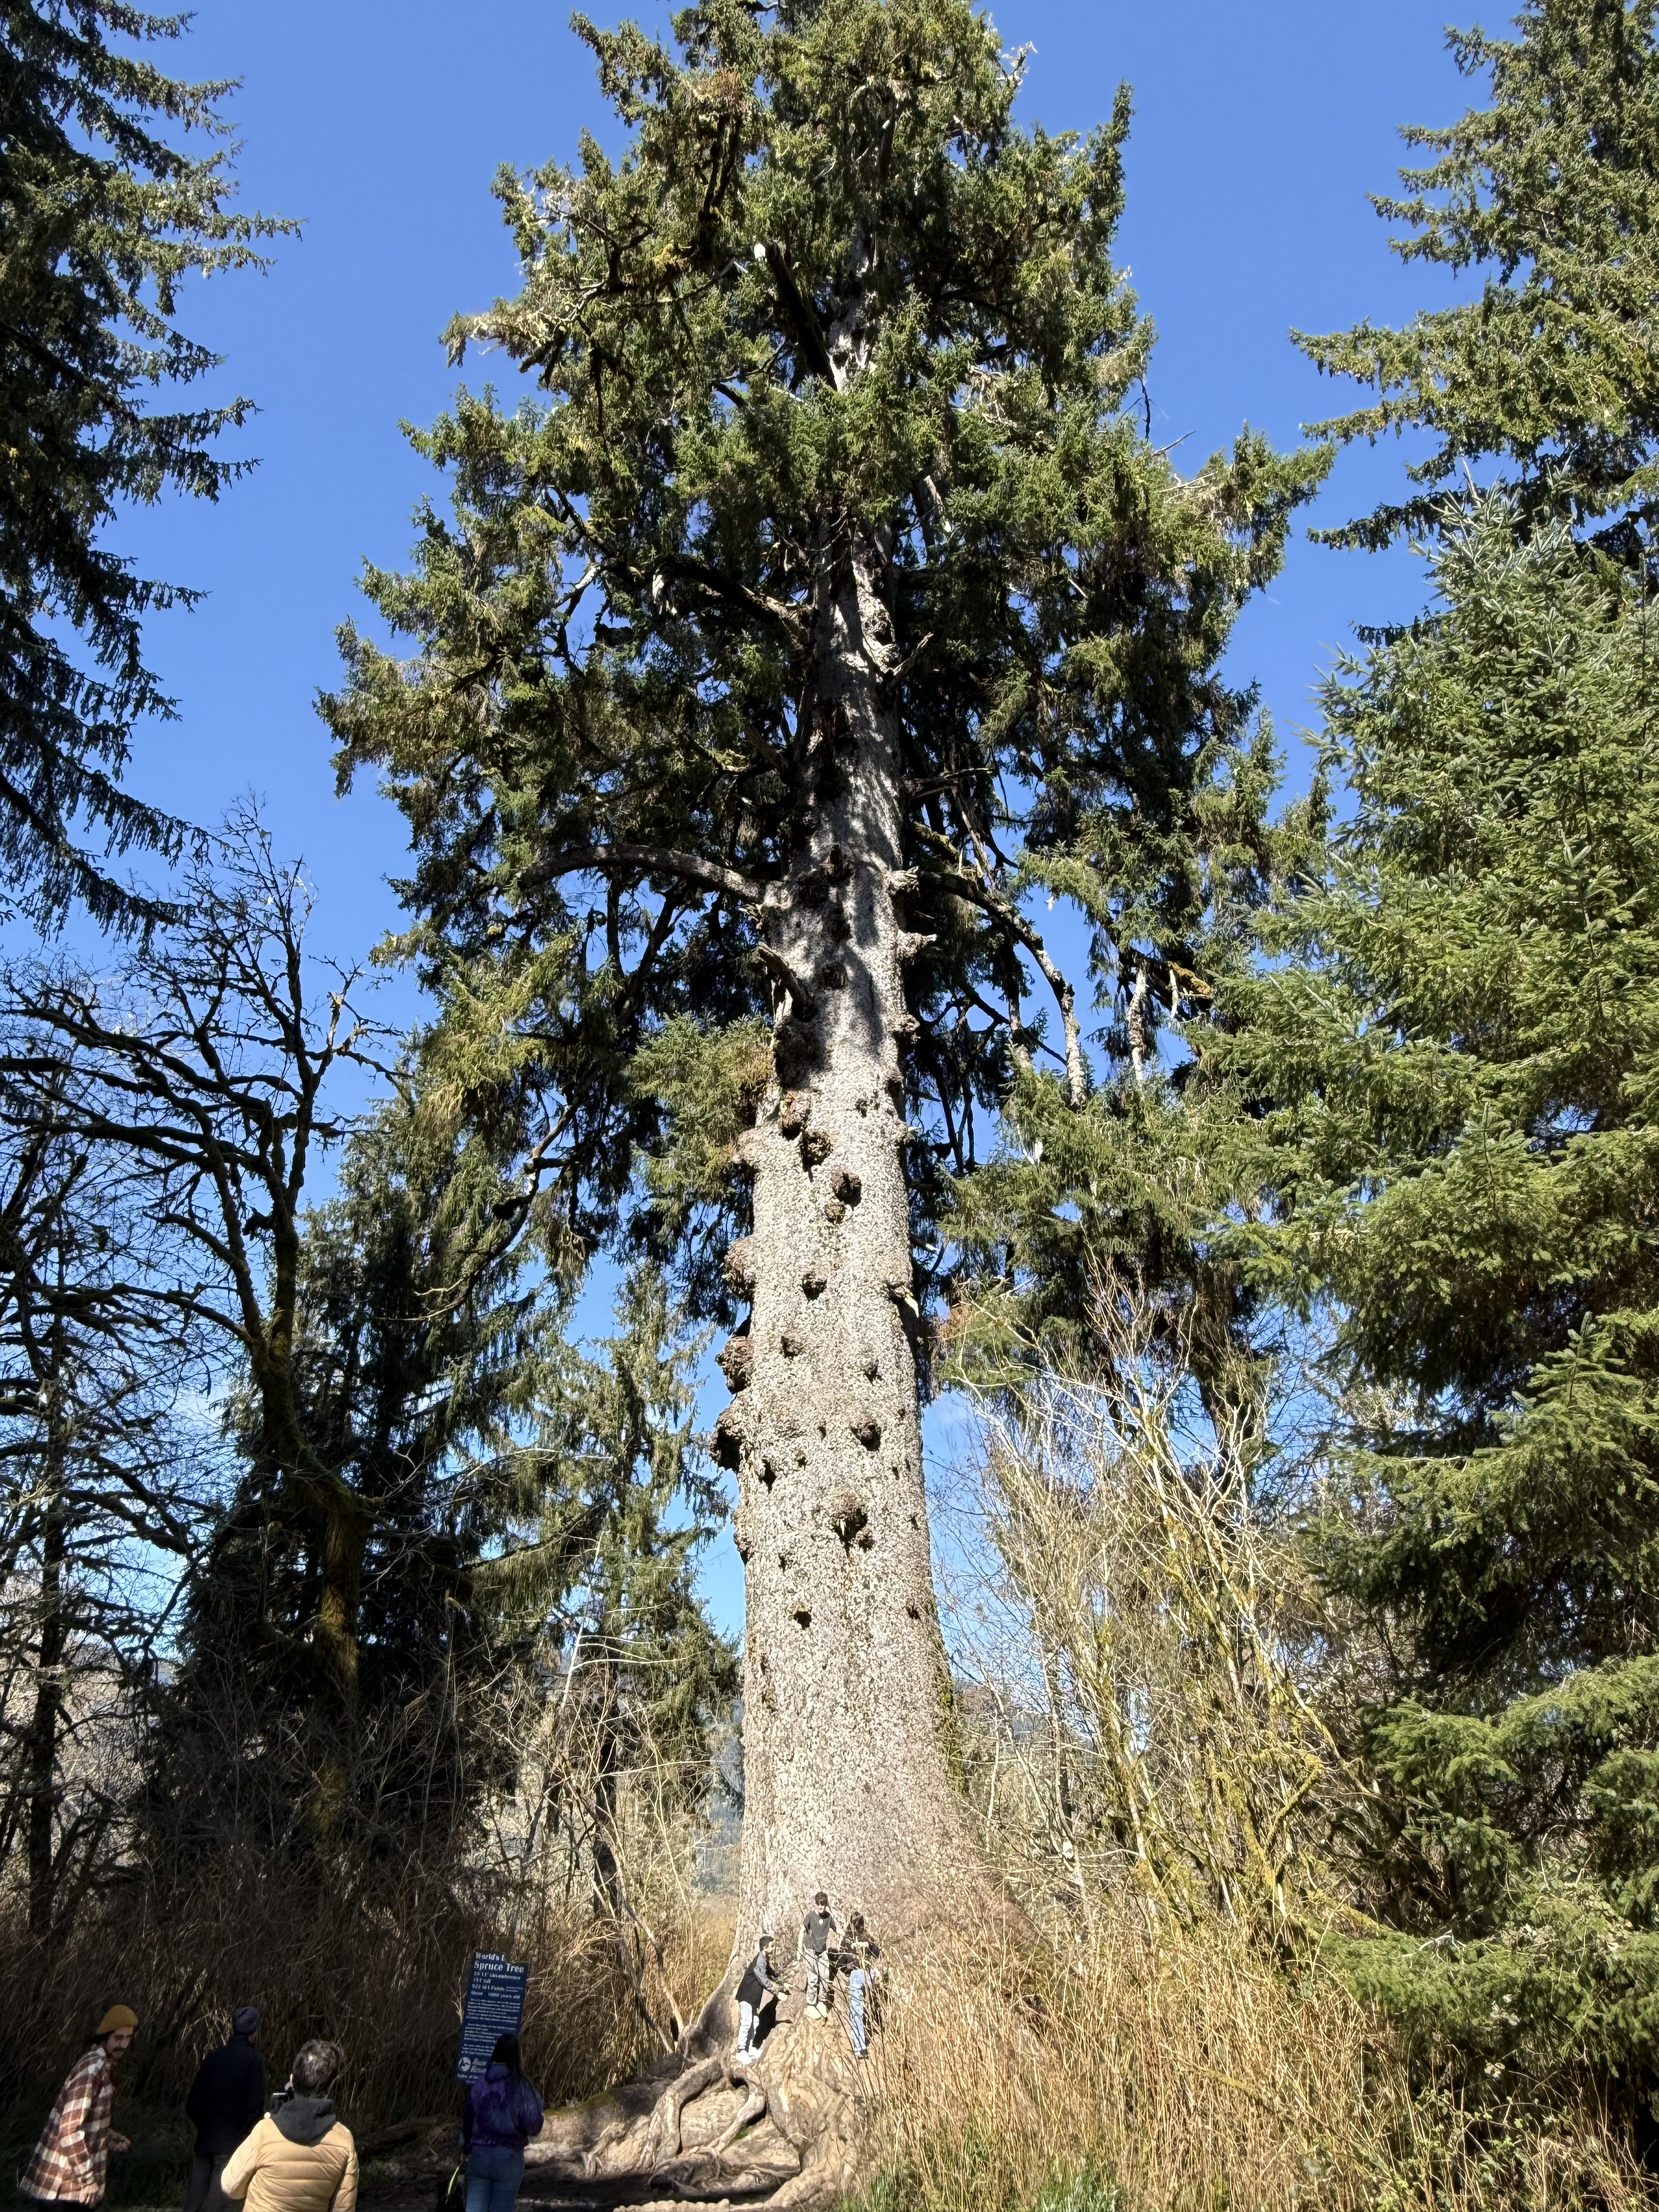
Location A. Quinault Rainforest. This is the world’s largest Spruce tree. It is 191 feet tall and about 1000 years old. It is one of the six champion trees located in Quinault Valley. The other champion trees are: the world’s largest Western Red Cedar, Douglas Fir, and Mountain Hemlock; and the largest Yellow Cedar and Western Hemlock in the U.S. This tree is growing in a wetland area at the NE end of Lake Quinault.
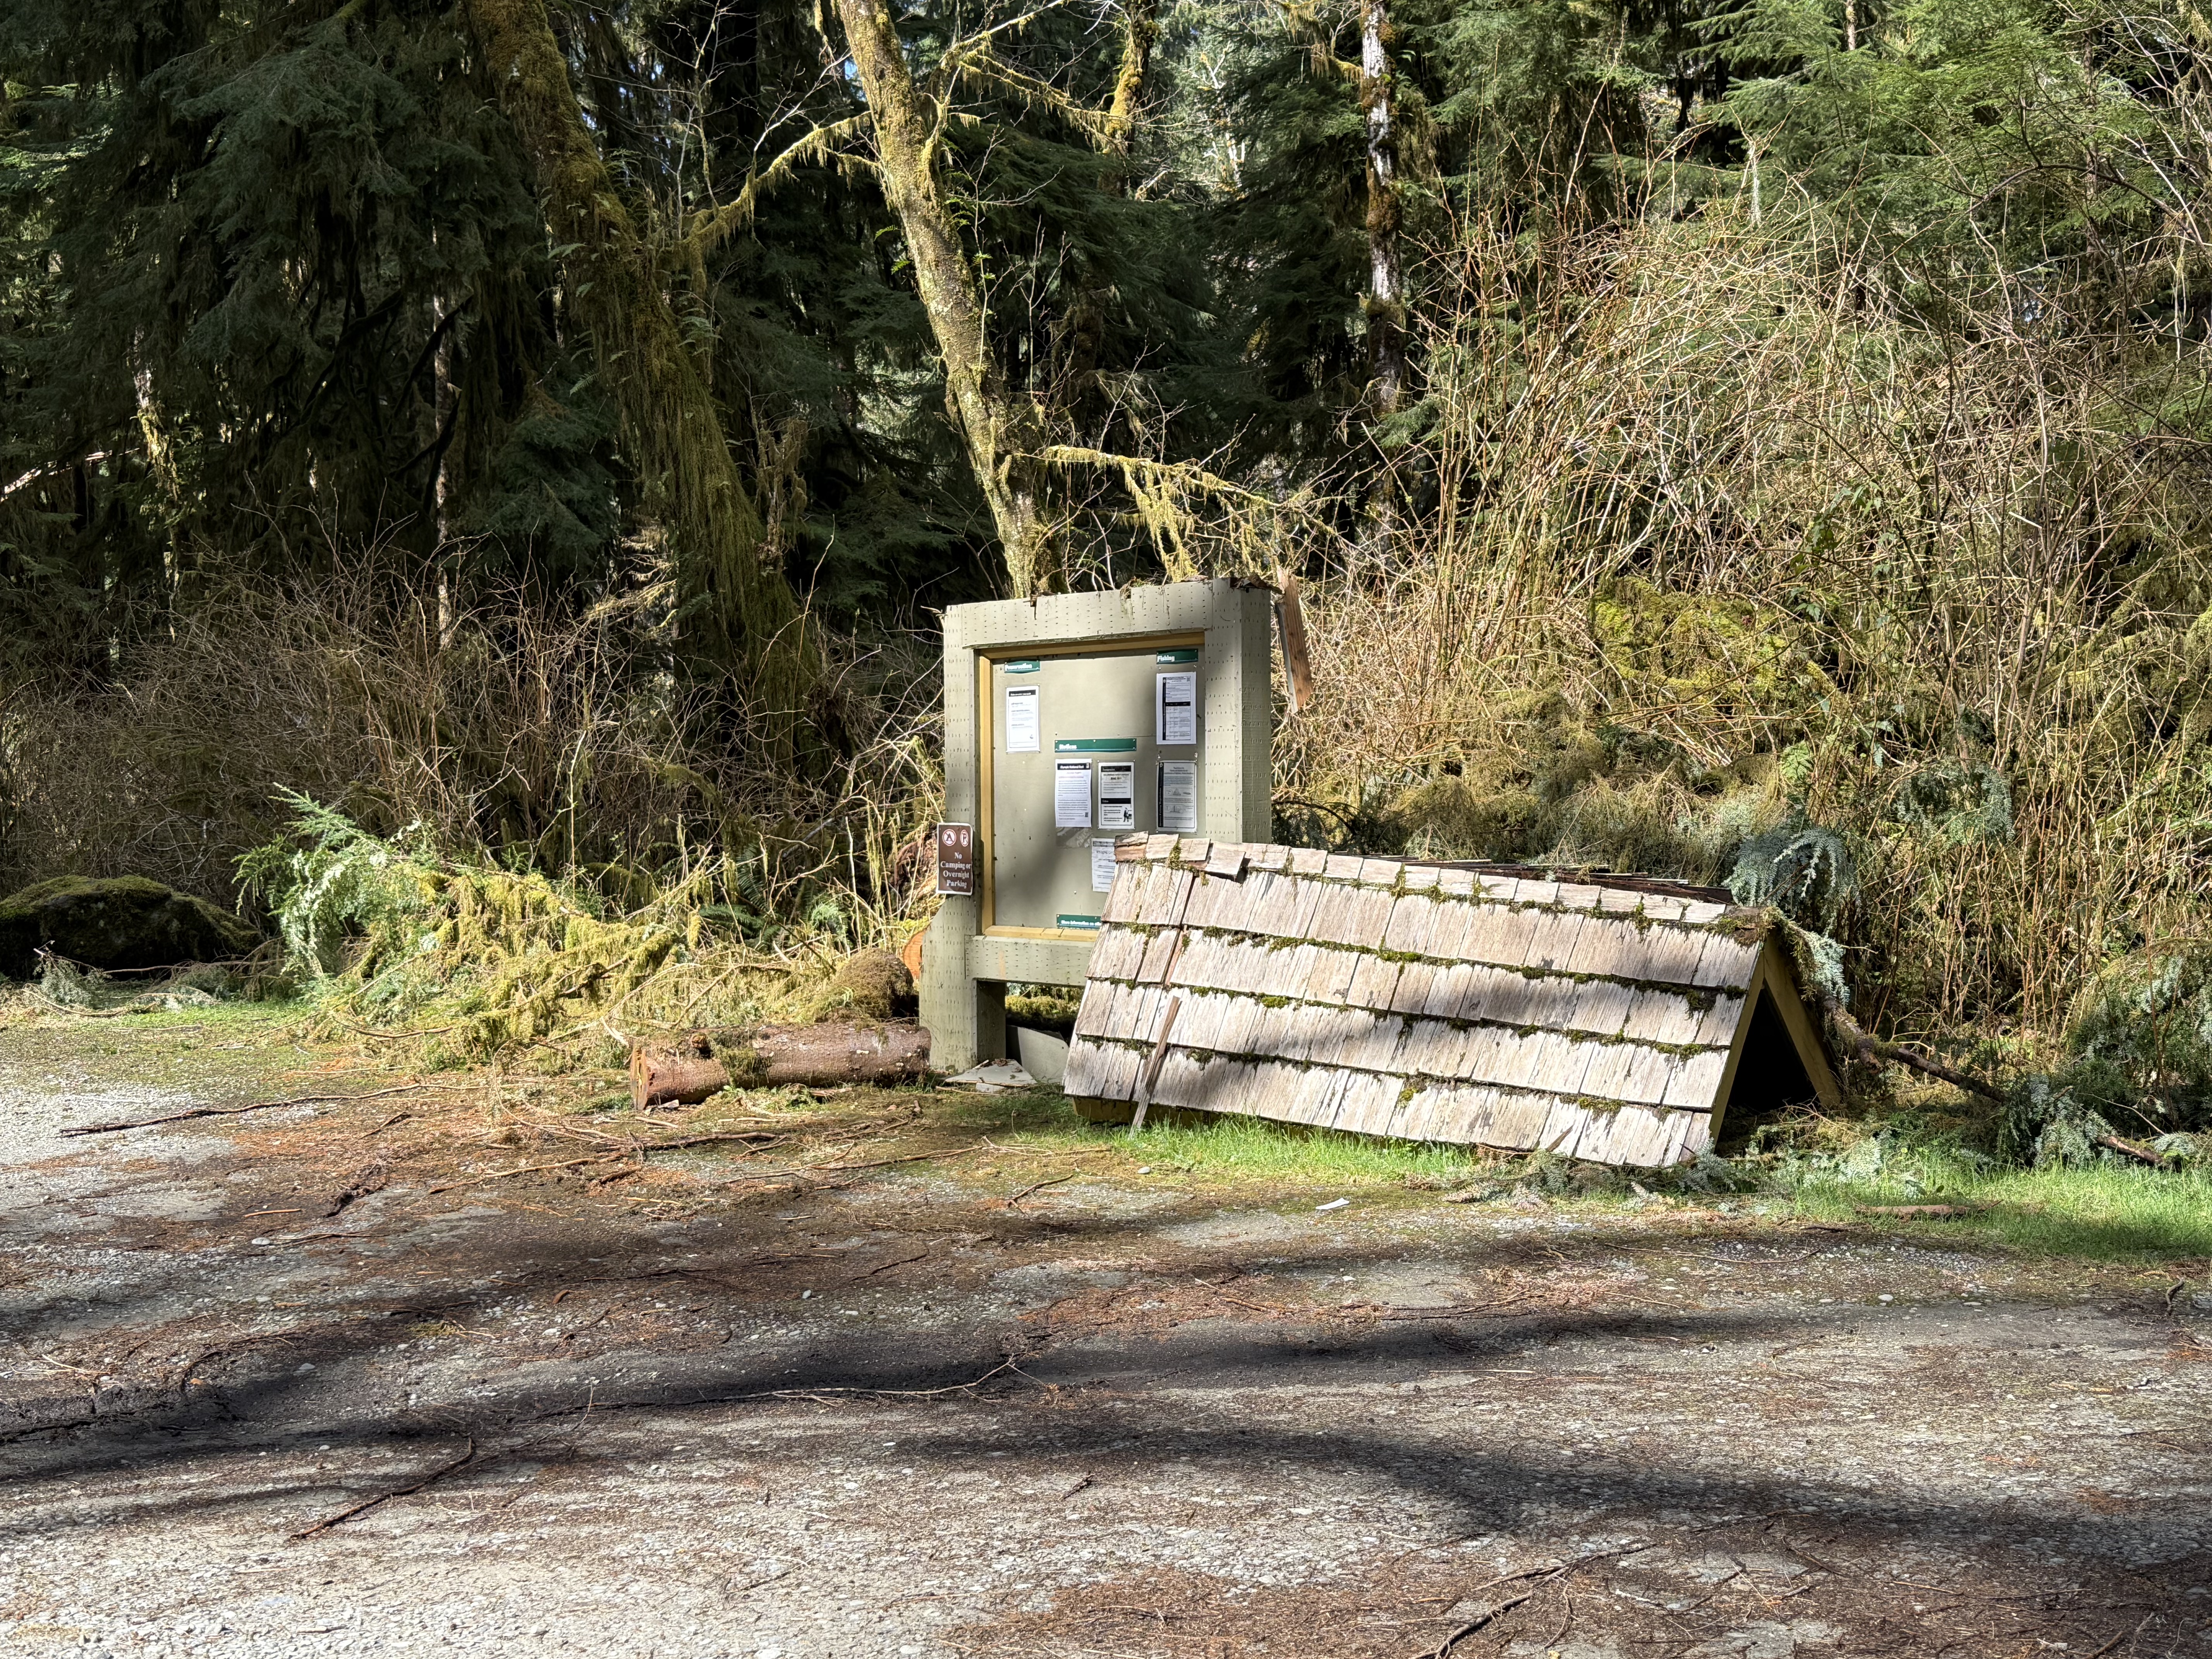
Halfway between Sites A and B. During my day-trips around the area, I’ve noticed a what appears to be a regional interest in post-industrial art, including but not limited to large concrete facilities that have been left to decay in place, as well as small sculptures and other curiosities scattered throughout the cities and forests. I don’t know if this is intentional or not: the roof of the information board collapsed (no doubt because of 12 feet of rain per year) and was set aside, possibly as a monument to nature?–or evidence of the poor funding and mismanagement of the National Park Service.
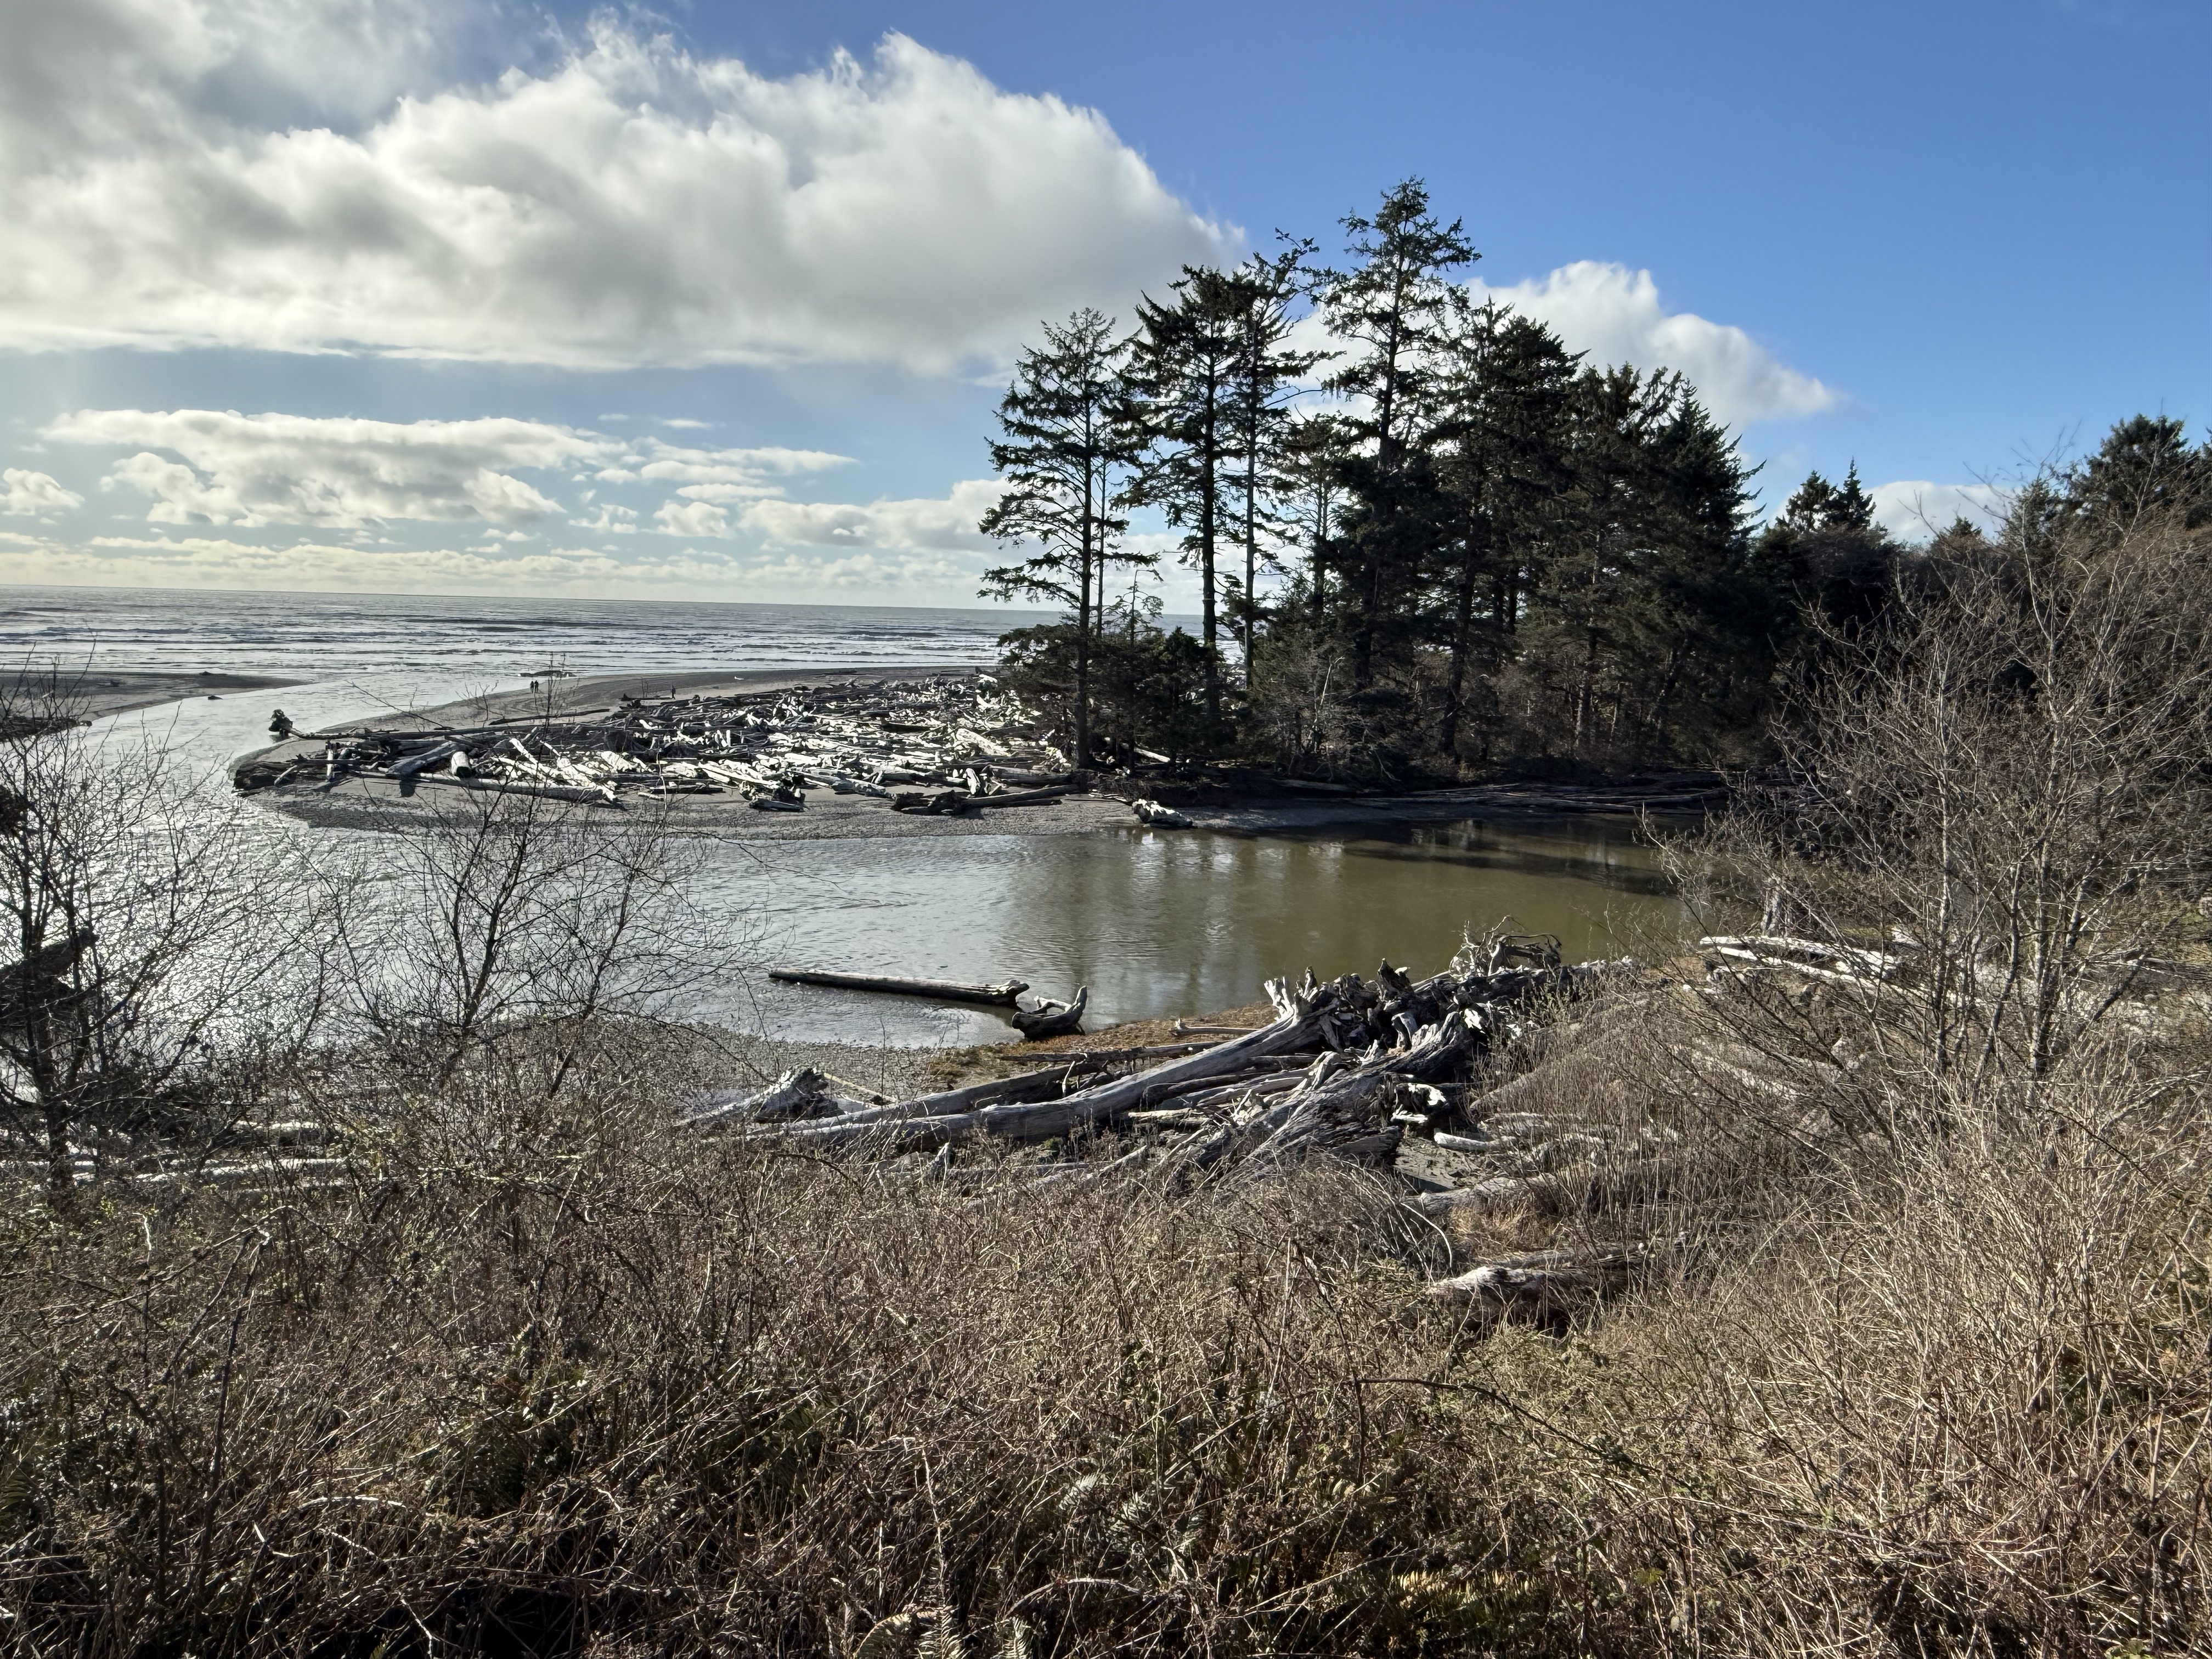
Location B: Kalaloch Lodge. This is the view from the deck of the lodge where I spent the night. Kalaloch Creek meanders as it approaches the coast and enters the Pacific Ocean here. An impenetrable pile of driftwood (actually logs and entire trees) has collected on a sand spit deposited on bedrock.
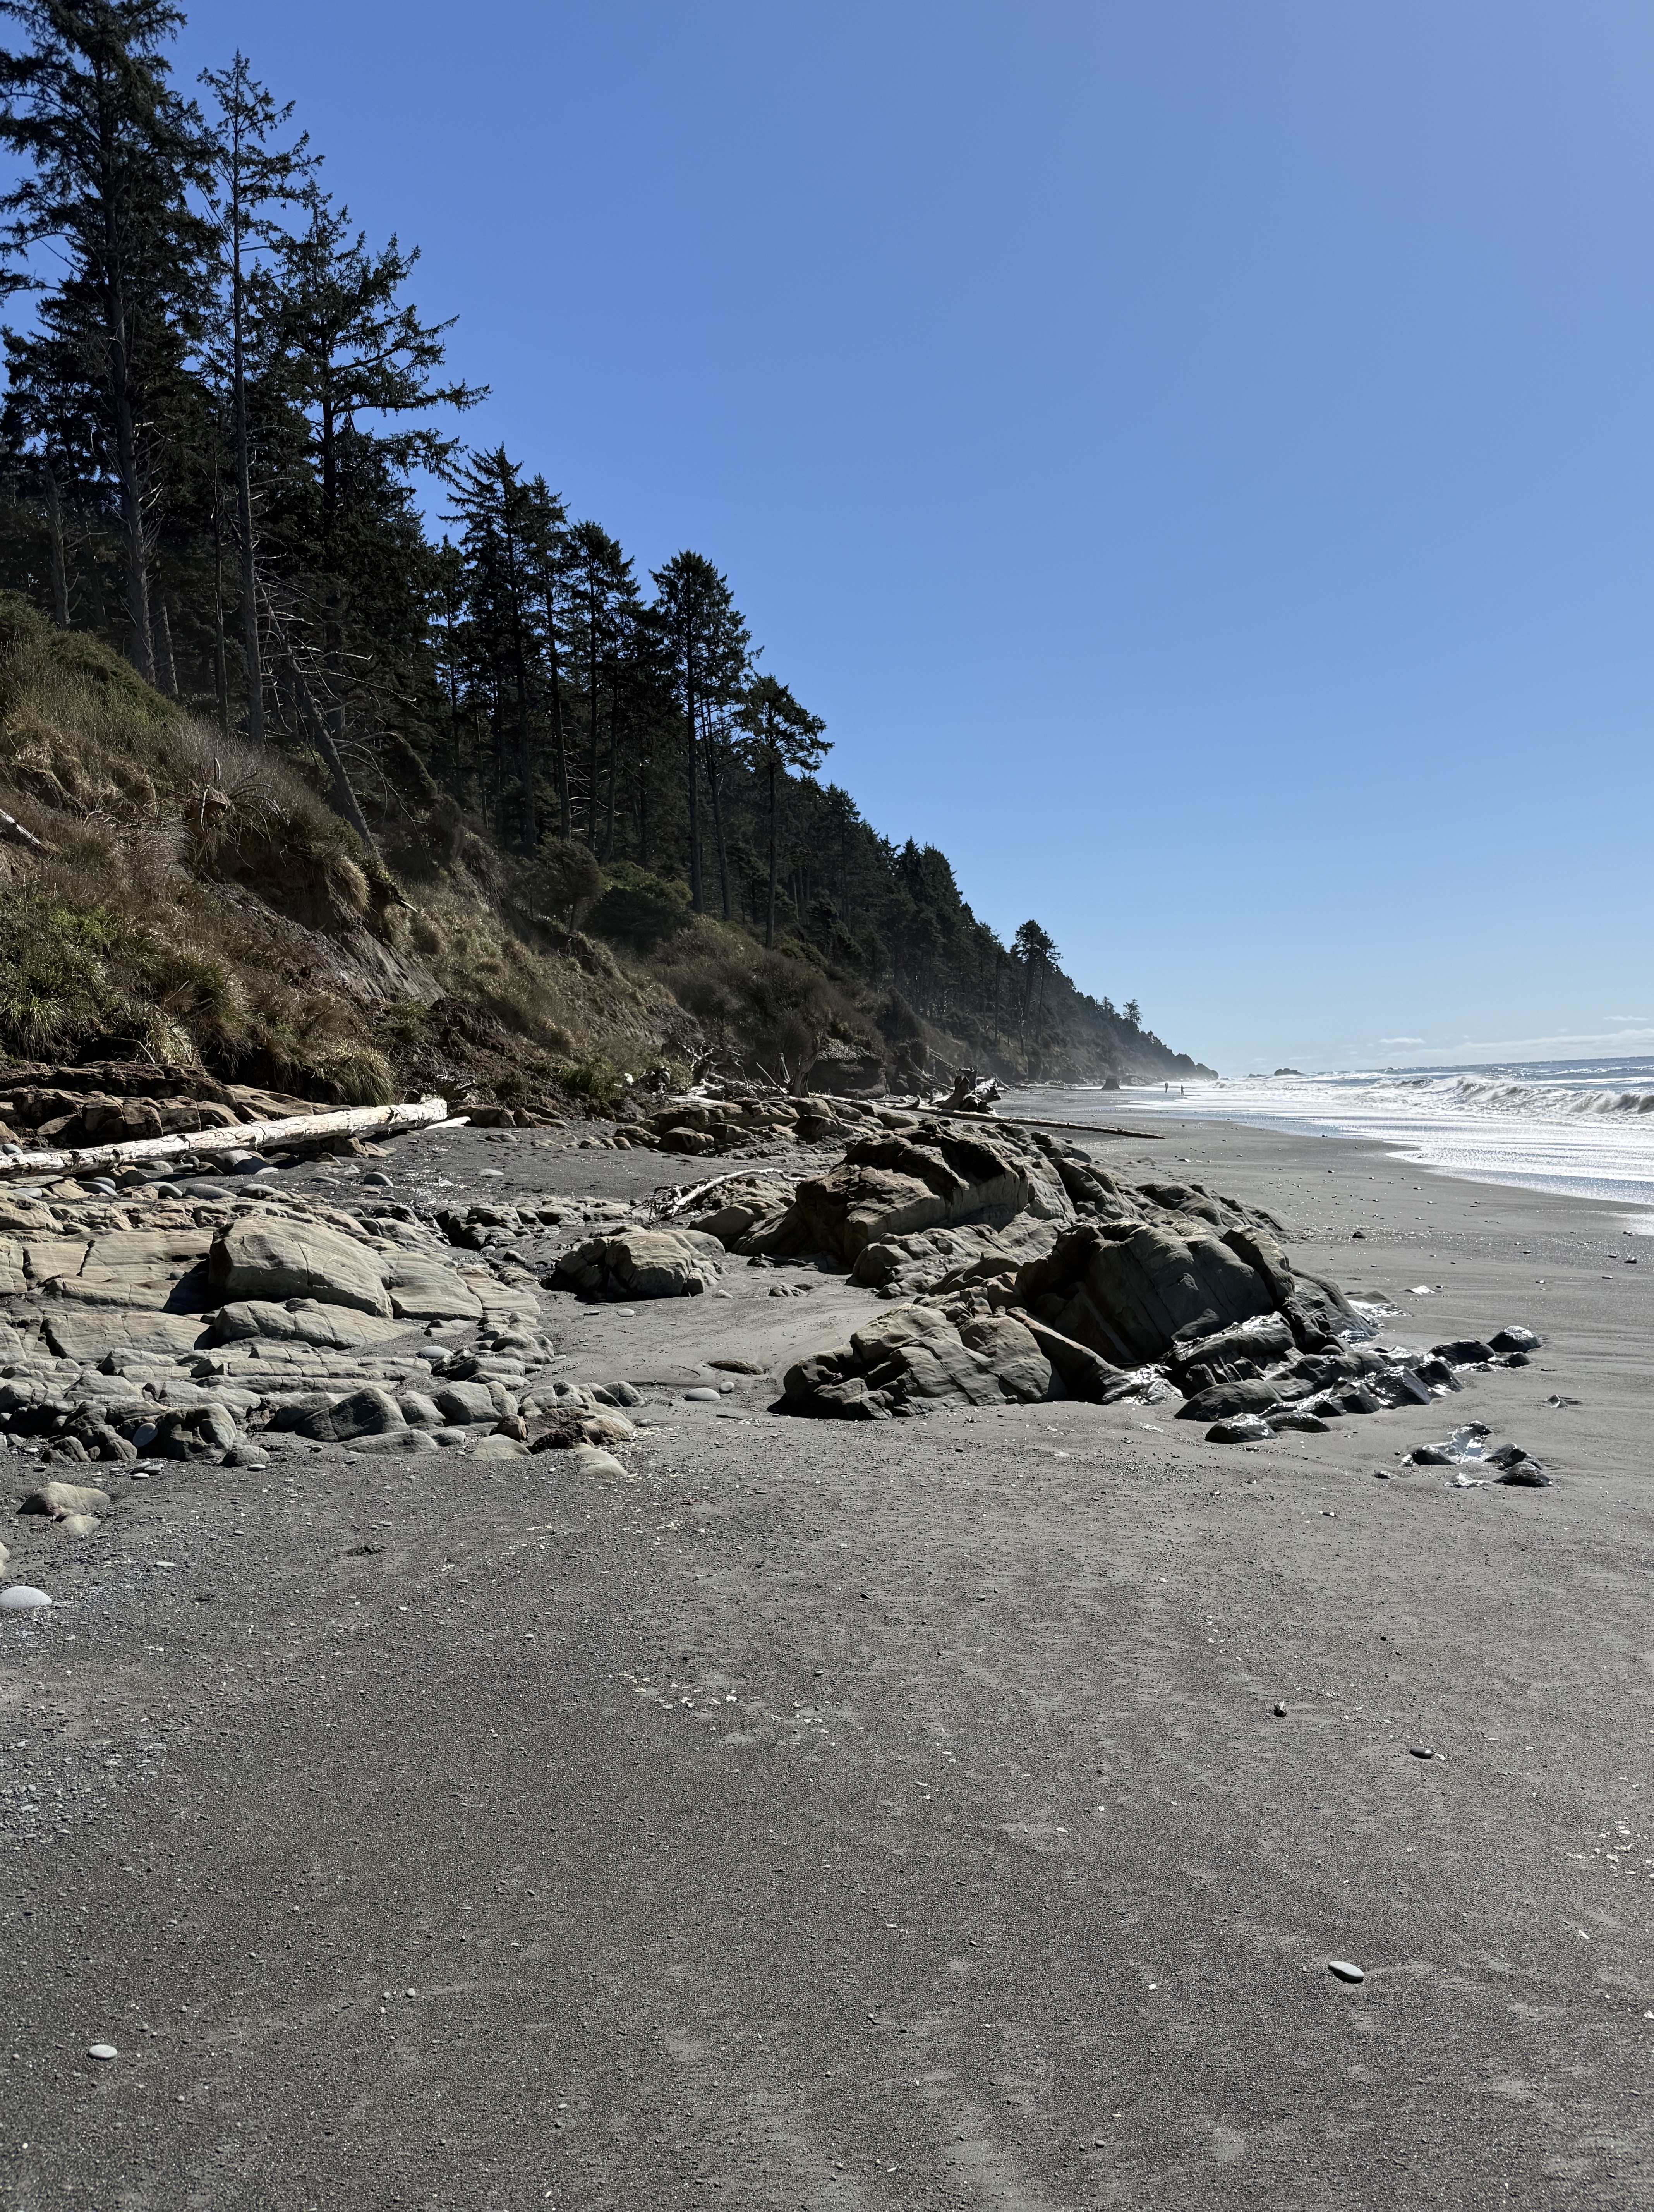
Location B: Beach 4 at Kalaloch. Steep bluffs of glacial till front a wide beach with many exposures of rock, which I’ll discuss in my next post.
Location C: Ruby Beach. This was the last beach before US 101 turned inland for ten miles. I took a video because a series of photos can’t possibly convey the beauty of this location as the sun was rising. Note all the rocks protruding from the water at low tide. The rocks are rising from the earth as we make our way north.
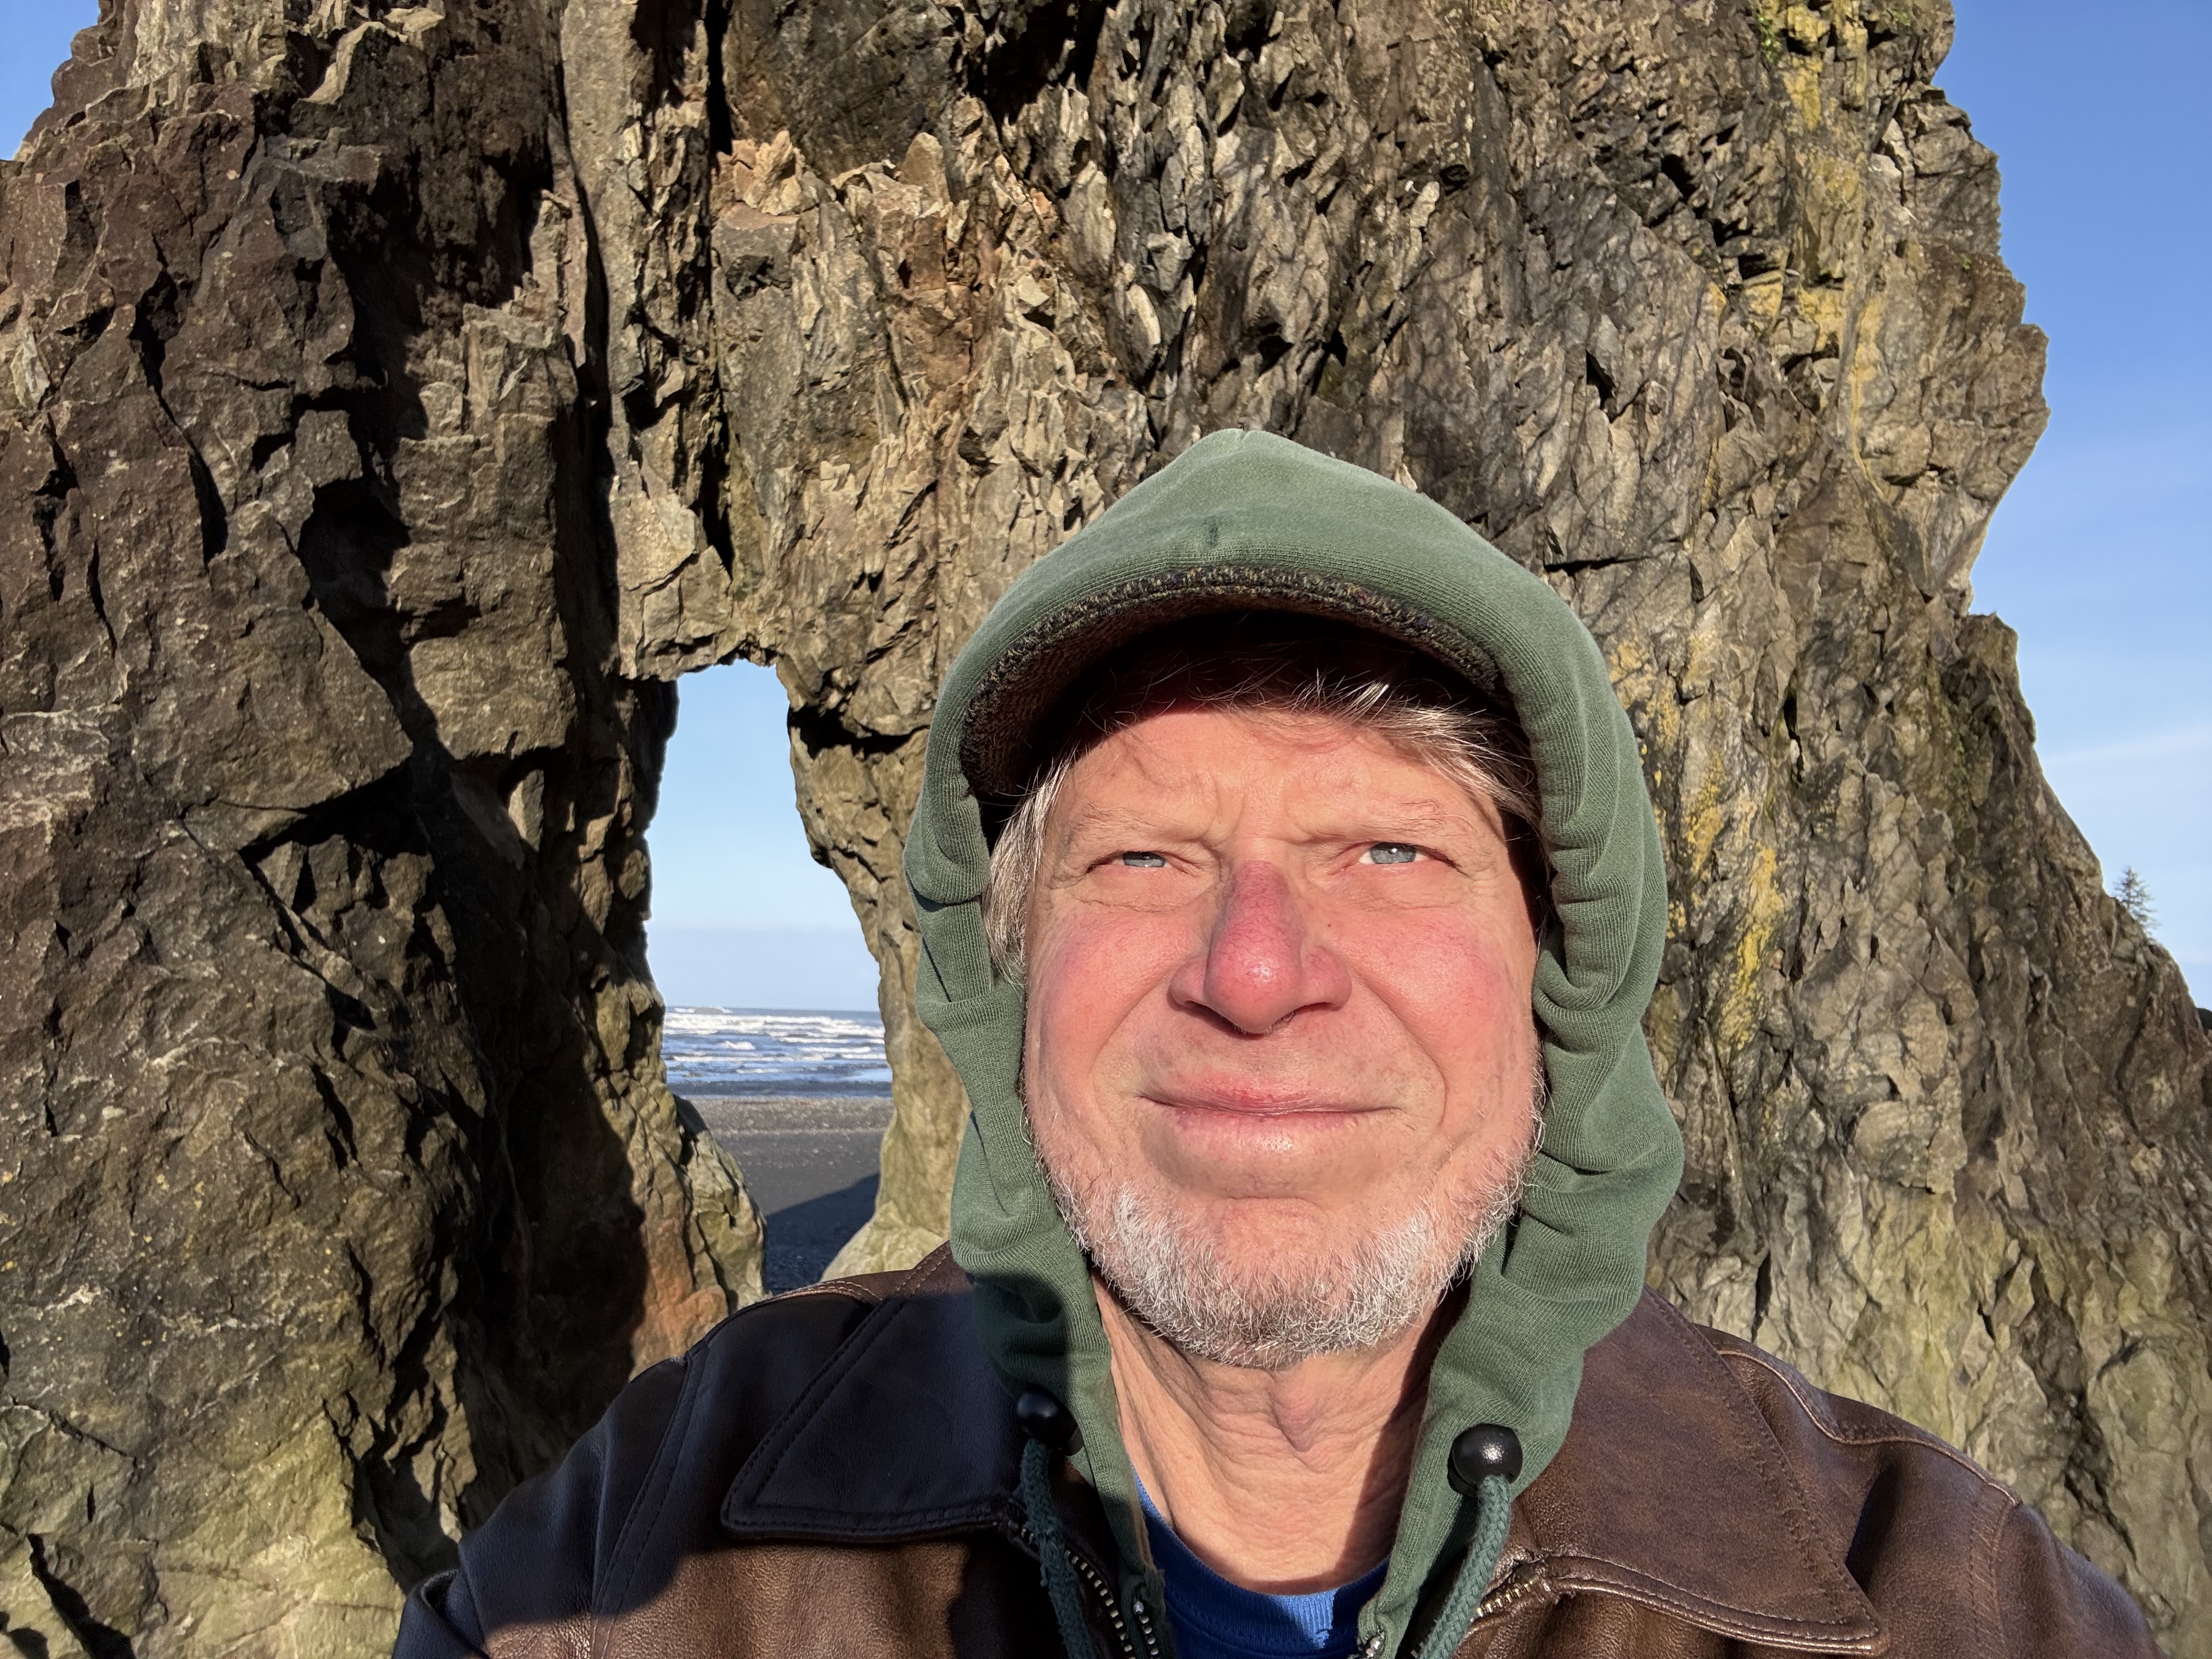
Location C. This selfie demonstrates how chilly it was, with the temperature below 40F. Rock formations like this are called stacks; they are erosional outliers as the coast recedes over millions of years, pounded day and night by rocks carried by waves; and tides that exceed nine feet–twice a day! You have to time your visit accordingly or all you’ll see is water.
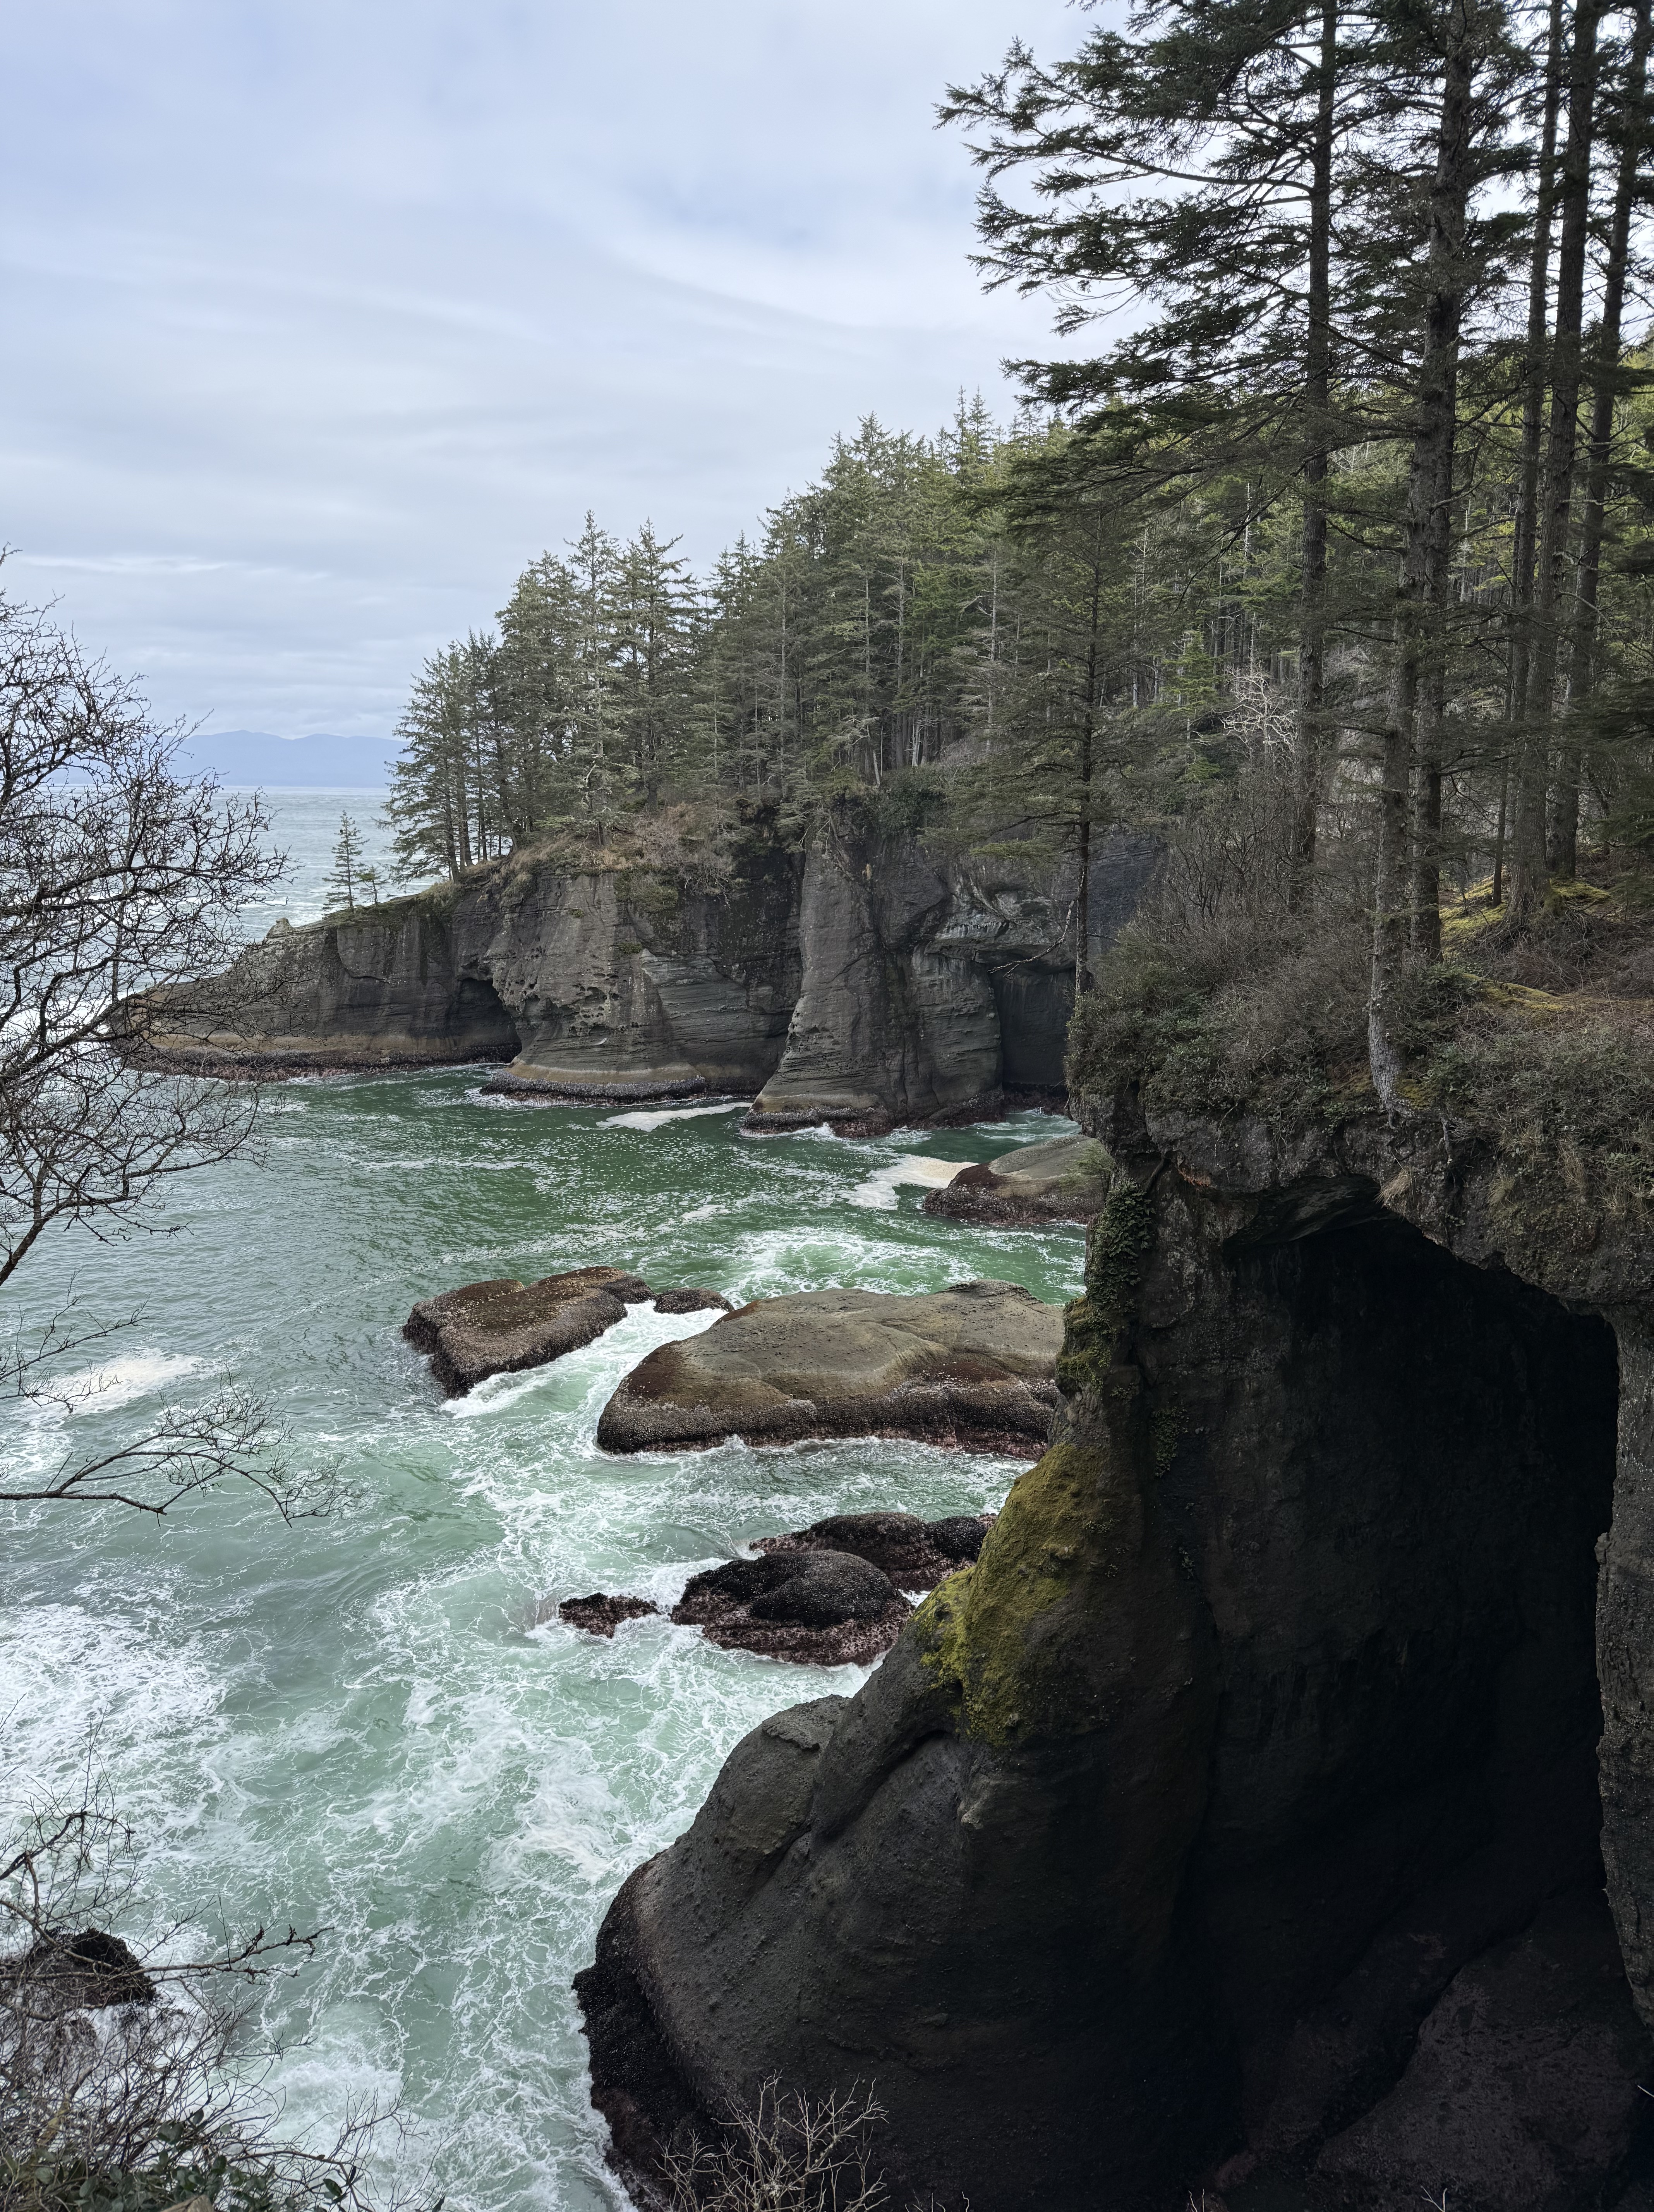
Location D: Point Flattery. This is the extreme tip of the contiguous United States. The bedrock we saw further south, at Ruby Beach, now forms wave-cut cliffs that tower 40-80 feet above the waves. The top of the bluffs is 330 feet above sea level. The view from the catwalks is breathtaking. Vancouver Island, BC, is visible in the background, with peaks around 6000 feet.

More PNW Humor. All of the toilets we saw along the coast were constructed over septic tanks, with warnings about what to put in them. Someone with a sense of humor modified just one word of the official message…
If you get the chance, I strongly recommend visiting Olympic National Park, but you’re going to want to spend a week unless you live nearby in the PNW.
Gravel Beaches on Vashon Island
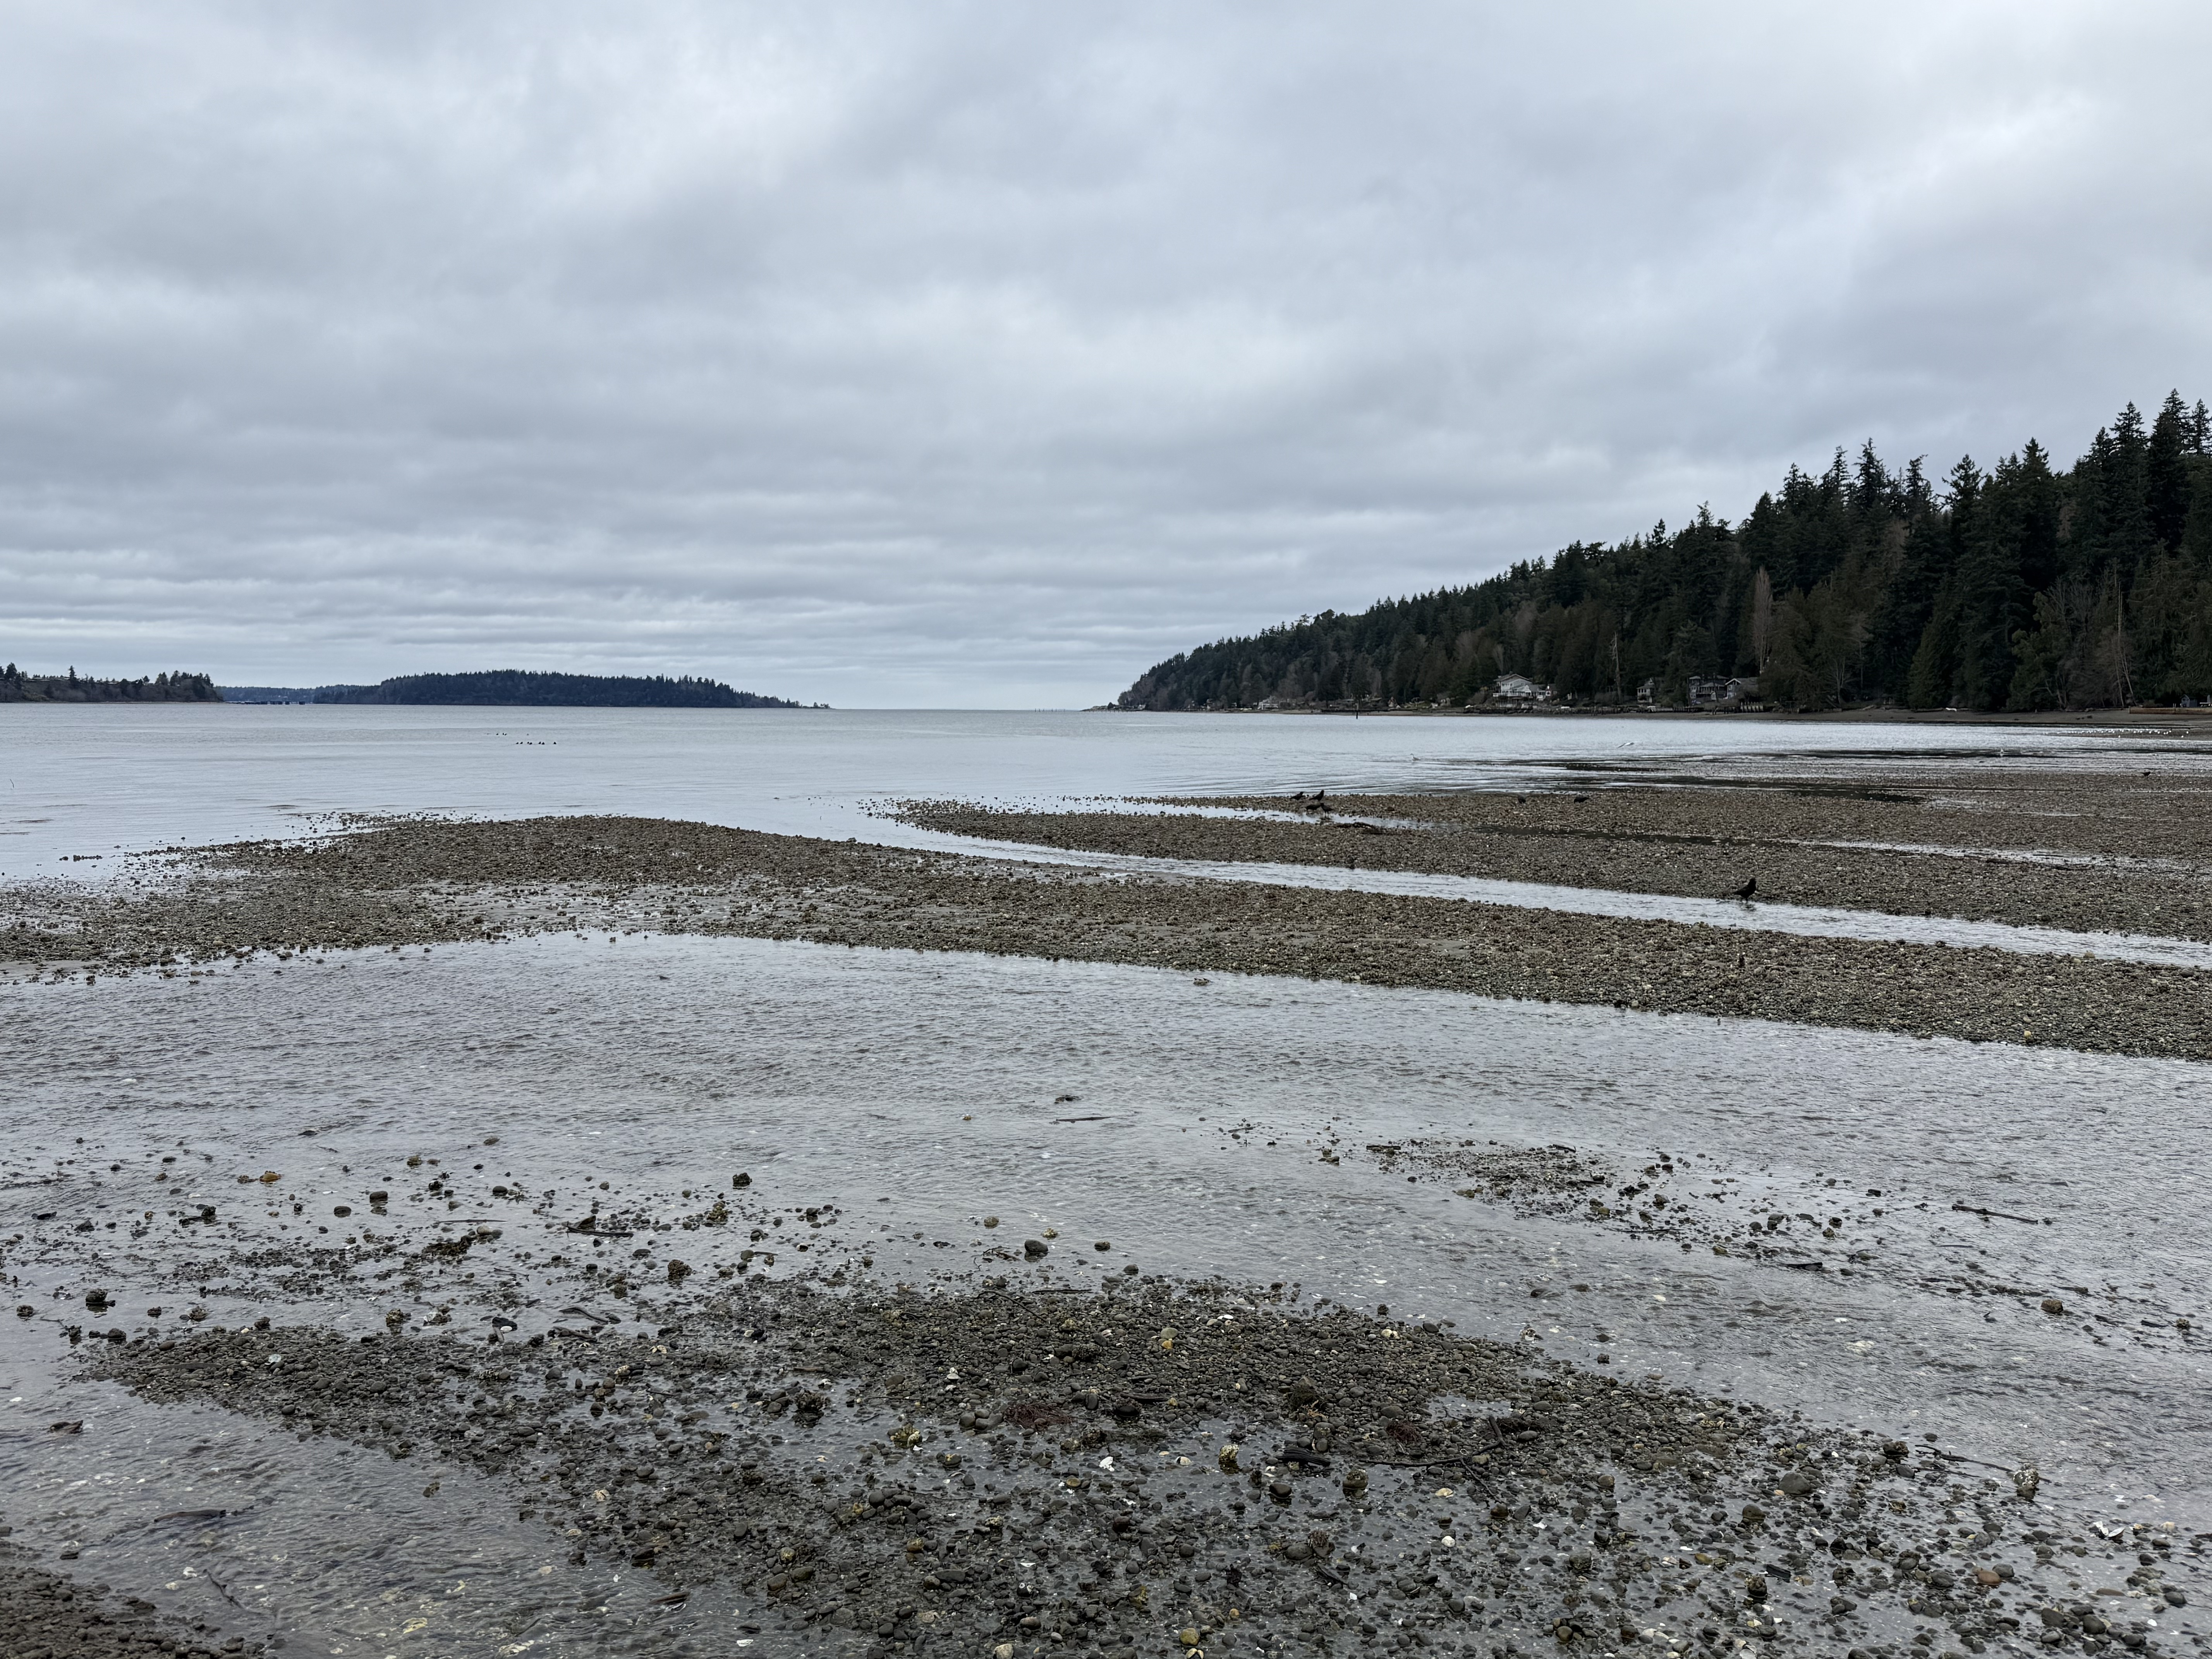
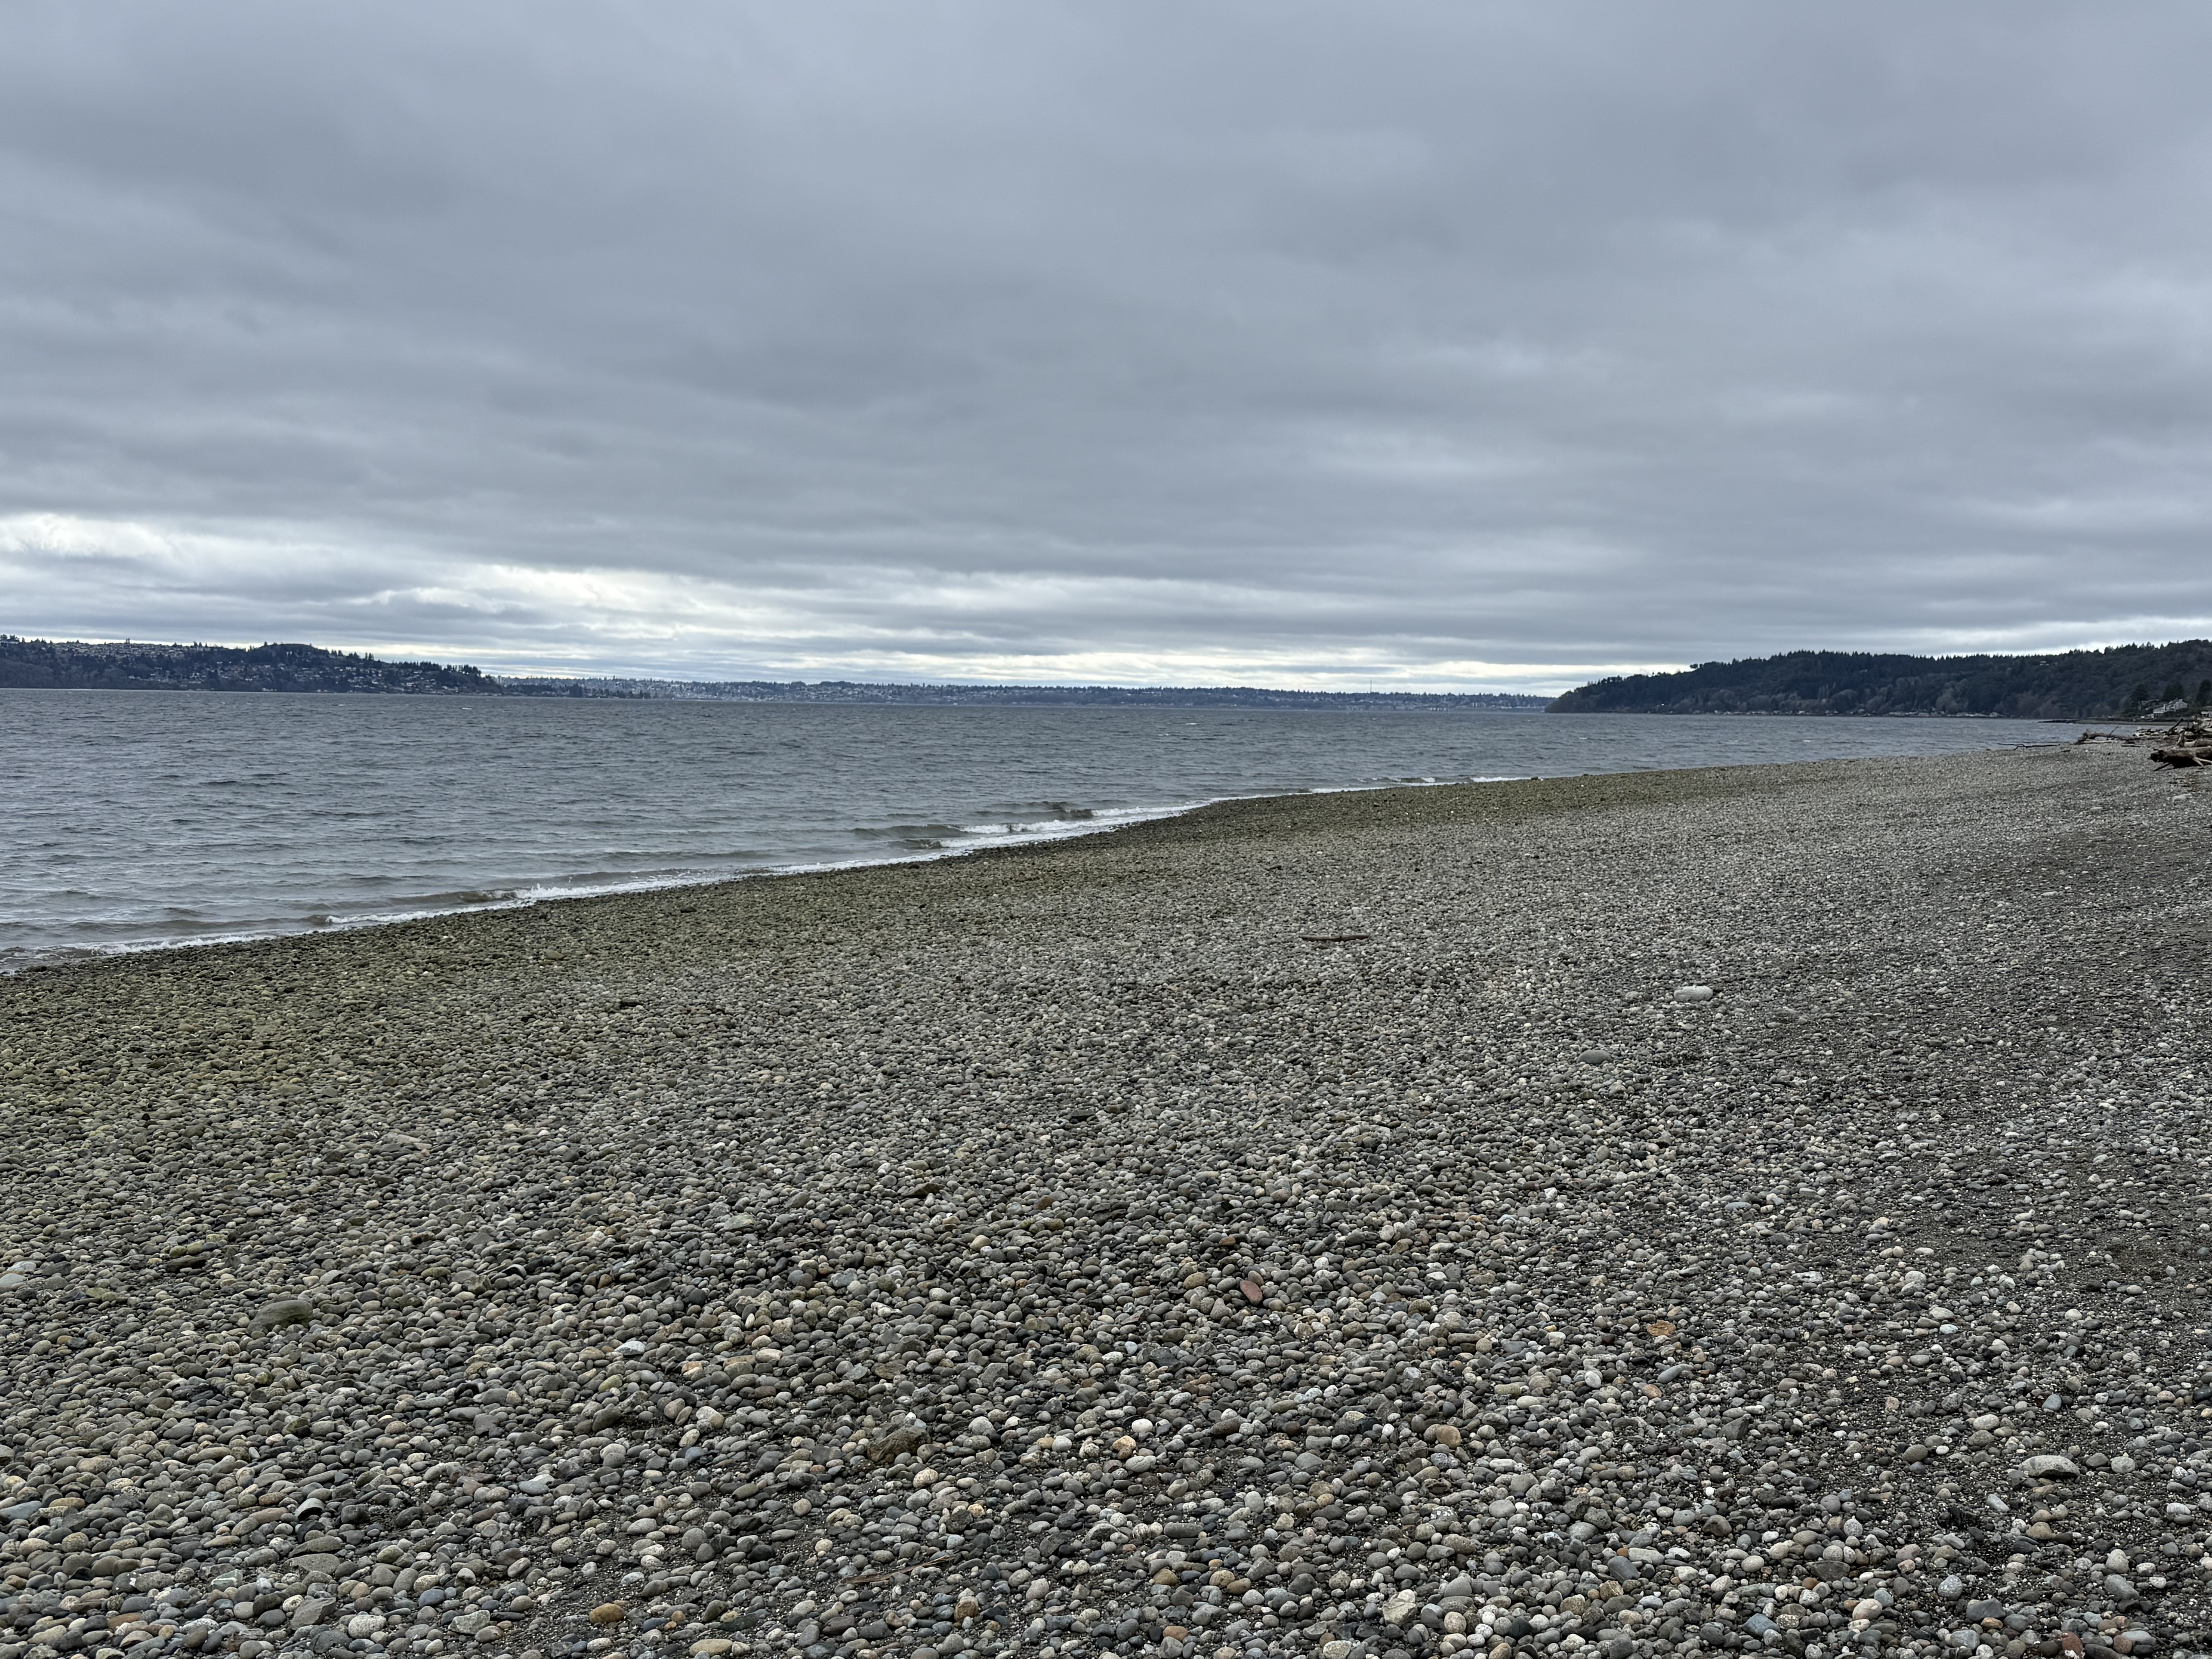
This photo of the gravel/mud beach at Fern Cove Nature Preserve reveals a marine delta, fed by Shinglemill Creek. Unlike the mud/sand delta we saw at Dash Point, the sediment here is dominated by rounded gravel and small boulders. Mud, sand and silt form the matrix. All of this material is available from the glacial till that comprises Vashon Island.
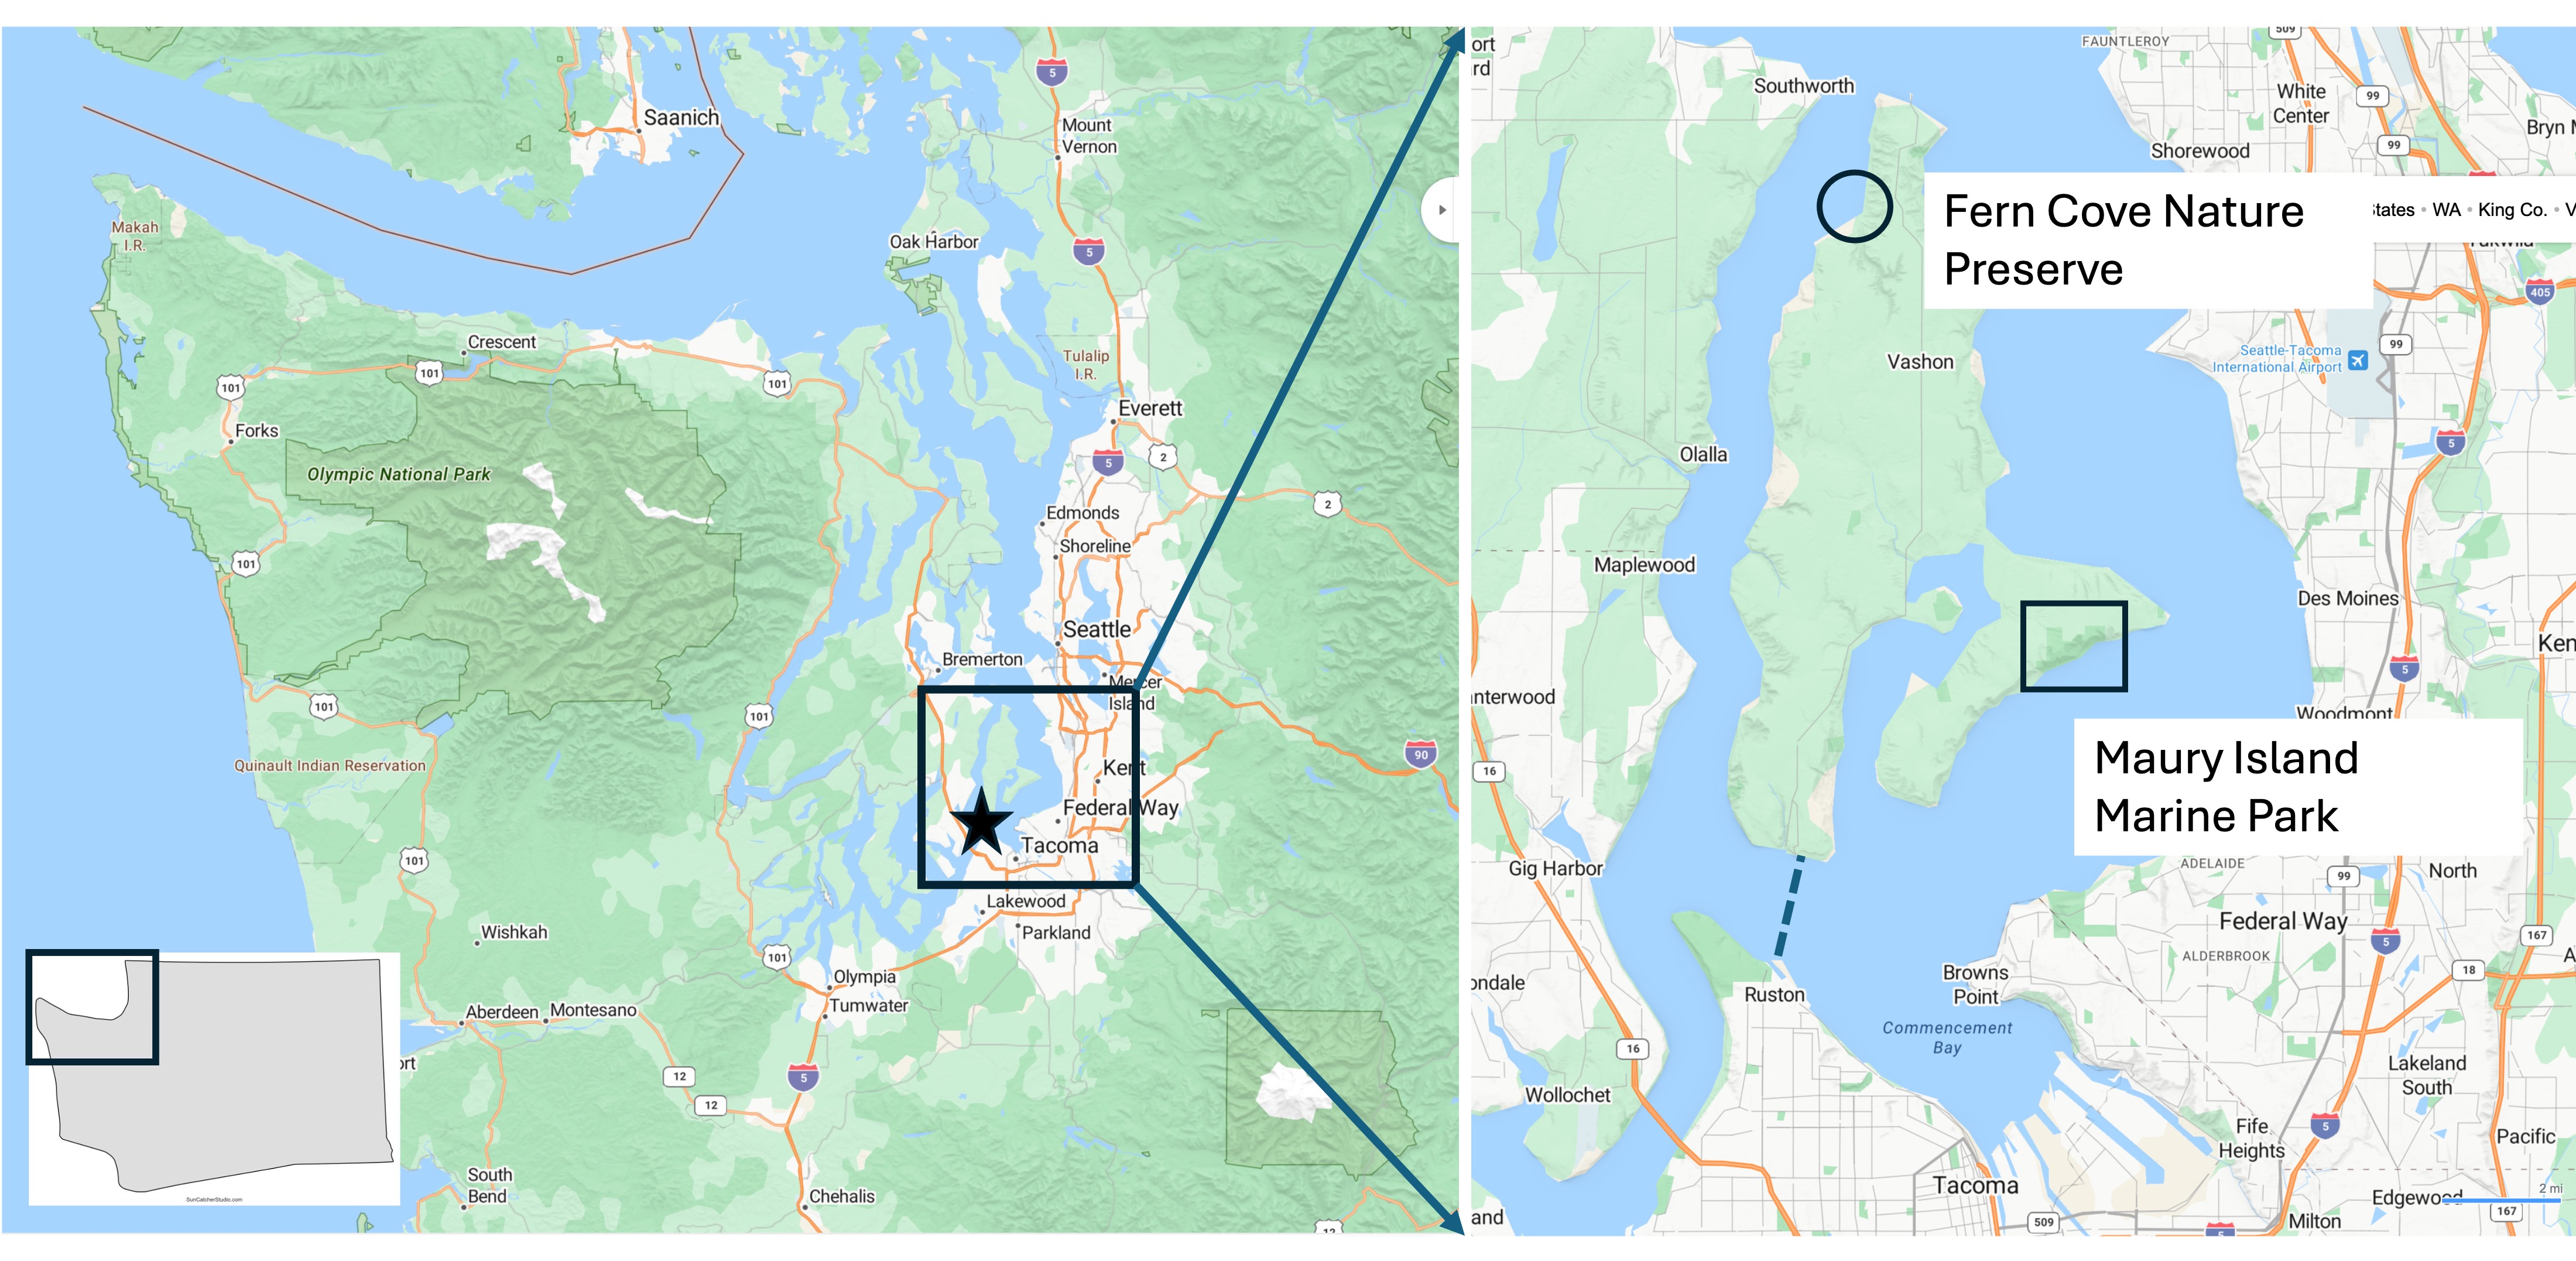
The inset map (right) shows the two sites I visited today. Fern Cove is located near the northern tip of Vashon Island whereas Maury Island Marine Park occupies the SE side of an island that is connected to Vashon by a fill zone about 200 yards across (which is eroding away as I type).
Fern Cove Nature Preserve
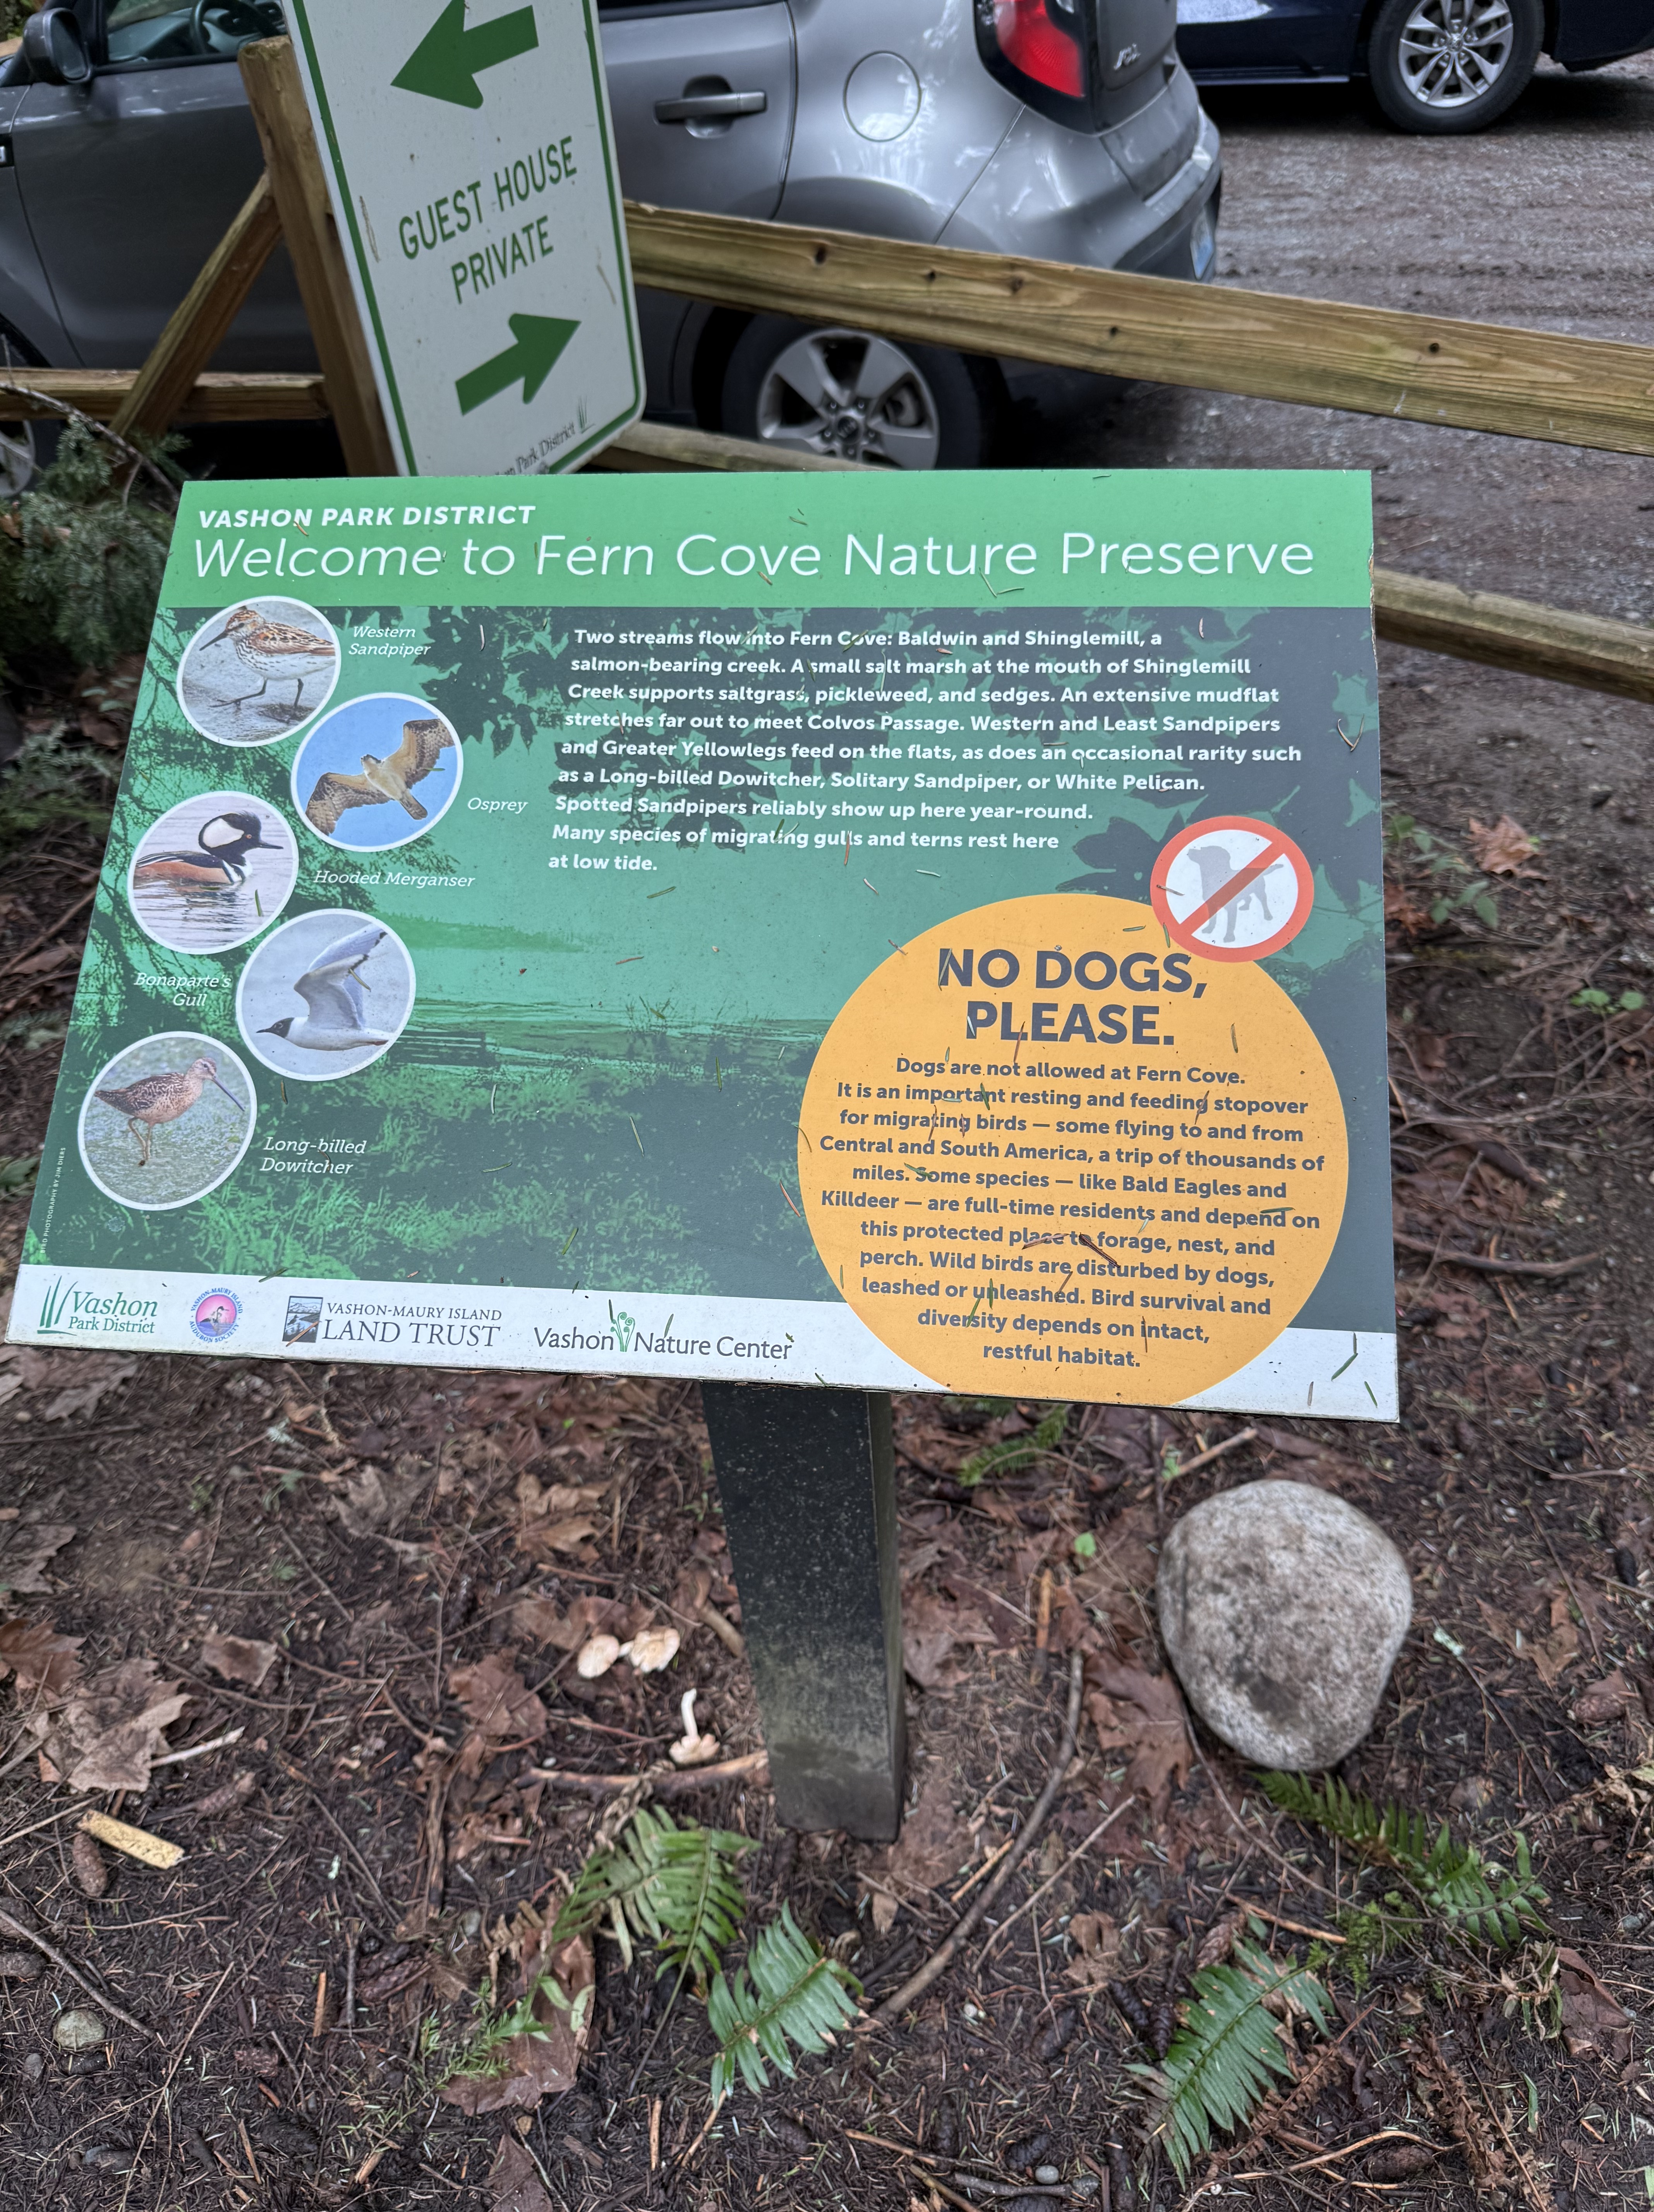
Vashon Island was logged out, so the beautiful evergreen forests that cover most of the island are all second growth. The state is trying to restore the original habitat, and Fern Cove is a good example; they don’t allow dogs!
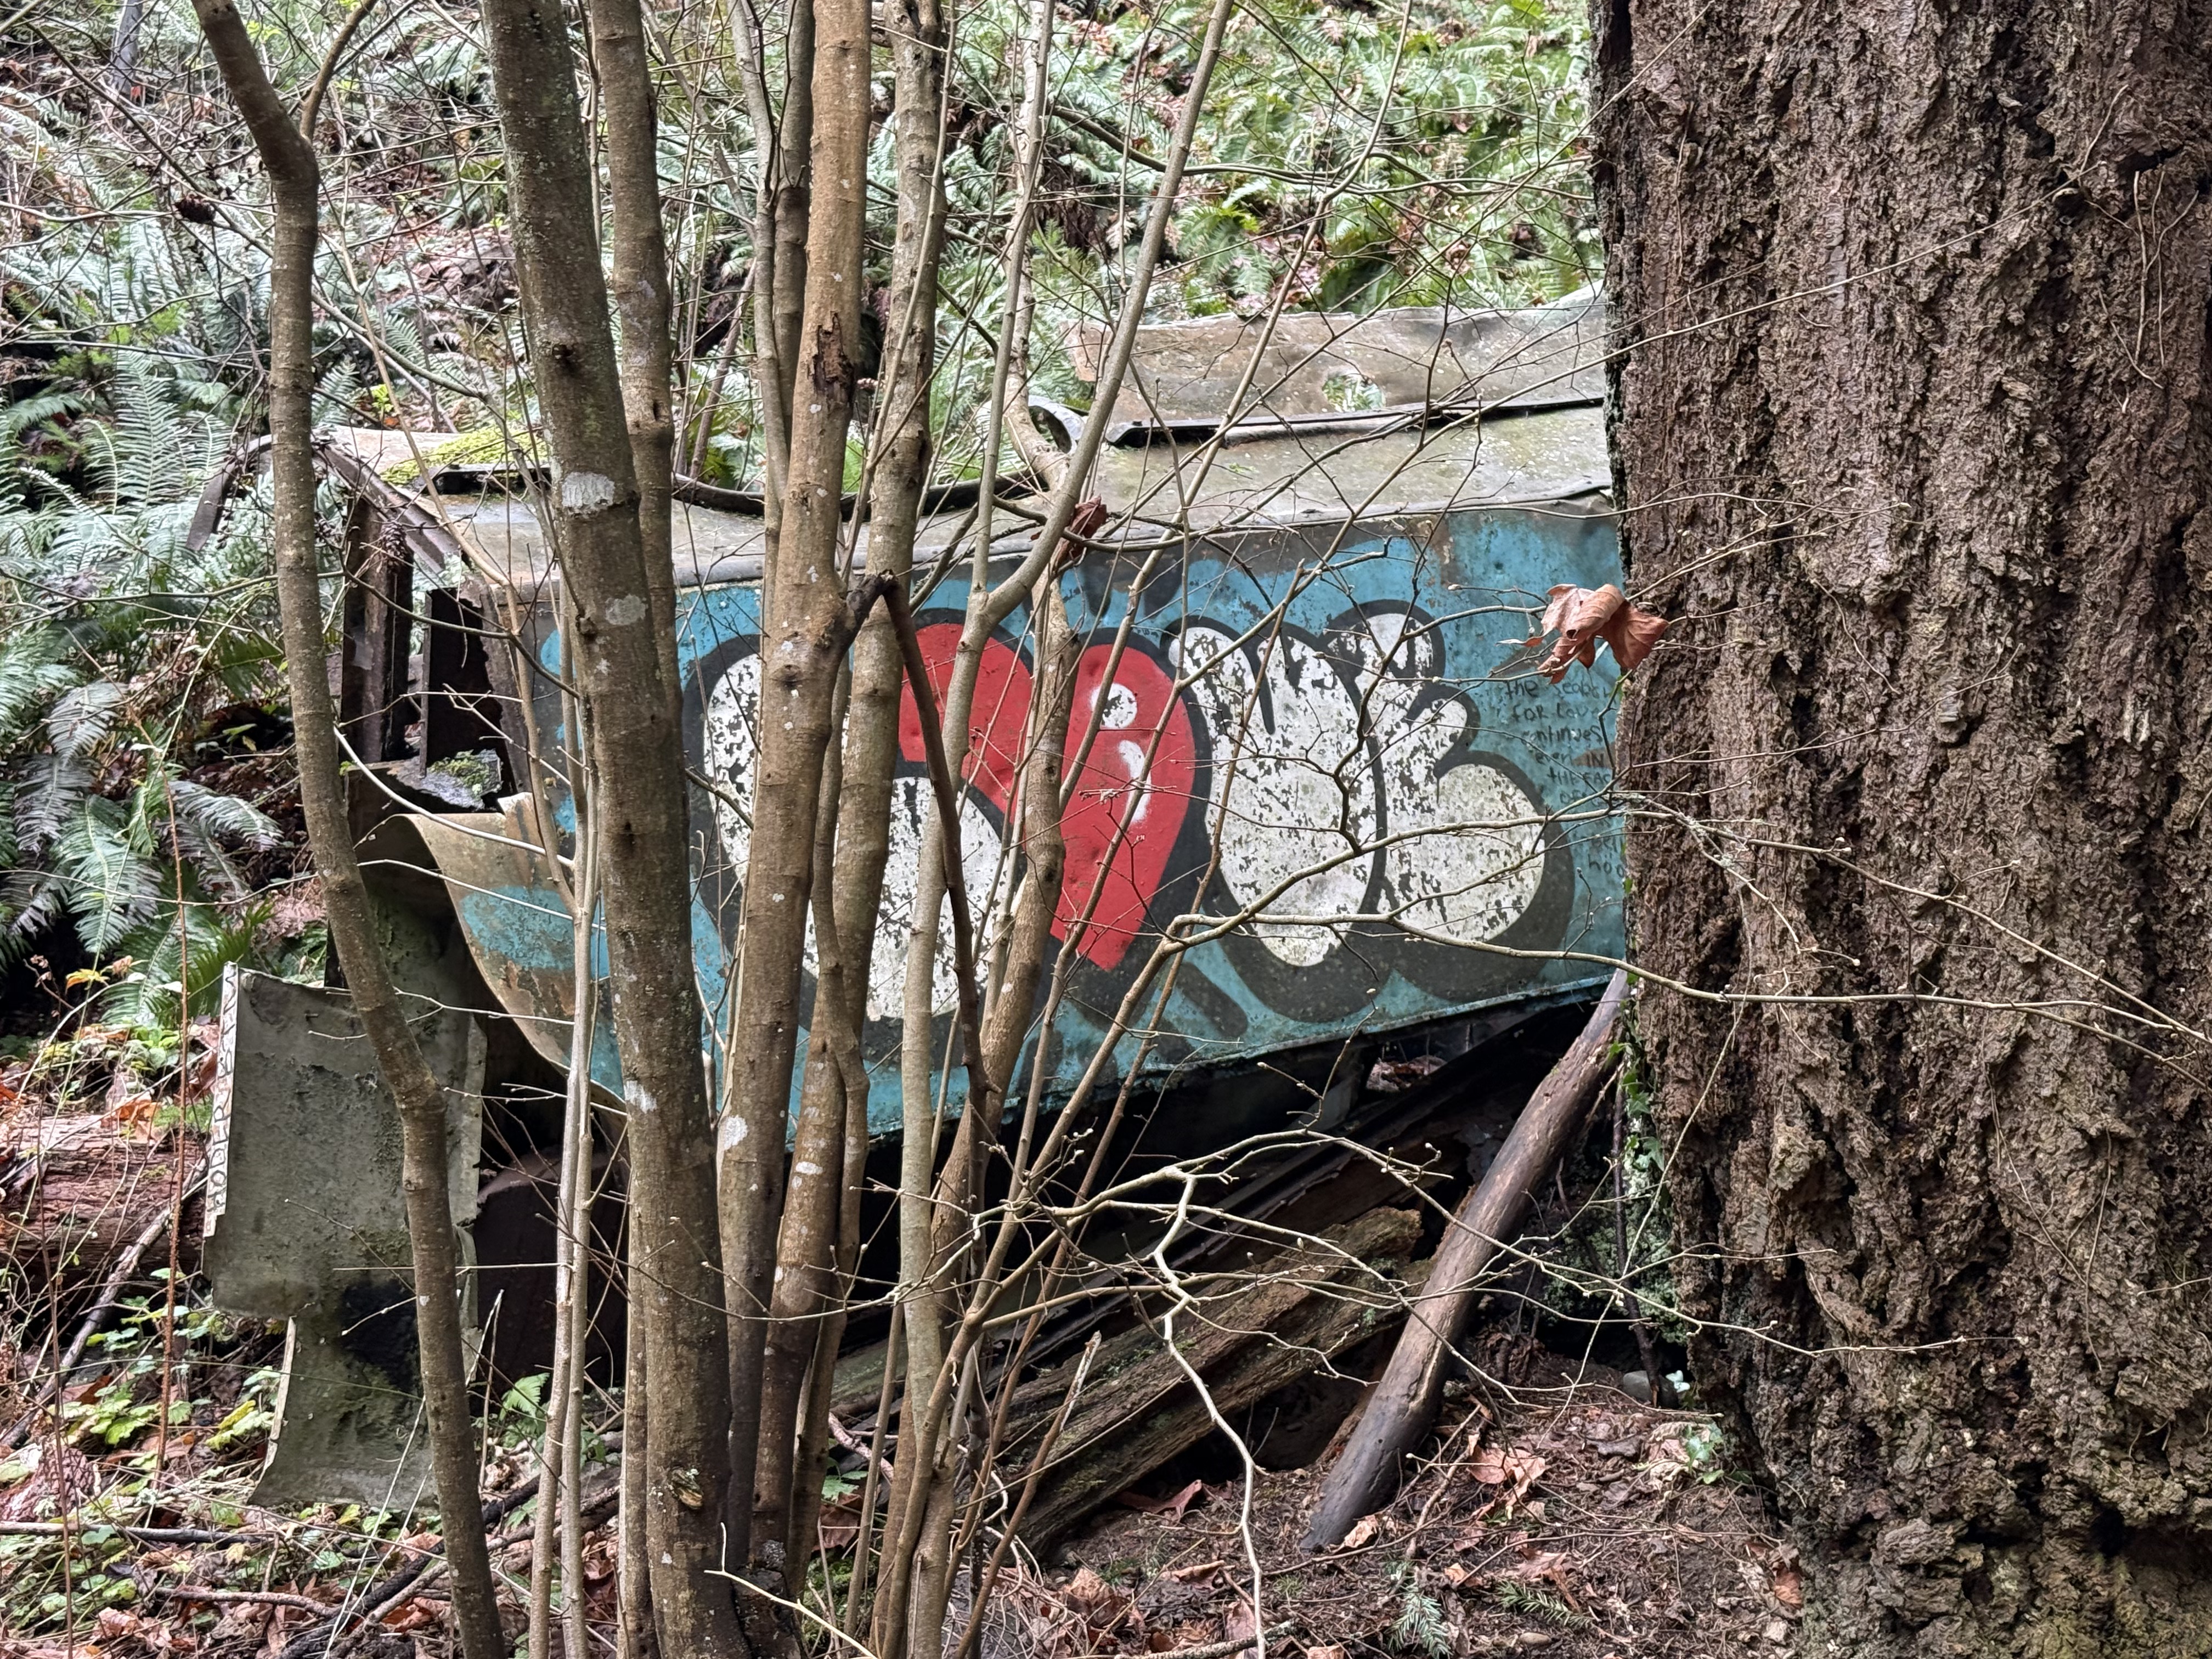
I’ve noticed that people in the Pacific Northwest (PNW) appreciate industrial art of a practical nature. I found an example here, in a threatened habitat that is actively being restored. I guess this old truck body isn’t hurting anything; I’ve also noticed that communities in the PNW don’t waste money on unnecessary actions.
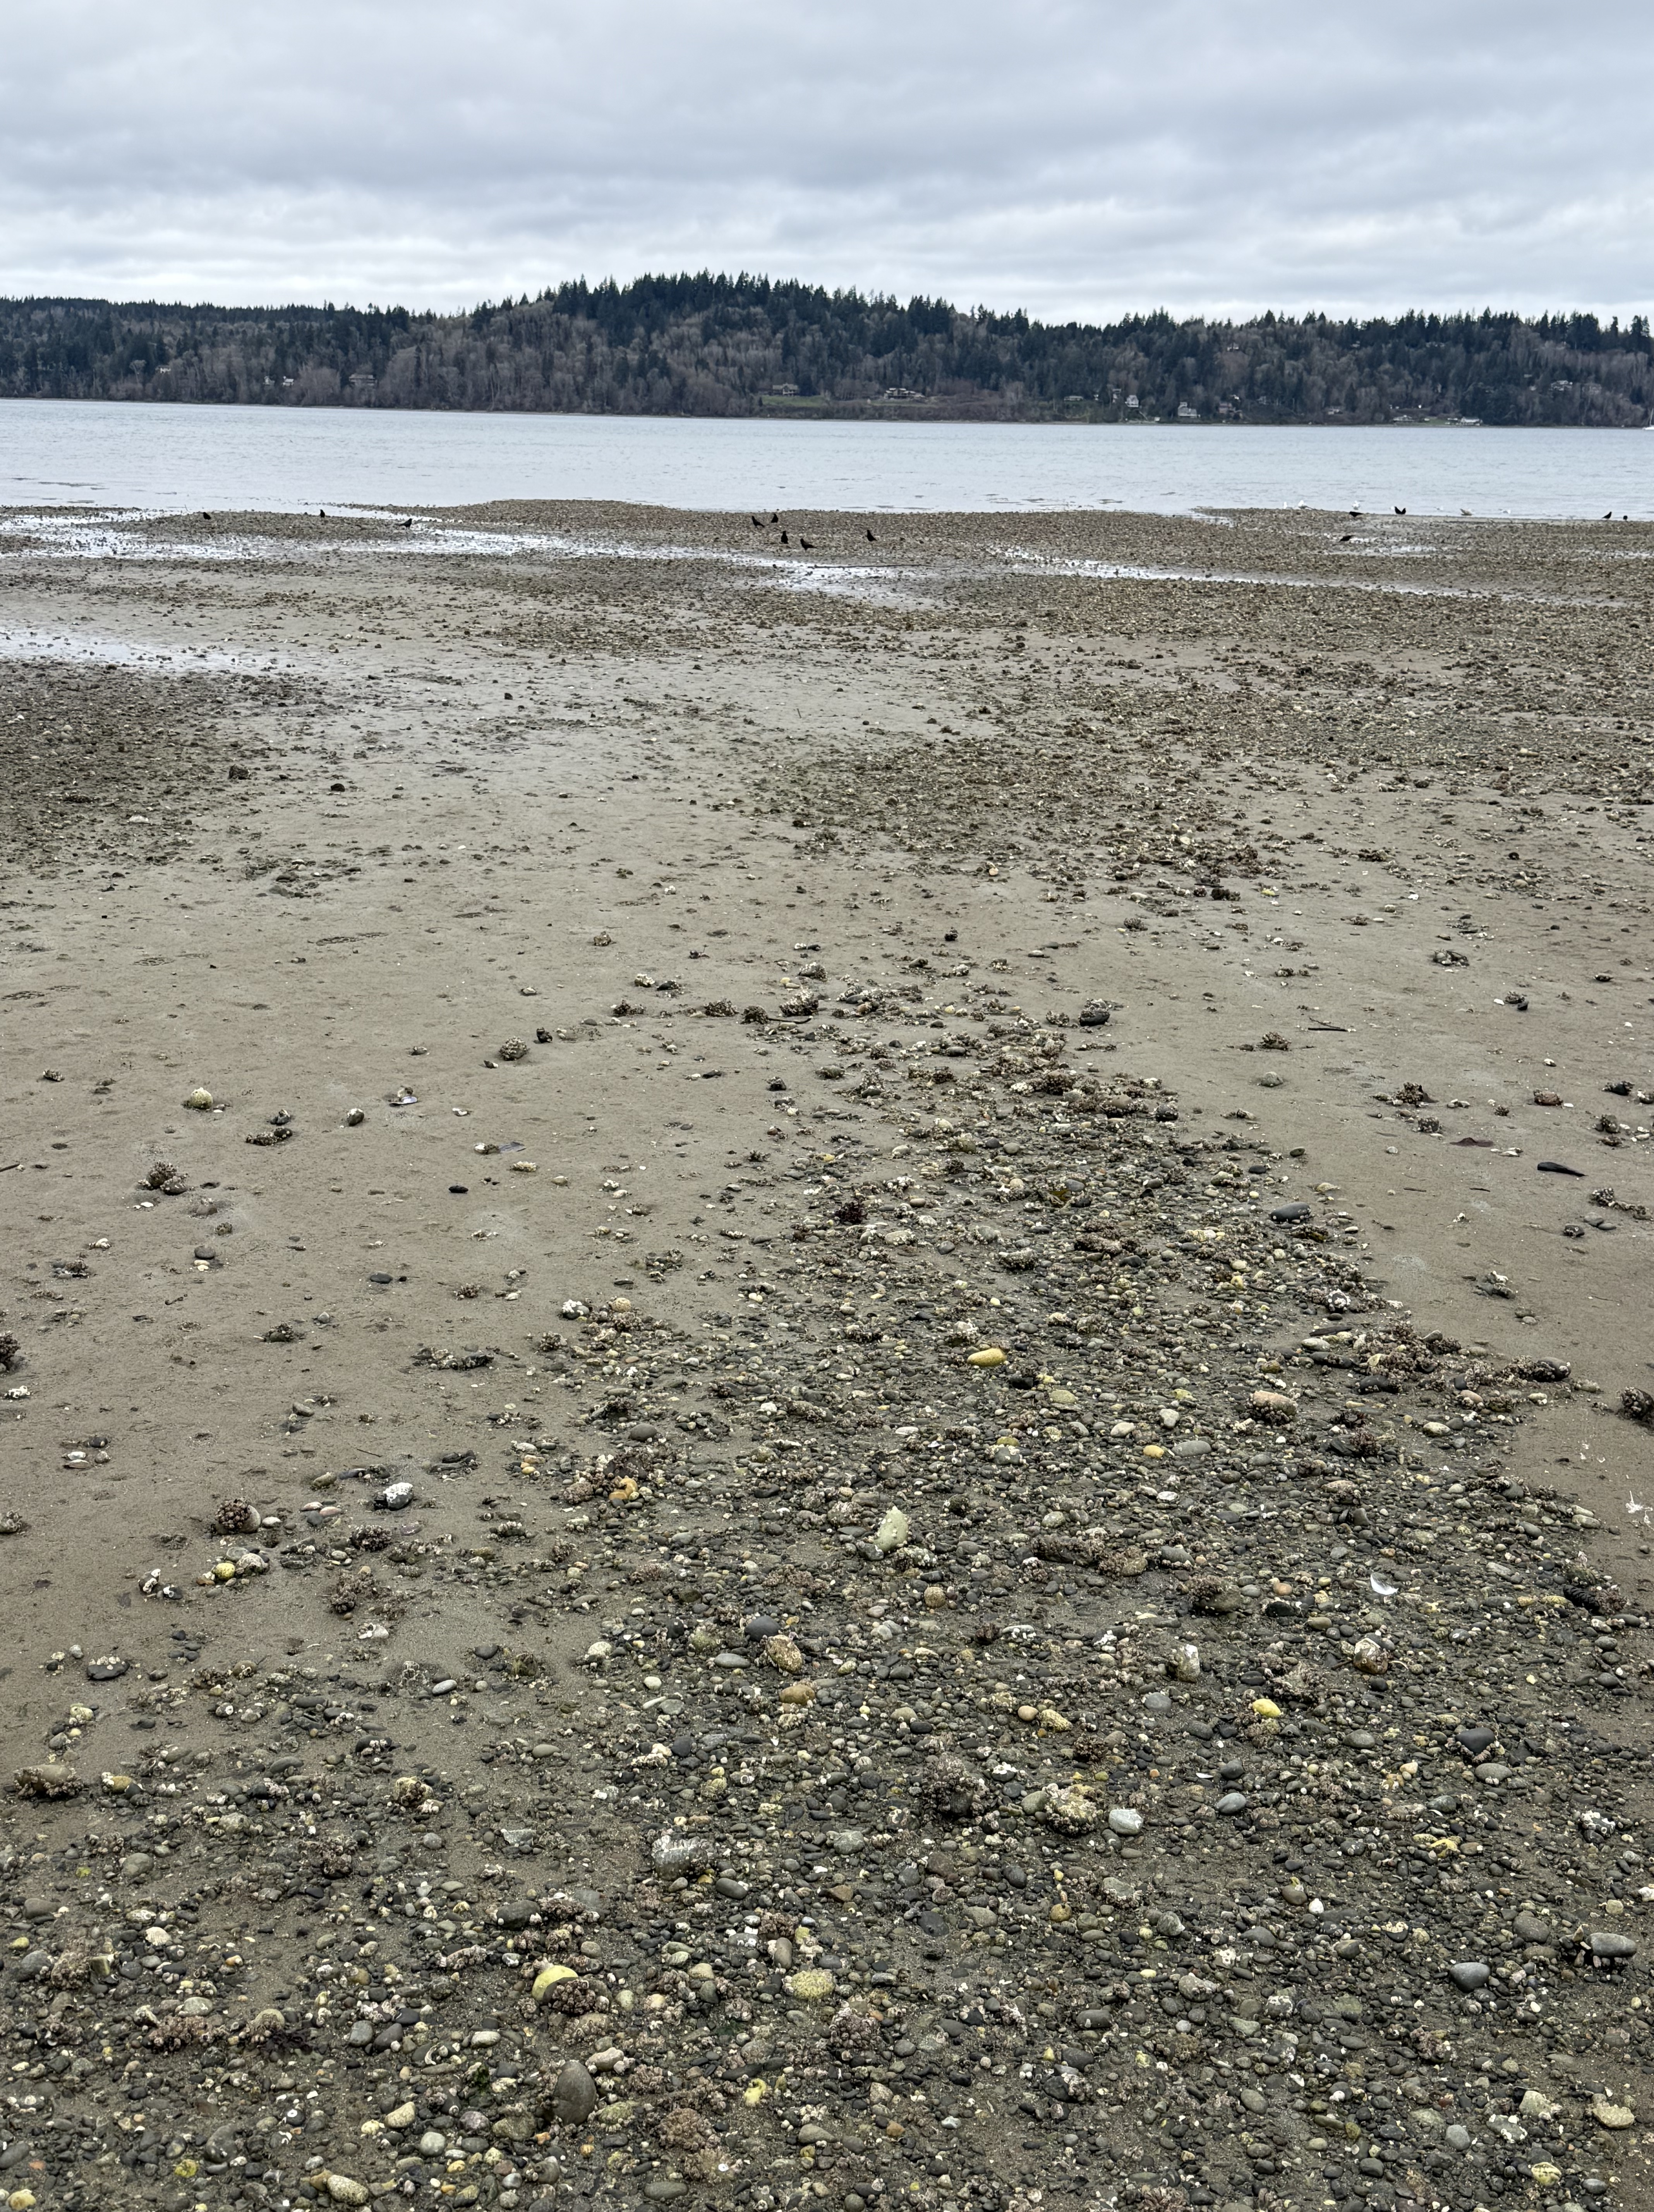
This photo shows how the gravel is localized within the delta, forming low nearshore gravel bars. The intervening areas are muddier than I found at Dash Point.
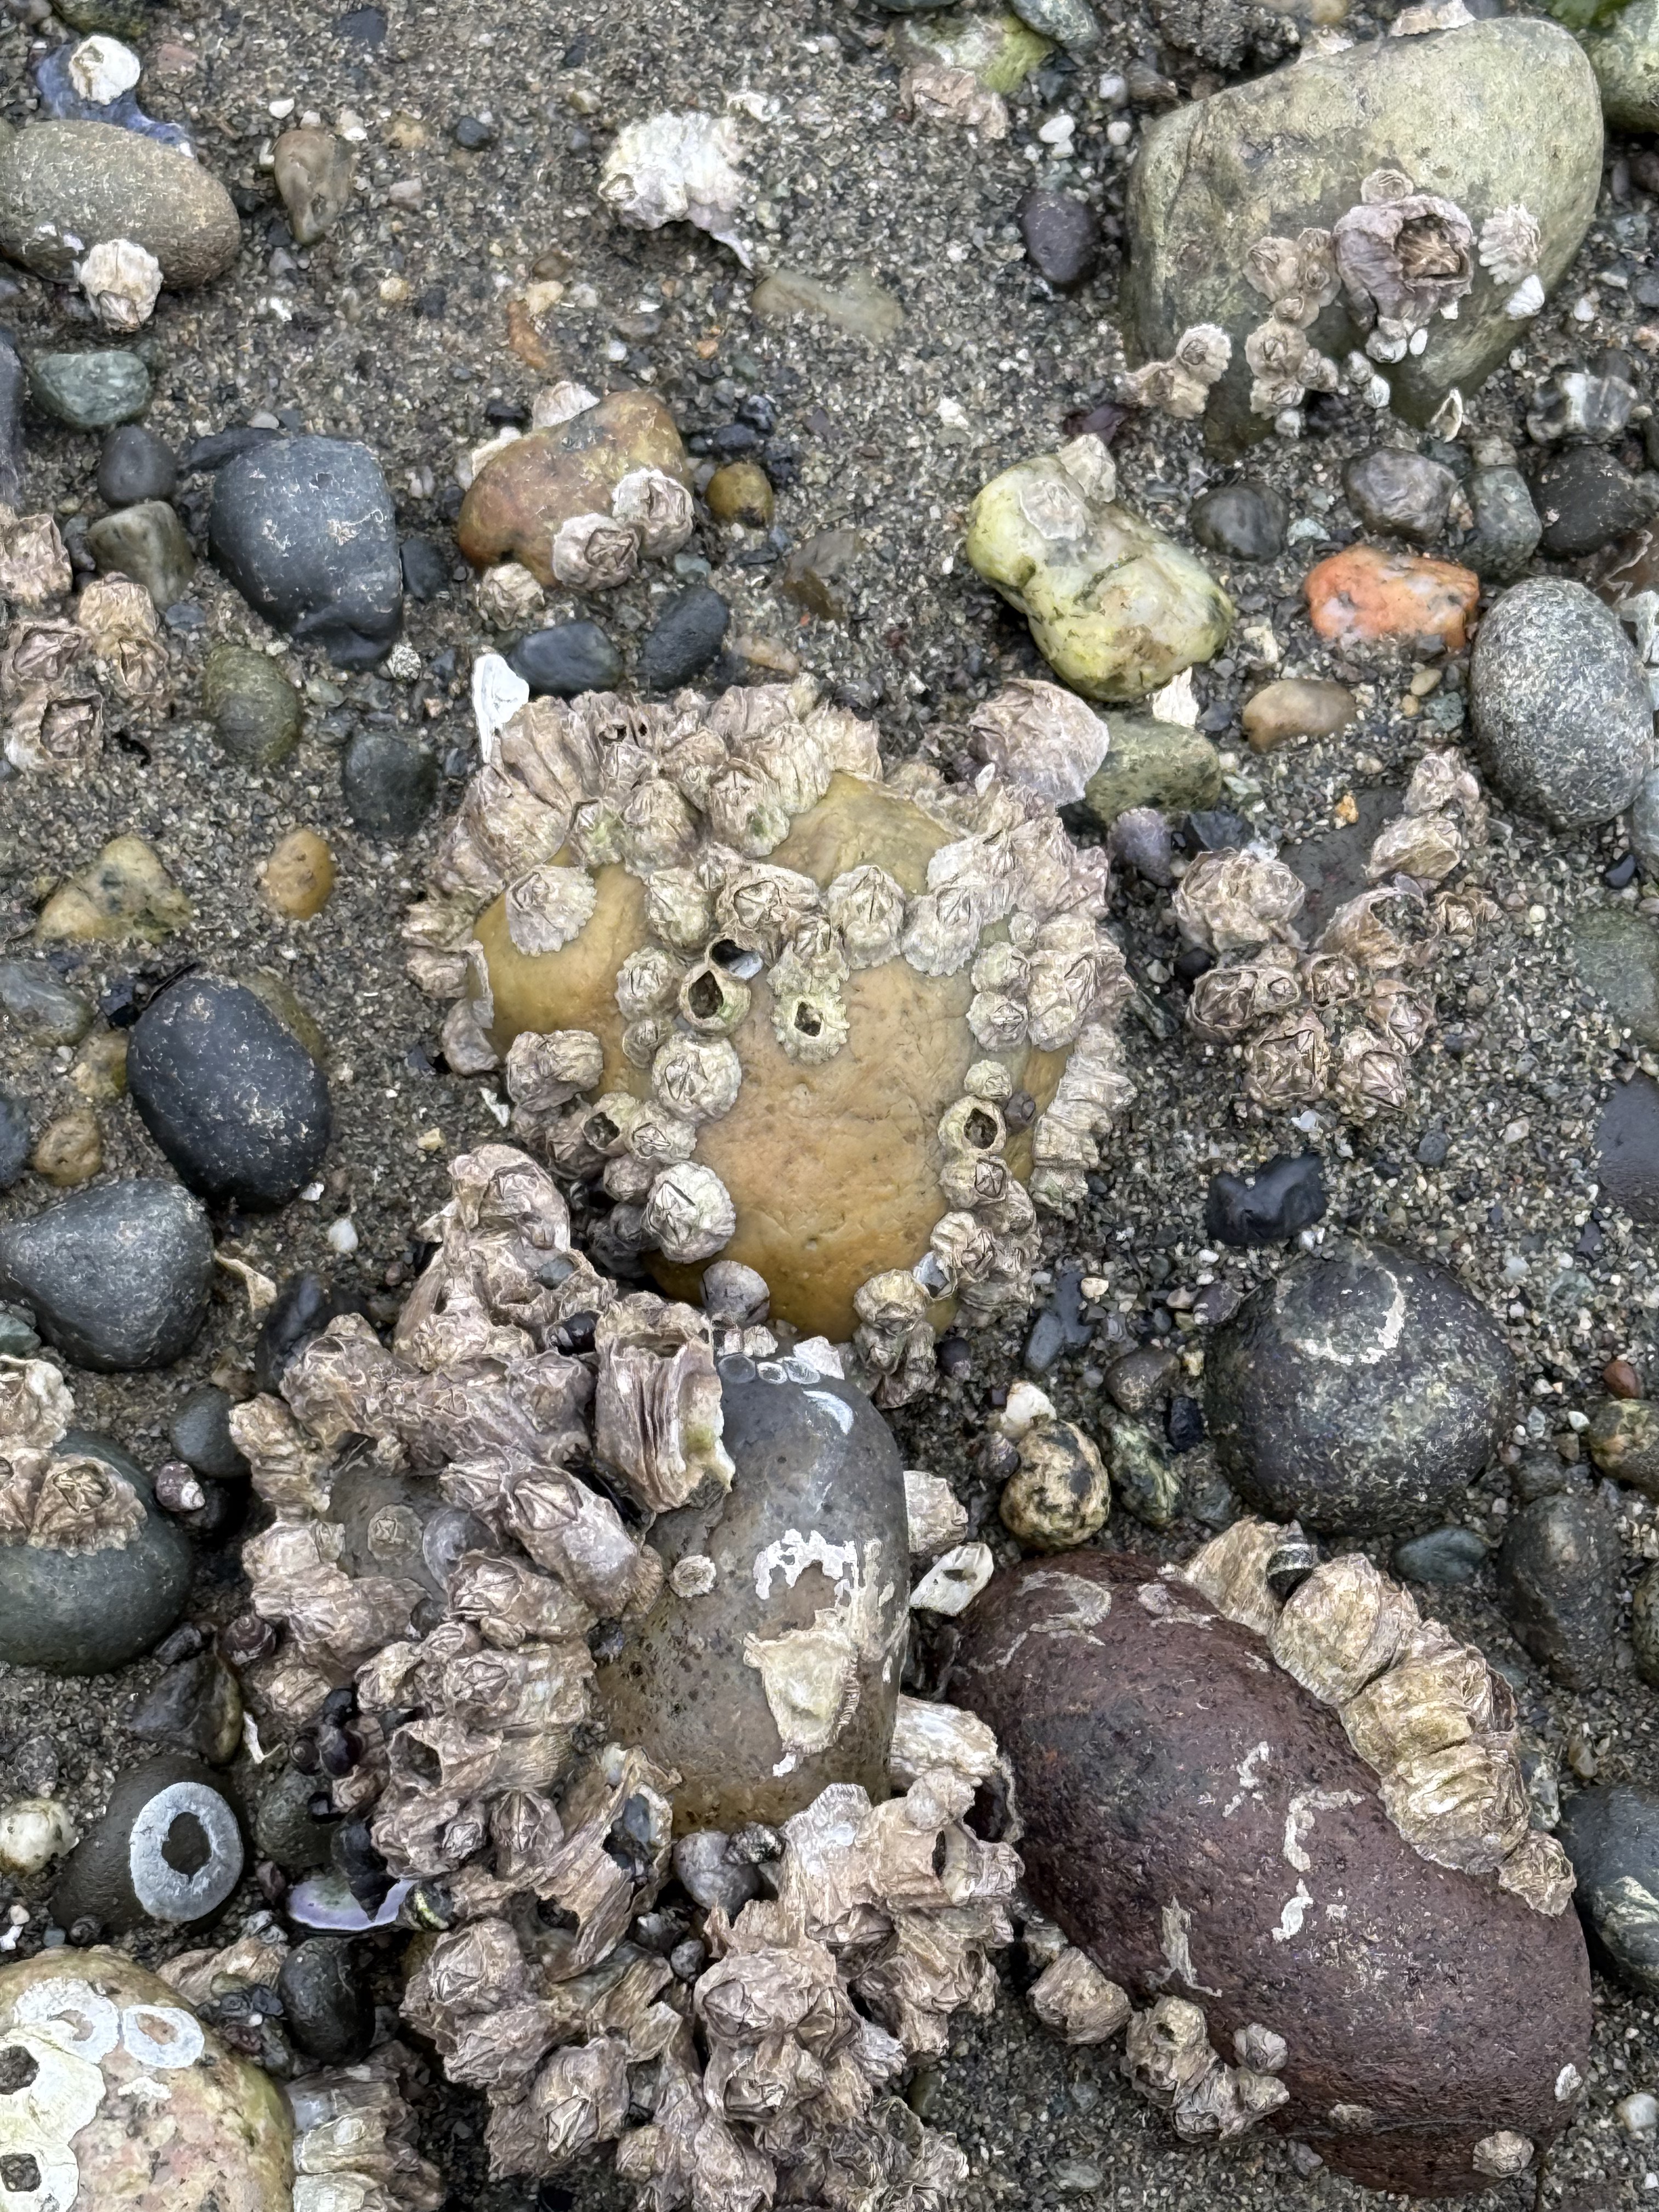
These gravel bars do more than concentrate larger rock fragments. Acorn barnacles encrust the larger ones, which are several inches in diameter. The tidal range is about 7 feet here and the beach is inundated twice daily, so I think these are living. I’ve seen barnacles on large boulders before, but I didn’t know they grew on stones. I guess the wave energy isn’t high enough to disturb them over a life cycle; their larvae must hang around after a storm and find a new rock to inhabit.
On all the beaches I’ve reported on for Rocks and (no) Roads, I’ve never seen this before. This is an active feeding area for sea birds. These are mussels, which the birds grab from a nearby mussel colony on the shallow delta front and drop on exposed gravel during low tide. The shells break open and the birds feast, leaving their dirty dishes behind.
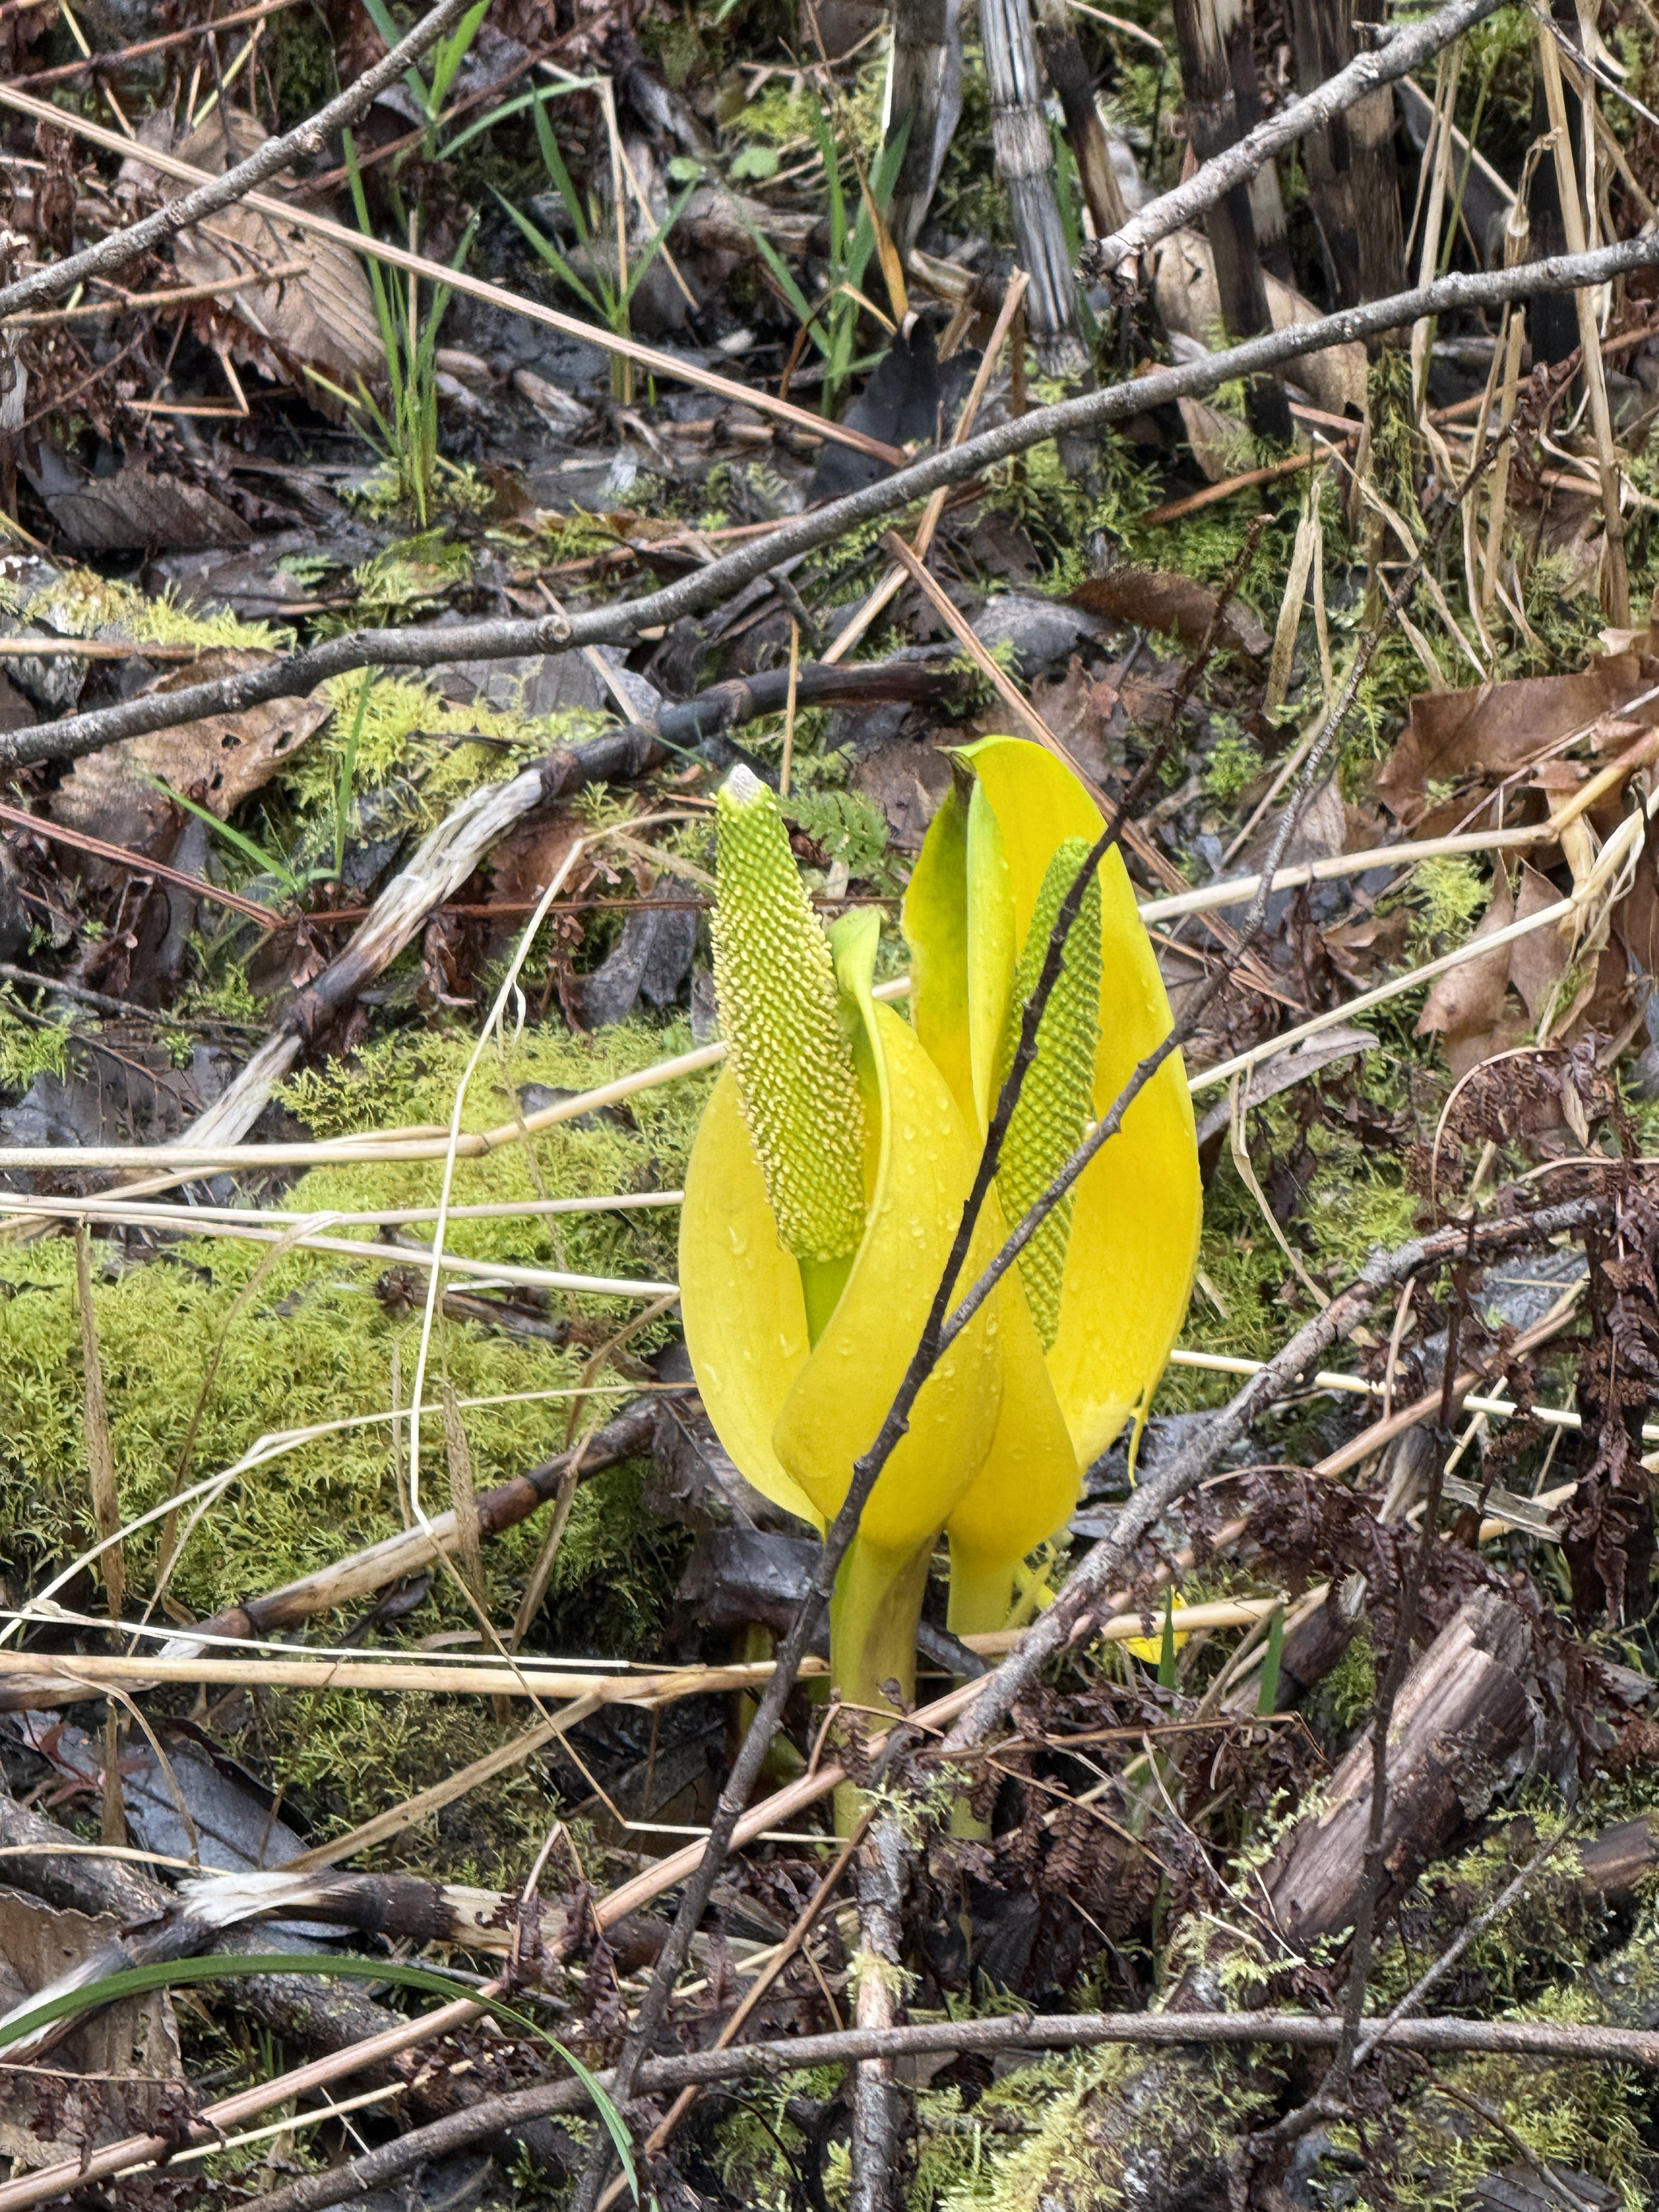
This Western skunk cabbage is just emerging from the wetland surrounding Shinglemill Creek. It will grow leaves up to two feet long, but it makes a beautiful display in the unseasonably warm late winter we’re having in the PNW.
Maury Island Marine Park
On the opposite side of Vashon Island, I visited a gravel quarry that operated for about seventy five years, before being purchased by the state as a park. This is another example of letting nature recover without interference.
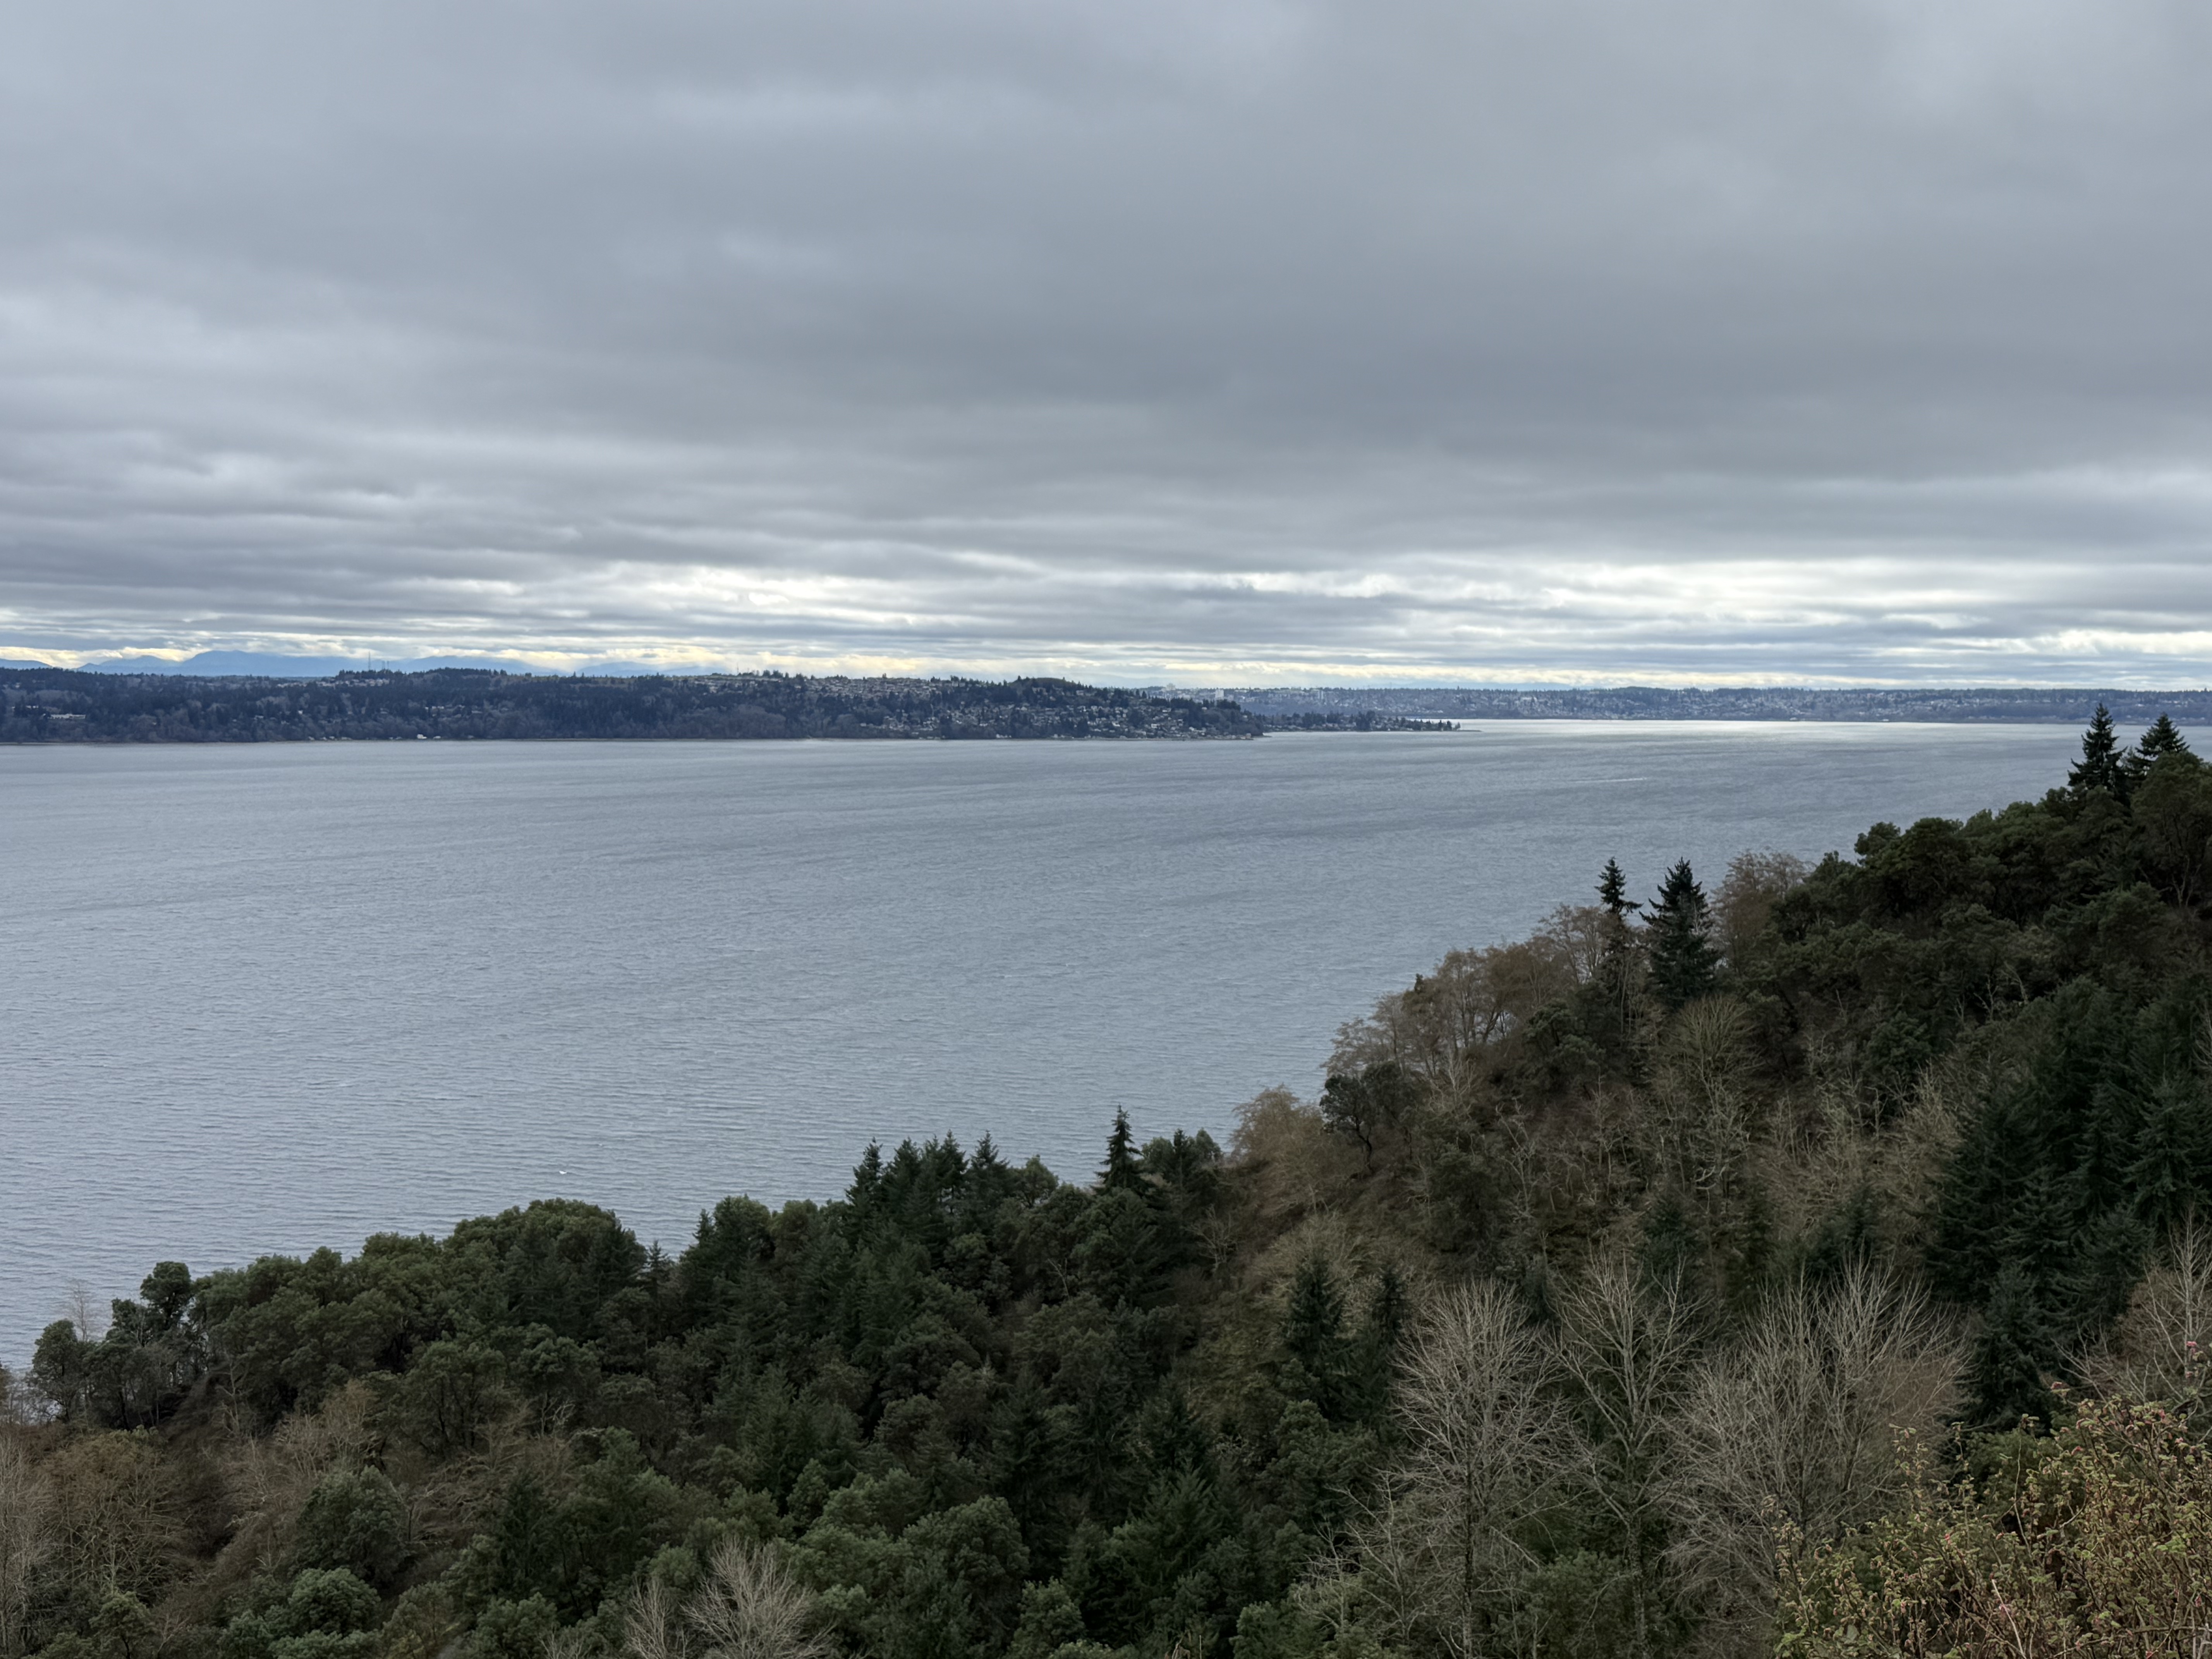
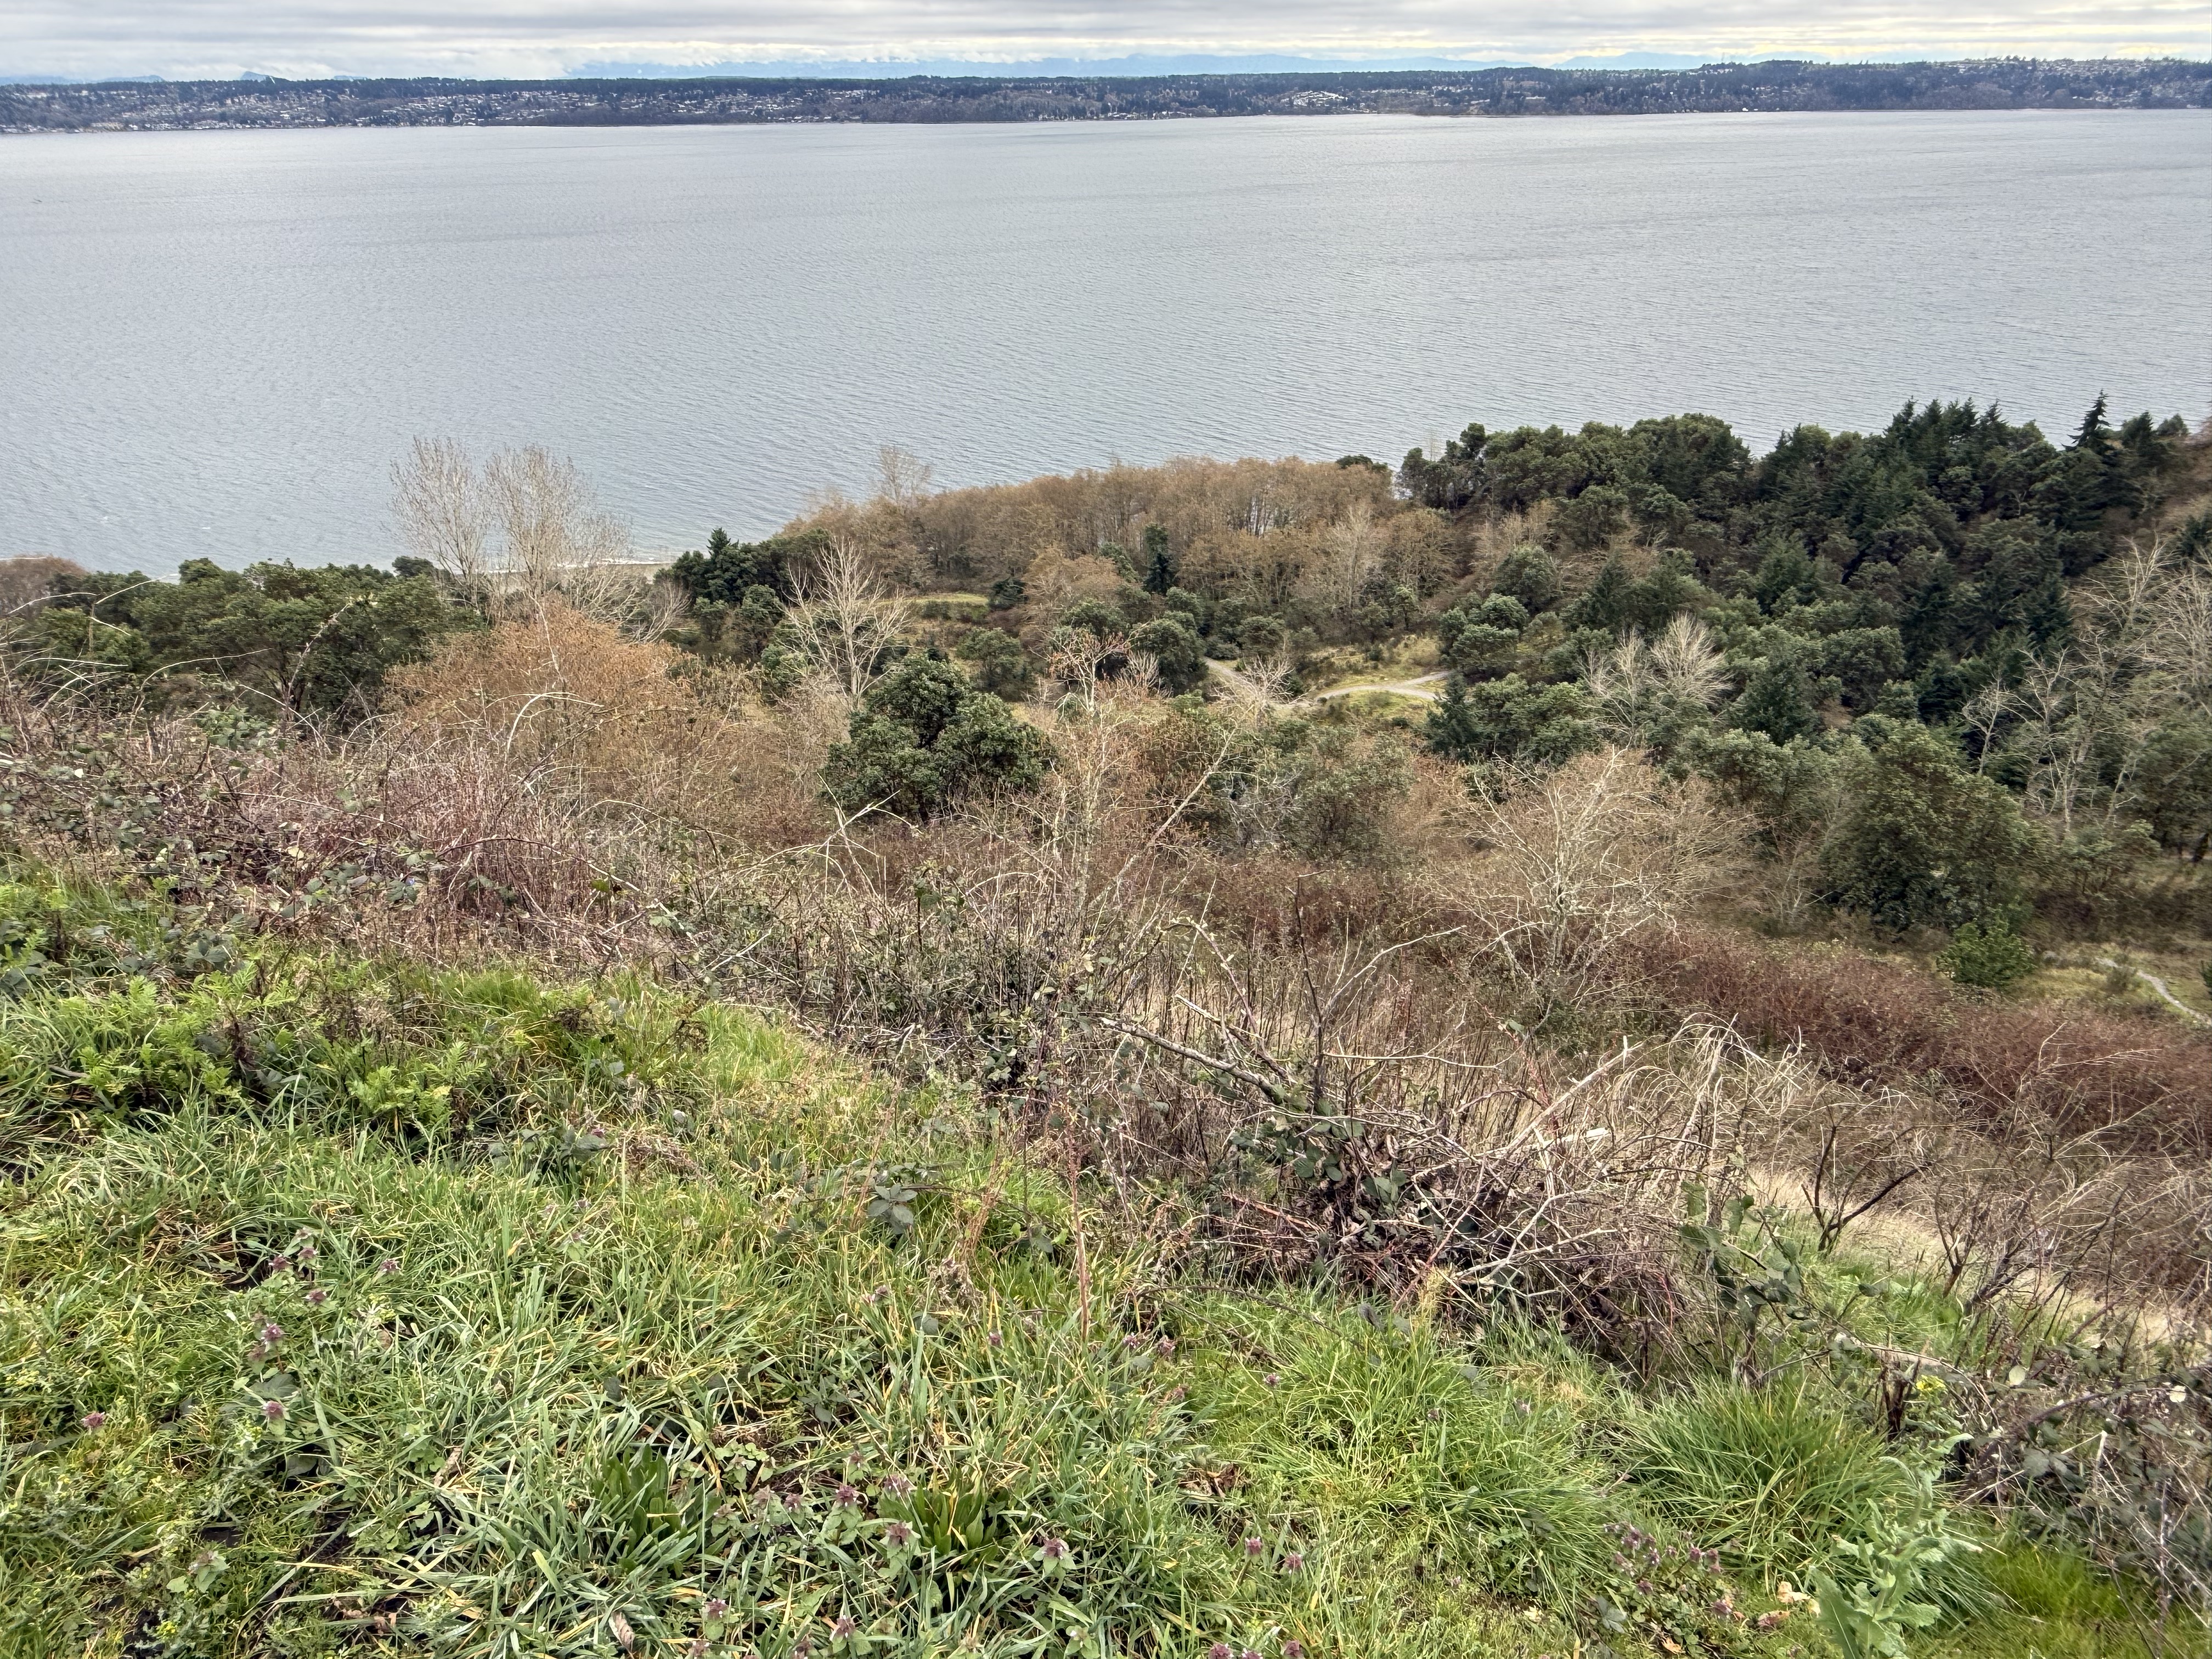
This photo looks SSE towards Dash Point. Commencement Bay and Tacoma are visible in the background; a little sunlight is shining on the bay. The cliff has been quarried for 75 years, so the 400-foot vertical face is now a steep incline with a trail that utilizes many switchbacks to reach the shoreline. Let’s see what I found…
There is no mud or sand visible on this beach. I thought that might be a side-effect of so much gravel quarrying, so I walked beyond the limit of the quarry; the substrate didn’t change, but there must be lingering effects after so many decades of preferential sand removal.
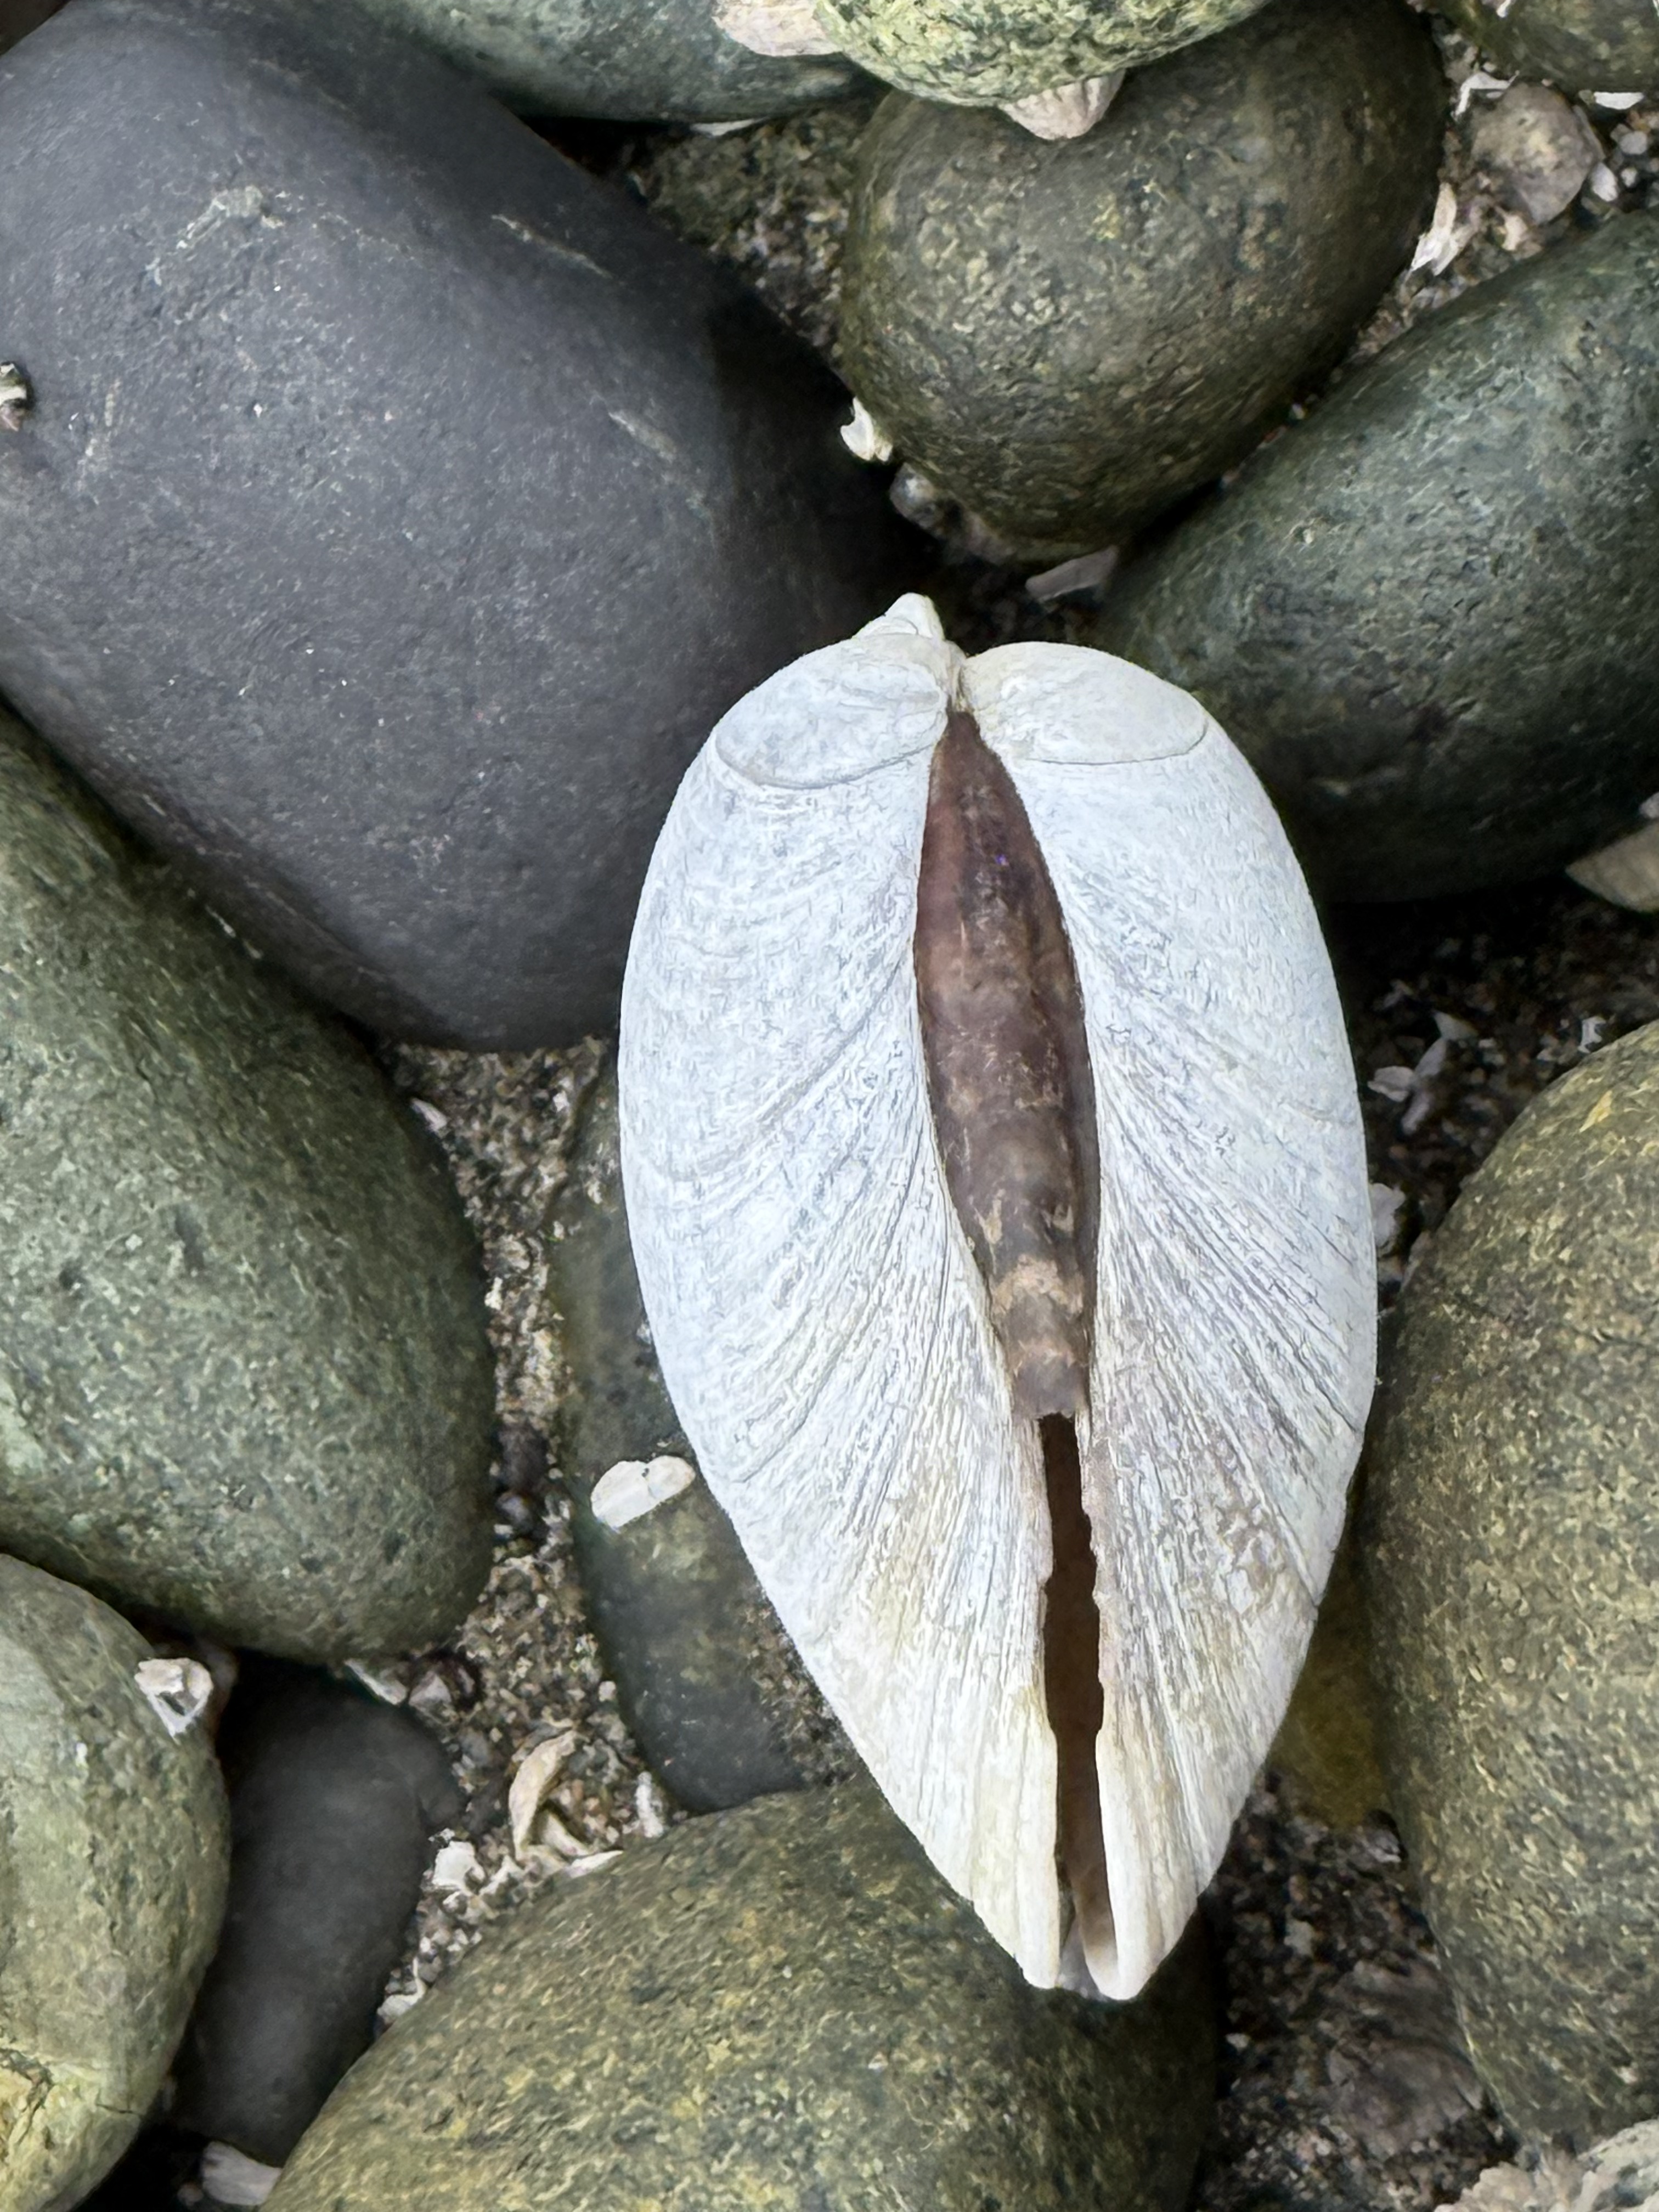
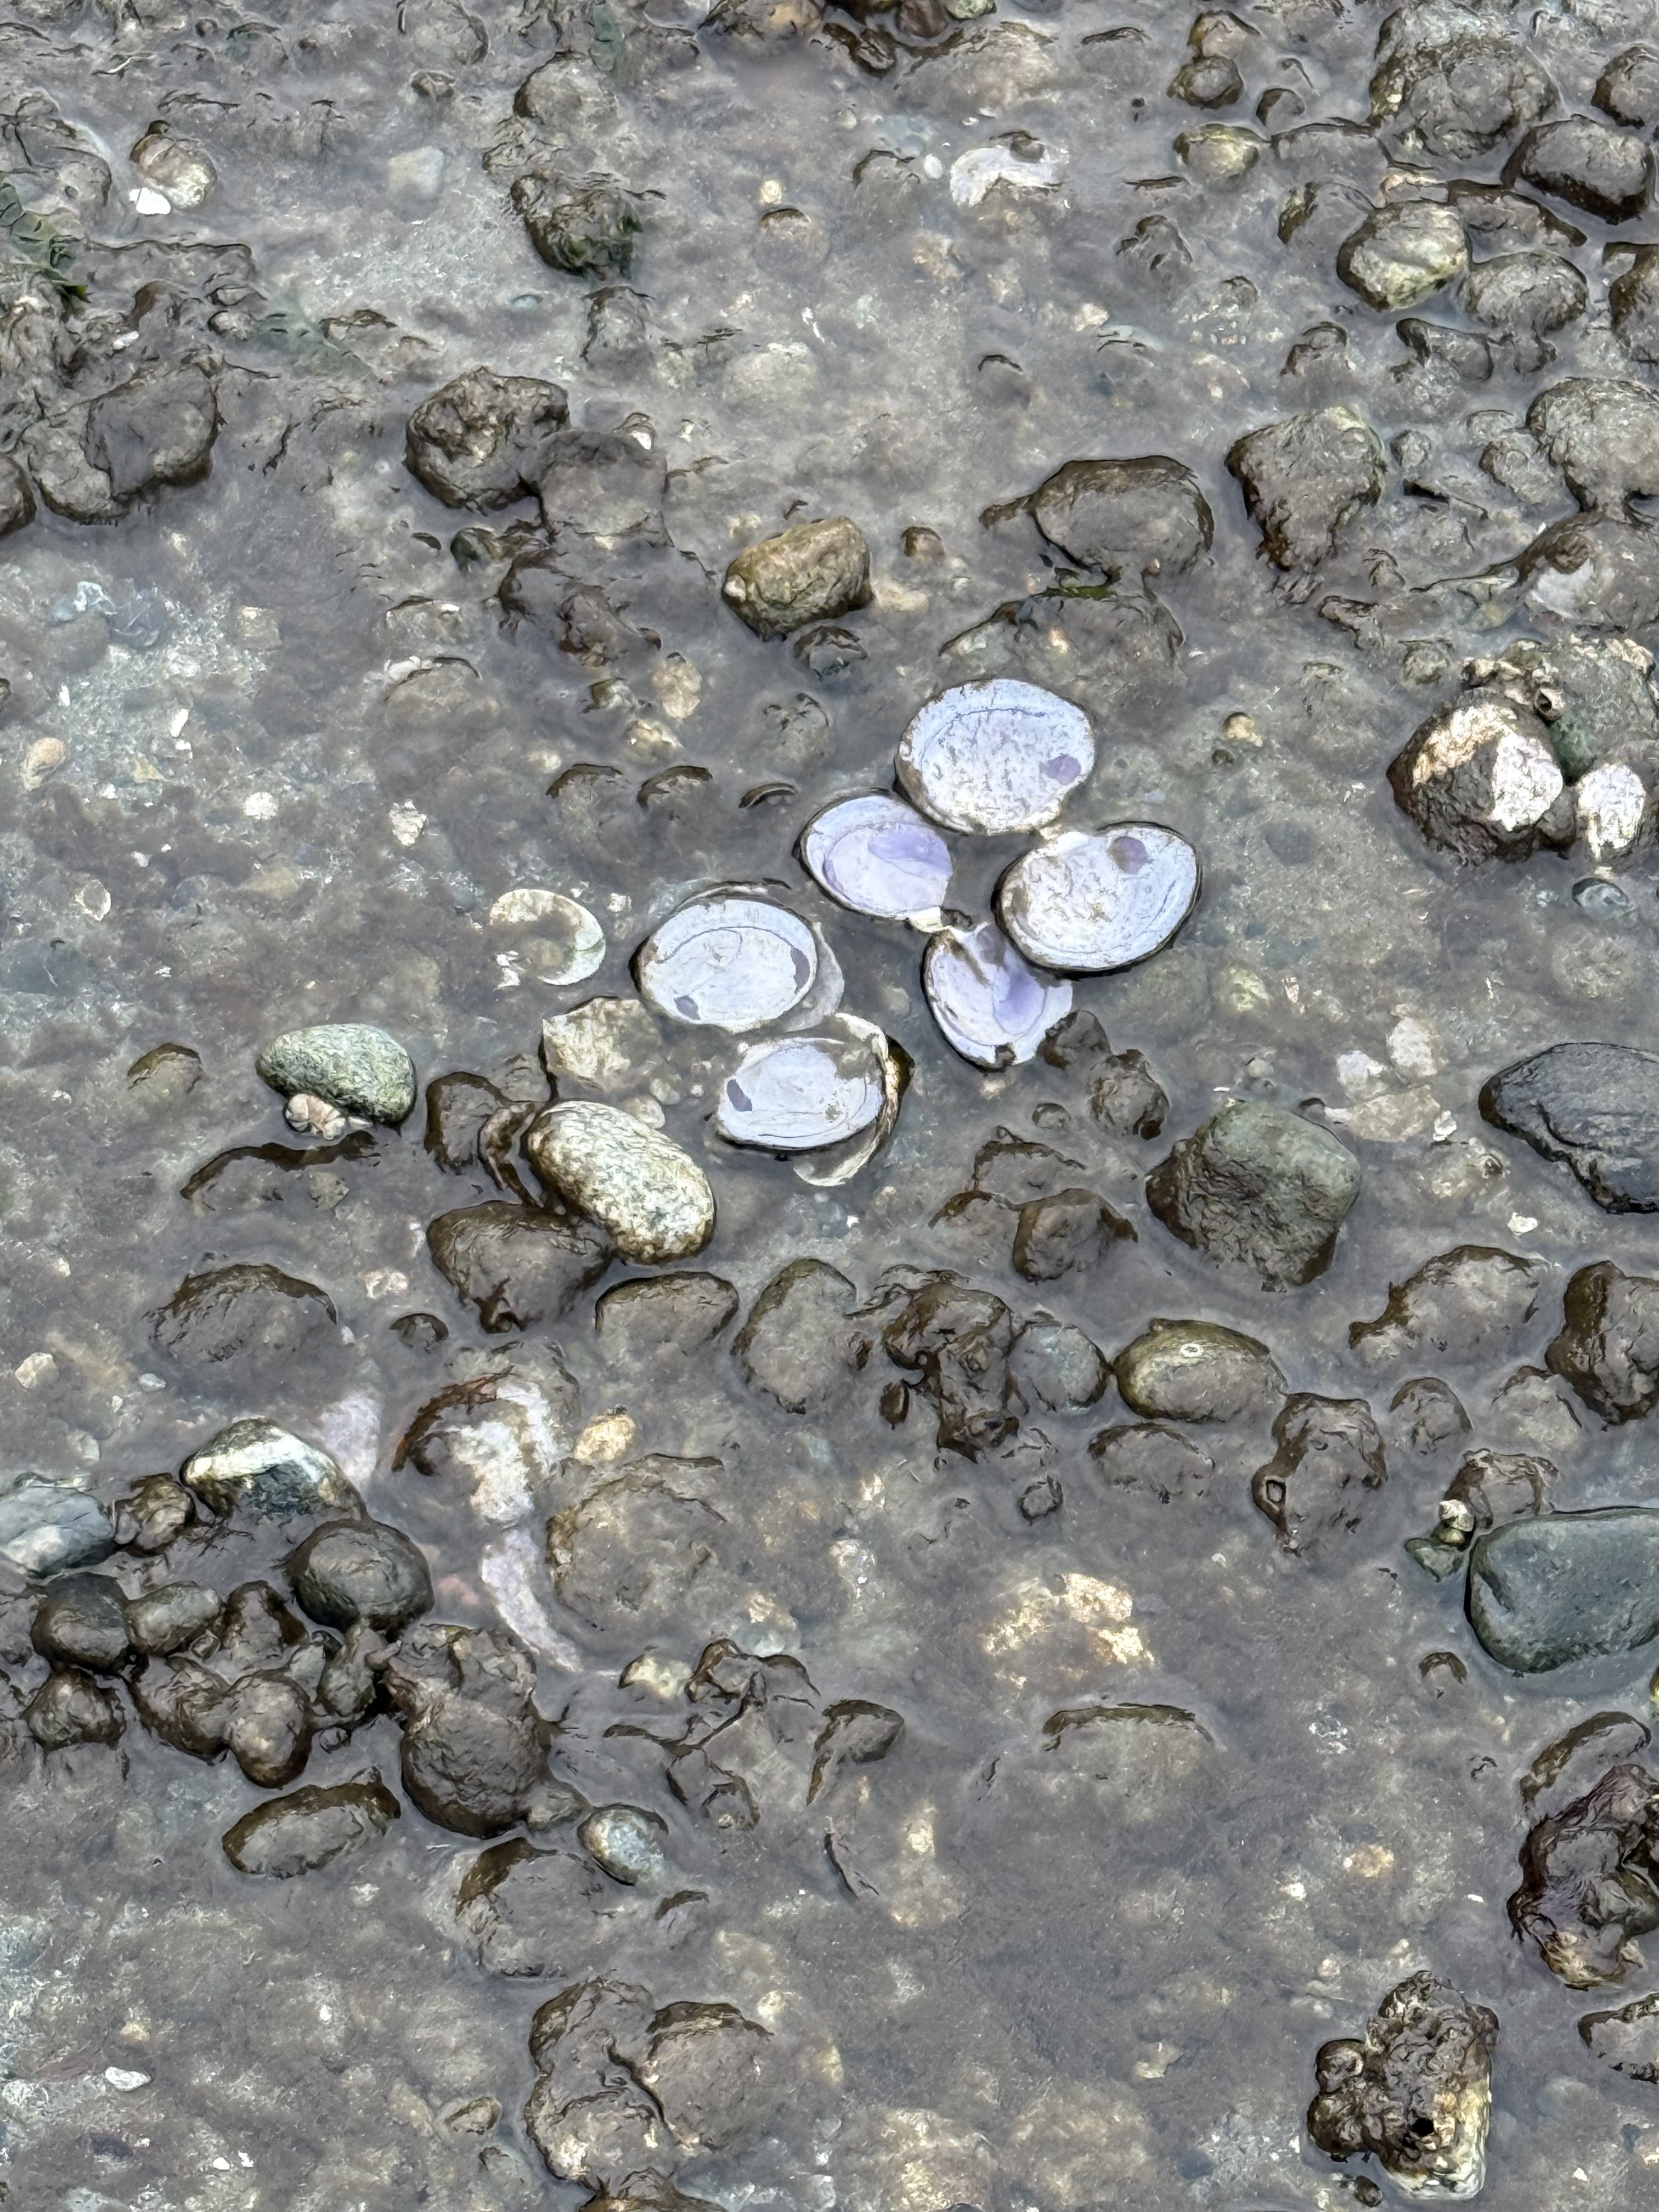
After what I saw at Fern Cove, I thought I was prepared for whatever I might find; but I never expected to see clam shells with the hinge lineament intact; this shell even closed after the bird (e.g. gull or crow) has eaten the soft tissue. The shell actually snapped shut after the animal was eaten. Amazing!
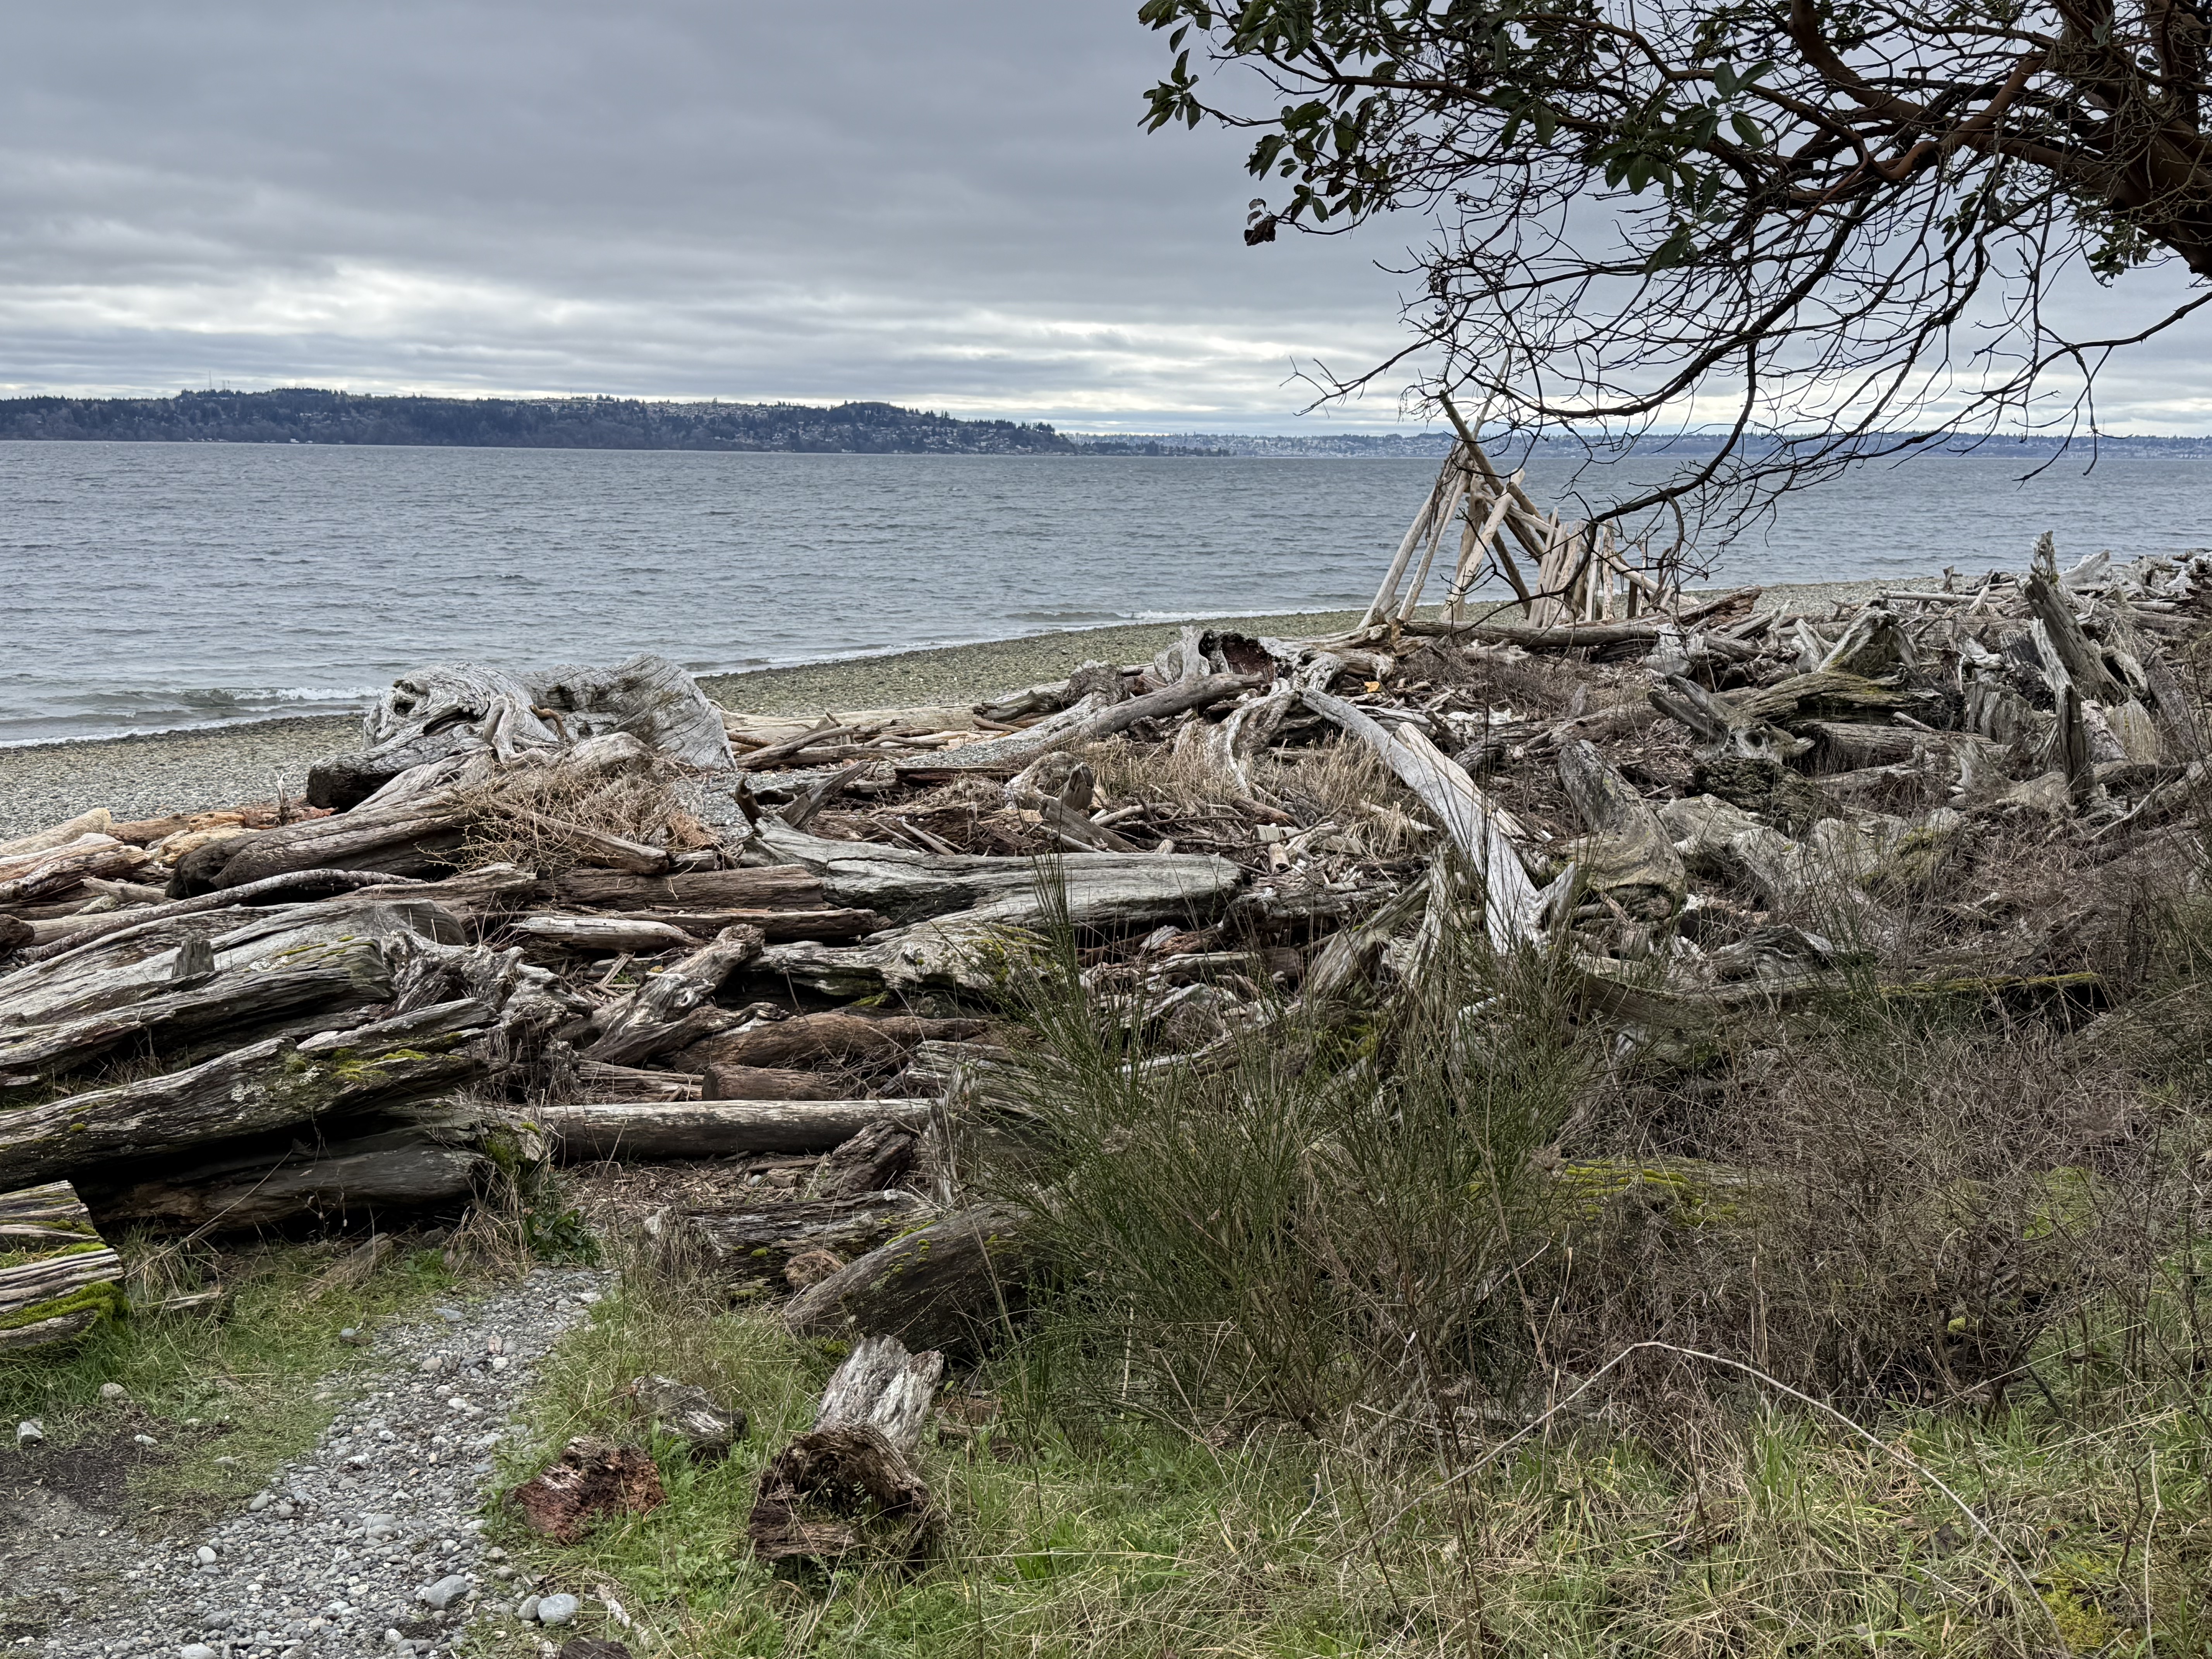
This spectacle gives driftwood a whole new meaning. Someone even built a crude shelter in the background from the logs that have collected over the years. There are a lot of trees in the PNW and many of them fall into Puget Sound, ending up all over the place. This looks like what coastal geologists might call a “hot spot”, a location where waves converge during storms.
After a hot climb, even in 45F temperatures, I made it back to the top of the cliff. This area was a barren wasteland in 1975, when the state took over; park authorities and volunteers have worked tirelessly to not only allow recovery, but to keep out invasive species. I think they’re doing a pretty good job.
Summary and Acknowledgments
I learned more biology on this day trip than in my entire life. For example, sea birds eat mussels on muddy beaches and clams on cobblestone ones. They carry the hard shells in the air and drop them on rocks, breaking them open to reveal the animal hiding within. Apparently I arrived at these two beaches just after lunch, when the tide hadn’t cleaned up the dishes yet.
I’m going to pay more attention to fauna and flora in my future posts.
I don’t know anything about biology, so all plants and animals identified in this post came from CoPilot (AKA ChatGPT). I didn’t check their identifications because it wasn’t worth the hours that would have required. This is not a research paper. I’m just going out into the world and observing through my dirty, discolored glasses.
But now I can see living things…
Pinnacle Peak Park: Miocene Andesitic Volcanism
Introduction.
This post examines some of the rocks we discovered while climbing Pinnacle Peak (Fig. 1), a small shield volcano created during the Miocene epoch, between 23 and 5.3 Ma (millions of years ago determined by radiometric dating). The wide range of dates suggests that this volcano remained active for a very long time, producing volcanic material of different types as it released pressure from the magma chamber feeding it. I can’t pin down the dates any better, although they are better known within the geological literature. Thus, my discussion and the model that follows are meant to apply to the entire period of activity.
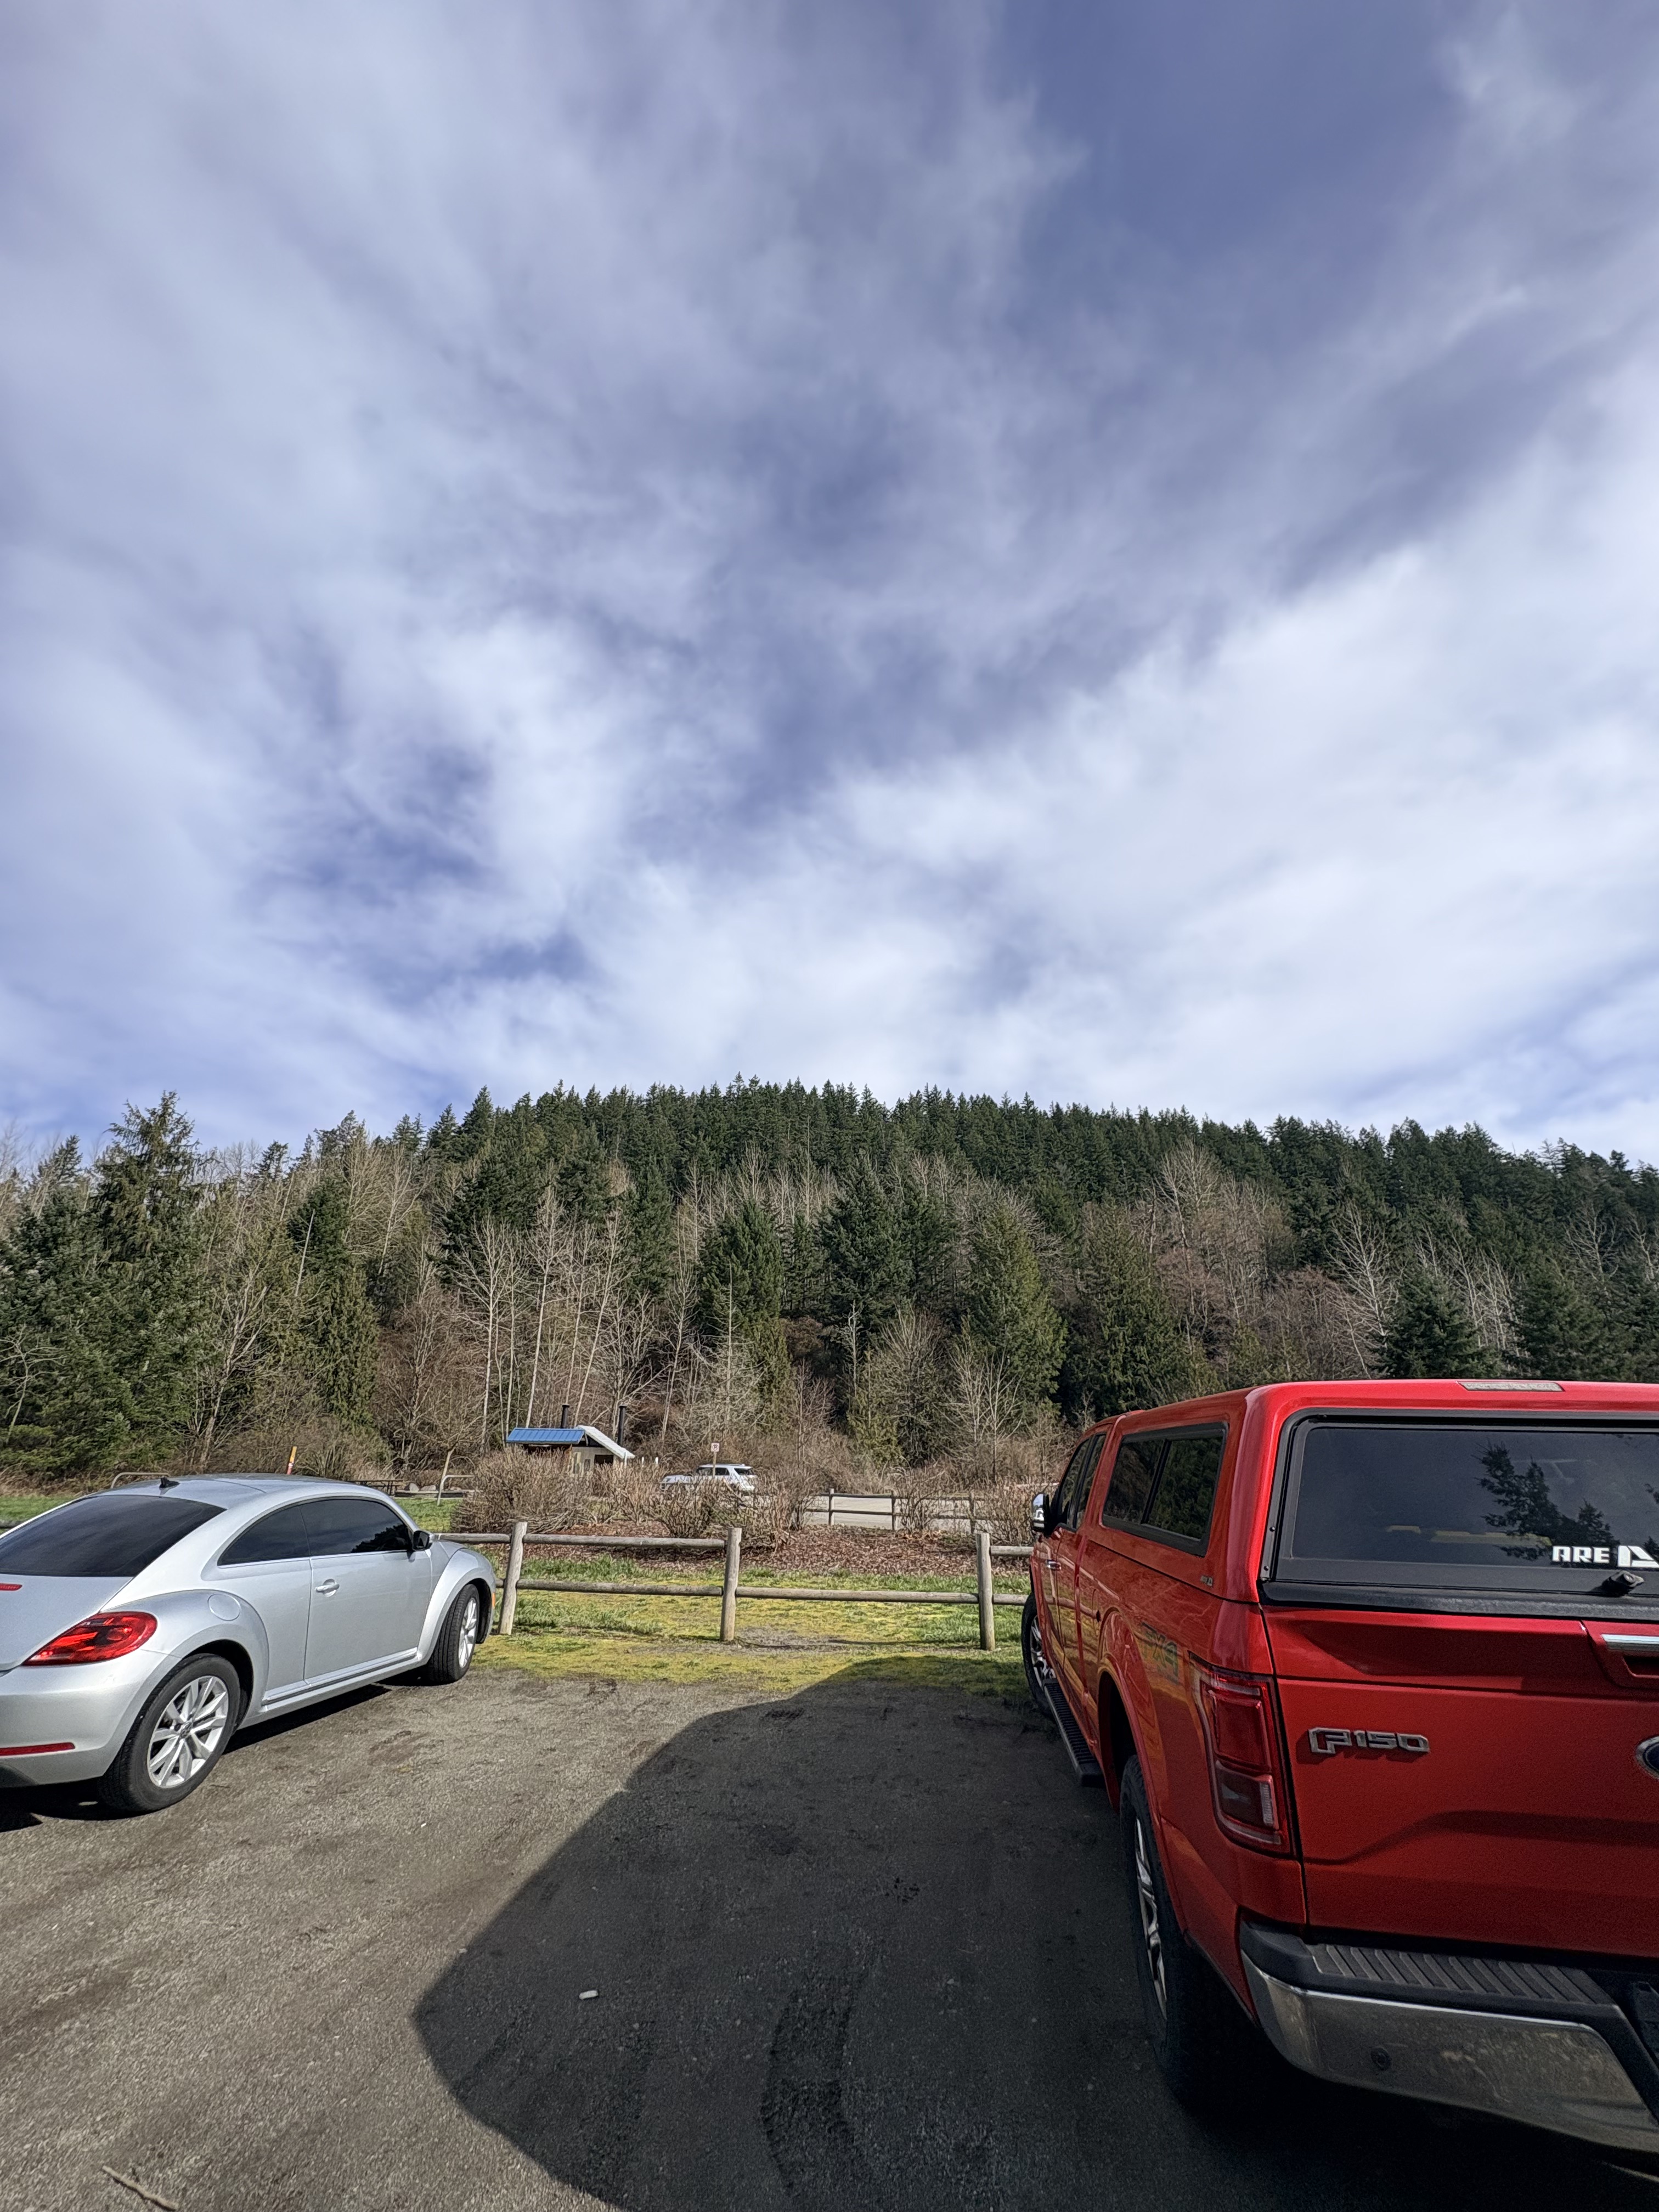
Figure 1. Pinnacle Peak is about 1000 feet in height. This photo reveals the characteristic low profile of a shield volcano, making it appear smaller because the summit is more than a mile distant; however, note that it is slightly asymmetrical because the southern (right side) slope is lower than the north side.
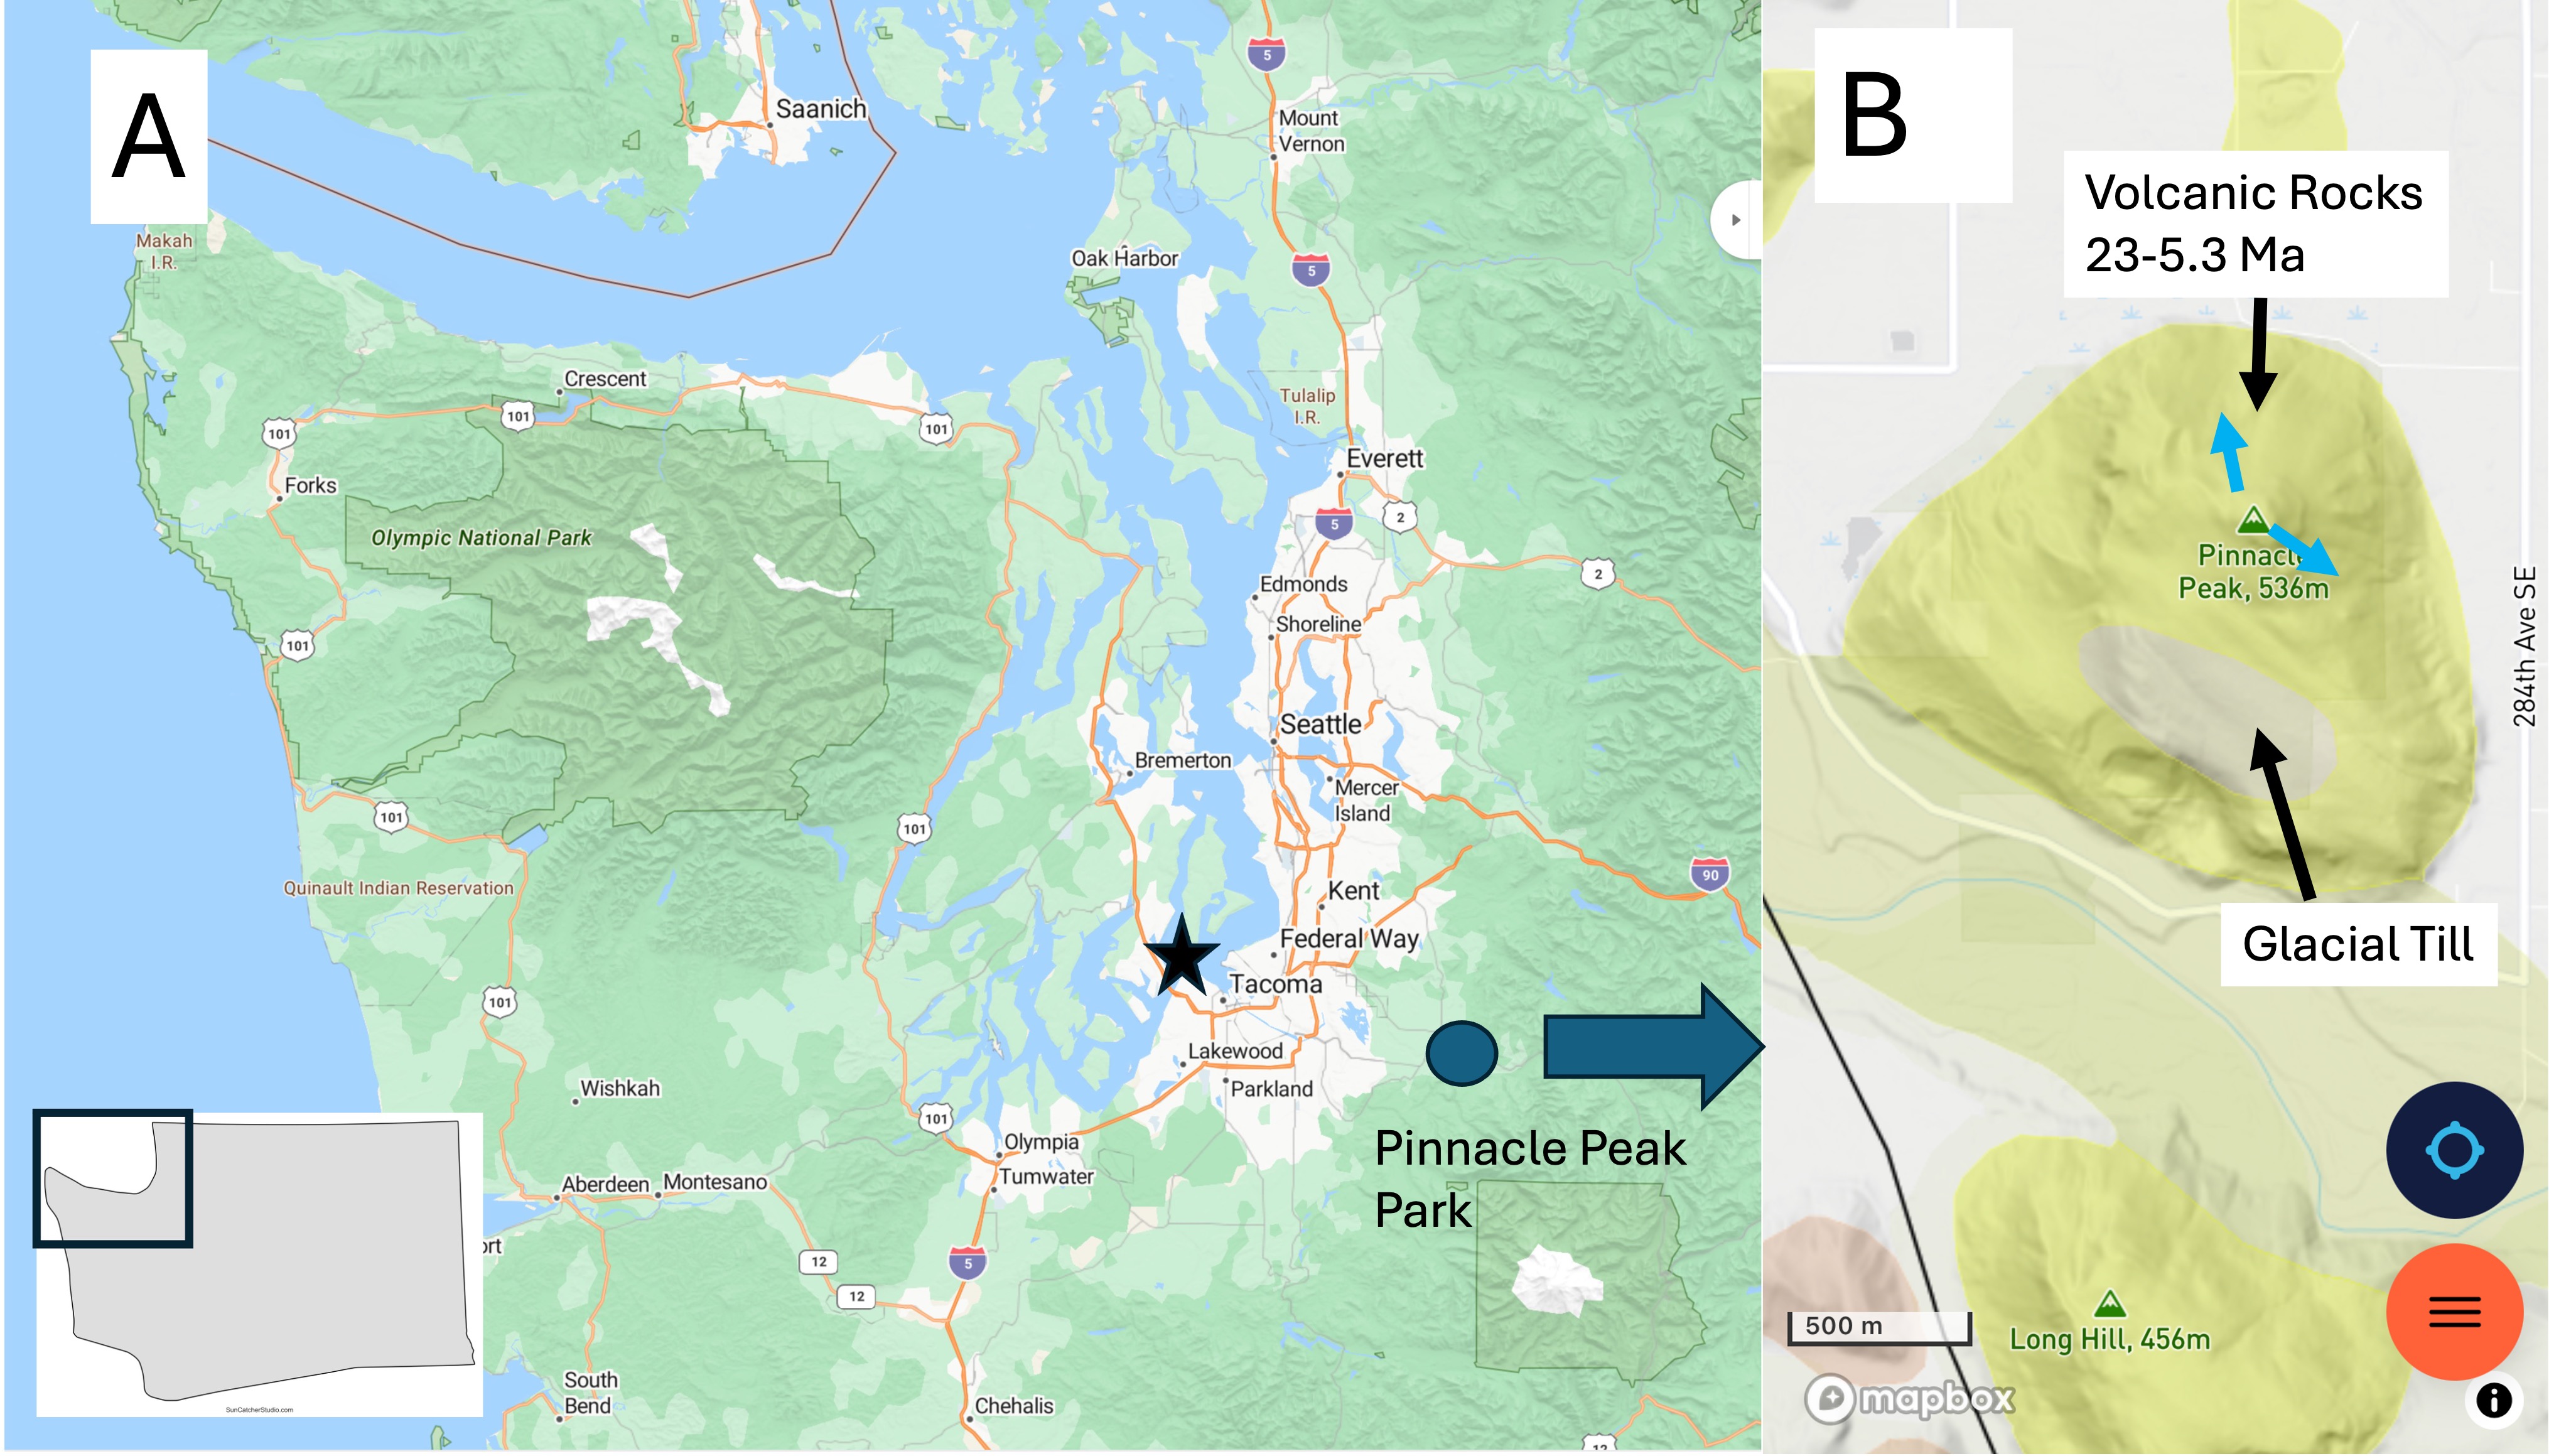
Figure 2. (A) The Pacific Northwest (PNW) base map I will refer to in this series of posts. Tacoma is indicated by a star and Pinnacle Peak park by the circle. It was less than an hour drive on a weekend at 0800; traffic picked up substantially and, by the time we left at about 1130, there was a traffic jam throughout the area because the access roads are small. Go early! (B) The geological map from RockD shows several volcanoes of similar Miocene age standing out in an ocean of glacial till. Note the presence of a deposit of till on the southern slope of the mountain. This was difficult to identify because the main trails followed old logging roads that had been covered with gravel, probably from this till and the White River flood plain below, in which there was active quarrying on the day of our visit. Note the blue arrows at the summit because they will be referred to below.
Observations.
We walked up the Pinnacle Peak Loop Trail counterclockwise, taking photos and noting the geology along the path. However, this is not a geological report but only a casual observation. All dates and rock types are from RockD, a compilation of geological maps produced by uncountable numbers of geologists engaged in active geological field and laboratory research. Thank them for the accessibility of their data, and blame me for any errors in interpreting it.
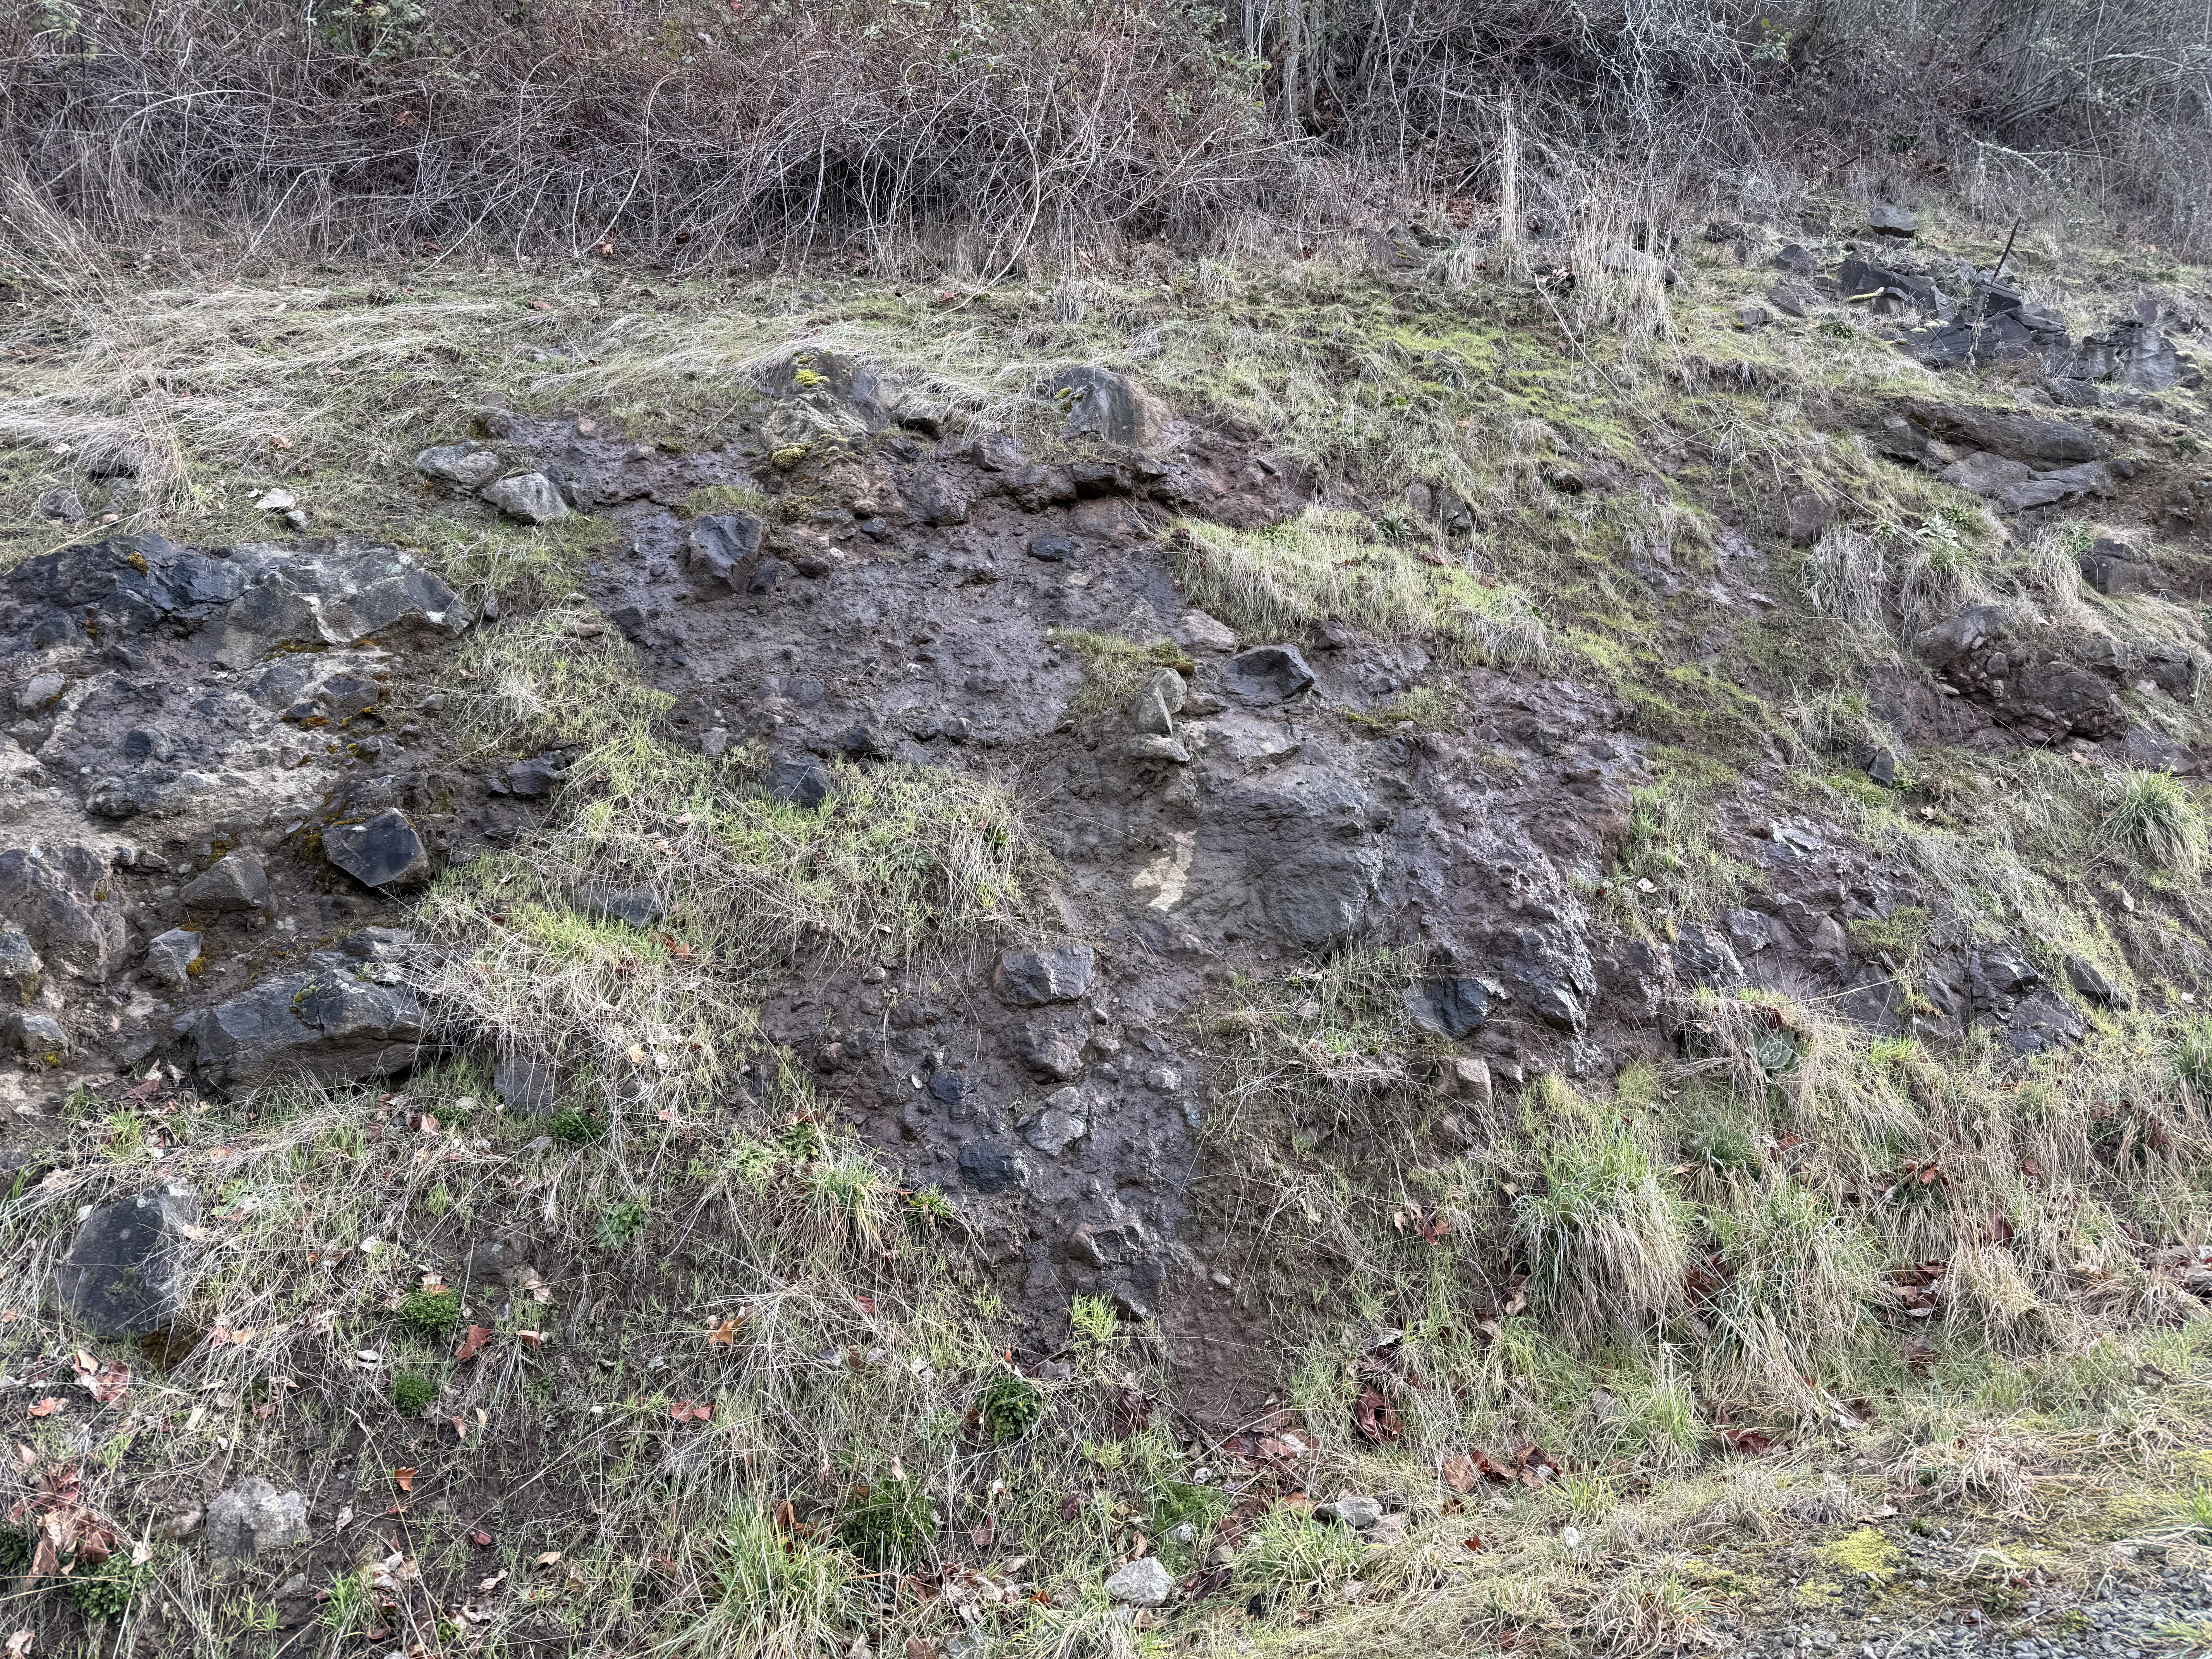
Figure 3. This photo was taken about half-way up the volcano where a road-cut revealed volcaniclastic sediments like we saw at Snoqualmie Falls. This nice exposure reveals a fine matrix of dark material including irregular, but rounded, boulders up to a few feet in diameter. These are volcanic bombs, semi-molten lave blown out of the vent by gas pressure which landed hundreds of feet from the summit.
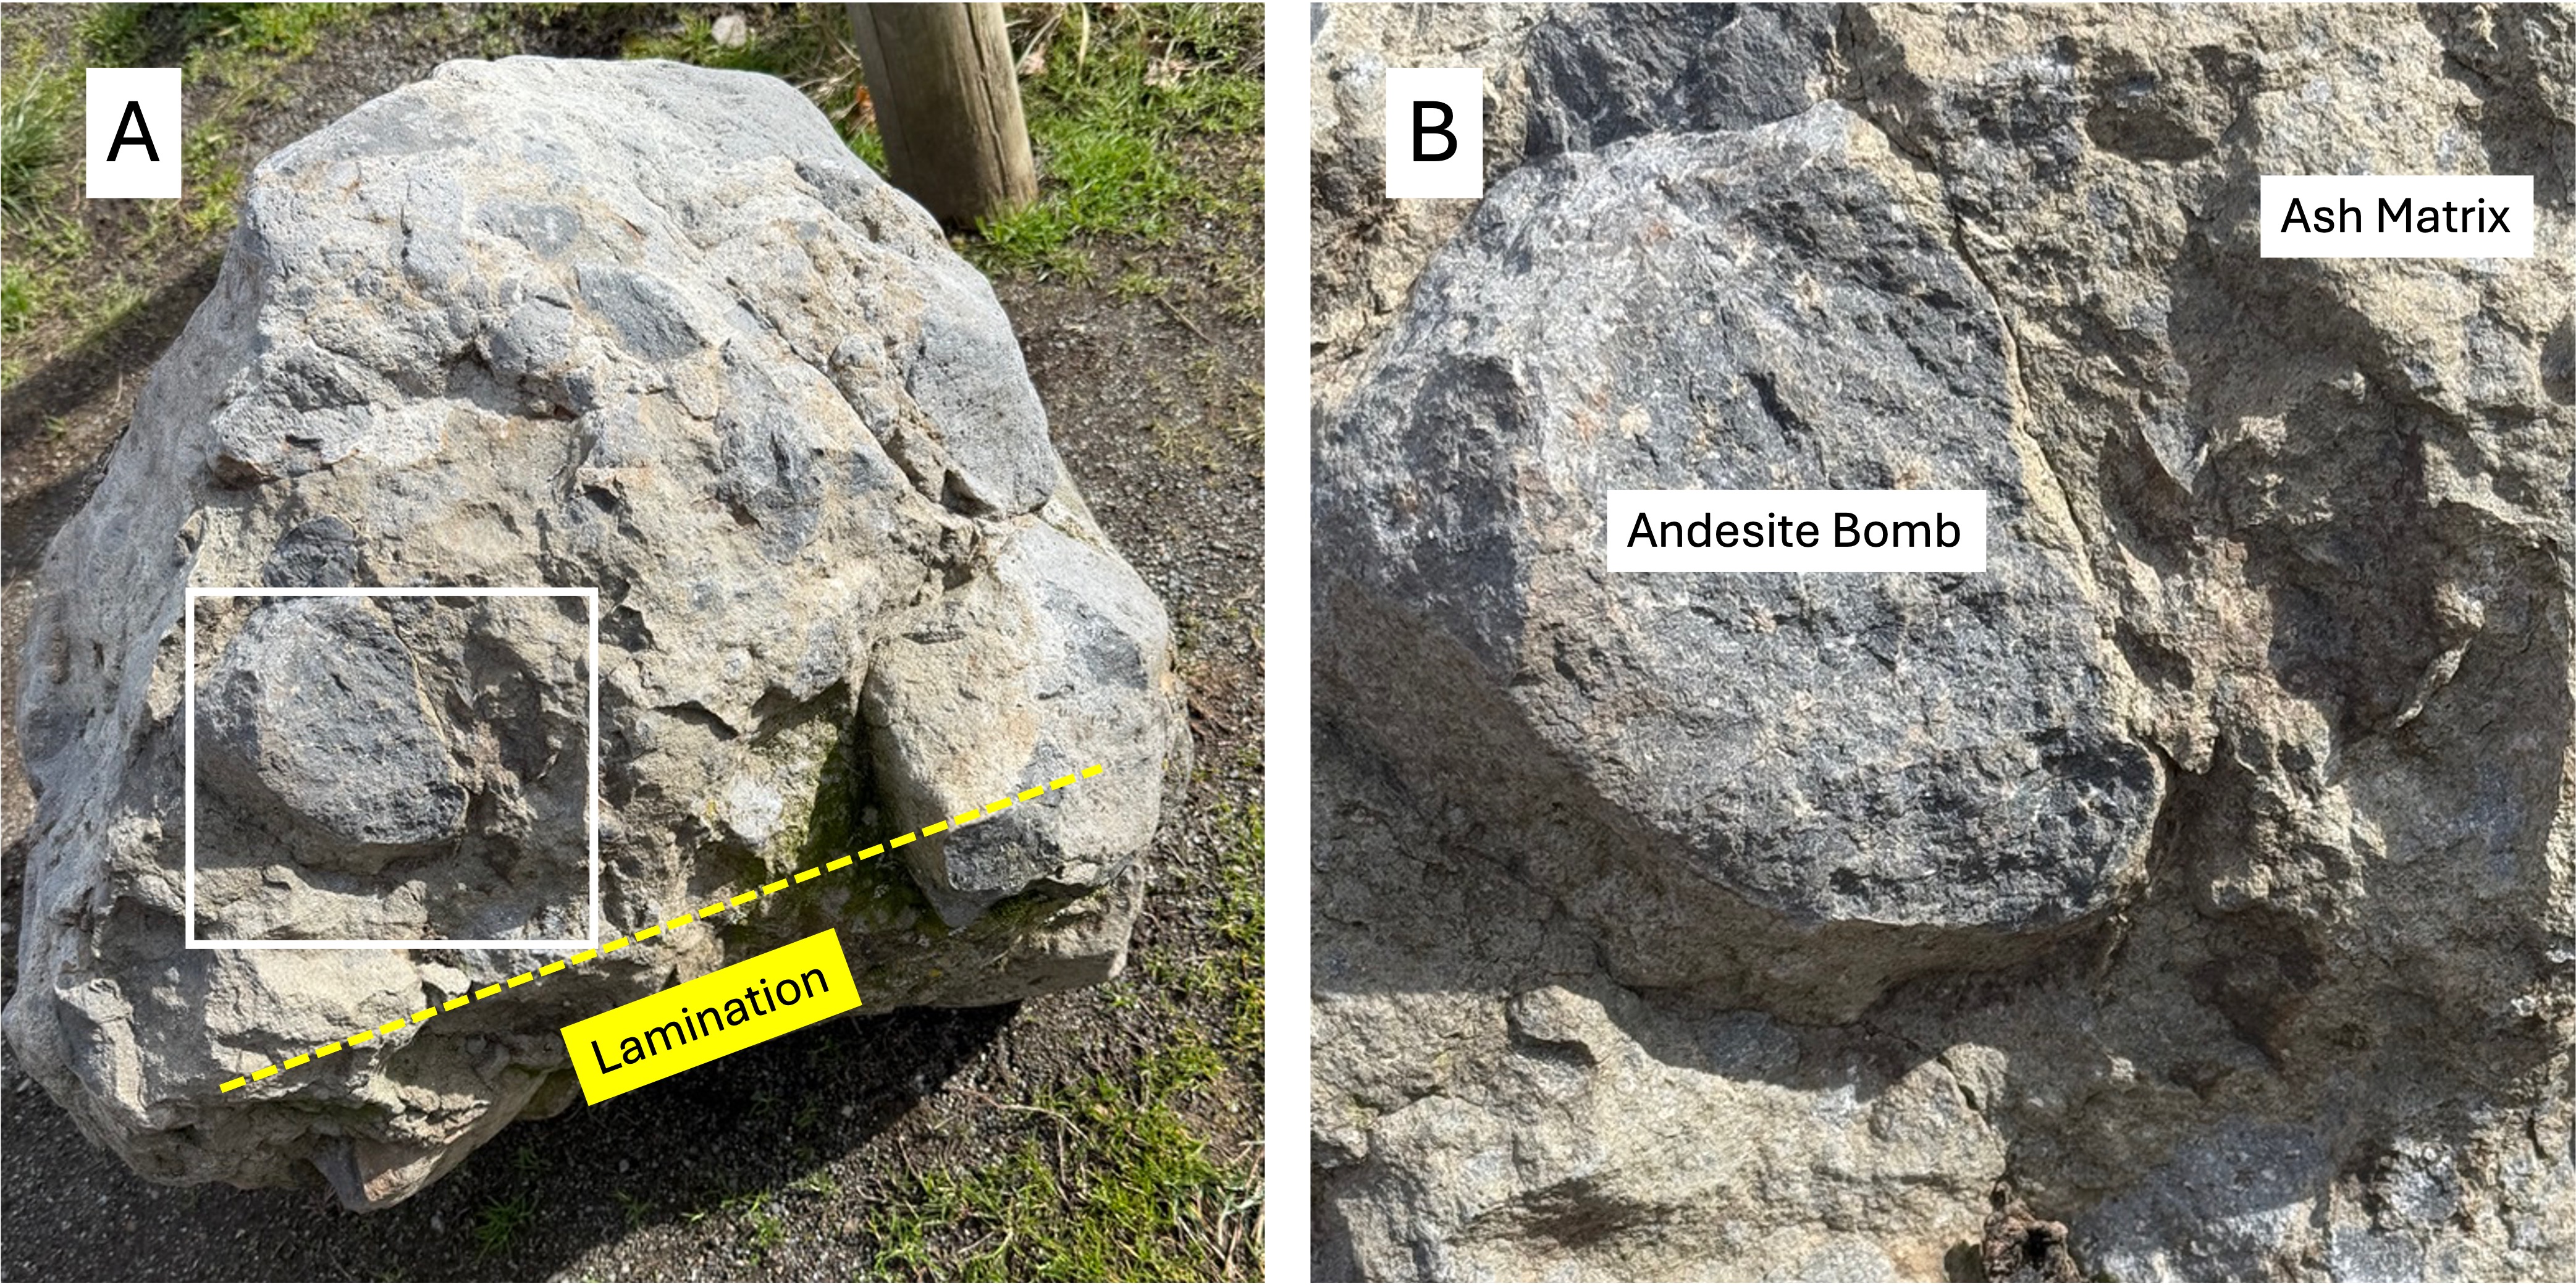
Figure 4. (A) This boulder of volcanic breccia was placed in the parking lot, probably as an example for public viewing. It is about 3 feet in diameter and contains numerous volcanic bombs, as well as fine lamination near what was its original bottom, as labeled in the figure. These would have been layers of ash with alternating chemical properties that gave them different colors. (B) Close-up showing the contrast between the lighter colored ash matrix and an andesite bomb. Imagine this semi-molten, andesite bomb flying hundreds of yards and landing in still-hot ash. The number of bombs visible in (A) suggest that this was part of a very explosive event.
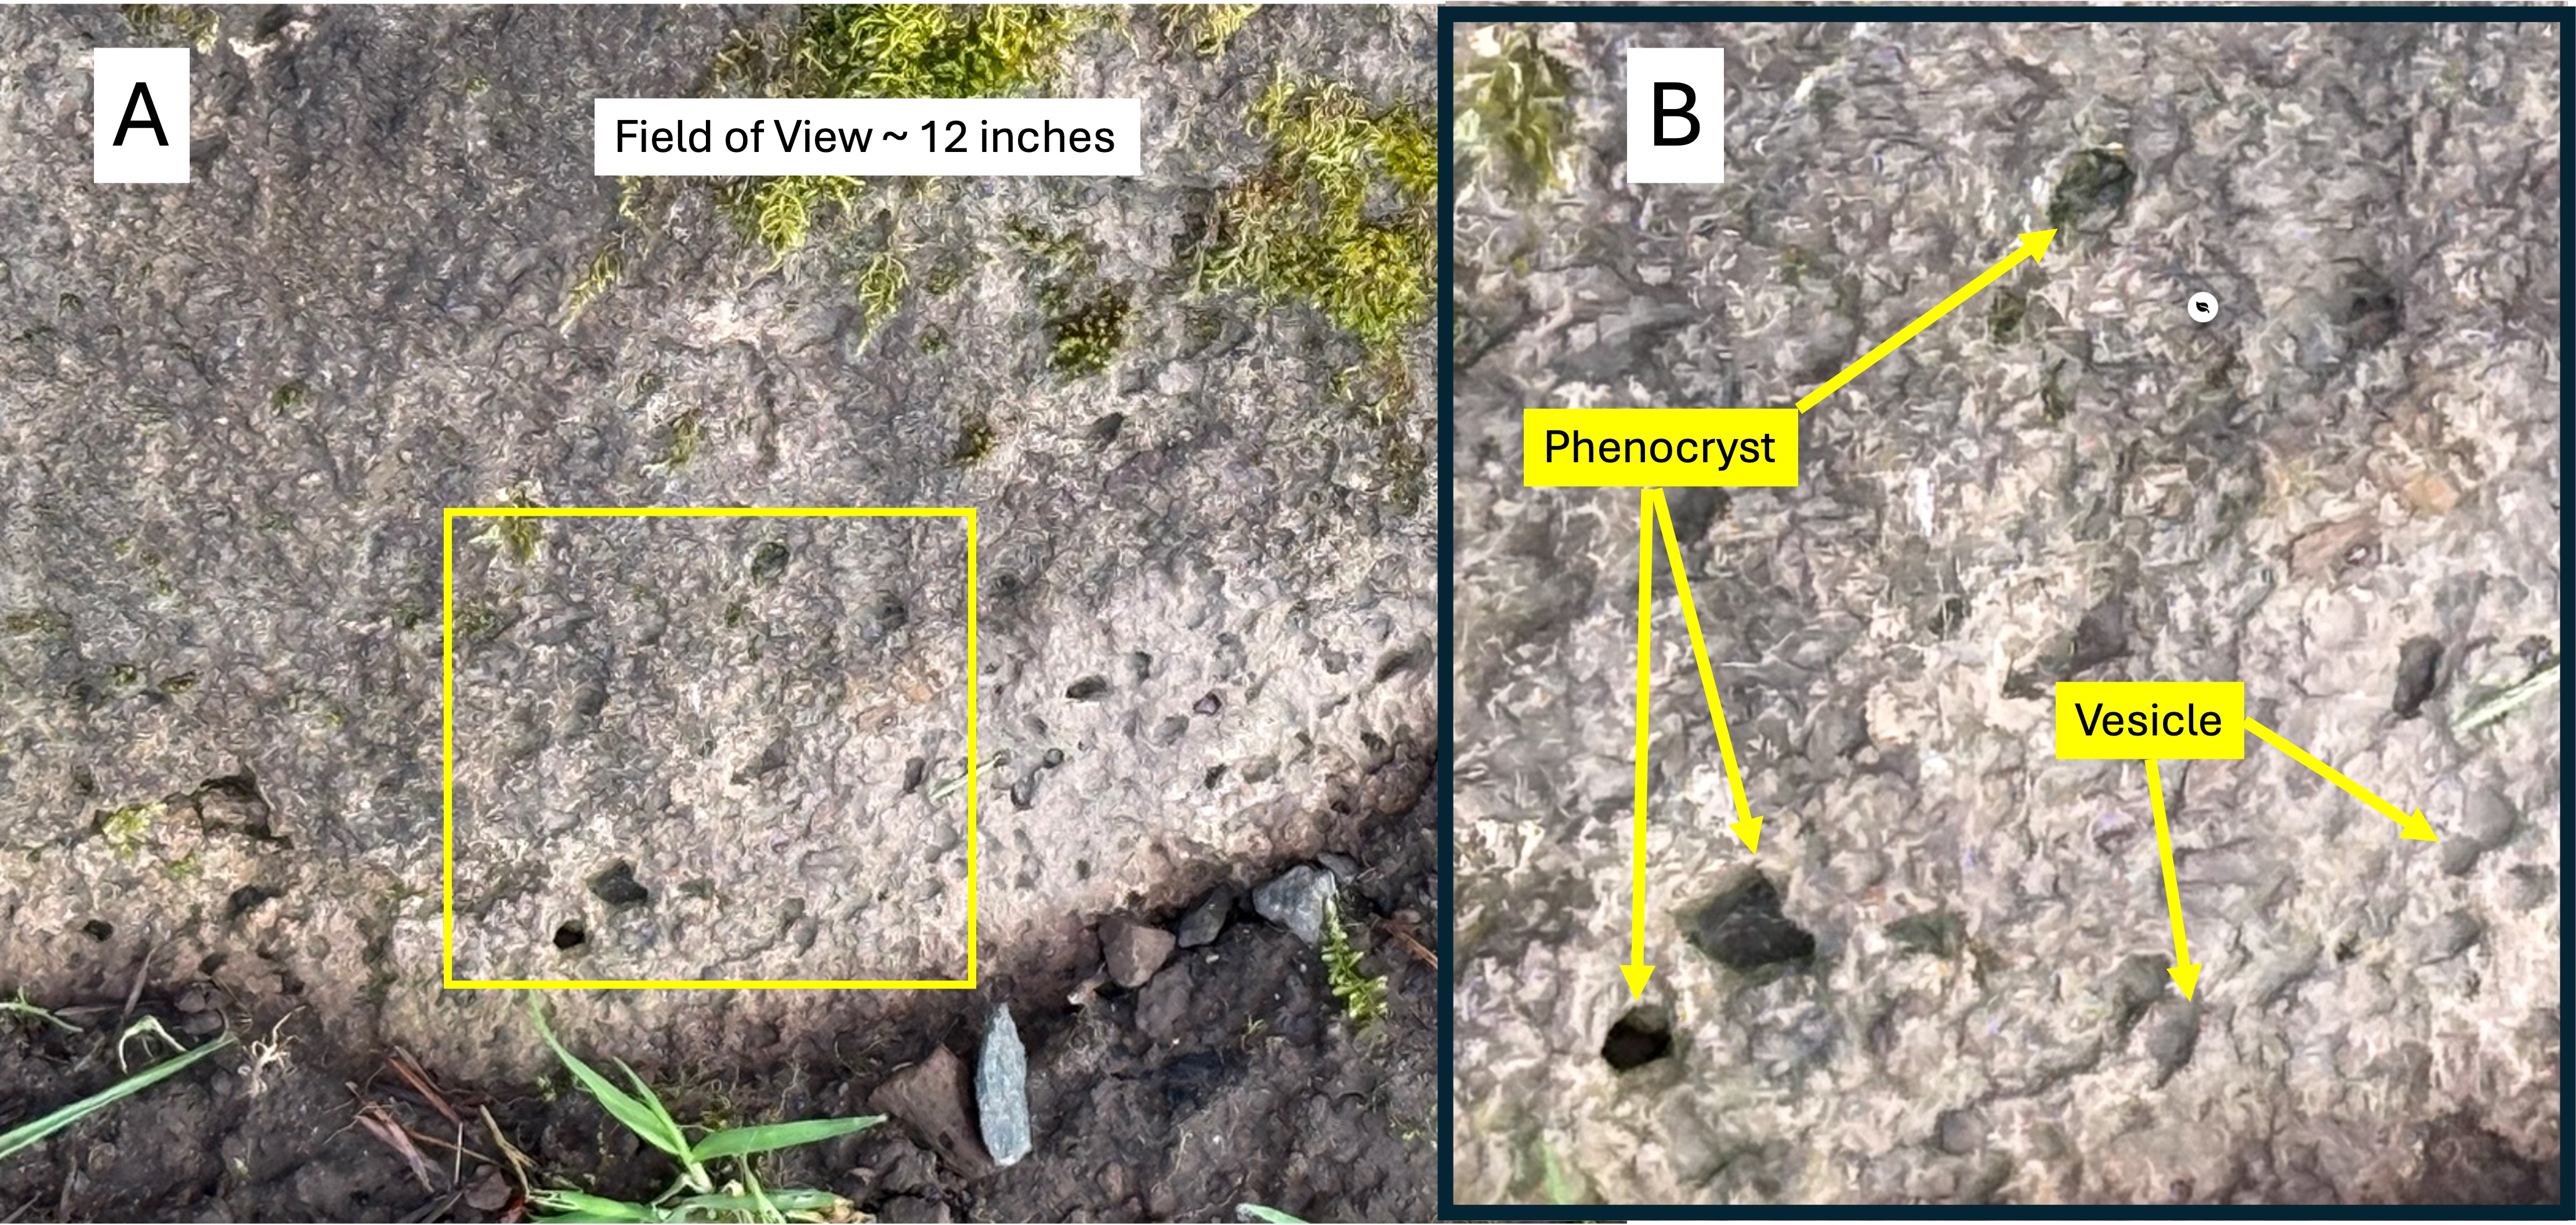
Figure 5. (A) Close-up of a boulder within a semi-hidden exposure of andesite near where Fig. 4 was taken. (B) This close-up reveals phenocrysts (solid mineral crystals) and vesicles (pockets left by escaping volcanic gases). I cannot identify the minerals comprising the phenocrysts, but common ones within andesite are pyroxenes, plagioclase (high-calcium feldspar), hornblende, and biotite. These are all dark minerals that crystallize at higher temperatures than high-silica (Si02) minerals. The specific mineralogy tells volcanologists about the chemistry of the magma chamber feeding the volcano. The vesicles of gas (e.g. CO2, CO, water vapor, sulfur compounds, H2S) are a crude indication of how explosive the magma was; more vesicles implies more explosive potential, especially in andesites, which are more viscous than basalt.
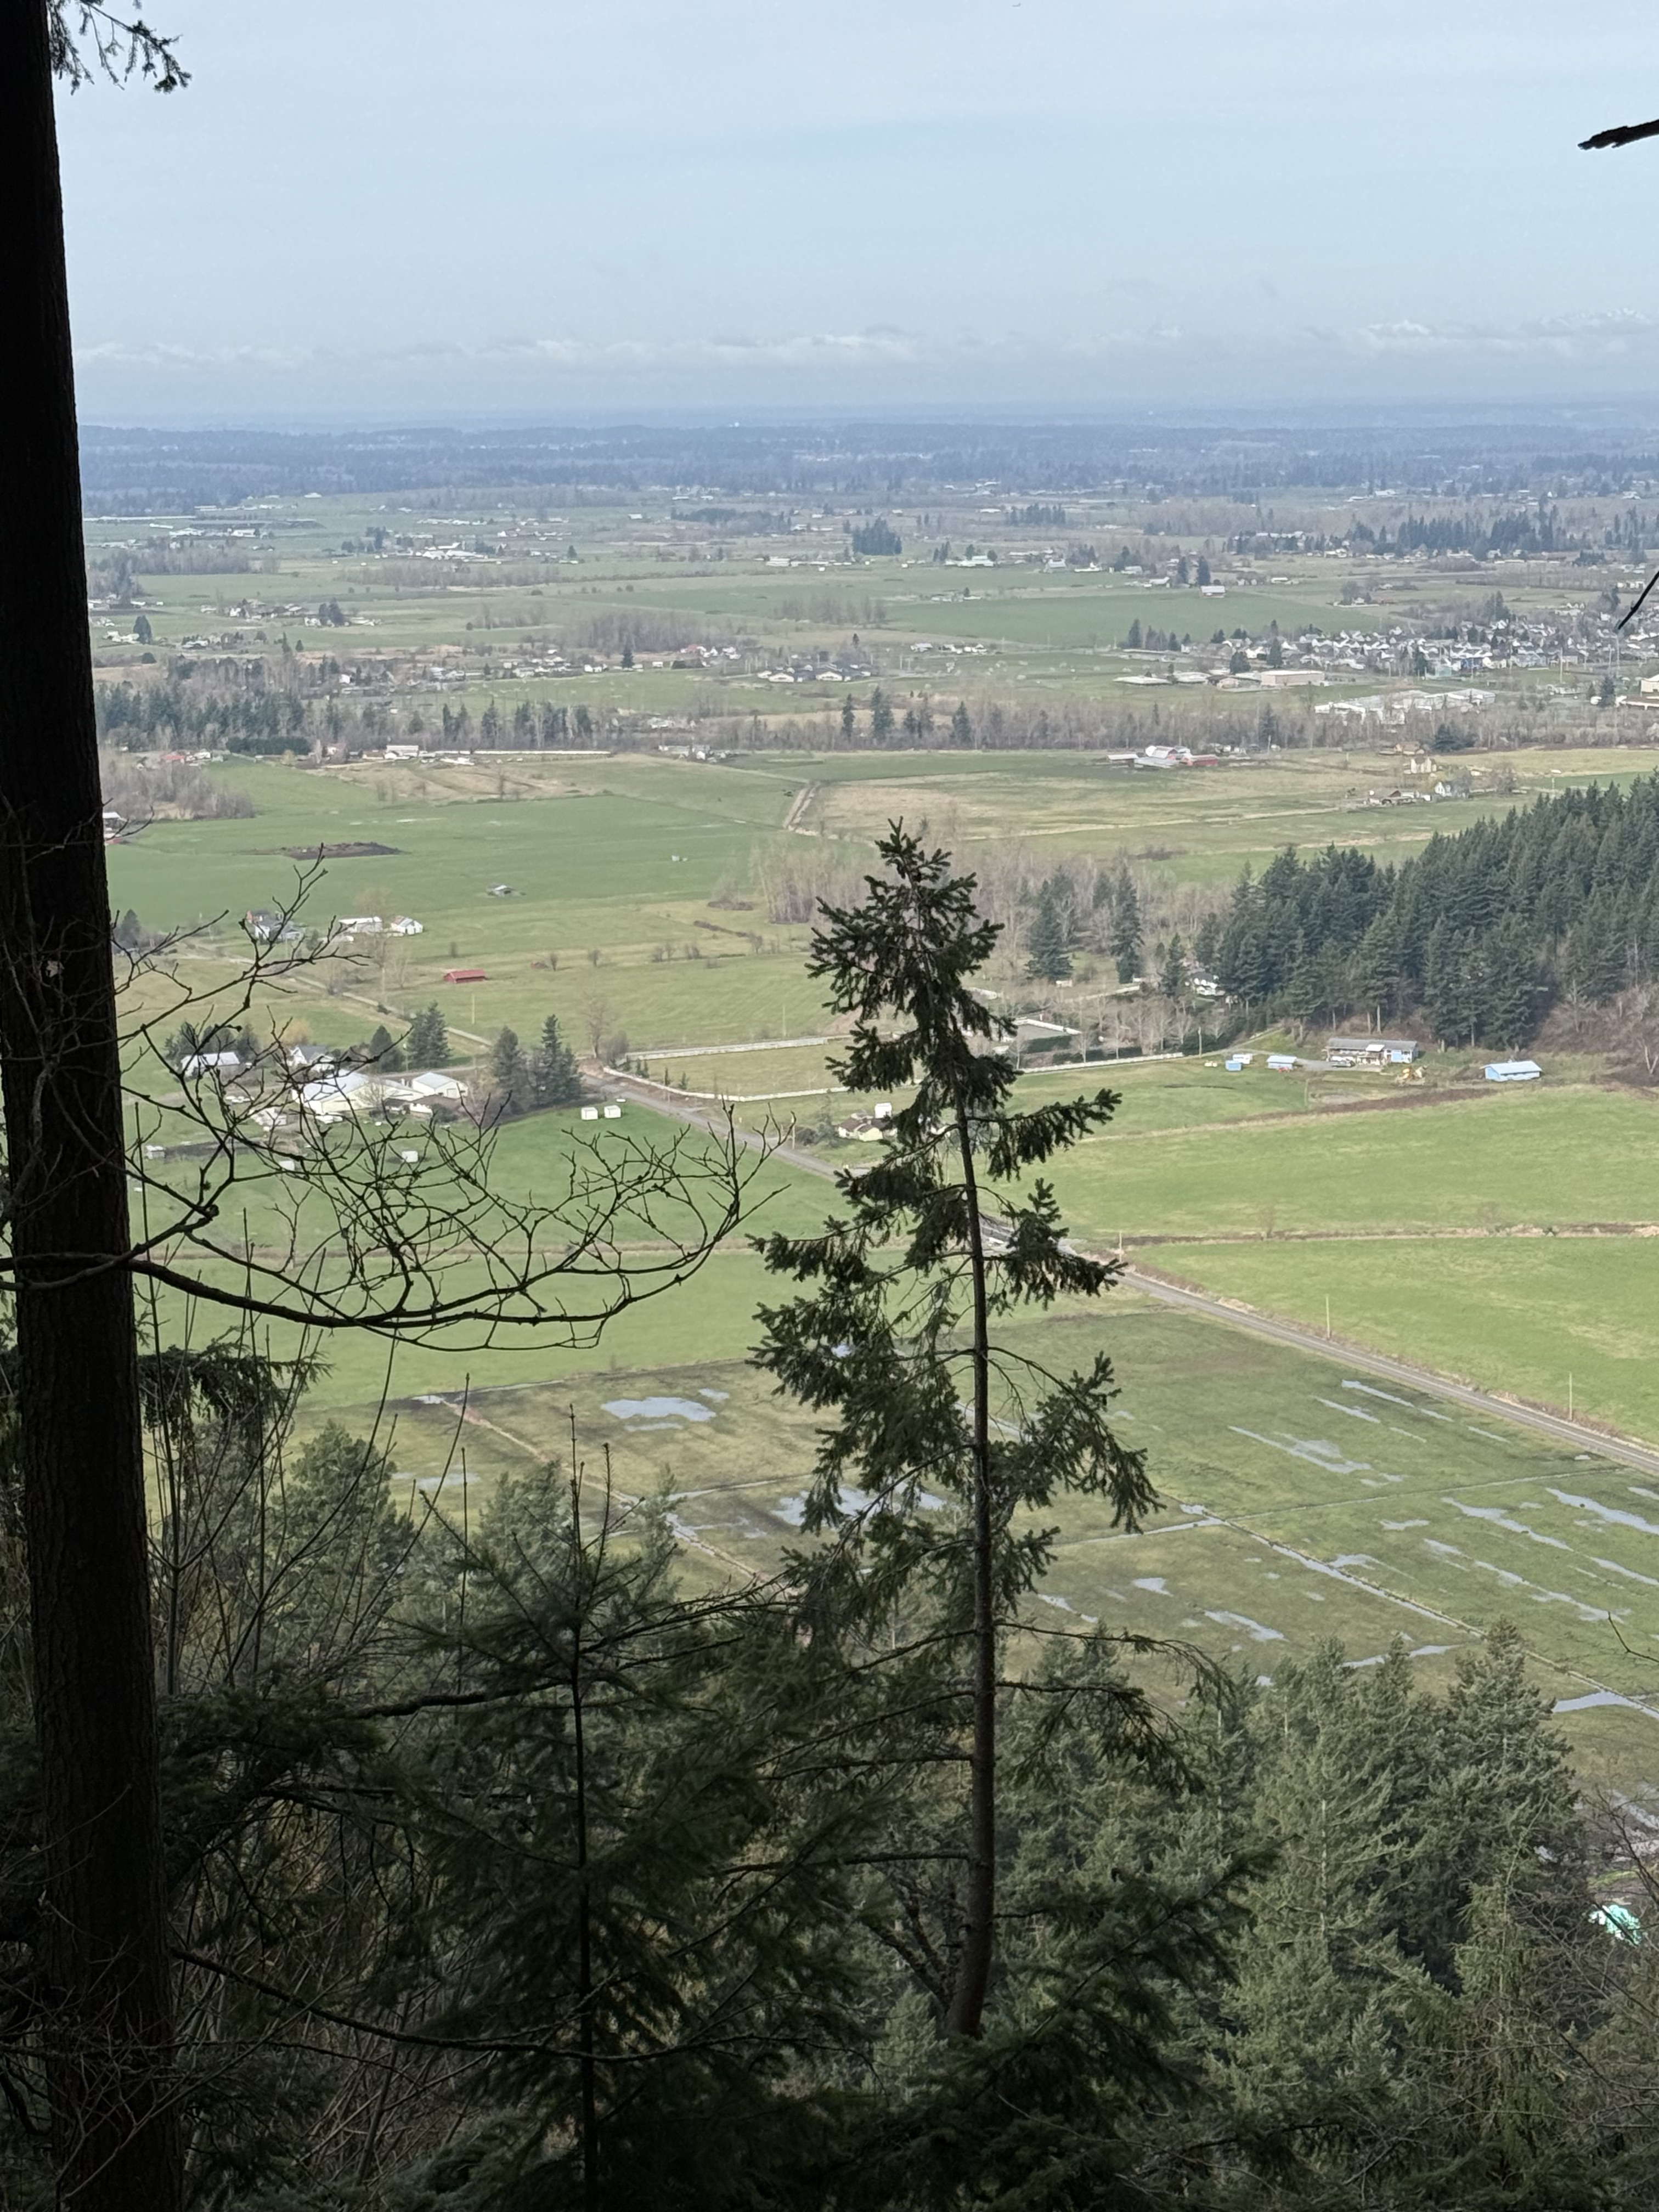
Figure 6. View from near the summit looking south toward the White River. This is a very different perspective of Pinnacle Peak than Fig. 1. The river valley is filled with glacial till (< 1 million years old) that covered all of the volcanic material from the volcano, which stands out today because it was never covered by ice.
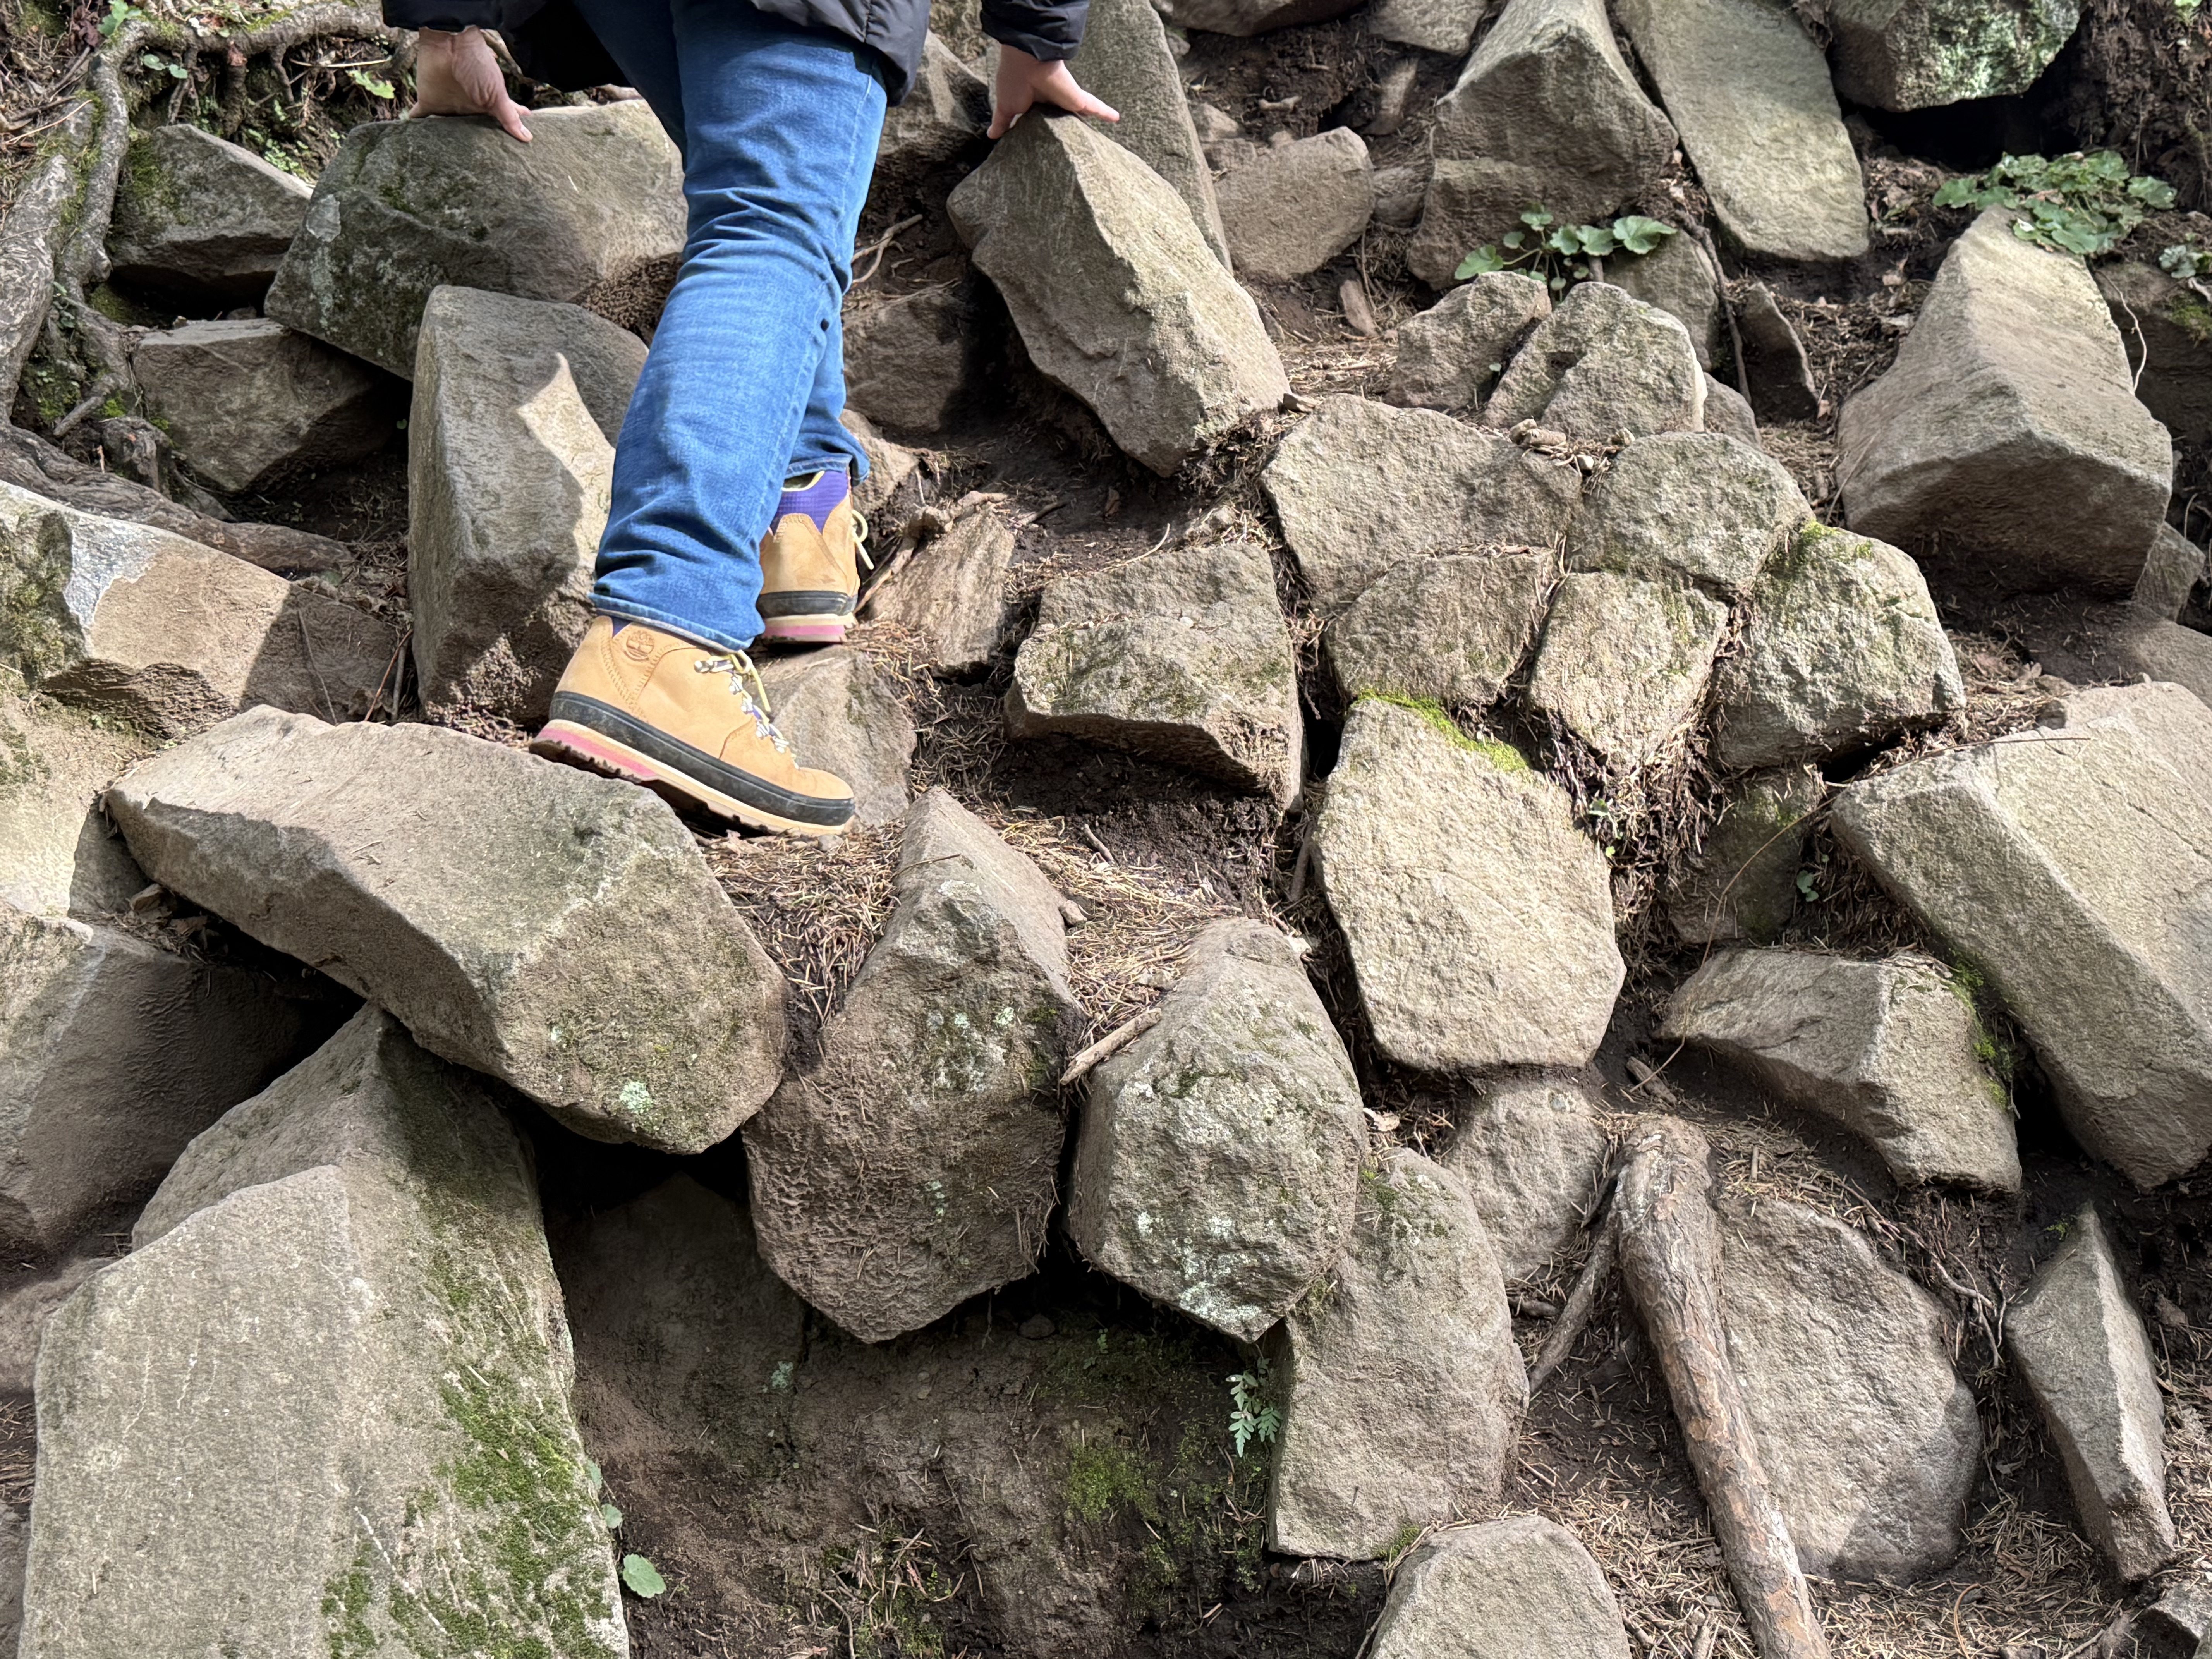
Figure 7. Photo taken on the SE side at the top of Pinnacle Peak (blue arrow in Fig. 2A). These horizontal rocks are not boulders, but instead the ends of columnar joint blocks of andesite. They are less than one foot in diameter; most of them are hexagonal, but irregular shapes are also present. They form when lava cools slowly enough to allow this kind of crystallization to occur, but rapidly enough that the lava doesn’t form massive beds.
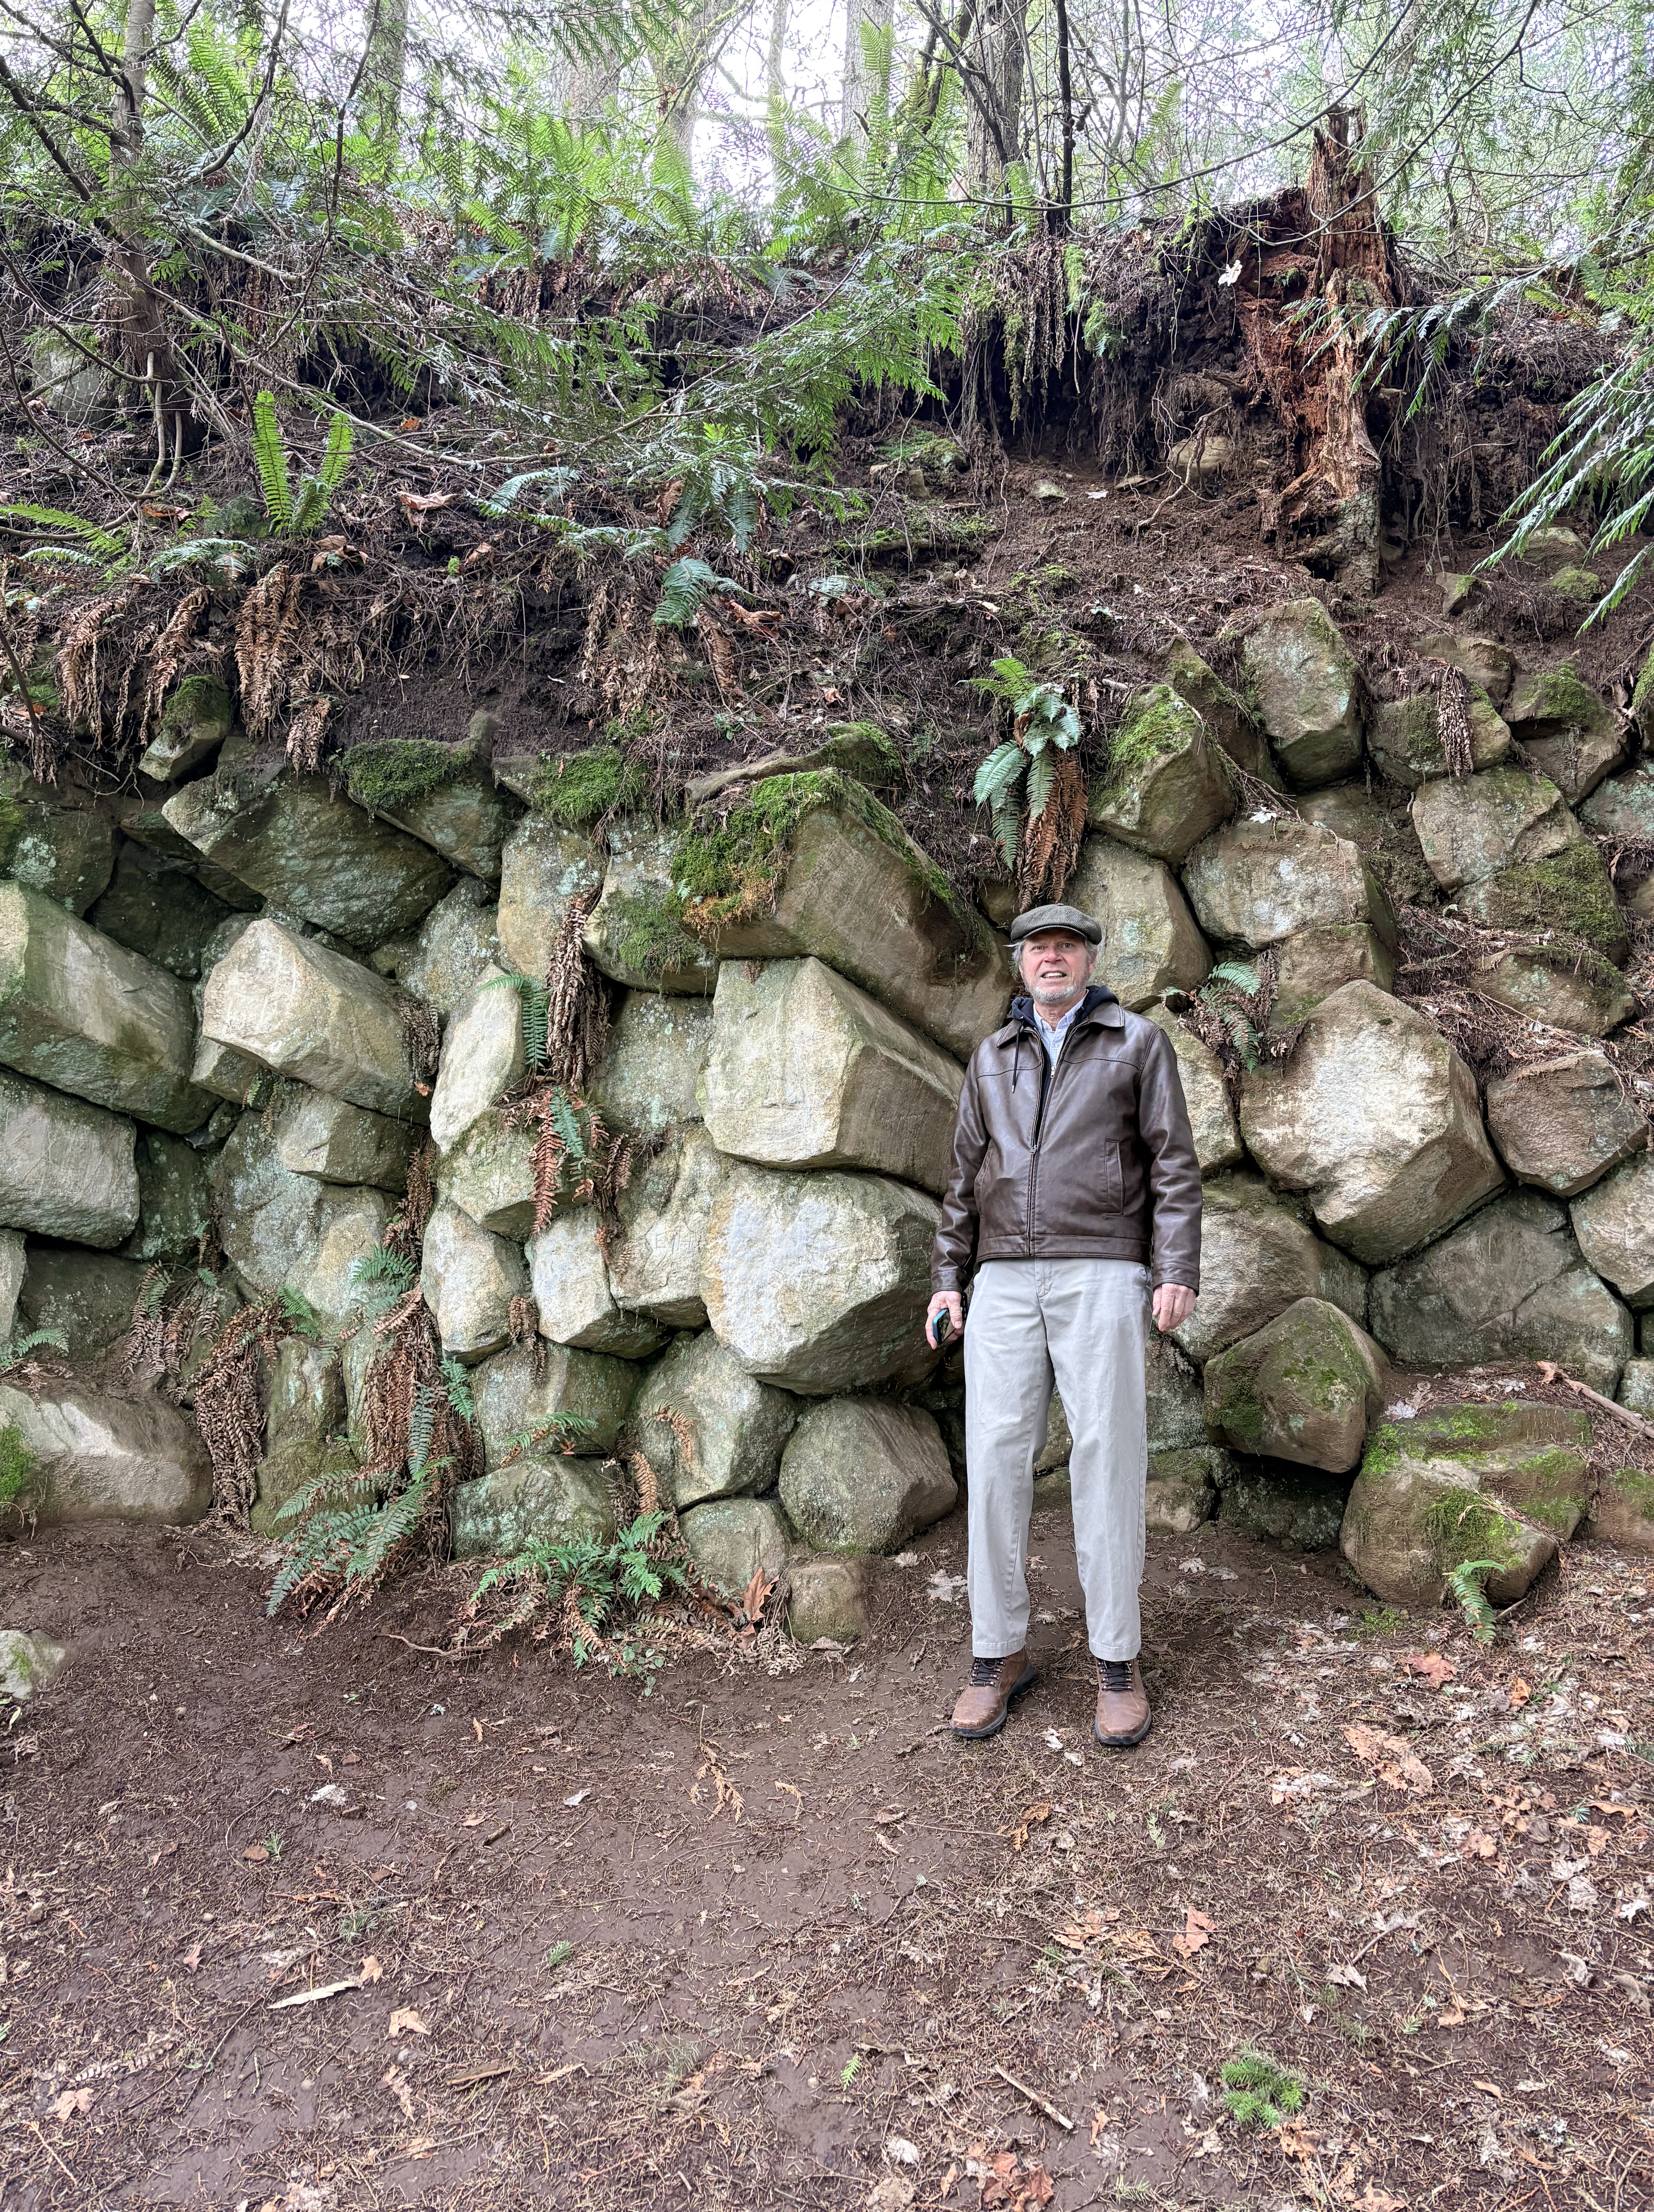
Figure 8. Photo of columnar andesite near the summit on the NNW side. These are much larger in diameter than those seen in Fig. 7. Columnar jointing is usually oriented with the ends vertical, but this isn’t necessarily required because gravity is not the dominant force; chemical bonds between the individual minerals determines the development and size of columnar joints. As long as the “top” of the lava flow (facing the camera in this photo) is exposed to the atmosphere, they can form. I reported on incredible examples of this in my post on Organ Pipes National Park near Melbourne, Australia.
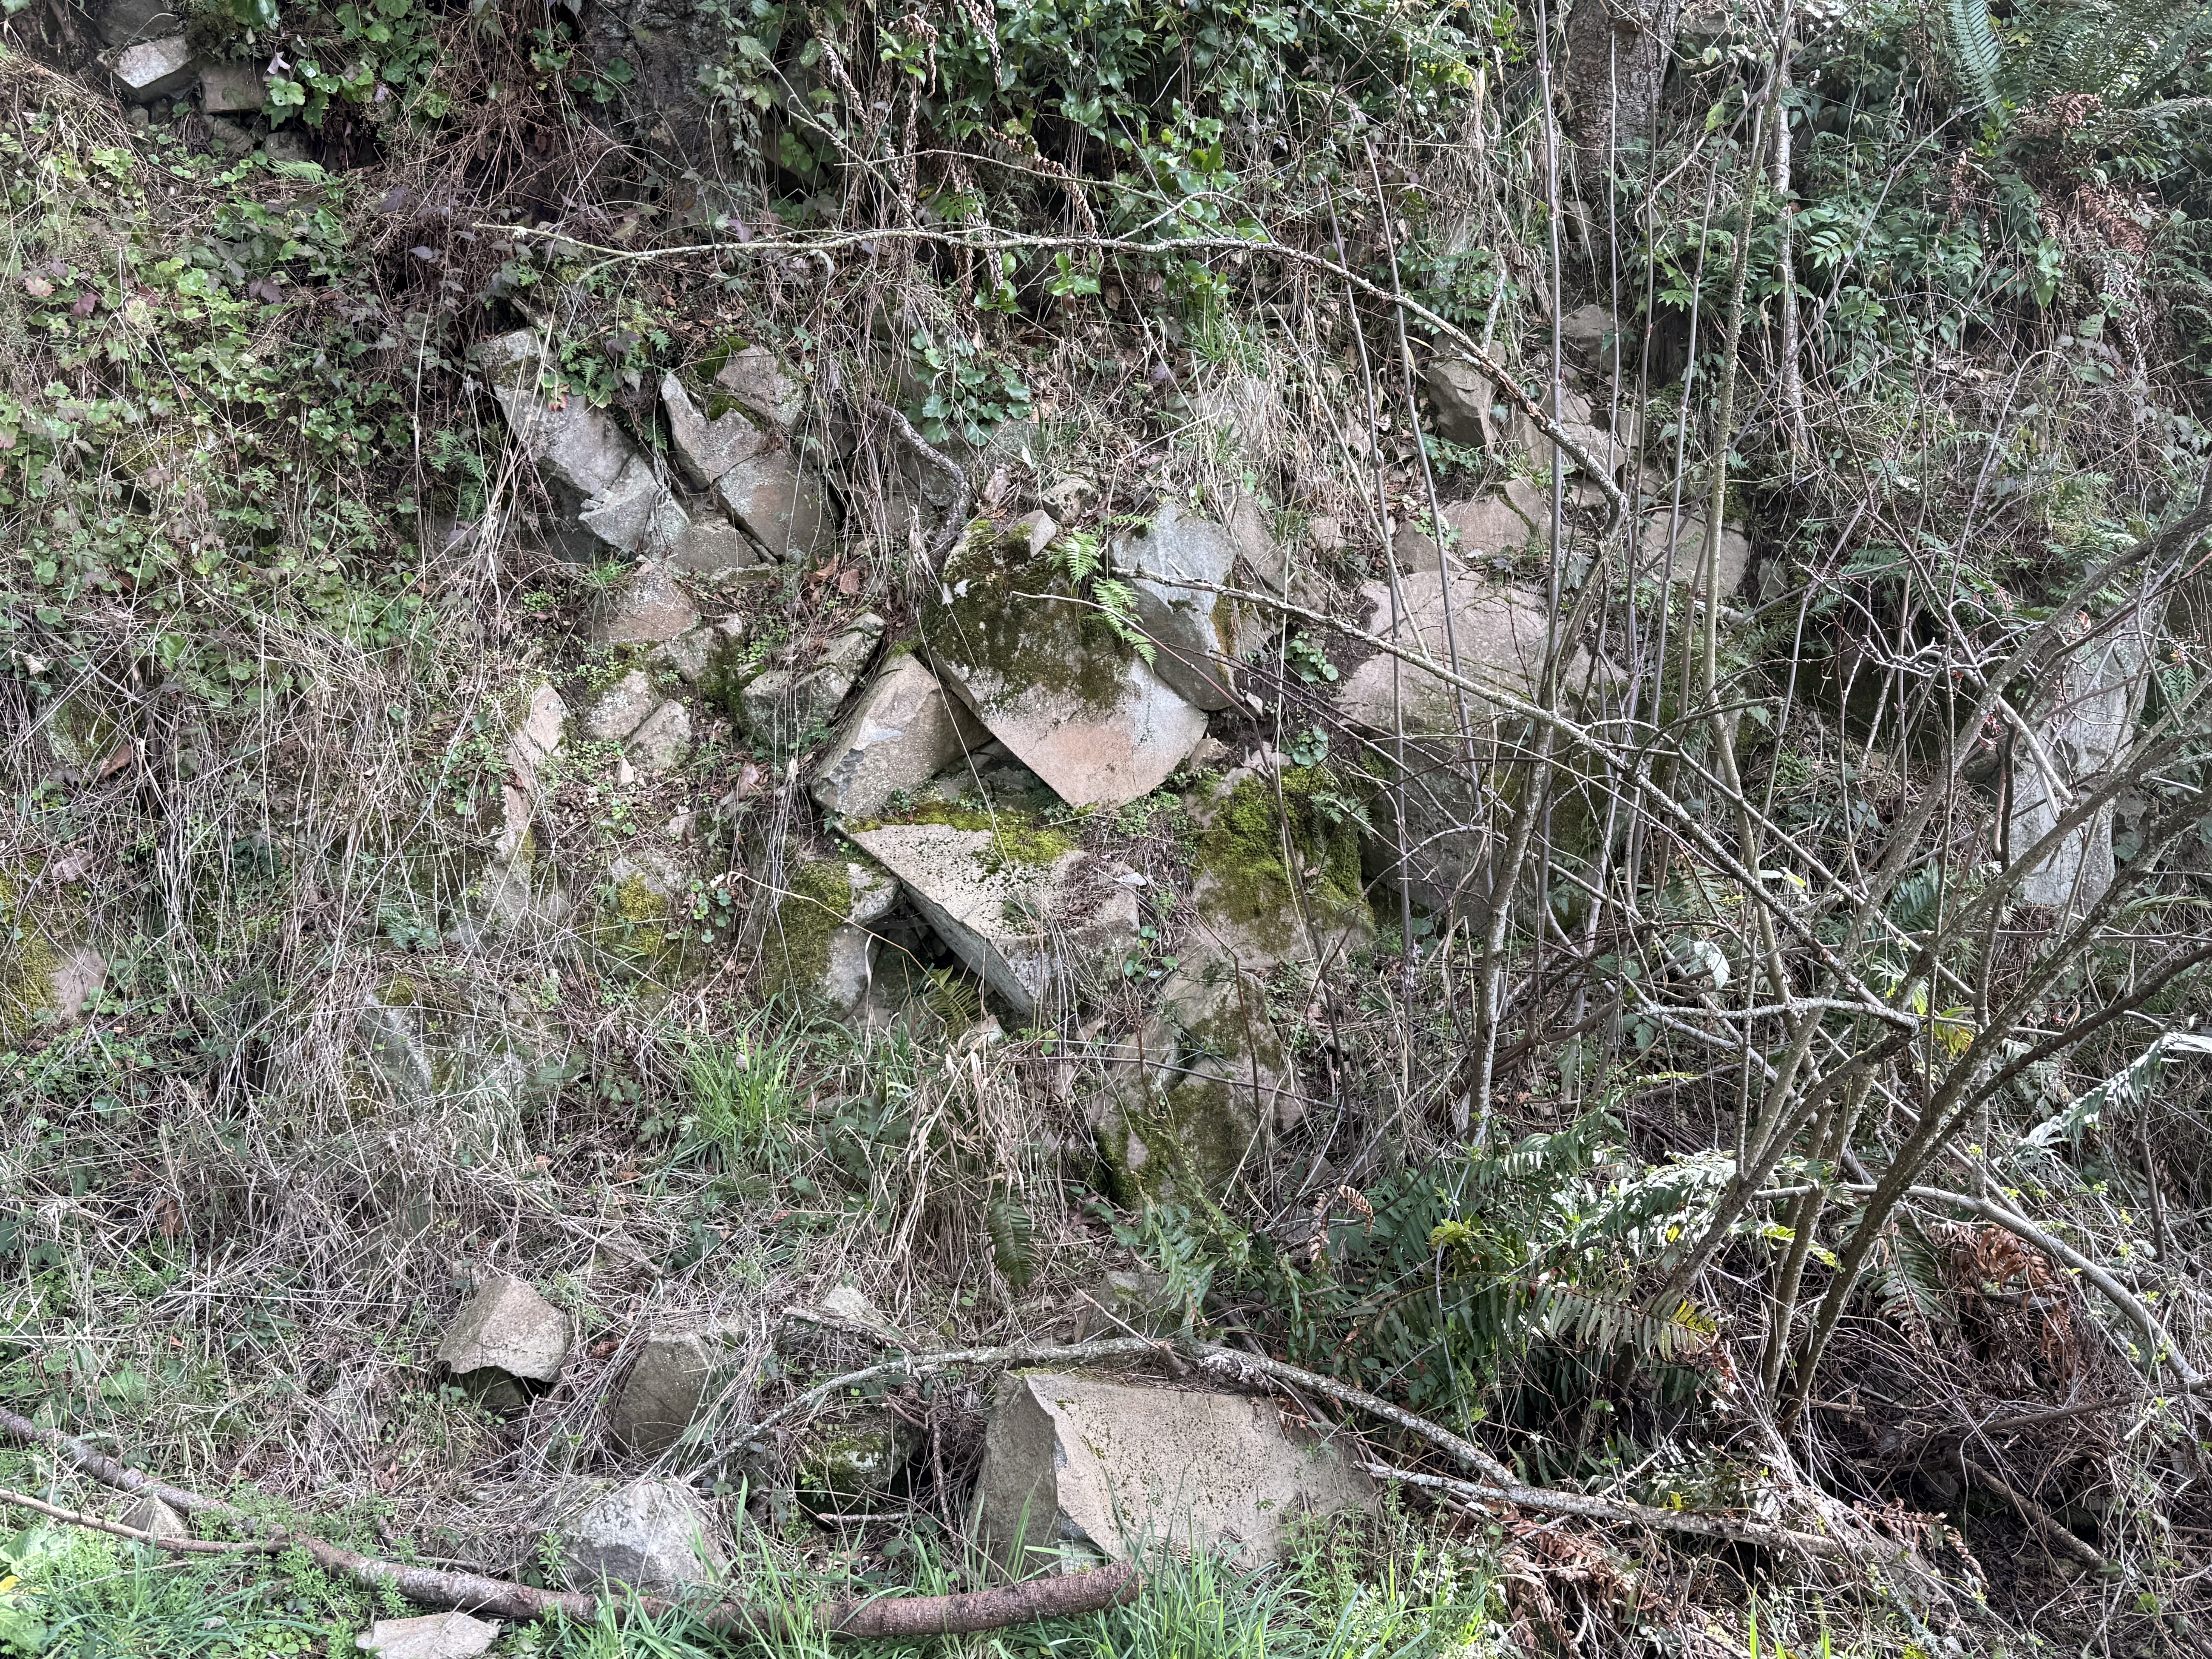
Figure 9. This exposure, from further down the south slope of Pinnacle Peak, reveals blocky lava that seems to be bedded, with bedding planes dipping away and to the right of the camera. No columnar jointing is visible, and the rocks are solid. This could be an outcrop of sandstone if it weren’t for the grayish color. Maybe limestone?
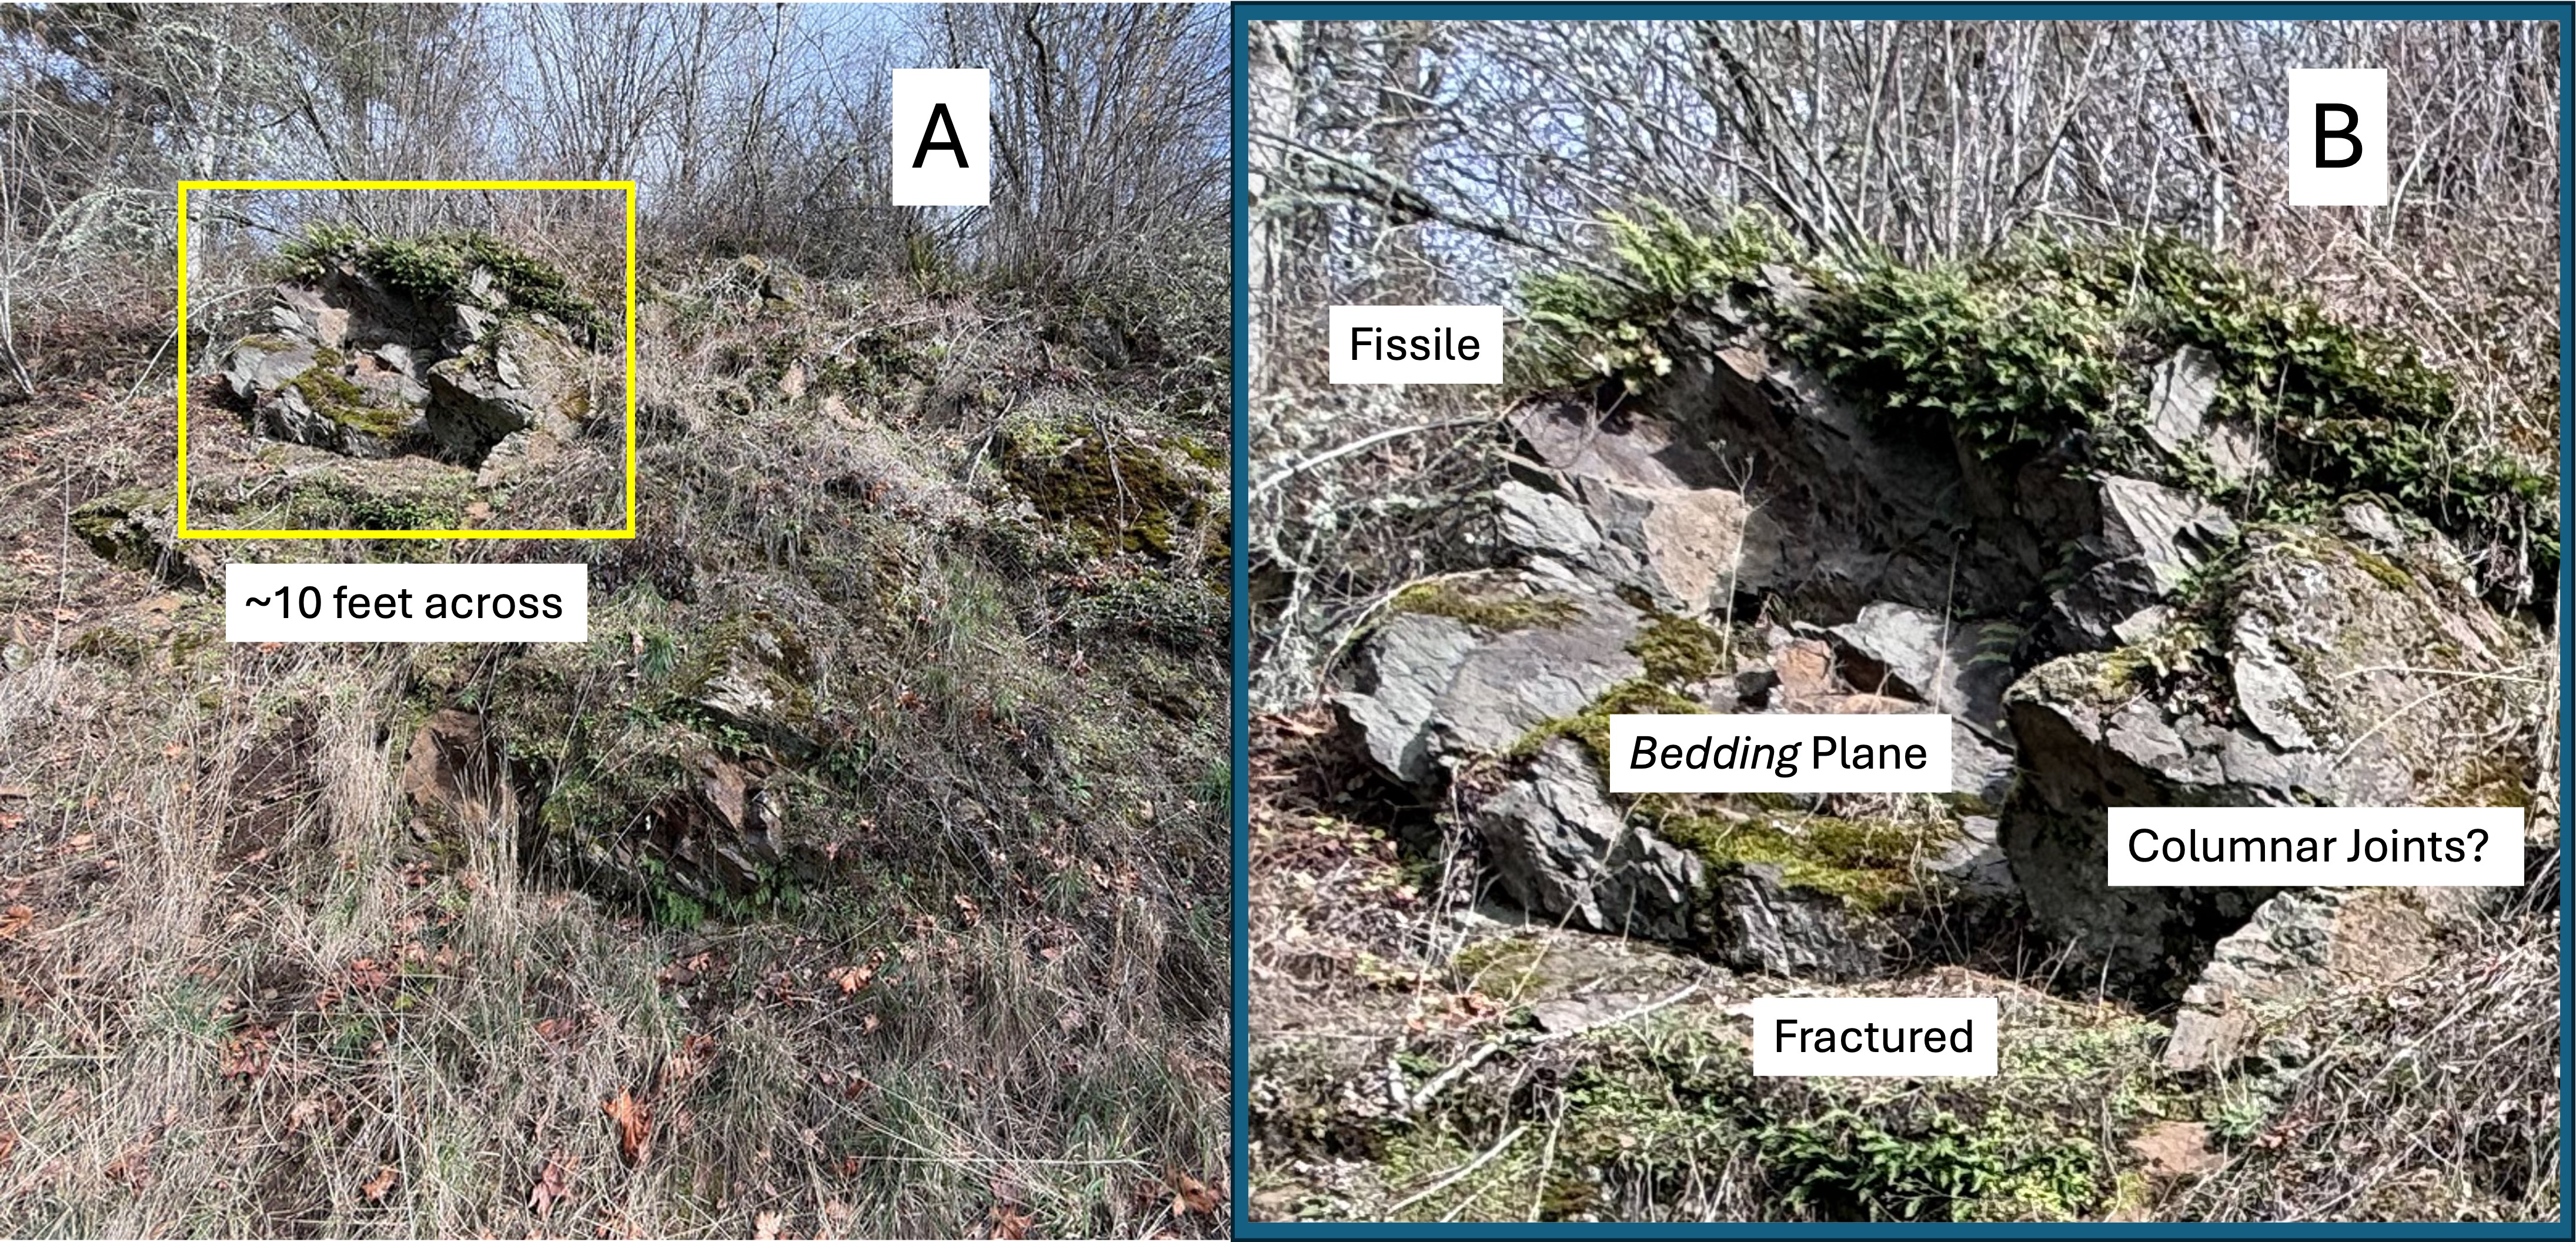
Figure 10. (A) Exposure of andesitic lava that looks much the worse for wear than anything I’ve seen before on this field trip. (B) Close-up of the exposure outlined in (A) that reveals a jumbled mass of lava that reveals several secondary textures: contamination and preferential erosion along “bedding” planes (fissility); irregular and tilted bedding planes; fine-scale fracturing and weathering (fractured); and blocks with a hint of hexagonal form (columnar joints). This was near the bottom of the volcano and the rocks are presumably older than those seen in Figs. 3, 7, 8, and 9; in other words this photo implies that eruption style was not uniform throughout this volcano’s lifetime. I further suggest that, over the lifetime of this volcano’s active period, the magma chamber became more stable, and thus the eruptions more predictable.
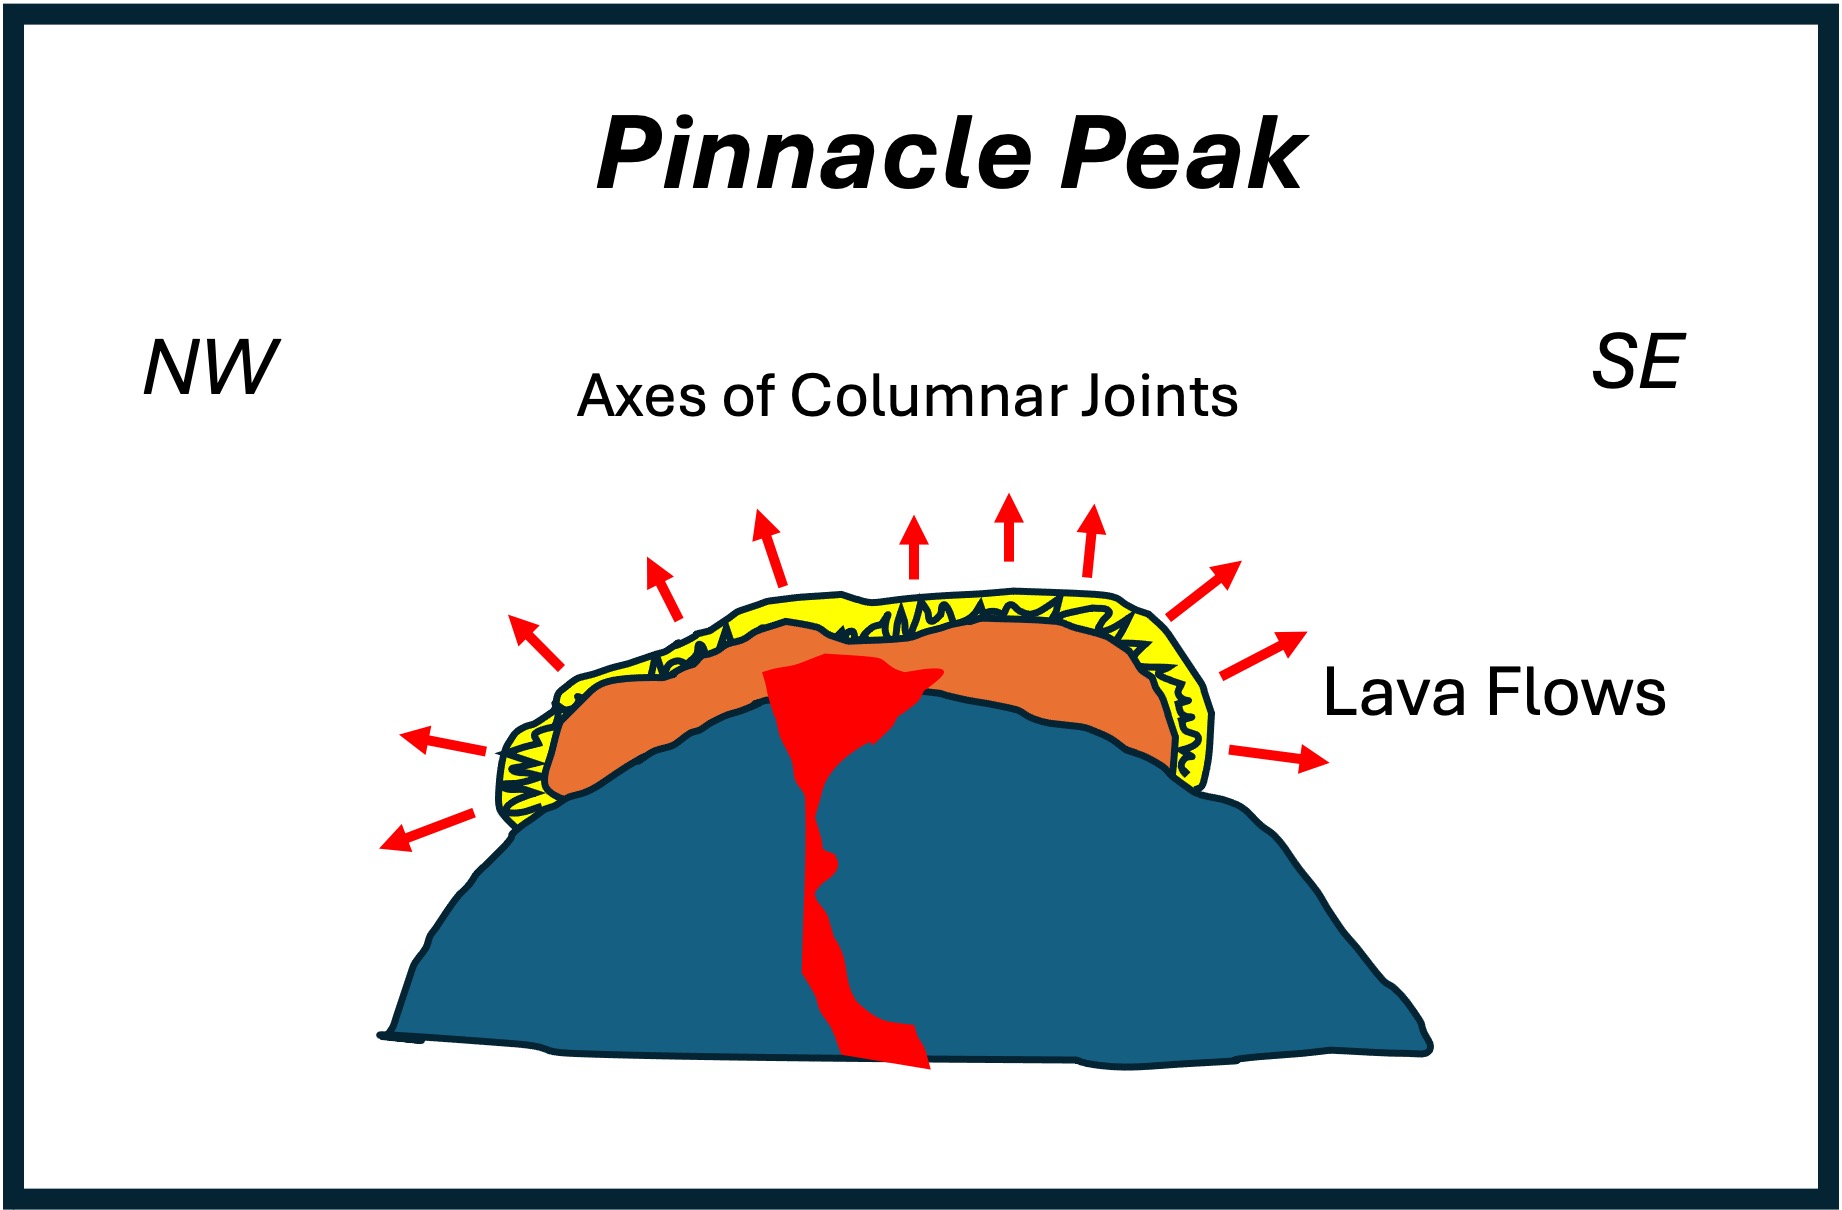
Figure 11. All of the textures, mineralogy, and fabric of the rocks comprising Pinnacle Peak fall within the expected composition of a shield volcano, except for the horizontal columnar jointing seen in Figs. 7 and 8, which point in opposite directions (NW and SE) even though the lava erupted directly from a rather small outlet (~200 feet in diameter). I didn’t understand what I saw at Organ Pipes National Park, but I let it go; now that I’ve encountered similar textures again, I want to have at least a naive understanding of how lava can form structures similar to a wilted plant. This is my model. The purple represents thousands of lava flows, volcaniclastic deposits, etc; the red is the lava just before the eruption(s) represented by Figs. 7 and 8; and the yellow is a thin layer of viscous lava that flowed out over a slightly older deposit. This last eruption wasn’t immediately covered by more lava and it cooled according to the laws of thermodynamics. In other words, it formed columnar joints, which are represented by the squiggly lines. The red arrows point to toward the “top” of the flow at every point; as you can see, the “top” isn’t always pointing towards the sky. This model is based on simple thermodynamics and mineralogy–I assume that the lava is a homogeneous mixture of the components of andesite (e.g. quartz, feldspar, pyroxene), which are cooled only by their exposure to the atmosphere. The different diameters in the columns (compare Figs. 7 and 8) suggests that this is an oversimplification. Nevertheless, it makes sense to me.
SUMMARY.
I had a great time climbing Pinnacle Peak and I learned something new from the rocks that surround and support us. A large mountain range like the Cascades doesn’t appear overnight. Subduction along the NW coast of N. America continued, interrupted by collisions with offshore continents, from 200 Ma to the present, creating multiple mountain ranges which created the Pacific Northwest. A small volcano like Pinnacle Peak would have burned out in a few million years. The range in age is based on stratigraphy, and the absence of funding/geologists to date rocks from every minor volcano in a major subduction zone, leaves me to apply common sense.
Pinnacle Peak erupted about 5 Ma, based on the physical status of the summit. It sputtered for a few hundred-thousand years as the magmatic system decompressed; eventually the magma chamber, or a subsystem of pathways, gave a last gasp. The columnar jointing we saw today suggests that this final eruption consisted of some spitting and then the appearance of timid lava, flowing a few-hundred yards from the summit (Fig. 11). That is what we saw on today’s field trip.
That’s my story…
Quaternary Geology on Mt. Rainier

Figure 1. View of Mt Rainier from the west. At 14410 feet, it is the most prominent peak in the contiguous United States. It has 28 glaciers, with the largest total surface area in the lower states–35 square miles. Mt Rainier is a stratovolcano, composed of andesitic lava (rather than basalt), material ejected from the summit, and ash layers. This type of volcano is commonly found in subduction zones; they tend to have explosive eruptions (e.g. Mt Saint Helens). The oldest rocks on Mt Rainier are about 500,000 years old. It is active and listed as a decadal volcano–one of the most dangerous volcanoes in the world. Its last major eruption, accompanied by caldera collapse, was 5000 years ago, but minor activity was noted during the nineteenth century.
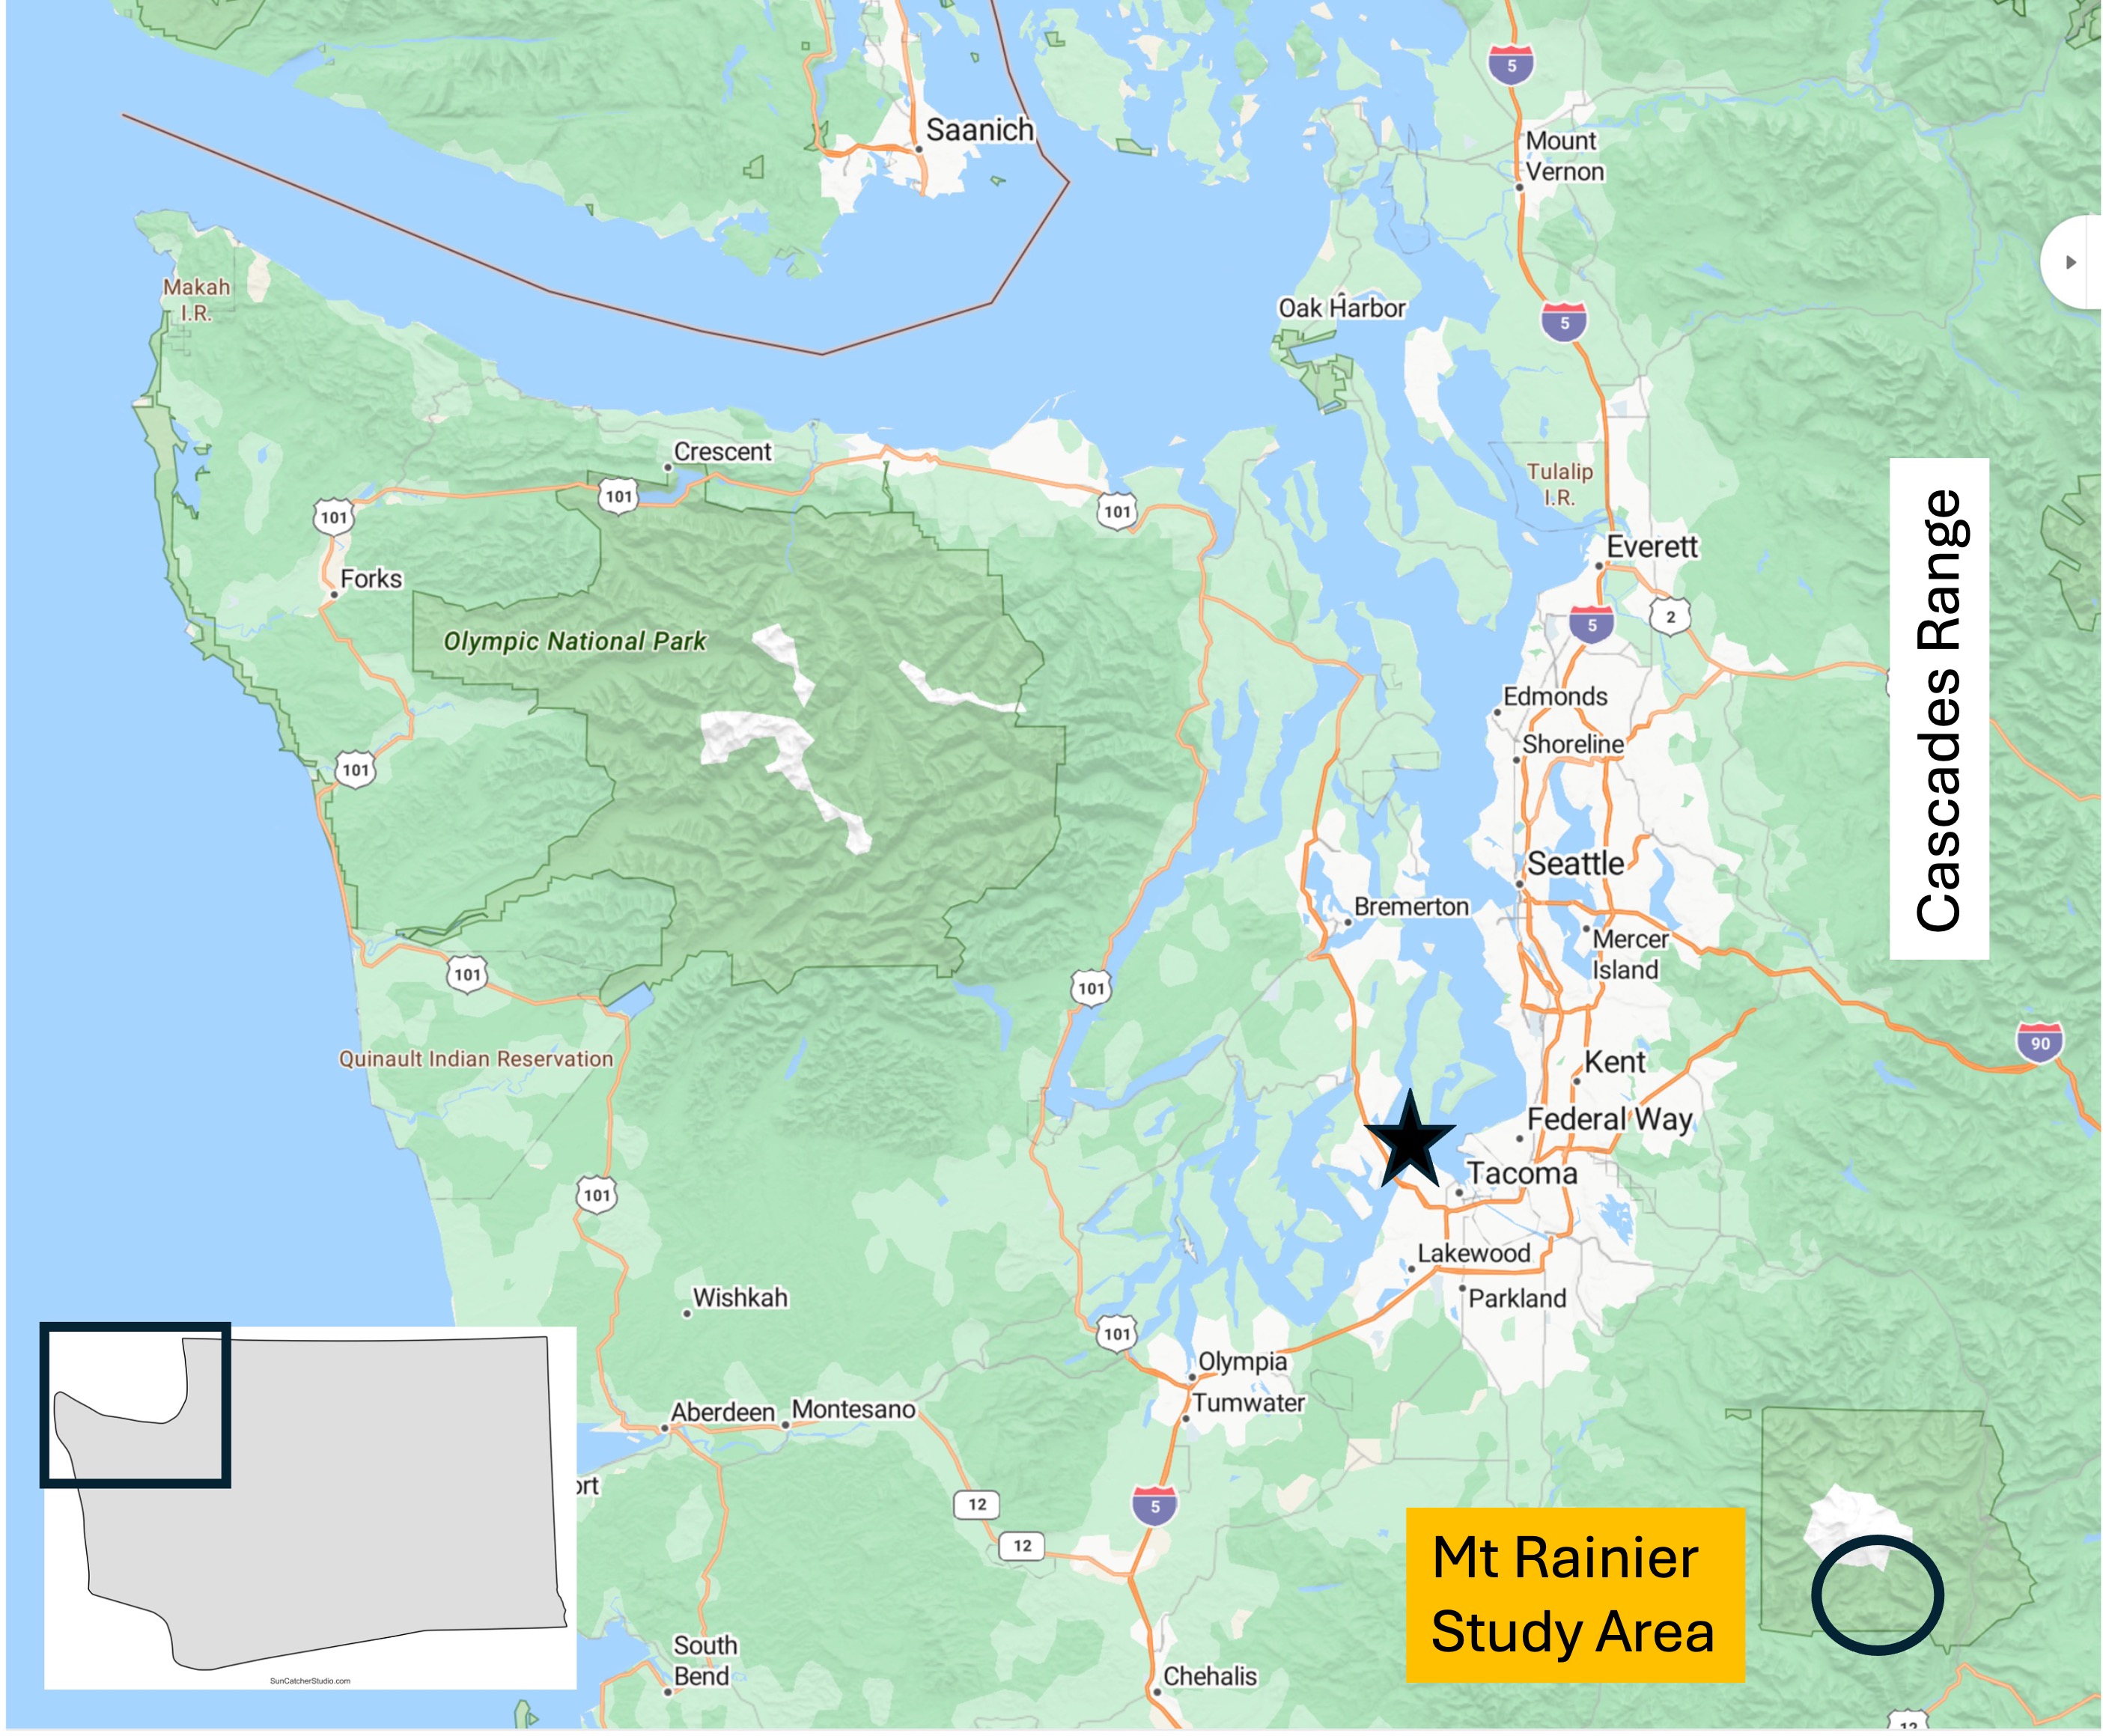
Figure 2. From my home in Tacoma (star) it’s a two-hour drive to Mt Rainier National Park. It is part of the Cascades Range, which comprises many well-known volcanoes like Mt Baker, Mt St. Helens, and Mt Hood.

Figure 3. This photo was taken on the south flank at an elevation of about 5400 feet, near the visitor’s center. It was a beautiful day and there were a lot of people preparing for some cross-country skiing on a couple of feet of snow. From this elevation it takes 2-3 days to reach the summit, almost 9000 feet higher. It’s hard to imagine it being so high and taking so long to reach.

Figure 4. These southern volcanic mountains are part of the Tatoosh Range, with peaks of about 6600 feet. Most of the volcanic rocks comprising these mountains are andesite, intermediate in composition between basalt and rhyolite. It is also very viscous, behaving like peanut butter and thus not flowing well. Andesite is commonly found at convergent plate boundaries where it is thought to result from mixing of basalt (from the oceanic crust), continental crust, and sediments accumulated in the accretionary prism.

Figure 5. Map of the 28 glaciers on Mt. Rainier. The glaciers fill canyons and valleys that were partly cut by ice. Figure 3 shows a smooth mountain, but in reality most of the smooth areas are the surfaces of glaciers. We’ll look at one below. The ellipse indicates the area discussed in this post.

Figure 6. (A) Narada Falls interrupts the descent of Paradise River, fed by Paradise Glacier (see Fig. 5 for location), making it drop a couple hundred feet over a thick layer of andesite. Andesite tends to form blocky flows, as shown in the right side of the photo, where the water seems to be climbing down steps. (B) Possible contact between younger volcanic and older intrusive rocks. Igneous activity within the area has been continuous for at least 50 my, during which time erosion has exposed older intrusive rocks like this granodiorite, which is part of a pluton intruded between 23 and 5 Ma. It is important to keep in mind that the volcanic rocks originated in plutons (magma chambers) emplaced miles beneath the surface. As they are exposed, new volcanoes form as more magma is injected into the shallow crust in a continuous process. (C) Differential weathering has accentuated layering in this volcanic rock, which was probably created by a series of ash layers deposited in quick succession–geologically speaking.
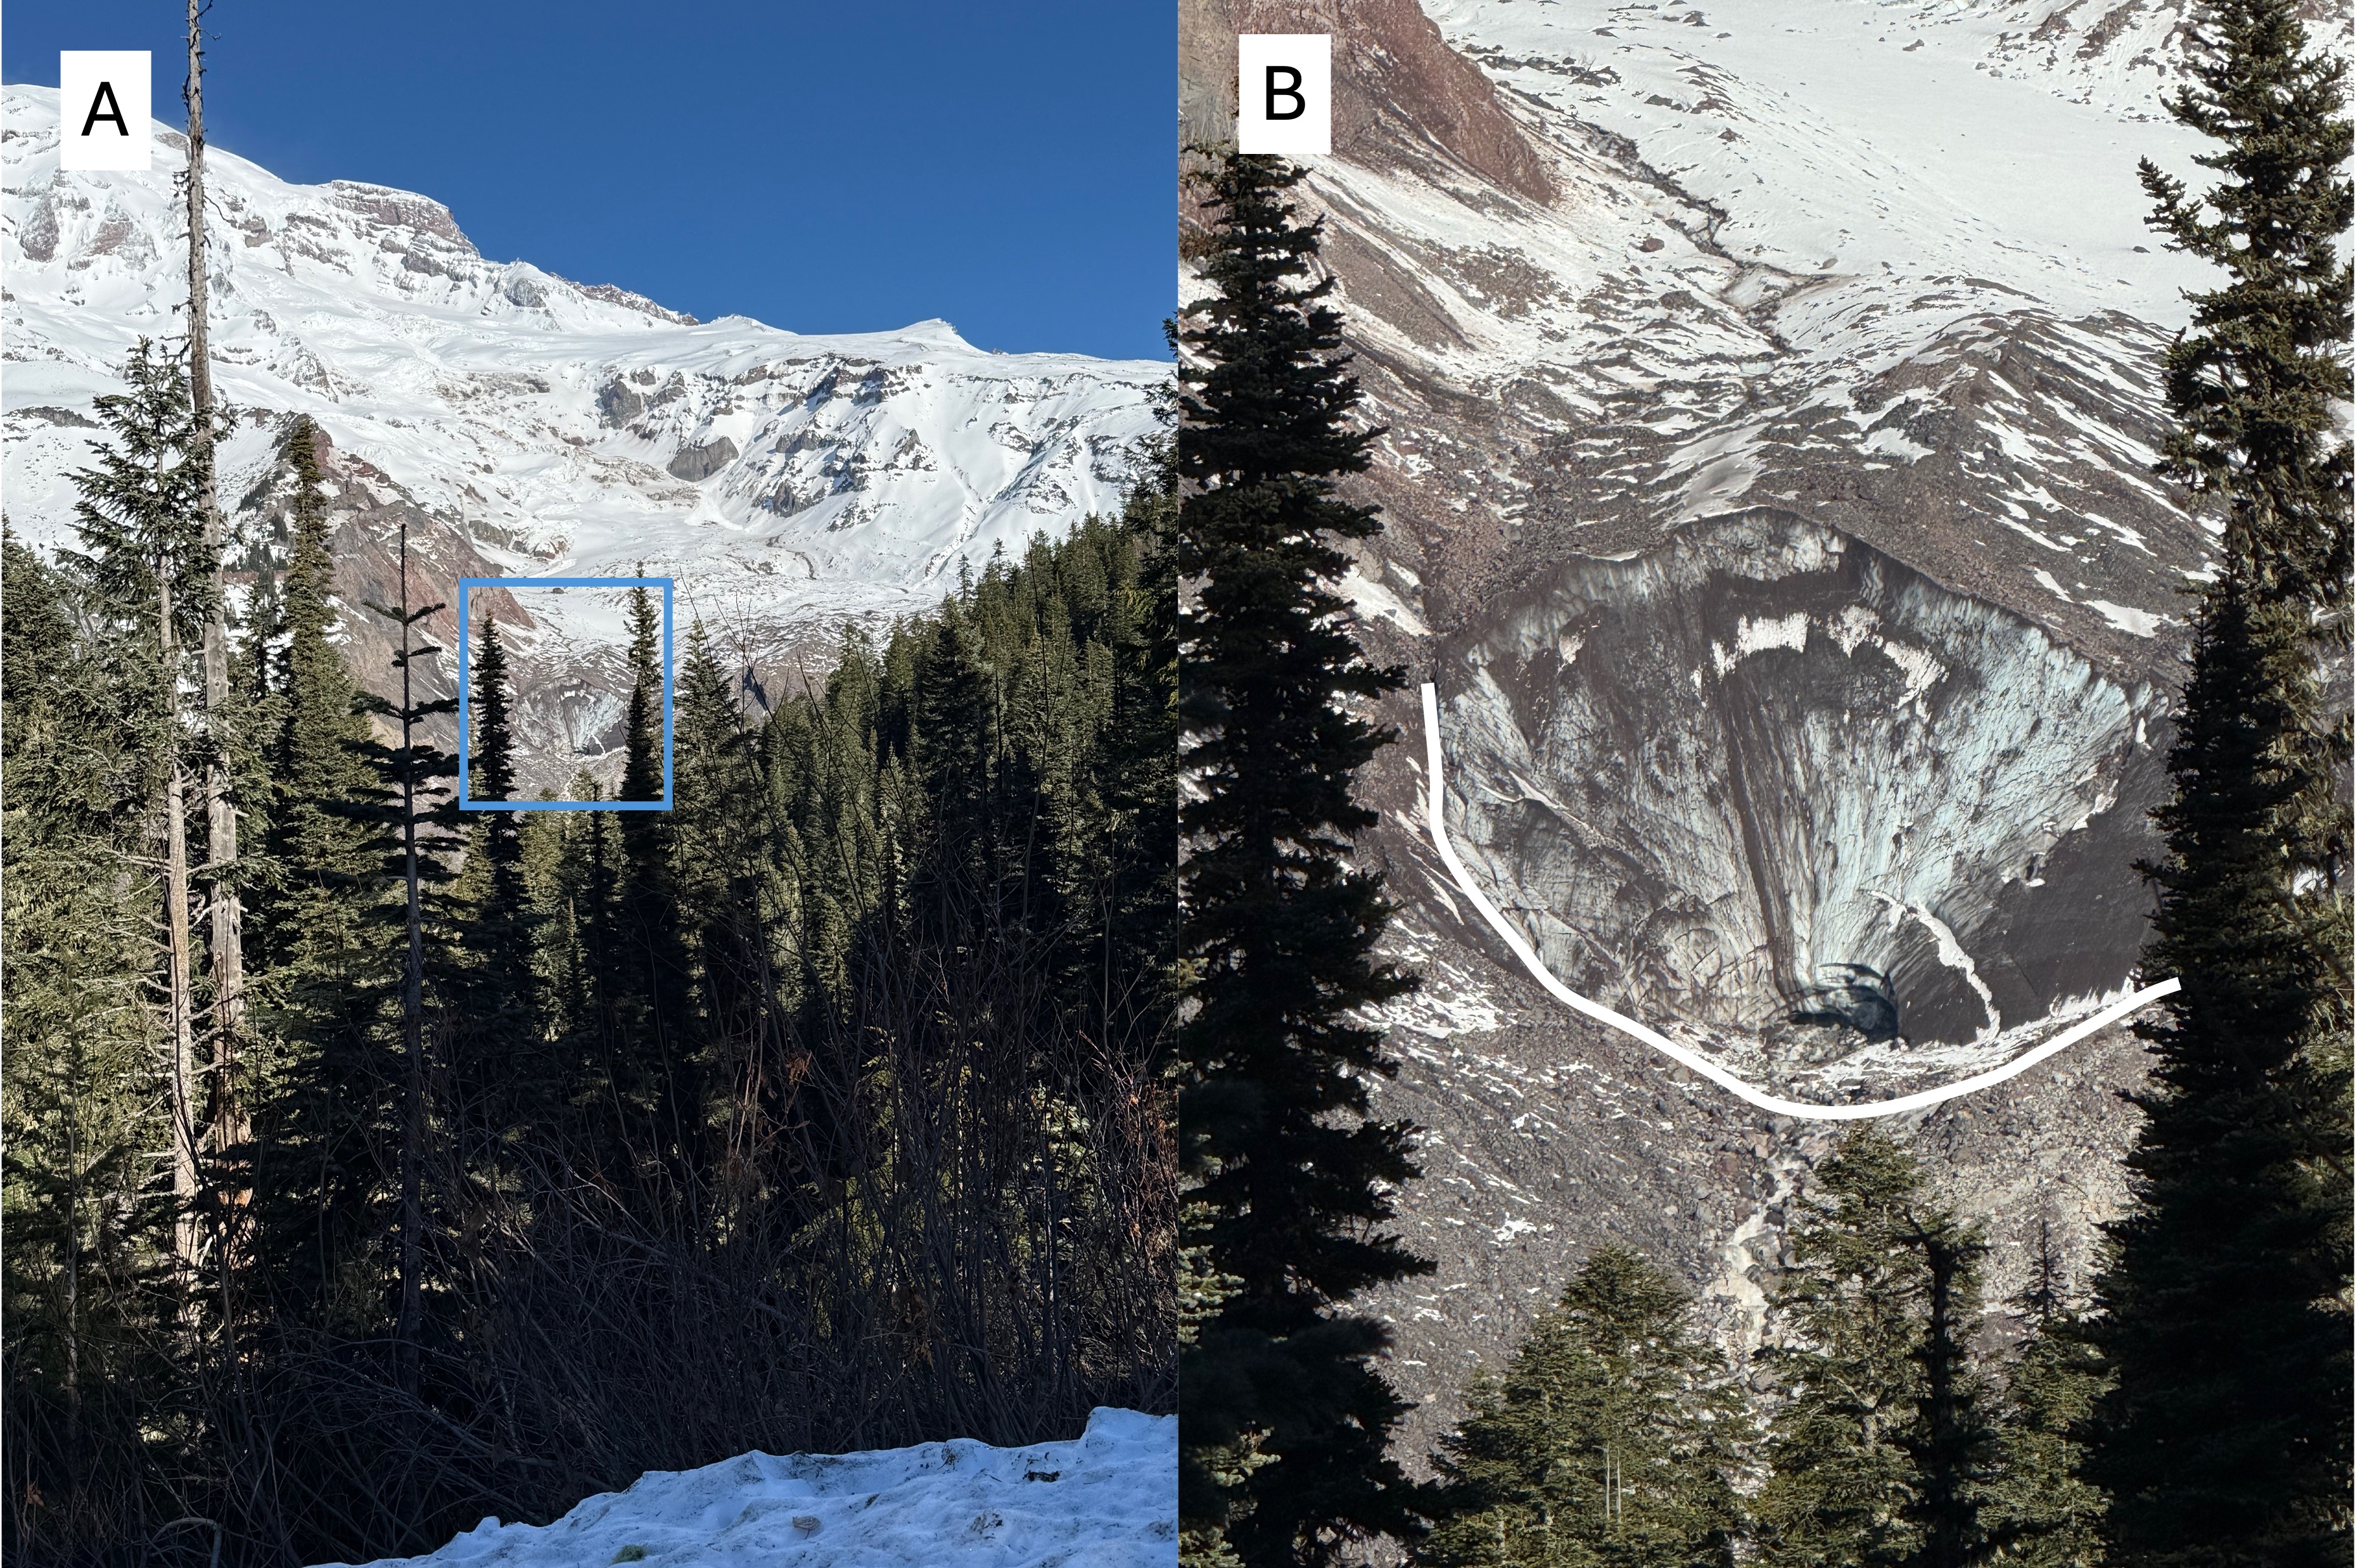
Figure 7. (A) View looking north towards the source of Nisqually Glacier (see Fig. 5 for location), which originates near the peak of Mt Rainier. The area delineated by the blue rectangle is the face of the glacier. (B) Closeup of the face of Nisqually Glacier. The characteristic U-shaped valley carved by glaciers is highlighted in white. Note the dark material within the glacier, probably wind-blown fine sediment. It looks like the face is a couple hundred feet high. I’ve never seen a retreating glacier before, so this is pretty spectacular to me. The Nisqually River originates right here…
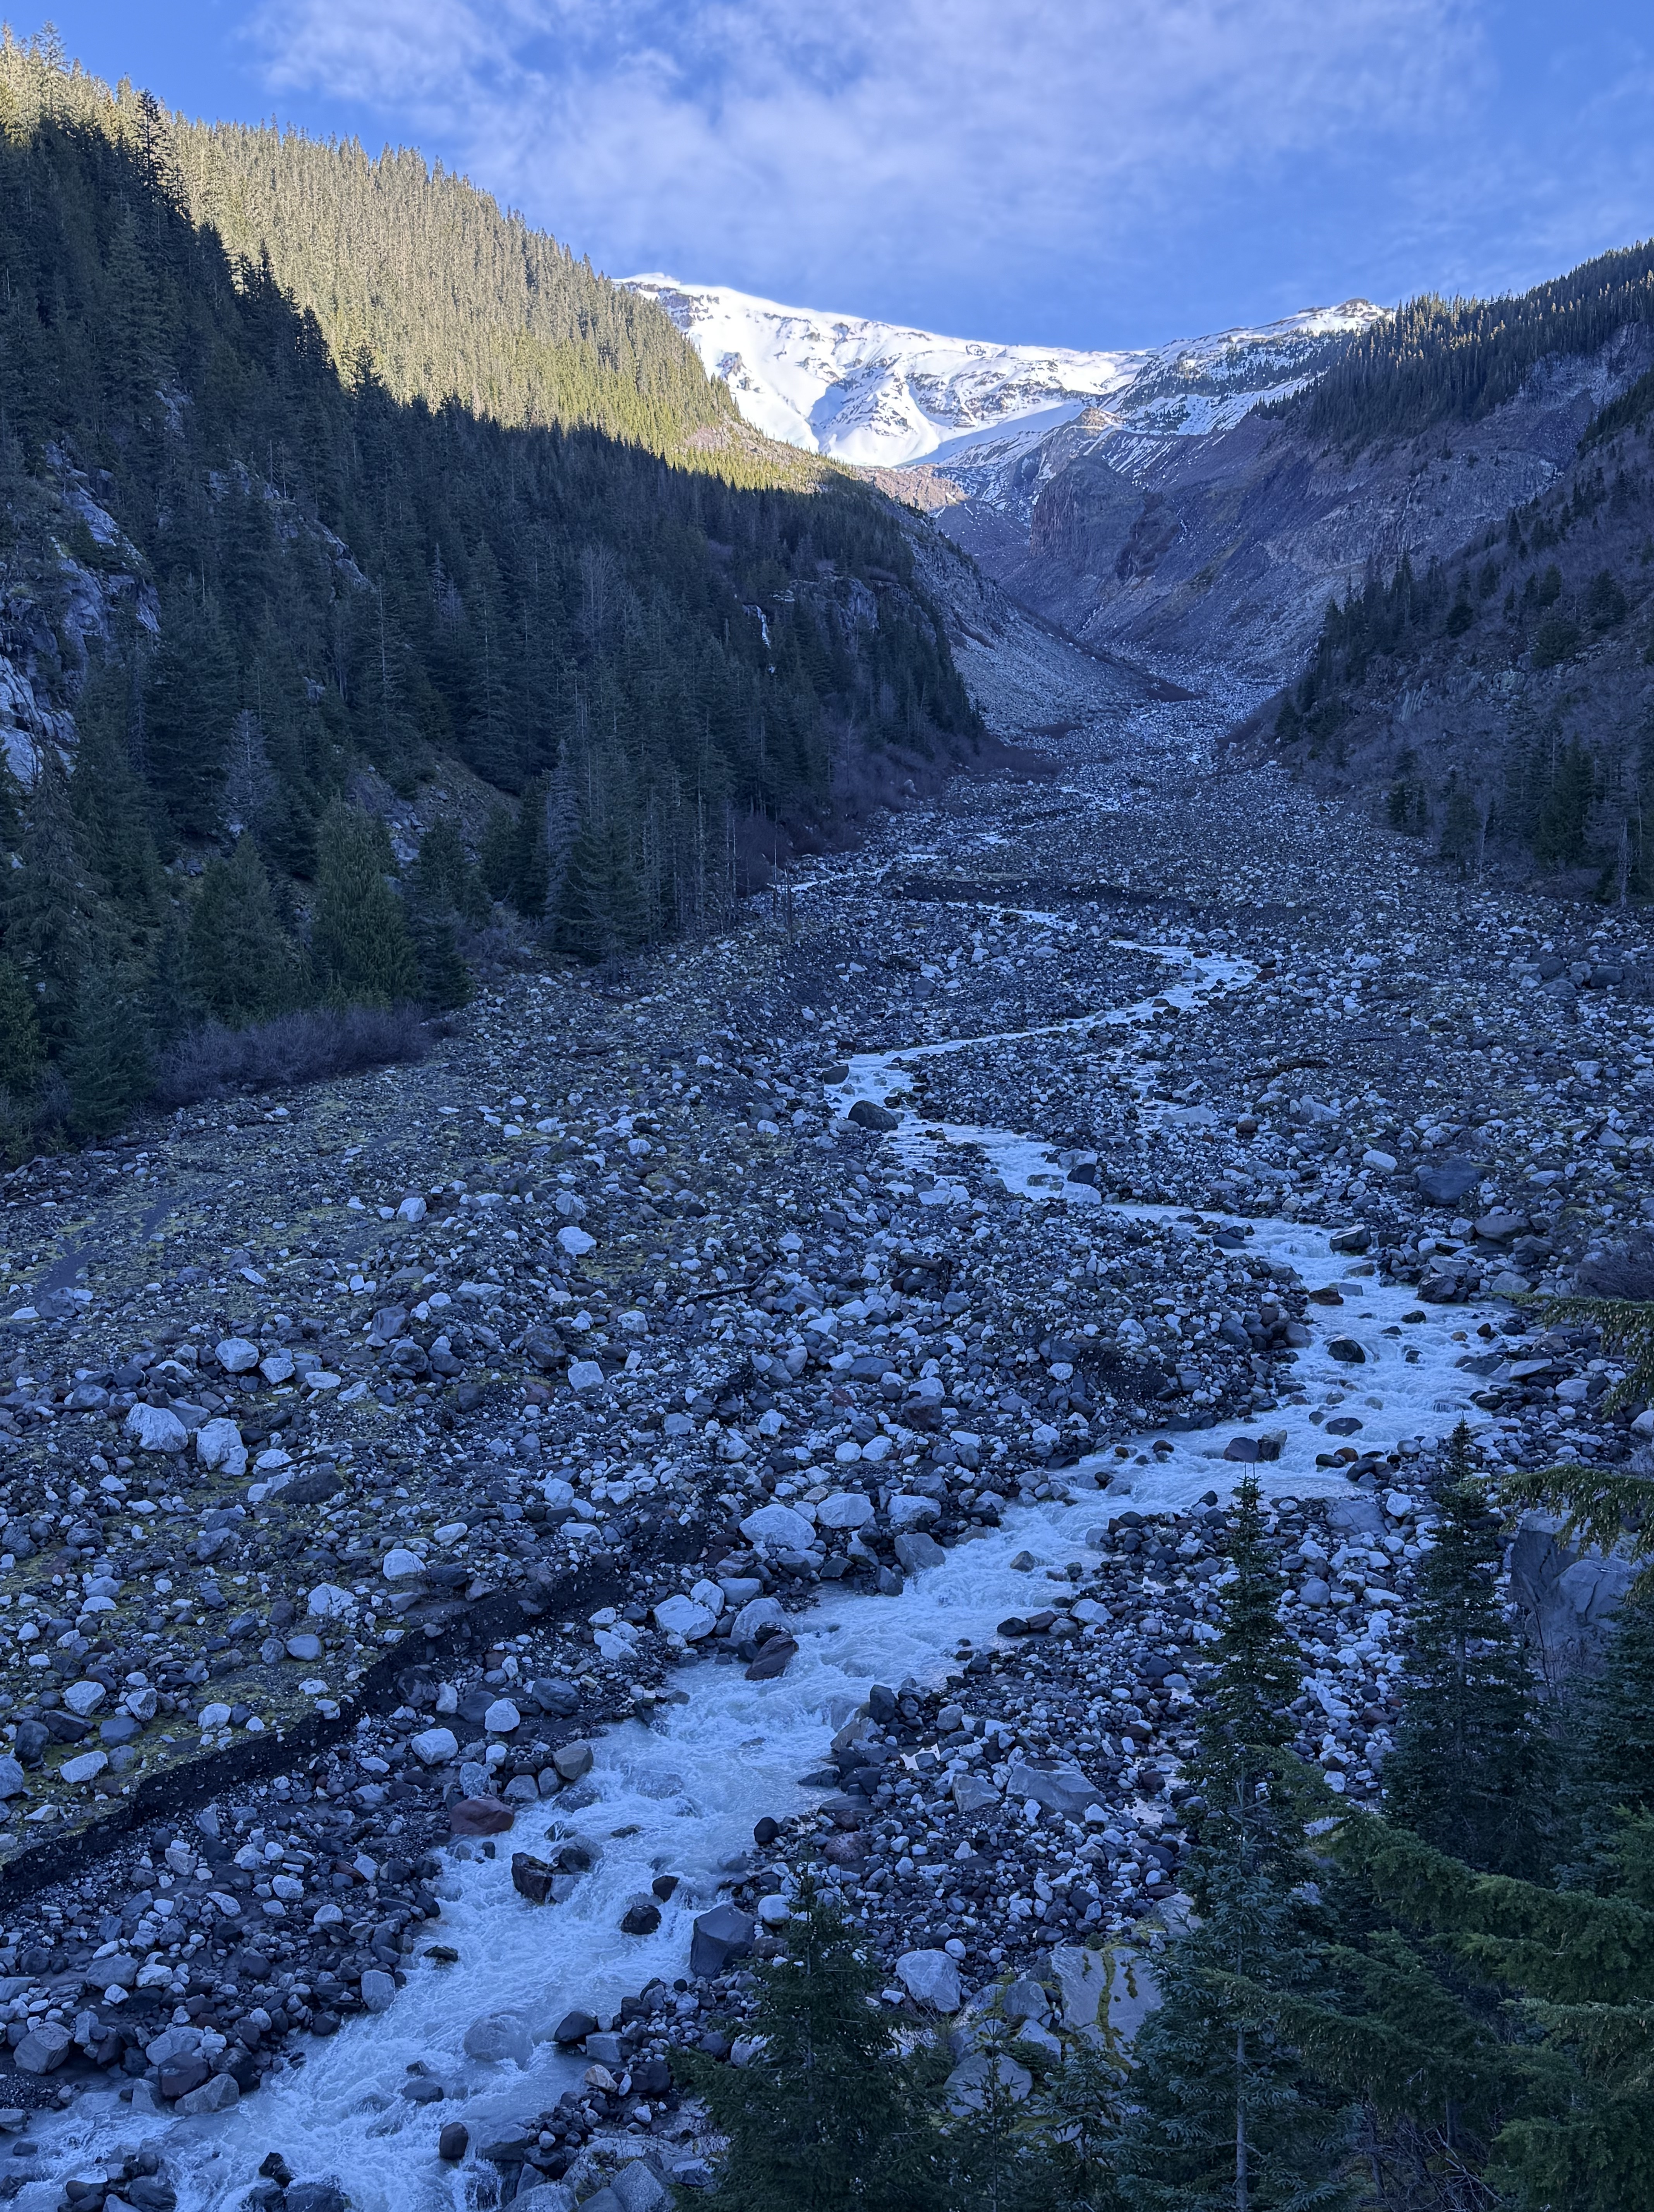
Figure 8. View looking upstream along Nisqually River a mile downstream from Fig. 7. This is one of the most stunning photos I’ve ever taken because it reveals geological continuity, from the origin of a glacier 10000 feet higher, to the outwash being transported by a river. Amazing! Note the perfect U-shape where the shadow ends upriver. This area would have been covered by the glacier as recently as 10000 years ago.

Figure 9. Another mile downstream from Fig. 8 the walls of the valley have lowered, and are now rimmed by volcanic flows half-buried by detritus. Evidence of a glacier filling the valley has been erased by collapse of the valley walls. Rounded boulders fill the riverbed. The Nisqually River is overwhelmed by the huge sediment load and opens up new channels to continue flowing.

Figure 10. View looking upstream at the confluence of Nisqually River and Van Trump Creek. There are a couple of interesting features visible in this braided stream bed, less than two miles from the glaciers feeding each branch. The valley is very wide and flat-bottomed because it was carved by glaciers more than 10000 years ago. The large boulders (as large as three feet) covering the entire valley floor were transported by a glacier and became relict after its retreat because the stream flow, even during floods, is too weak to transport and erode them. The Nisqually River is cutting a channel through these relict sediments; the scarp is about eight feet in height. The white line delineates large, surface boulders from subjacent sand and silt with few boulders. Note that the surface boulders stop upstream where the white line curves sharply upward.

Figure 11. Image from 200 feet downstream of Fig. 10, showing a break eroded in the boulder-bar that crosses the stream bed at an angle. During recent heavy rain Nisqually River broke out of its current channel and created a myriad of flow structures such as the longitudinal bars seen in the lower-right of the photo. I think this bedform is actually a terminal moraine marking the maximum advance of a previous glacier–not necessarily the maximum glacial extent during the last two-million years.

Figure 12. (A) Andesite boulder (2 feet across) wet by recent rain shows fine-scale structure. The irregularity of the laminae, and phenocryst distribution, suggest to me that this sample represents ash fall rather than a flow. Magma with the viscosity of peanut butter tends to form smooth lines because it is difficult to penetrate, which would be necessary to create the mixed-up appearance between the lighter and darker shades in the center of the image. (B) Large block (~10 feet long) of intrusive rock similar to that seen at Narada Falls (Fig. 6B), but this is two-miles downstream. This relic was pushed/dragged by a glacier to this location. The white circle indicates where a close-up photo was taken. (C) Close-up (5x) image of the heavy block. It contains quartz (Q), plagioclase/albite feldspar (no orthoclase) (F), and amphibole (Am). My estimate of the composition is: 50% feldspar; 30% quartz; and 20% amphibole. Based on my estimated mineral composition, this would be granodiorite; however, I didn’t differentiate plagioclase and albite feldspar. (The former is darker than the latter.)
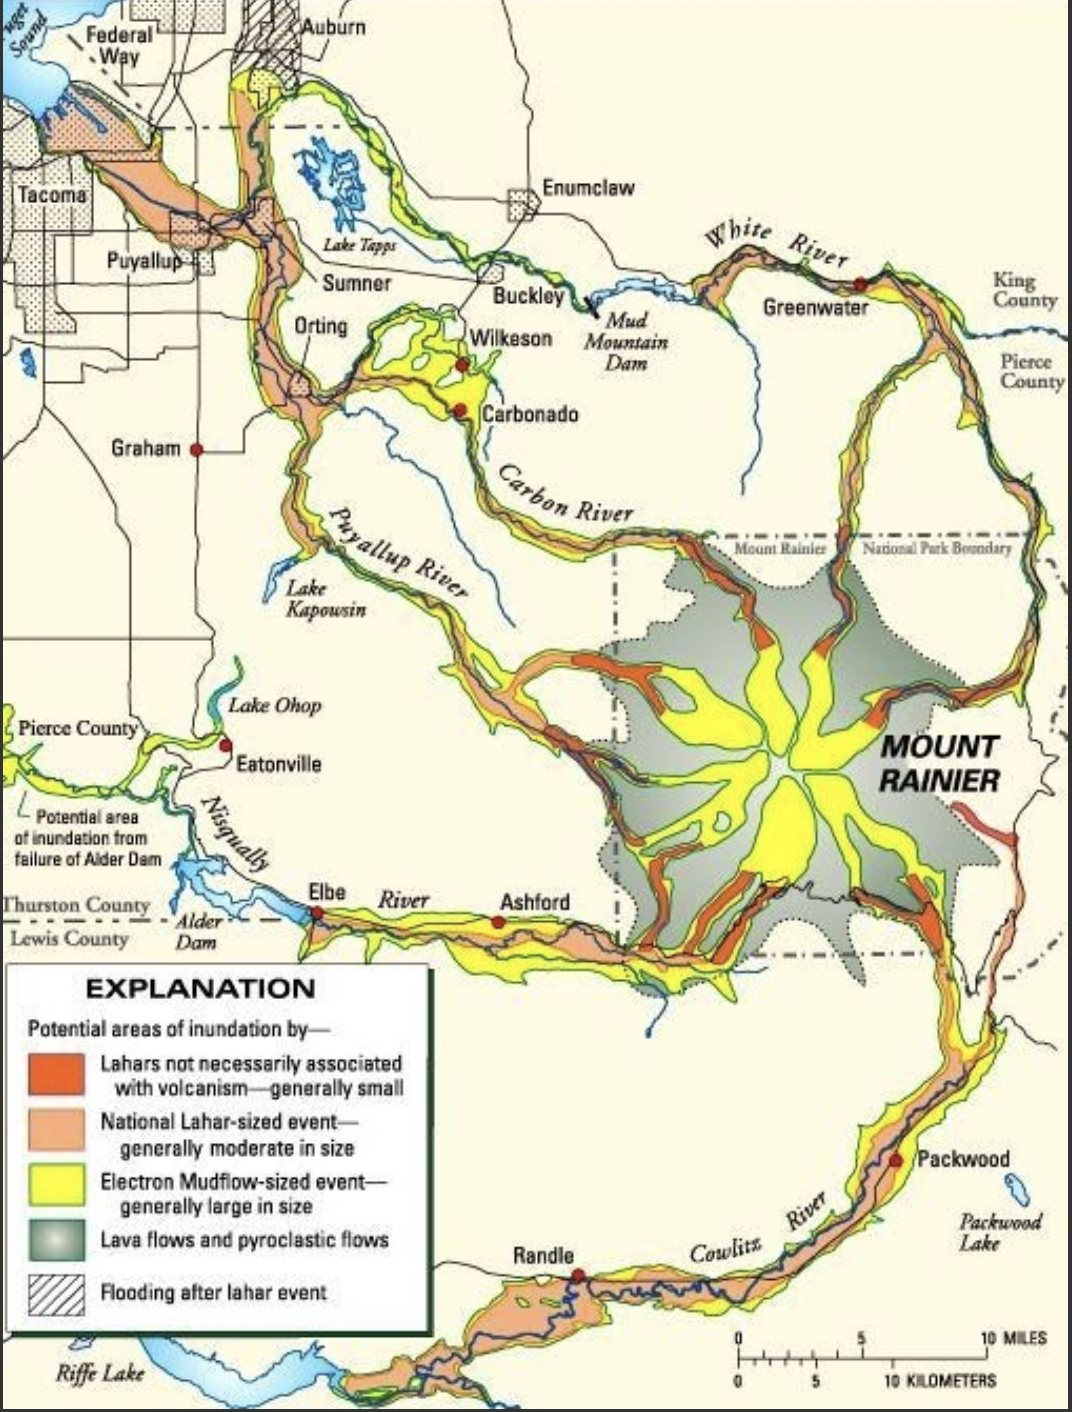
Figure 13. Map of potential volcanic risks associated with Mt Rainier–besides an explosion (e.g. Mt St Helens) and the eruption of ash which would cover a large area, depending on wind direction. Lahars (mud flows fed by all those glaciers) pose the greatest risk because andesite is too viscous to flow more than a few miles from its source.
Summary. I have seen evidence of continental glaciers in the Great Plains, the German Plain, and Ireland, but I never had the opportunity to observe glaciers up close. Alpine glaciers were nothing more than an abstract idea to me, something viewed from a distance.
I’ve looked out over the clouds from the summit of Haleakala crater on Maui, gazed into the cauldron of Kilauea, witnessed the boiling water rising from beneath Yellowstone’s seething caldera. I’ve seen videos of volcanic eruptions in Iceland, but I never imagined putting the glaciers and volcanoes together–right next door!
Usually, geology is observed as a series of images frozen in time, but at Mt Rainier it can be glimpsed as a real-time process that reshapes the earth’s surface–from top to bottom.
What a wild geological ride!
Geological Cycles at Wolf Trap National Park

Figure 1. (A) Wolf Trap National Park for the Performing Arts is located about twenty miles west of Washington DC, near several parks I’ve discussed in previous posts, especially Great Falls National Monument. The geology of the area is dominated by Neoproterozoic-to-Cambrian (1000 – 511 Ma) metasedimentary rocks that originated in oceanic environments near rapidly rising mountains (e.g., a volcanic island arc). The dates are from the time of metamorphosis, which is why they give such a long time span. Taking into account the accuracy of the dates in general, this region was undergoing erosion with the resultant sediment buried in marine trenches, probably near a subduction zone, for hundreds of millions of years. The majority of the material would have been mud. There would have been hiatuses (perhaps an ocean basin briefly emerged), but such detail is lost to us after so long. (B) This map of Wolf Trap Park shows the trail we followed. The map doesn’t show topography, but the ridges are short, with maximum relief less than 100 feet. Wolf Trap creek enters from the west (left side of panel B) and flows through a wetland area (indicated by blue ellipse) before meandering a little and following the east side of the valley.
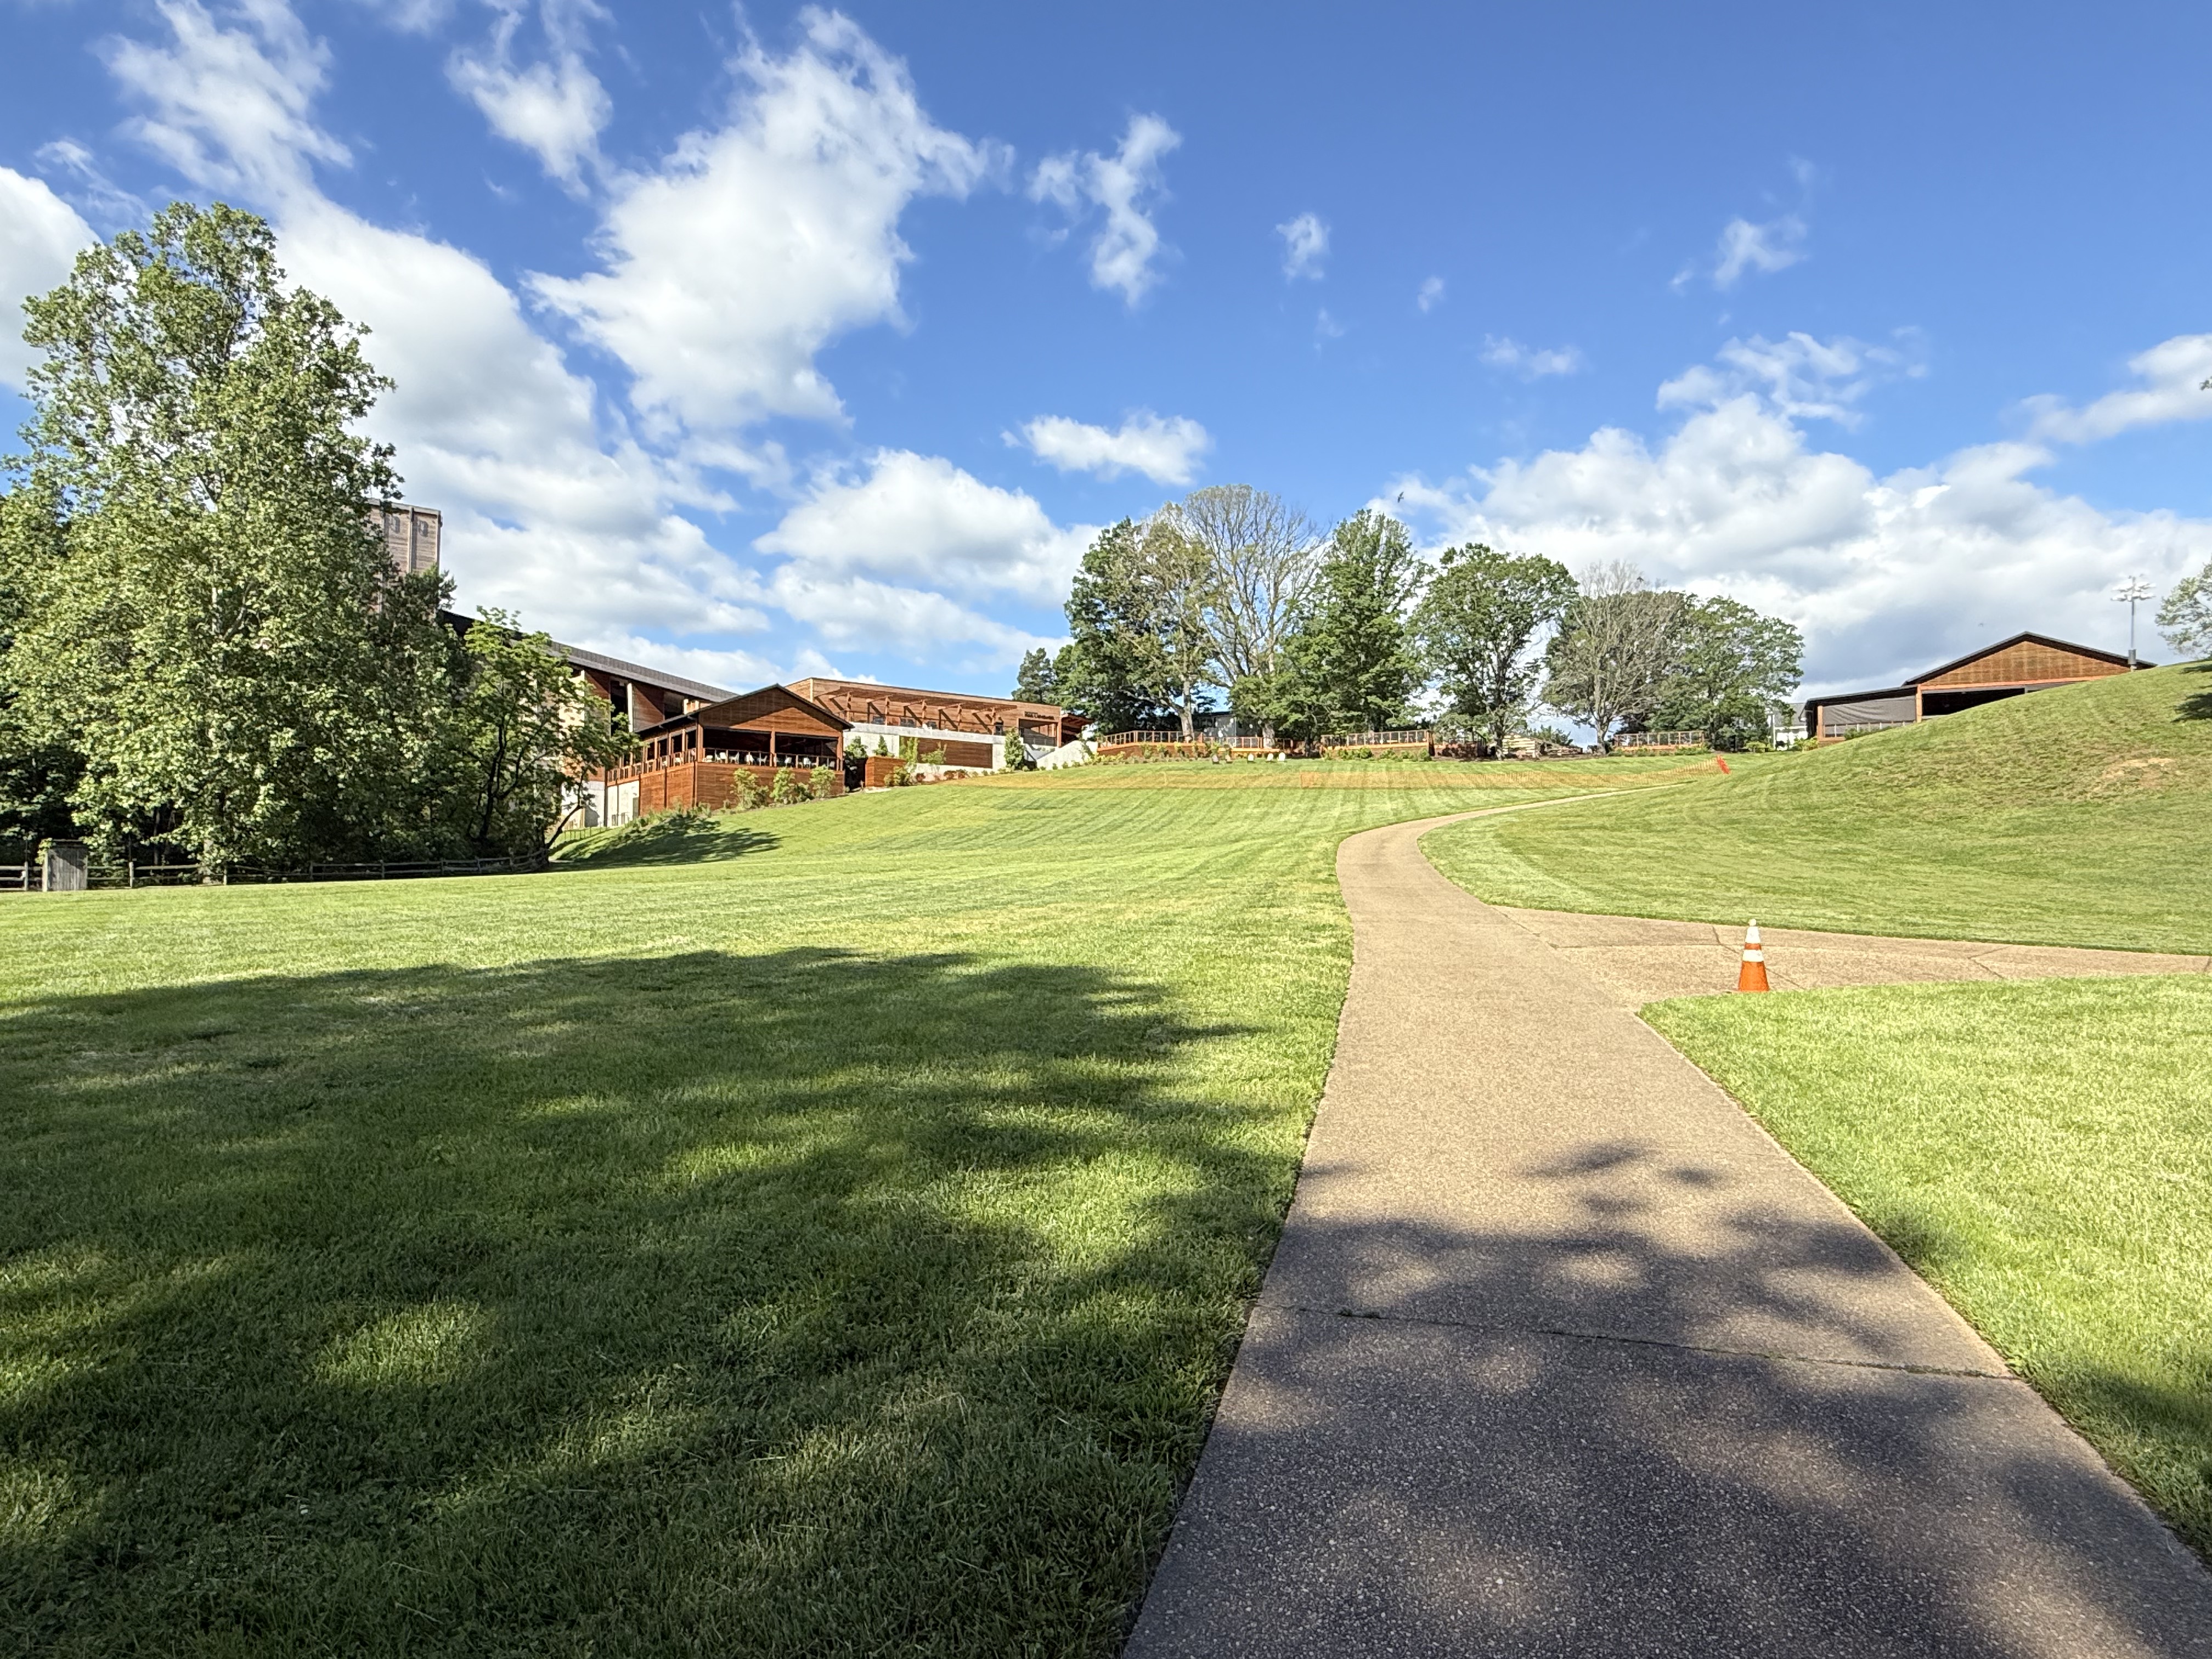
Figure 2. View of Filene Center from the SW side of our trail loop (see Fig. 1B), showing typical topographic relief at Wolf Trap park.

Figure 3. View of Wolf Trap creek where it enters the valley (Fig. 1B), showing boulders of Precambrian schist to be blocky–eroded nearby and gravitationally slid into creek but were not transported. These recently exhumed blocks are covered by Quaternary fluvial sediments, which are visible along the left side of the creek.
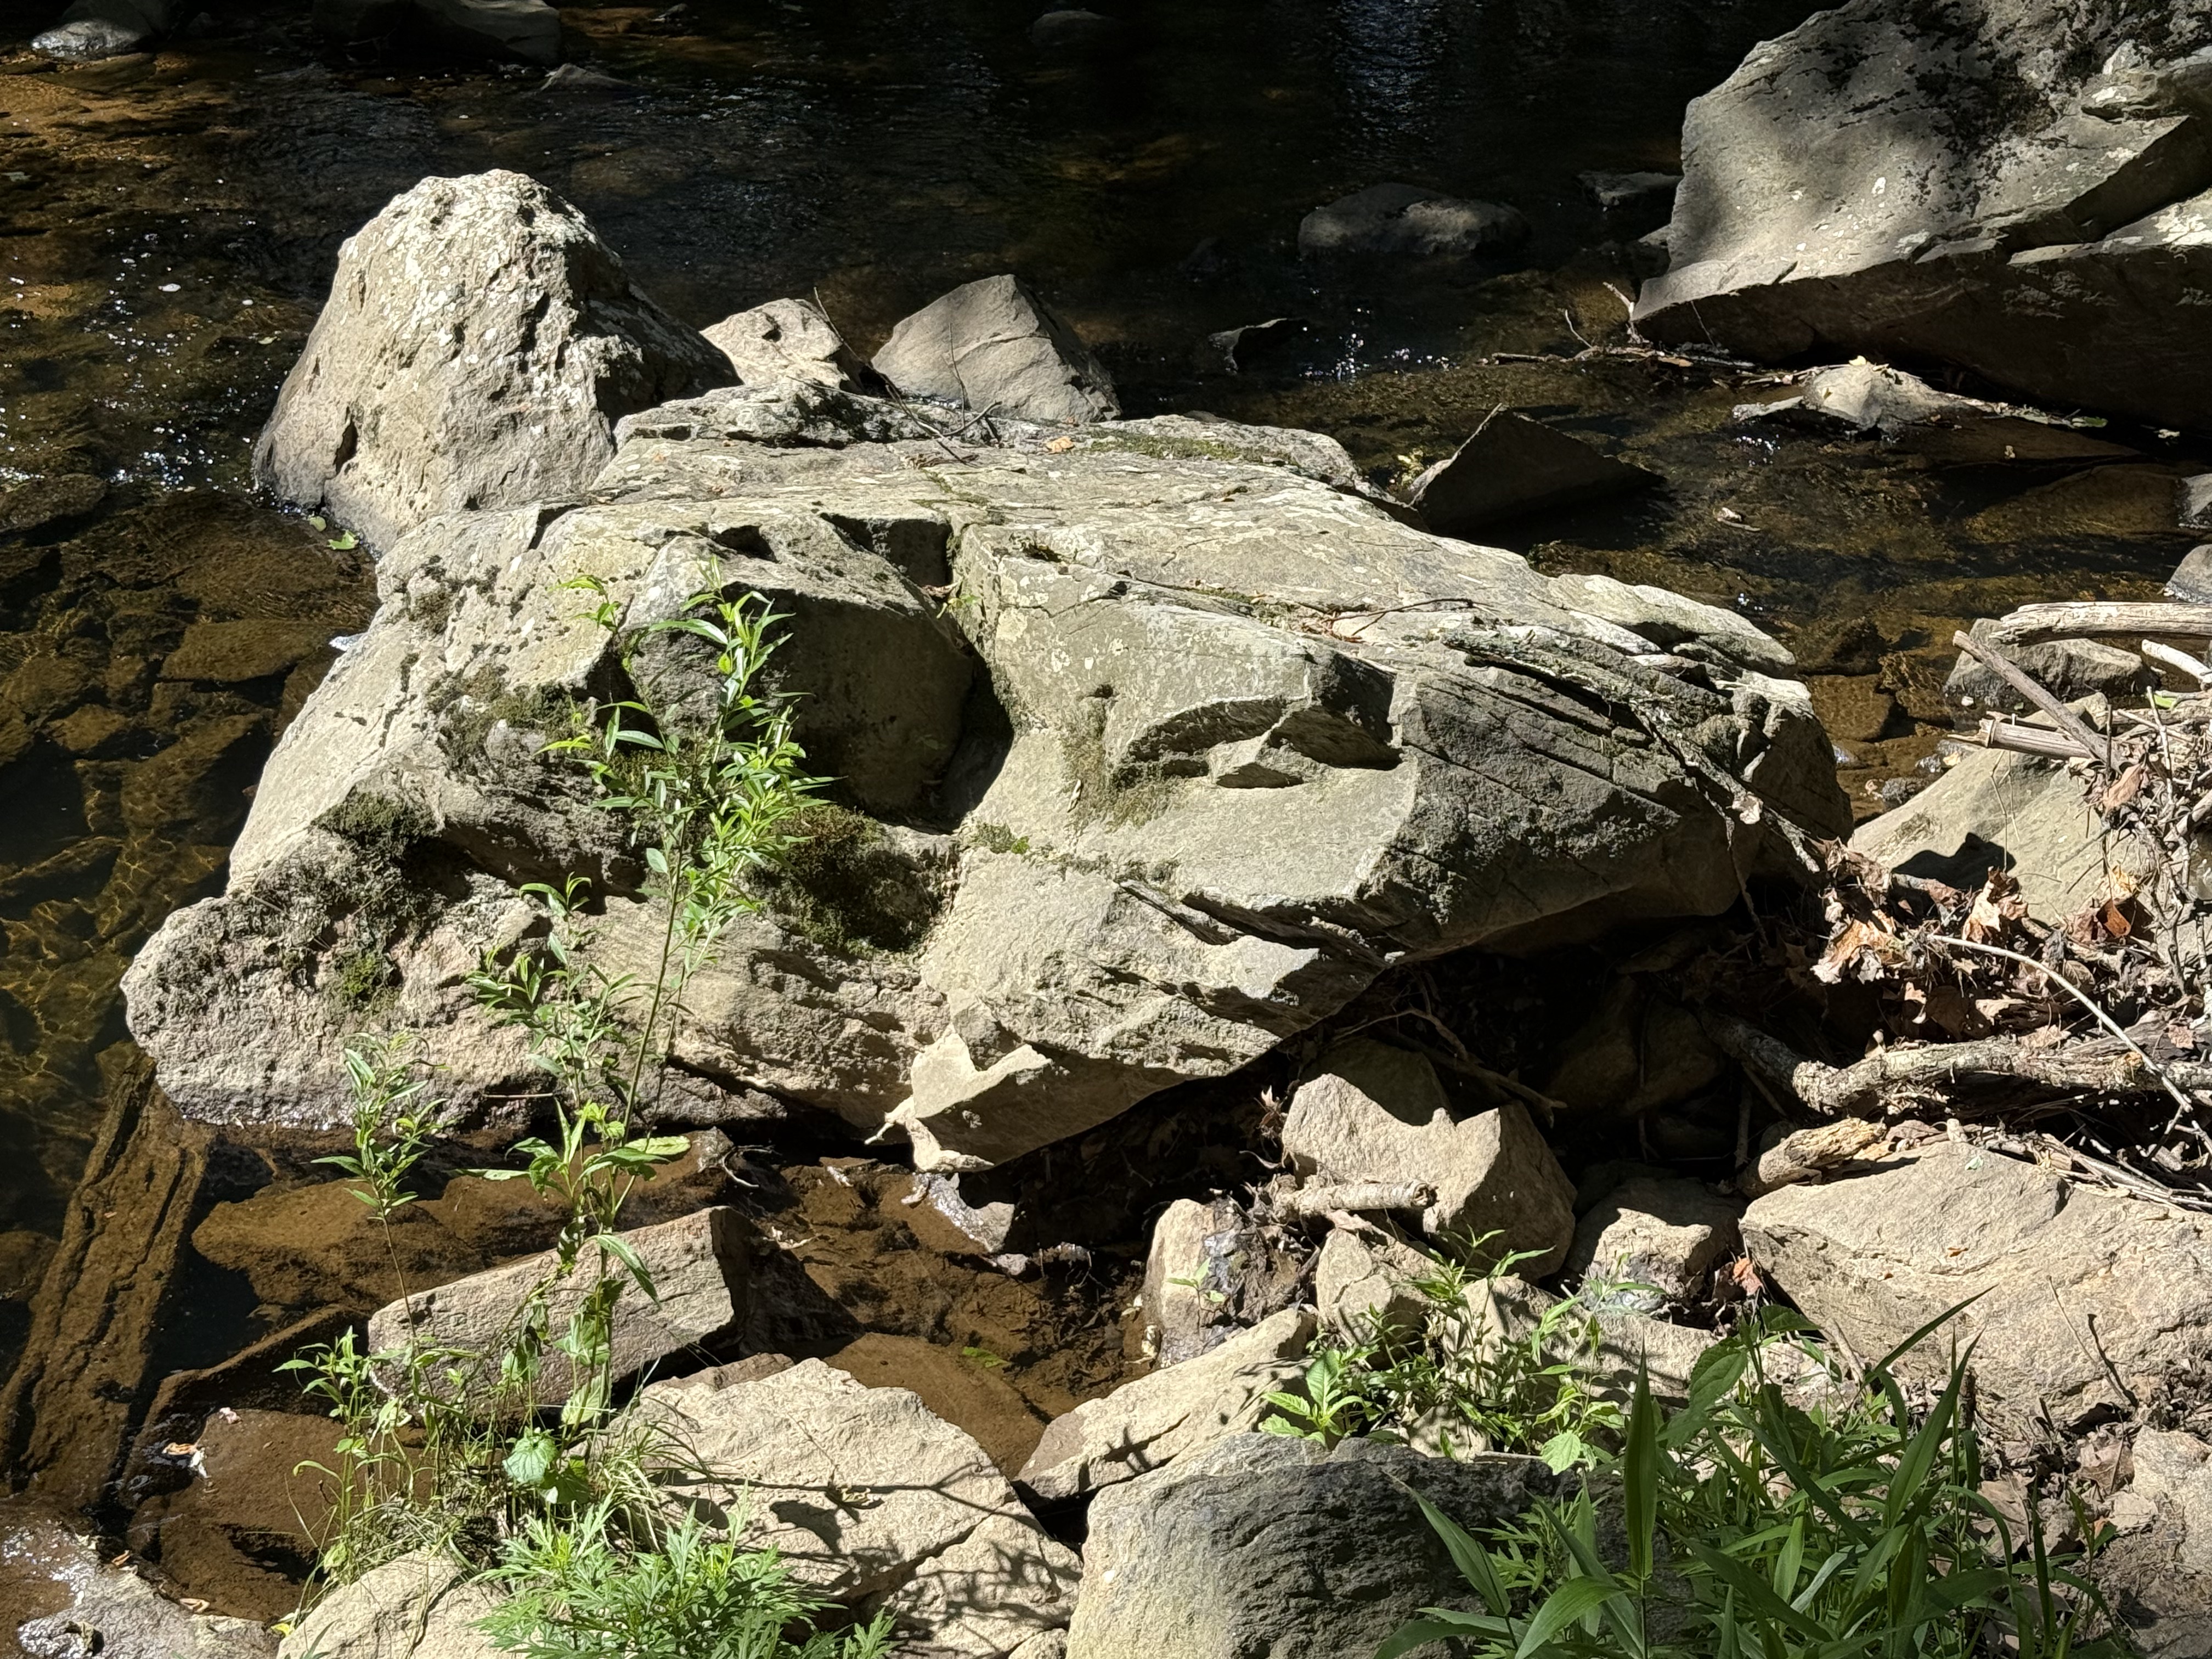
Figure 4. Large block (less than 6 feet in diameter) of schist that has been moderately weathered in place. Note the thin bedding (fissility) between thick layers with a conchoidal fracture pattern (center of image). This is the upstream side, which is pockmarked by rolling and bouncing boulders during high water. Mud becomes schist when buried deeply, retaining the lamination of the original fine-grained sediments, but remineralizing to familiar clays easily at the surface. Mud to schist to mud.

Figure 5. Meander in Wolf Trap creek along the north side of the park (see Fig. 1B), where a shallow pool of quiet water collects between runs (turbulent creek segments).

Figure 6. View looking upstream from a pedestrian bridge crossing Cthse Spring Branch, a tributary crossing our trail (dash line in Fig. 1B) before it joins Wolf Trap creek (NE side of trail in Fig. 1B). The boulders are smaller than downstream (Figs. 3 and 4), and their long axis are aligned with the stream flow. These angular blocks are sliding along on a stream-bed comprising miniature versions of themselves (note the clear view of the bottom in center of image). Even gravel and pebble-sized particles are platy because of the characteristic fissility of schist.

Figure 7. This photo dramatically reveals the effect of water on erosion.

Figure 8. This image is one I’ve seen too often here in northern VA. The sewer systems frequently follow streams because they are low points and run downhill (a good property for a sanitary system). However, when stream levels exceed expected values, the system is compromised and raw sewage can be released into the environment.
Summary. Over a billion years ago, this area was submerged beneath an ocean or marginal sea. Distant mountains eroded rapidly in a time before land plants. Vast quantities of sediment accumulated in layers of erosional debris that were subsequently buried by younger sediment. Between a billion and five-hundred million years ago, these sediments became rocks that were subsequently deformed as continental plates collided. They didn’t melt, however, and survived the cataclysm relatively unharmed, becoming schist and related metasedimentary rocks. For the last 200 million years, they have been slowly working their way to the surface as younger rocks are removed by water erosion in streams like we see all throughout NoVA. They are now exposed to the elements and are weathering to form new layers of sediment in the Atlantic Ocean, beginning a new cycle.
Washington Monument State Park, MD: Familiar Cambrian Metasediments
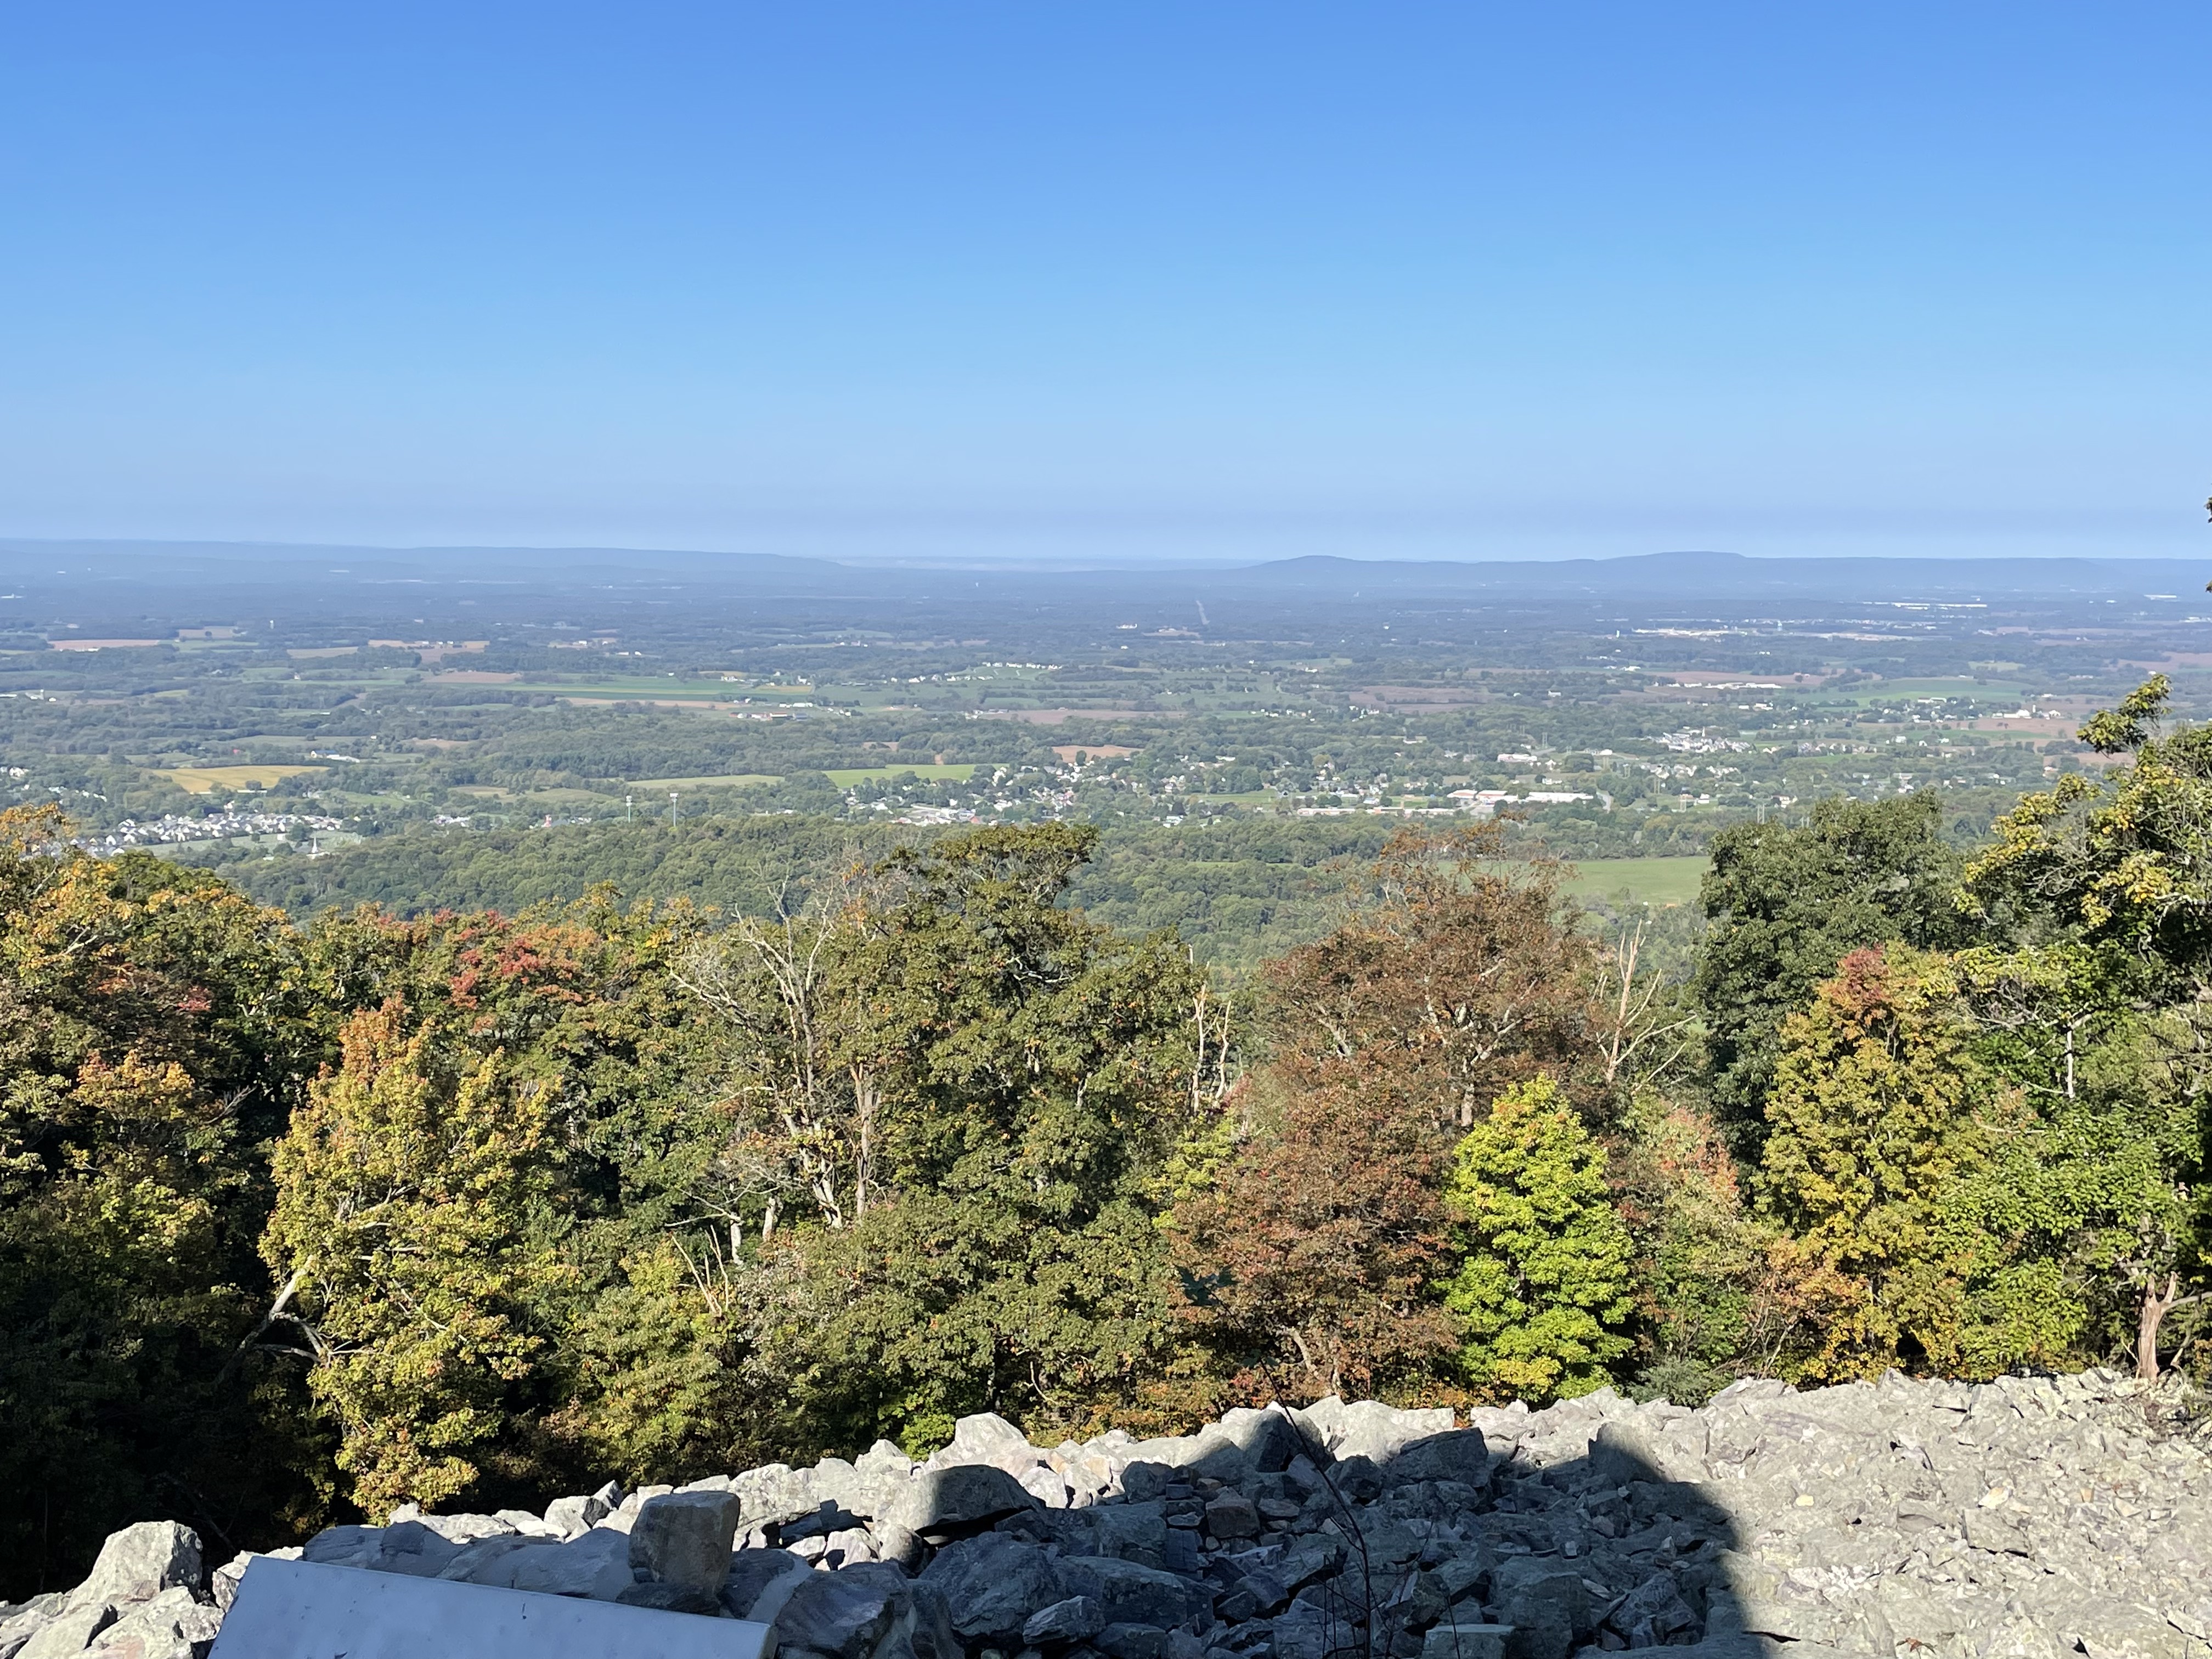
Figure 1. Looking west from Washington Monument, atop the Blue Ridge in Maryland. The valley is equivalent to the Shenandoah Valley in VA (see Fig. 2), but I couldn’t find a map with it labeled. The Appalachian trail follows the ridge through MD; we encountered it a few miles south of here in a previous post. We expect to see some of the same Proterozoic-to-Cambrian (2500-500 Ma) metasedimentary rocks here that we saw before, in addition to a surprise from an older post.
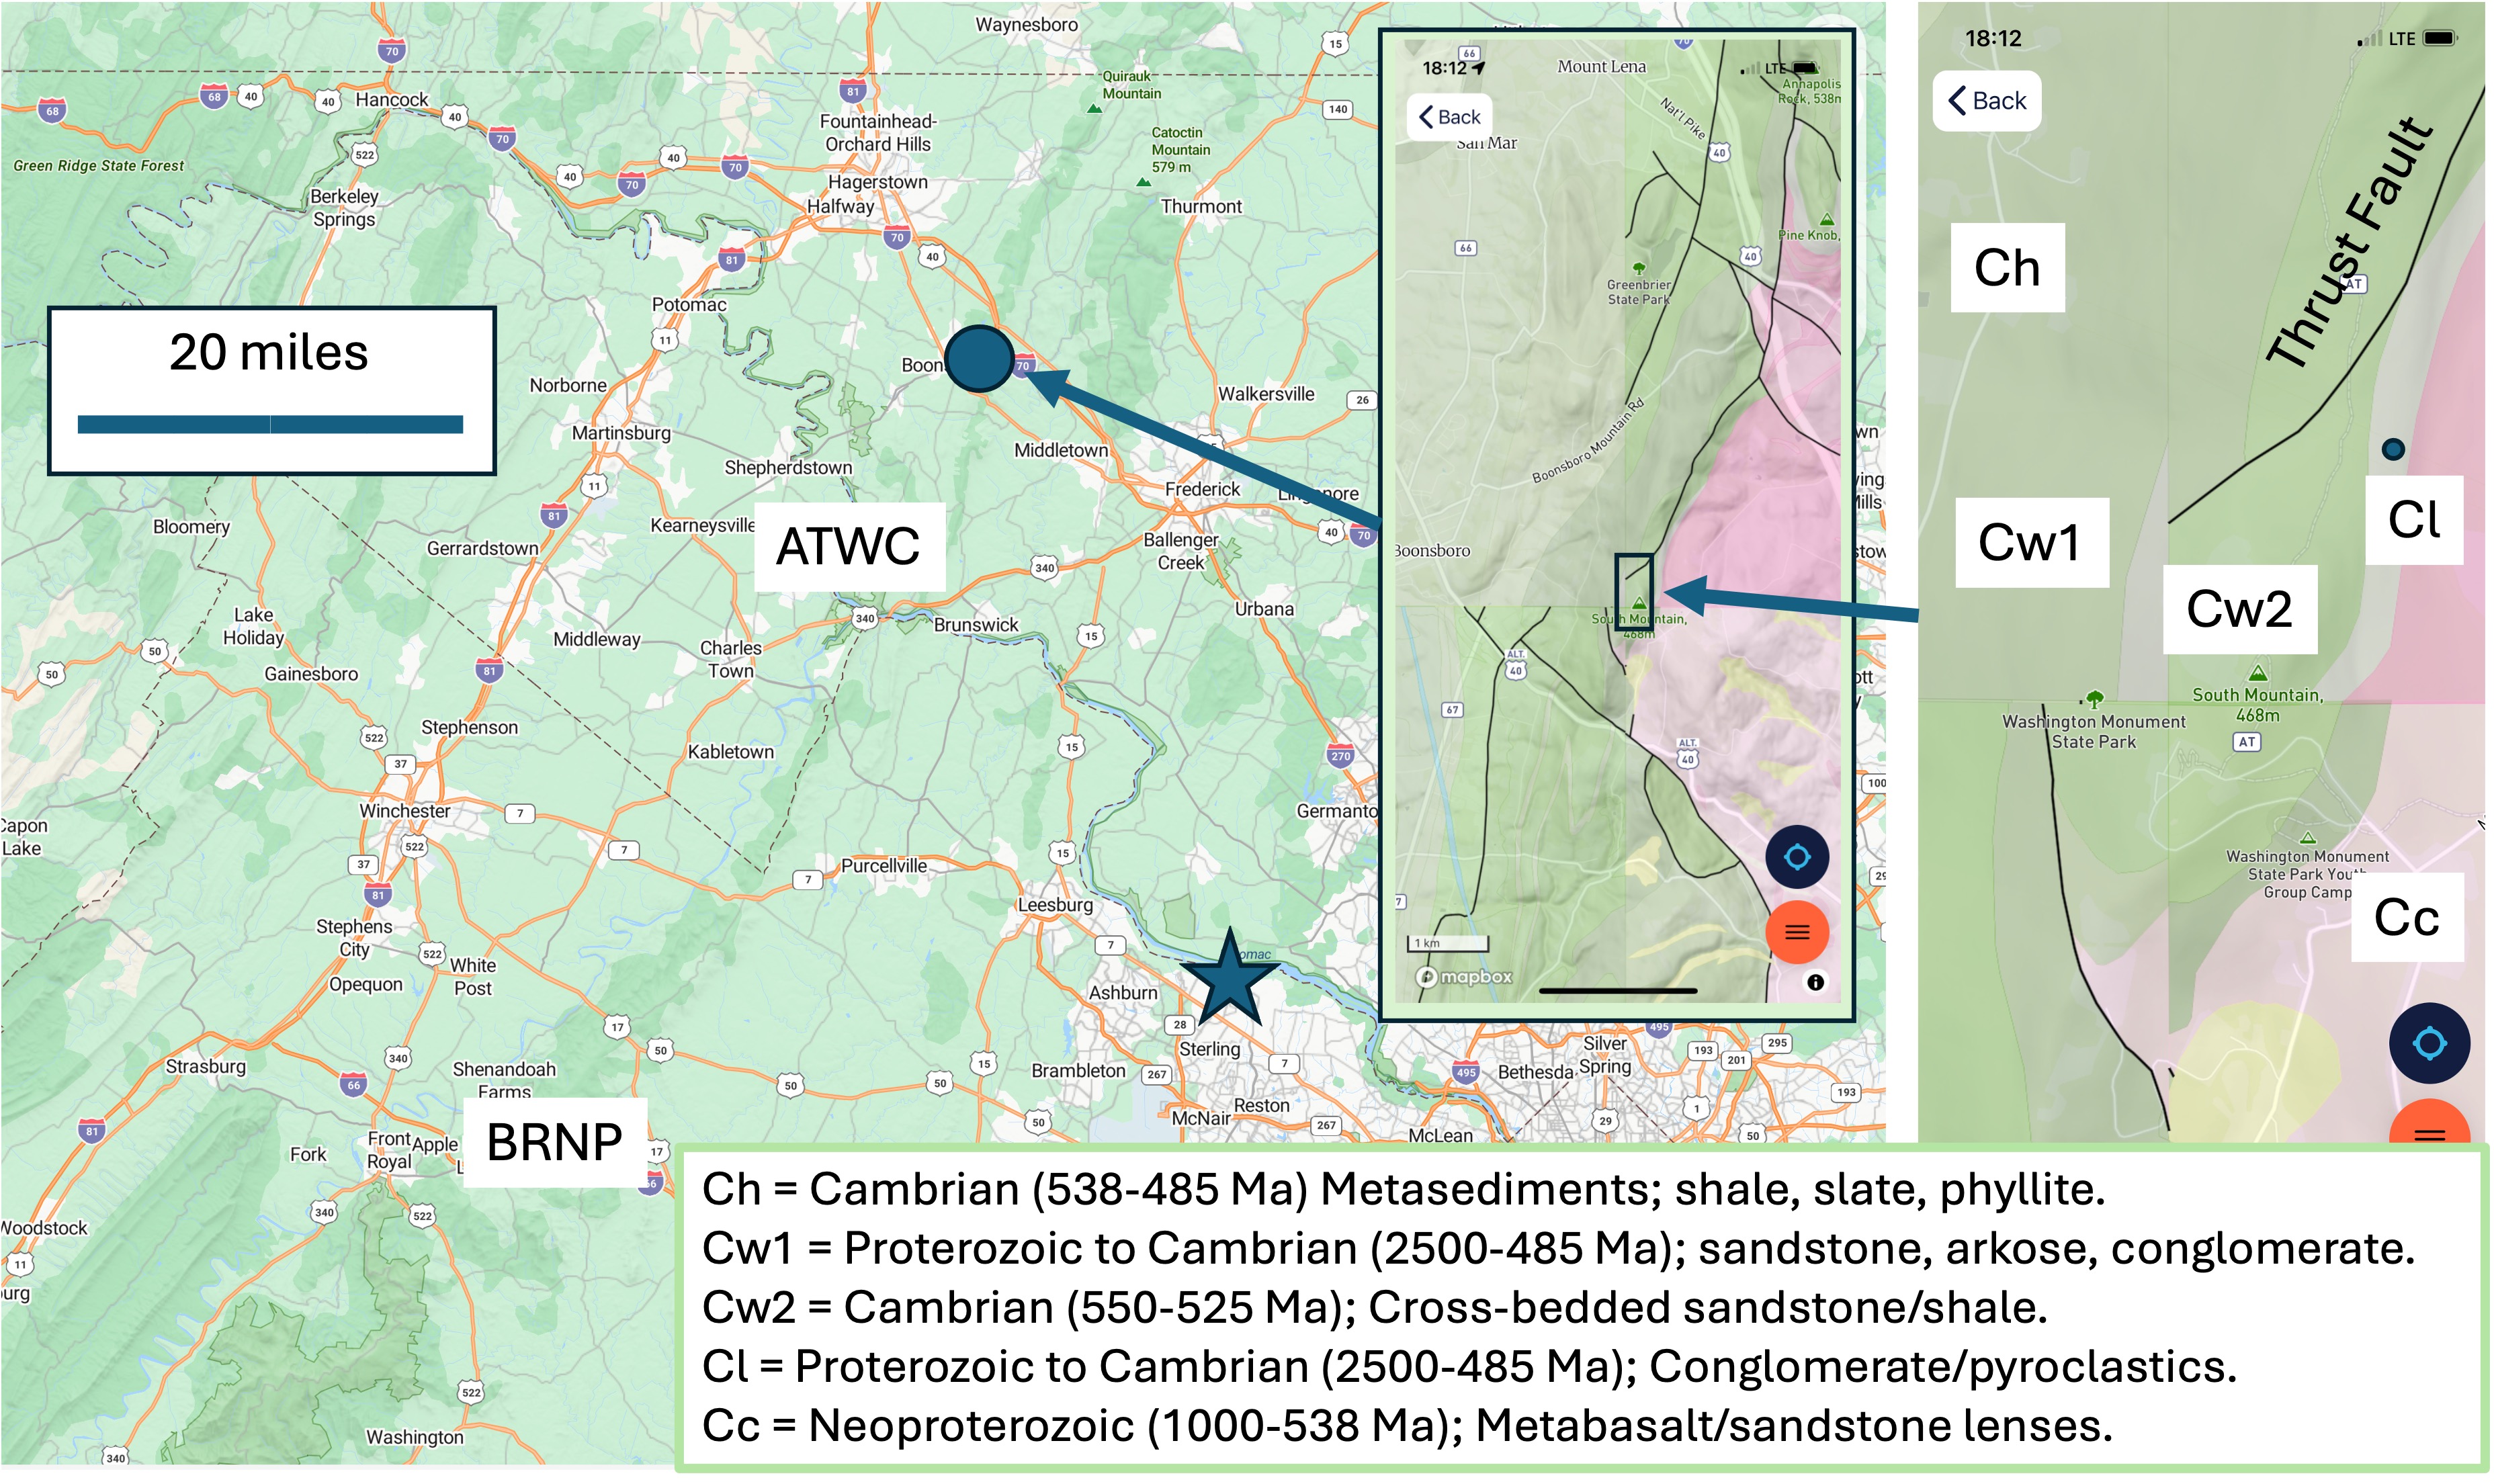
Figure 2. The field site. Washington Monument is indicated by the purple circle and arrow in the large map. The first inset map shows the geology around the monument. Note the mismatch in geology from different quadrangles; this must be a problem with either the data or Rock D, but the units (indicated in the smaller inset map to the right) were consistent when I clicked on a point. My home is indicated by the star, so you can see we haven’t traveled far. ATWC refers to the Appalachian trail at Weverton Cliff, MD, which I recommend you read to get some background. BRNP represents Bull Run Nature Preserve, which I posted last year. The geological legend for the detailed inset map is at the bottom of the figure. Note that Ma stands for a radiometric age of one-million years; this age is indicative of cooling below the threshold to set the atomic clocks within the minerals, but sedimentary rocks can’t be dated this way. Therefore, these are dates when deep burial and/tectonic deformation/magmatism ceased (i.e. when an orogenic period ended).

Figure 3. Rubble near the monument that resulted from in-place weathering of Weverton Formation rocks (Cw1 and Cw2 in Fig. 2). All of the weathering products (e.g. clays and carbonates) have been washed away, leaving large slabs (~6 feet) piled up. This is a common feature of rocky knolls with good drainage.
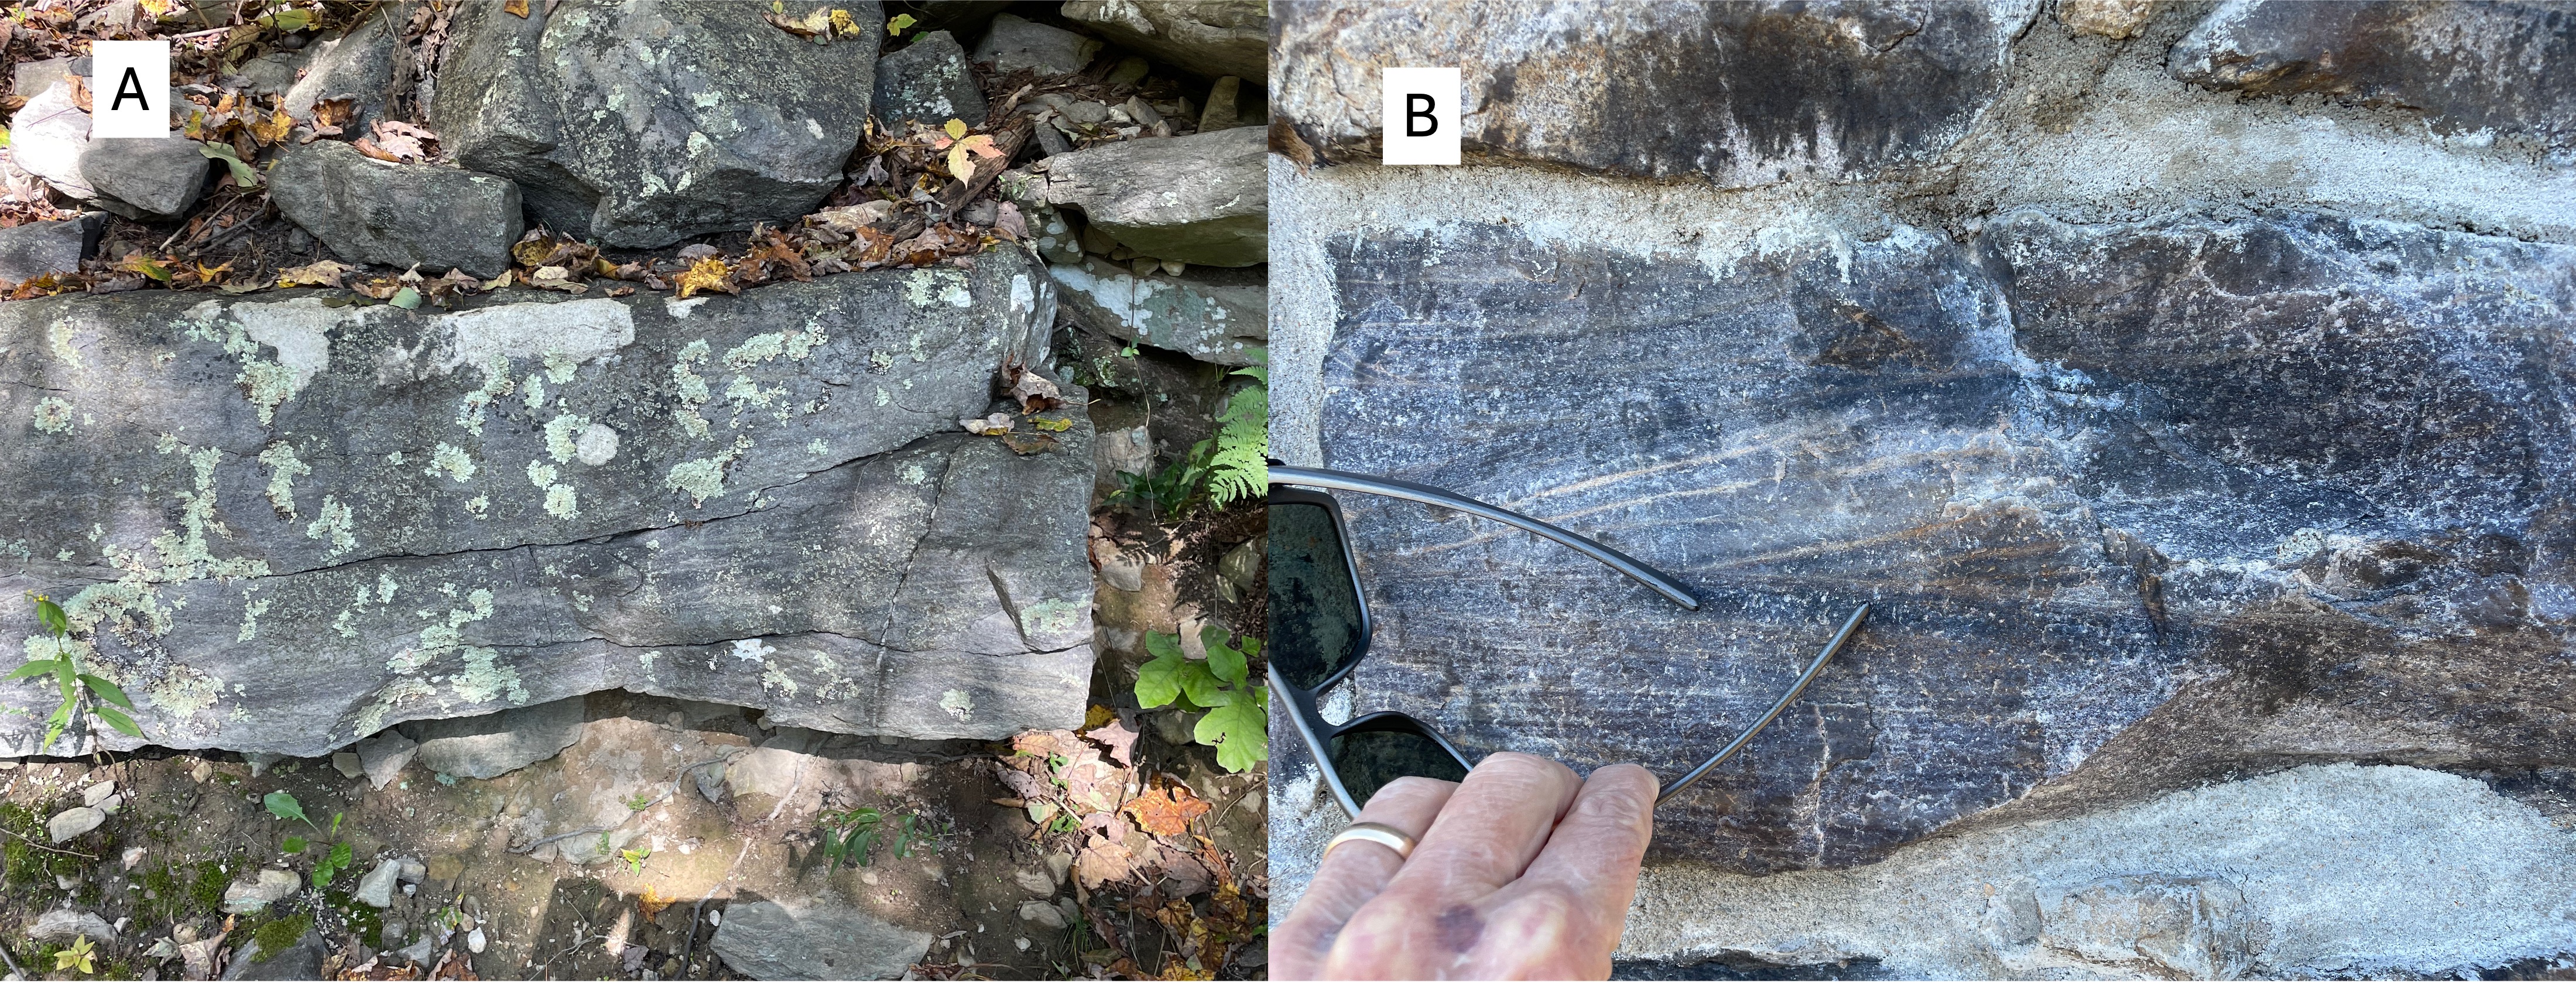
Figure 4. (A) Outcrop of older Weverton formation rocks (Cw1 in Fig. 1), revealing weathered material below and boulders on top. This outcrop contains cross-bedded layers on close examination. (B) Photo of a block of Cw1 used in the monument , which shows the crossbedding better than panel A because a fresh surface was cleaved during a recent repair of the 30-foot tower. The color is important: green sedimentary rocks like these represent marine environments, where there is less oxygen; sedimentary rocks deposited in rivers tend to be reddish because of oxidation (rusting) of Fe-containing minerals. These are probably shallow marine sands.

Figure 5. (A) Quartz in a vein (<1 inch thick) from near the monument. Note that the cross-bedding is very similar to Fig. 4 but more weathered. (B) Less-common view of a quartz vein seen obliquely, showing the surface that was against the country rock. These veins would have been injected during a period of magmatism, sometime between 2500 and 511 Ma; I can’t be more specific because I don’t know exactly where the radiometric ages were measured within these rocks. However, the Weverton formation is approximately 4500 feet (1.4 km) thick here; thus it’s possible that these rocks were deposited episodically during this immense time interval; but no unconformity (i.e. erosion or non deposition) is mentioned in RockD.

Figure 6. View looking east from the Appalachian Trail, showing the terrain typical of the Appalachian foothills. To the left of center, outcrops of Weverton rocks (Cw1 and Cw2 in Fig. 2) can be seen.
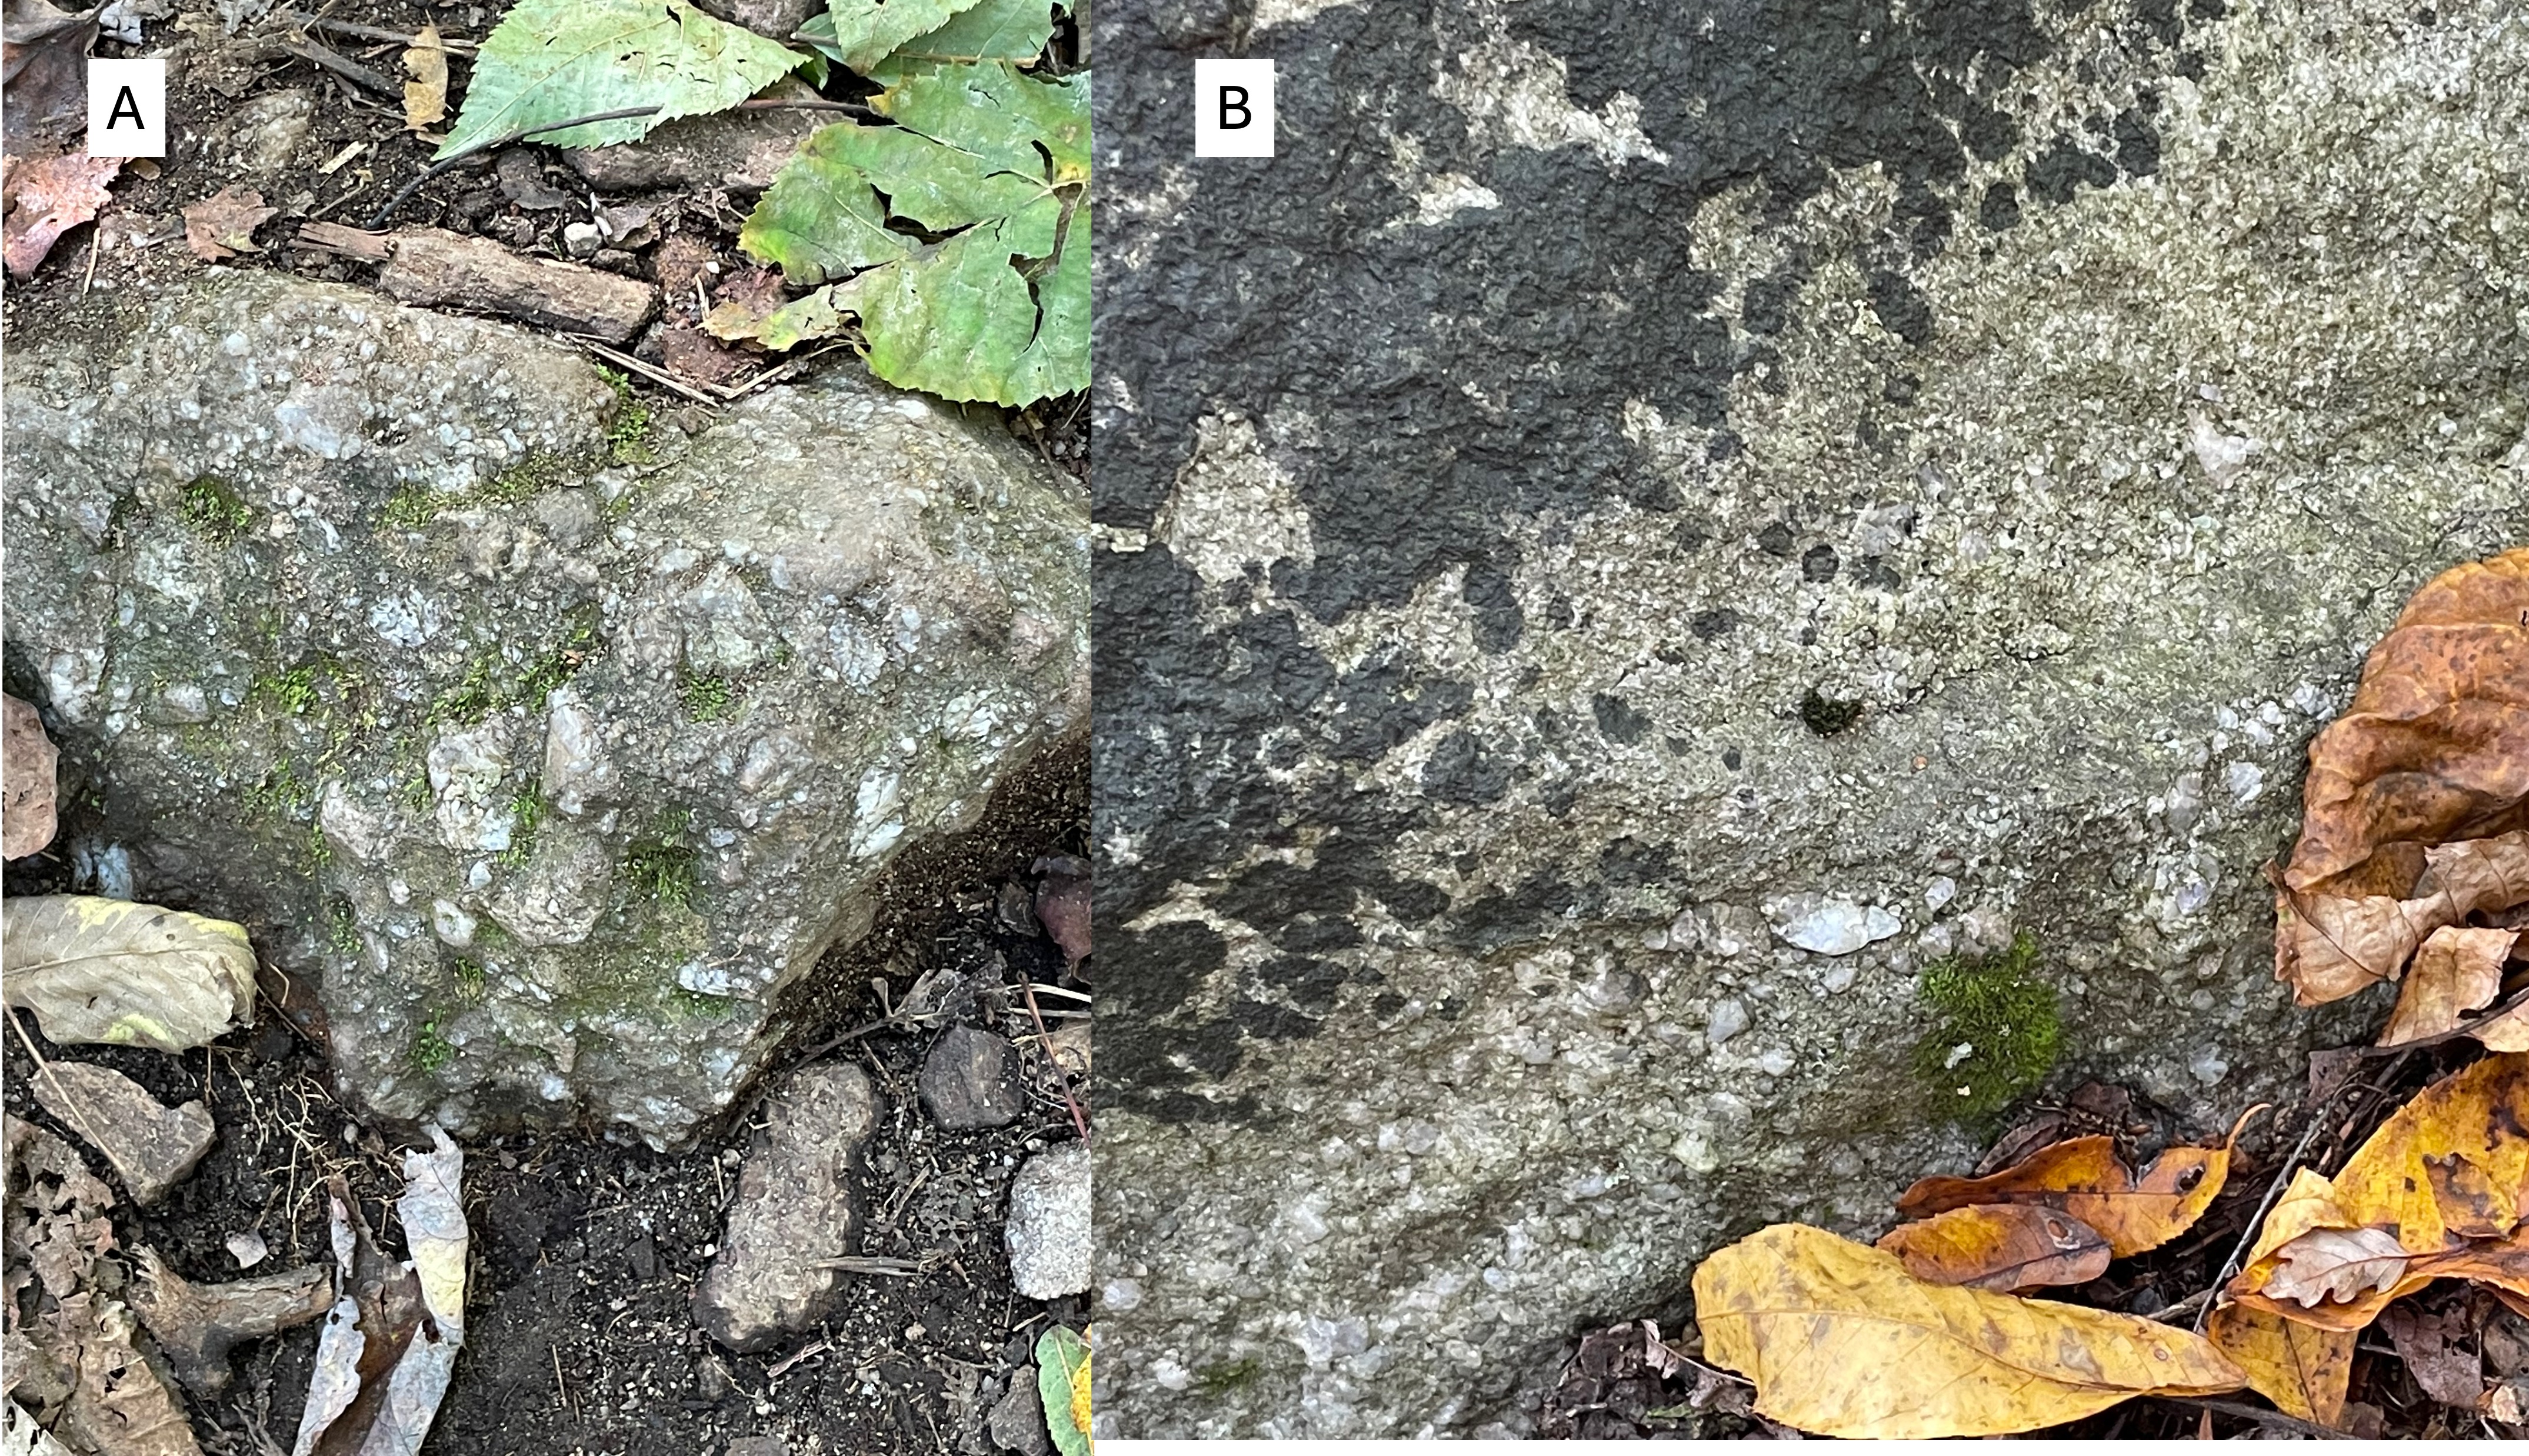
Figure 7. (A) Boulder (~2 feet across) of arkose, revealing angular clasts of rock fragments in a sandy matrix. (B) Poor outcrop of conglomerate with rounded rock and quartz in a similar, sandy matrix. Comparing these images to Fig. 4 shows the variability of sedimentation (and thus depositional environment) during relatively short time intervals (say … tens of millions of years, for example). This kind of variability implies changing sediment sources, possibly caused by tectonic uplift (with magmatism) to the east.

Figure 8. This figure is from the Bull Run Nature Preserve field trip. It is a schematic of how layers of sedimentary rocks (shown in different colors) can slide over one another along thrust faults. This process results in stacking of similar sediments, making stratigraphic analysis of sparse field data problematic. The rocks on the left are sliding upward to the right along a series of thrust faults (dashed line). At Bull Run Nature Preserve, a fault like this could be identified by older rocks clearly being stratigraphically higher than younger ones. That isn’t the case at Washington monument, where the interleaved rocks (blue and green) are too similar in lithology and age to be differentiated.
SUMMARY
The thrust fault labeled in Fig. 2 has been confidently identified (represented by a solid line), no doubt through more investigation than I was willing to spend time on. This unnamed fault underlies the northern Blue Ridge, and marks the beginning of the Valley and Ridge province; the Blue Ridge was thus an anomaly, which has been identified as a belt of older rocks thrust over younger ones about 500 million-years ago, when the supercontinent of Pangea was being created.
We have followed the Weverton formation through time (2500-485 Ma) and space (more than 40 miles). During this unimaginable interval, this small piece of the Earth’s crust has moved thousands of miles. Only the last 500 my of its journey is known with any confidence. This tectonic plate has been carrying these sediments to unknowable latitudes, colliding with immovable objects while spreading the remnants of mountain ranges that are now forgotten, deconstructed by the irresistible power of water, wind, ice and time.
Some things aren’t meant for us to know …

Recent Comments