Review of “If/Then: How the Simulmatics Corporation Invented the Future,” by Jill Lepore

This book is another representative of what I see as a new genre of technology/sociology explorations of recent history. With so much data about the people behind events available to researchers, it is relatively straightforward to integrate events with their personal stories. I recently reviewed a similar book focused on Palo Alto, and this nonfiction work dovetails nicely with the West Coast narrative presented by Malcolm Harris. Their stories overlap somewhat and they are good bookends for understanding the origins of the digital/big data revolution; sometimes they come too close to the daily news for comfort.
Jill Lepore is a historian and so she presents the material more formally, but just as personal in terms of details, as Malcolm Harris.
This book is well written. I only had to reread a few sentences that got lost on the path from subject to action.
The story is fascinating, how a couple of visionaries imagined using what today is called “big data” to analyze trends and make predictions. There were quite a few revelations to me, especially with respect to what was going on behind the scenes during the Viet Nam war. The details of the lives of the people involved with Simulmatics were enlightening with respect to their objectives and the failure of their premature attempt to predict social behavior. The book is lacking a detailed description of the methods they used, so the connection to present deep-learning algorithms is speculative. I would have liked to see more depth in the technology itself. I guess that is a subject to be addressed by another author, one with a more technical background.
No one book can cover a subject as complex as recent social-technological-economic-political trends, with so much data available to the researcher, so this work shouldn’t be treated as definitive by any means. However, by coincidence I have read a couple of other books that give a more complete picture of important events that contributed significantly to the world we live in.
For anyone interested in recent U.S. history I recommend this book, as well as Palo Alto and The Rise and Fall of the Neoliberal Order.
I like the tone of these recent histories, which are replete with facts, but written to be read.
Galway … and Beyond
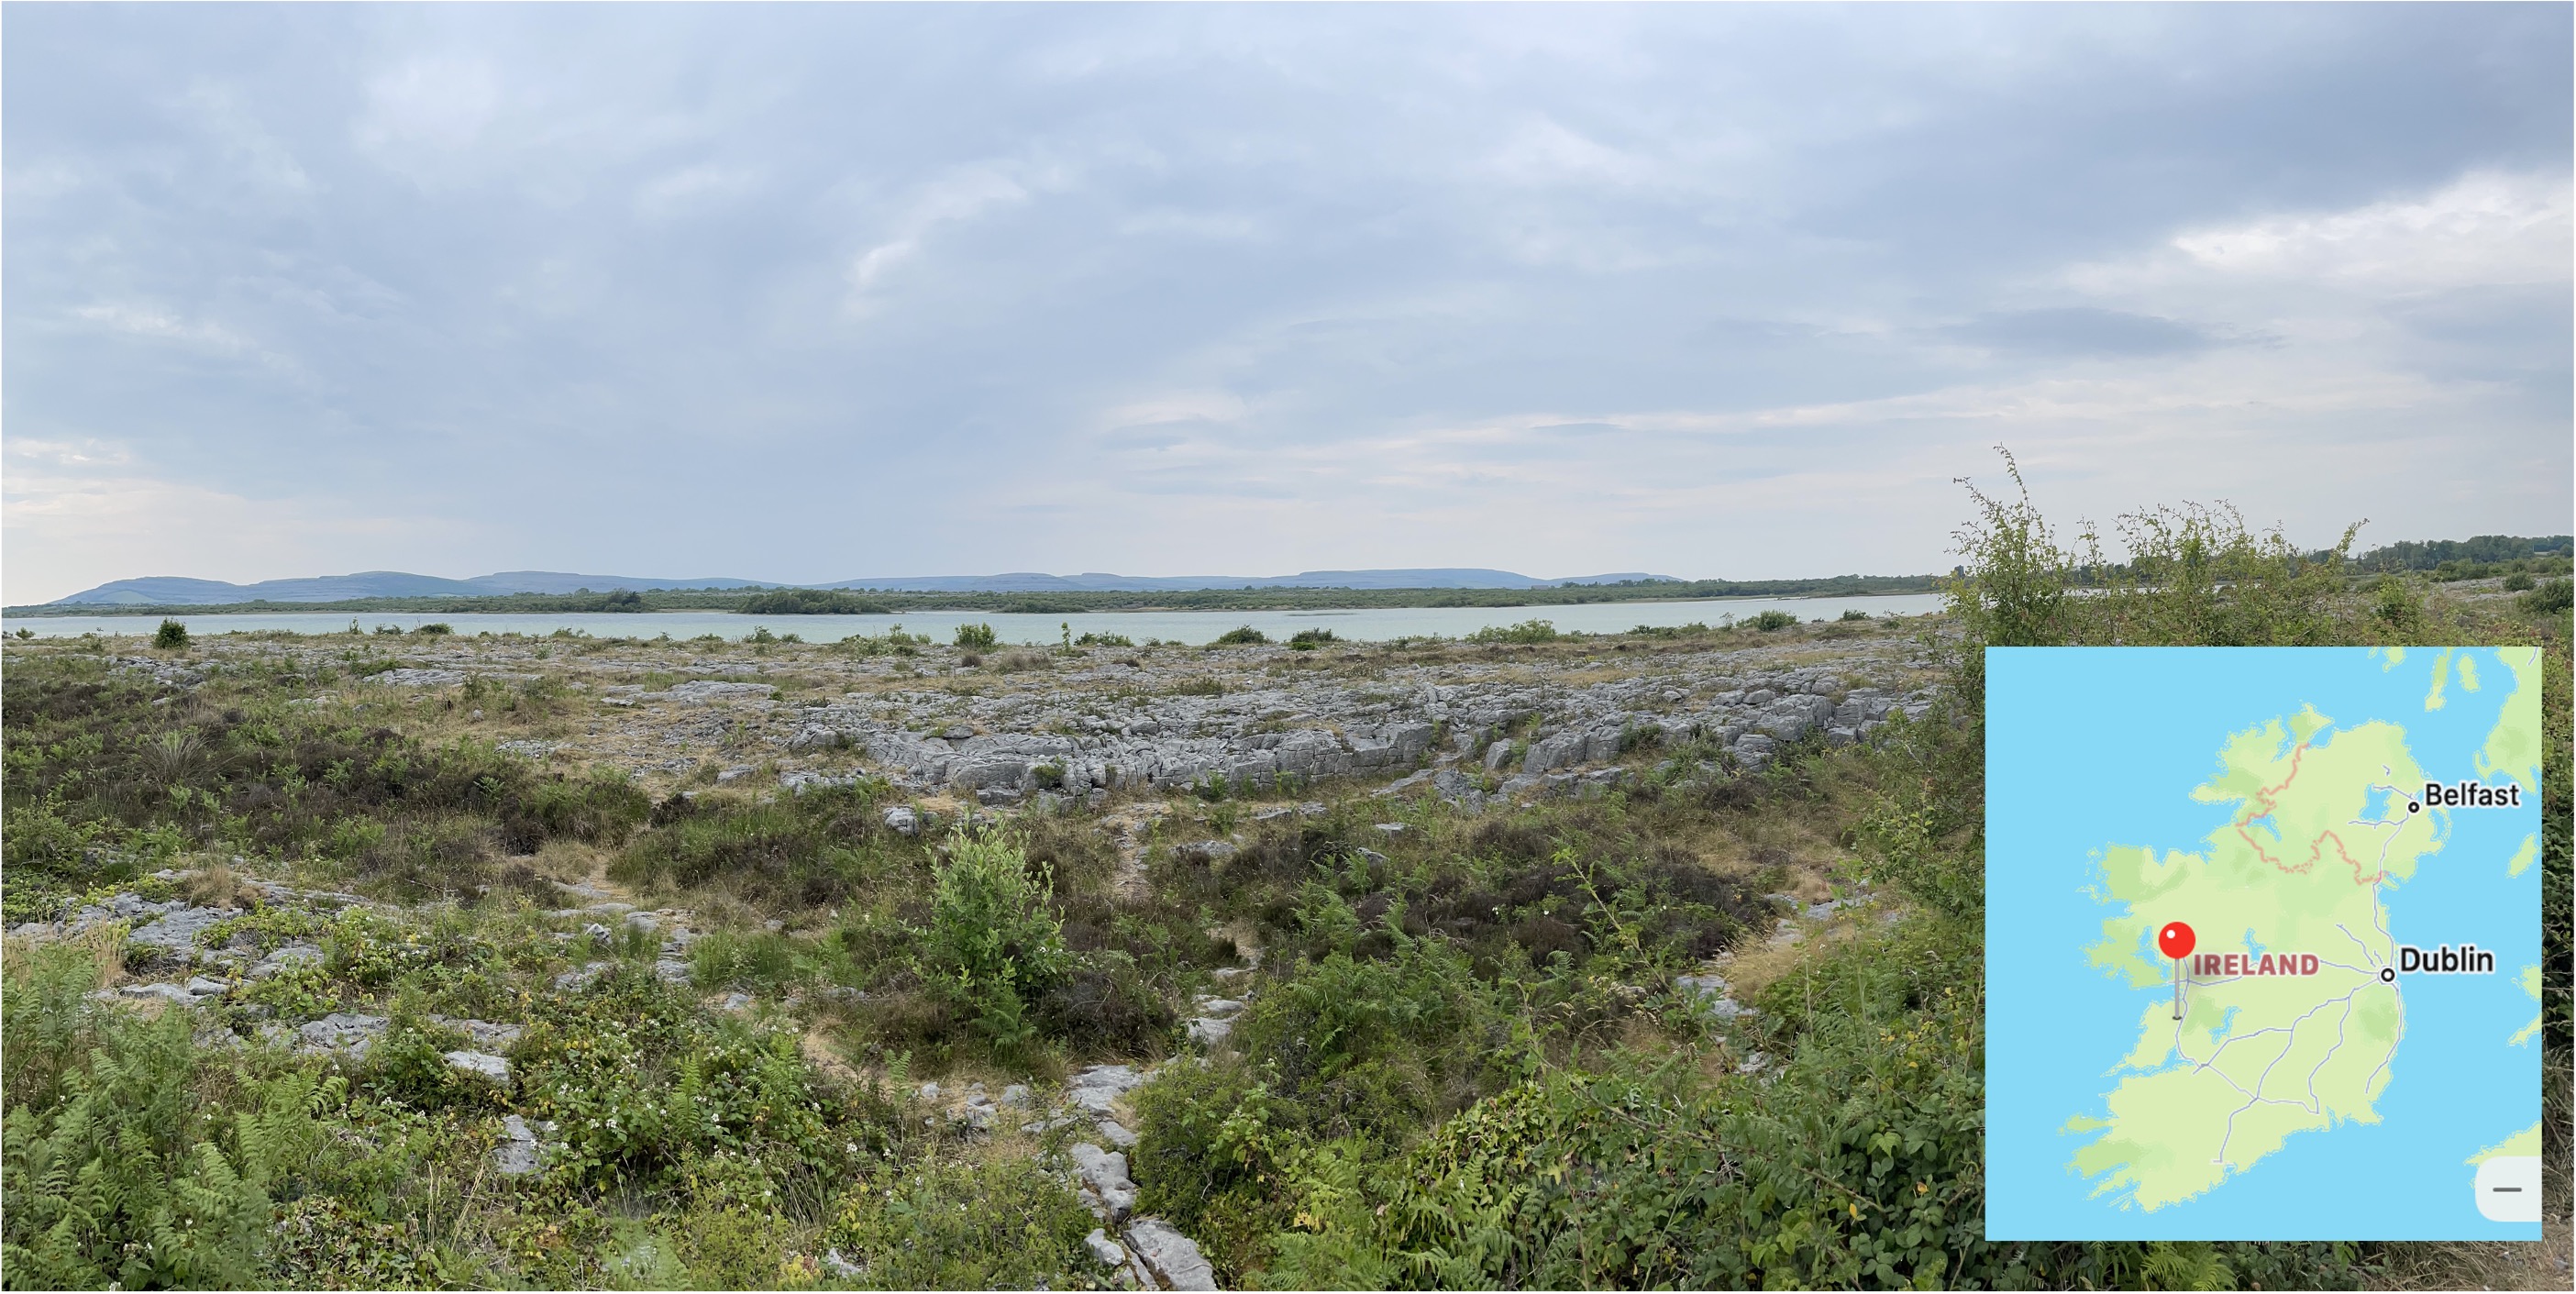
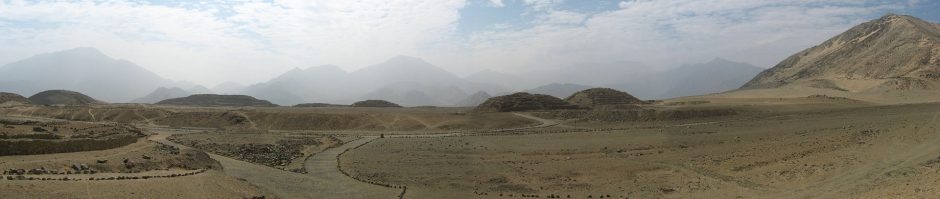
Figure 1. This photo shows the post-glacial, Pleistocene surface of the Carboniferous (320-300 Ma) limestone we’ve seen throughout Southern Ireland. The paucity of stone walls in the area suggests that boulders deposited by a glacier were less common here; the absence of drumlins or moraines further suggests that this area was scraped clean of loose material before the glacier retreated for the last time about 20 thousand years ago.
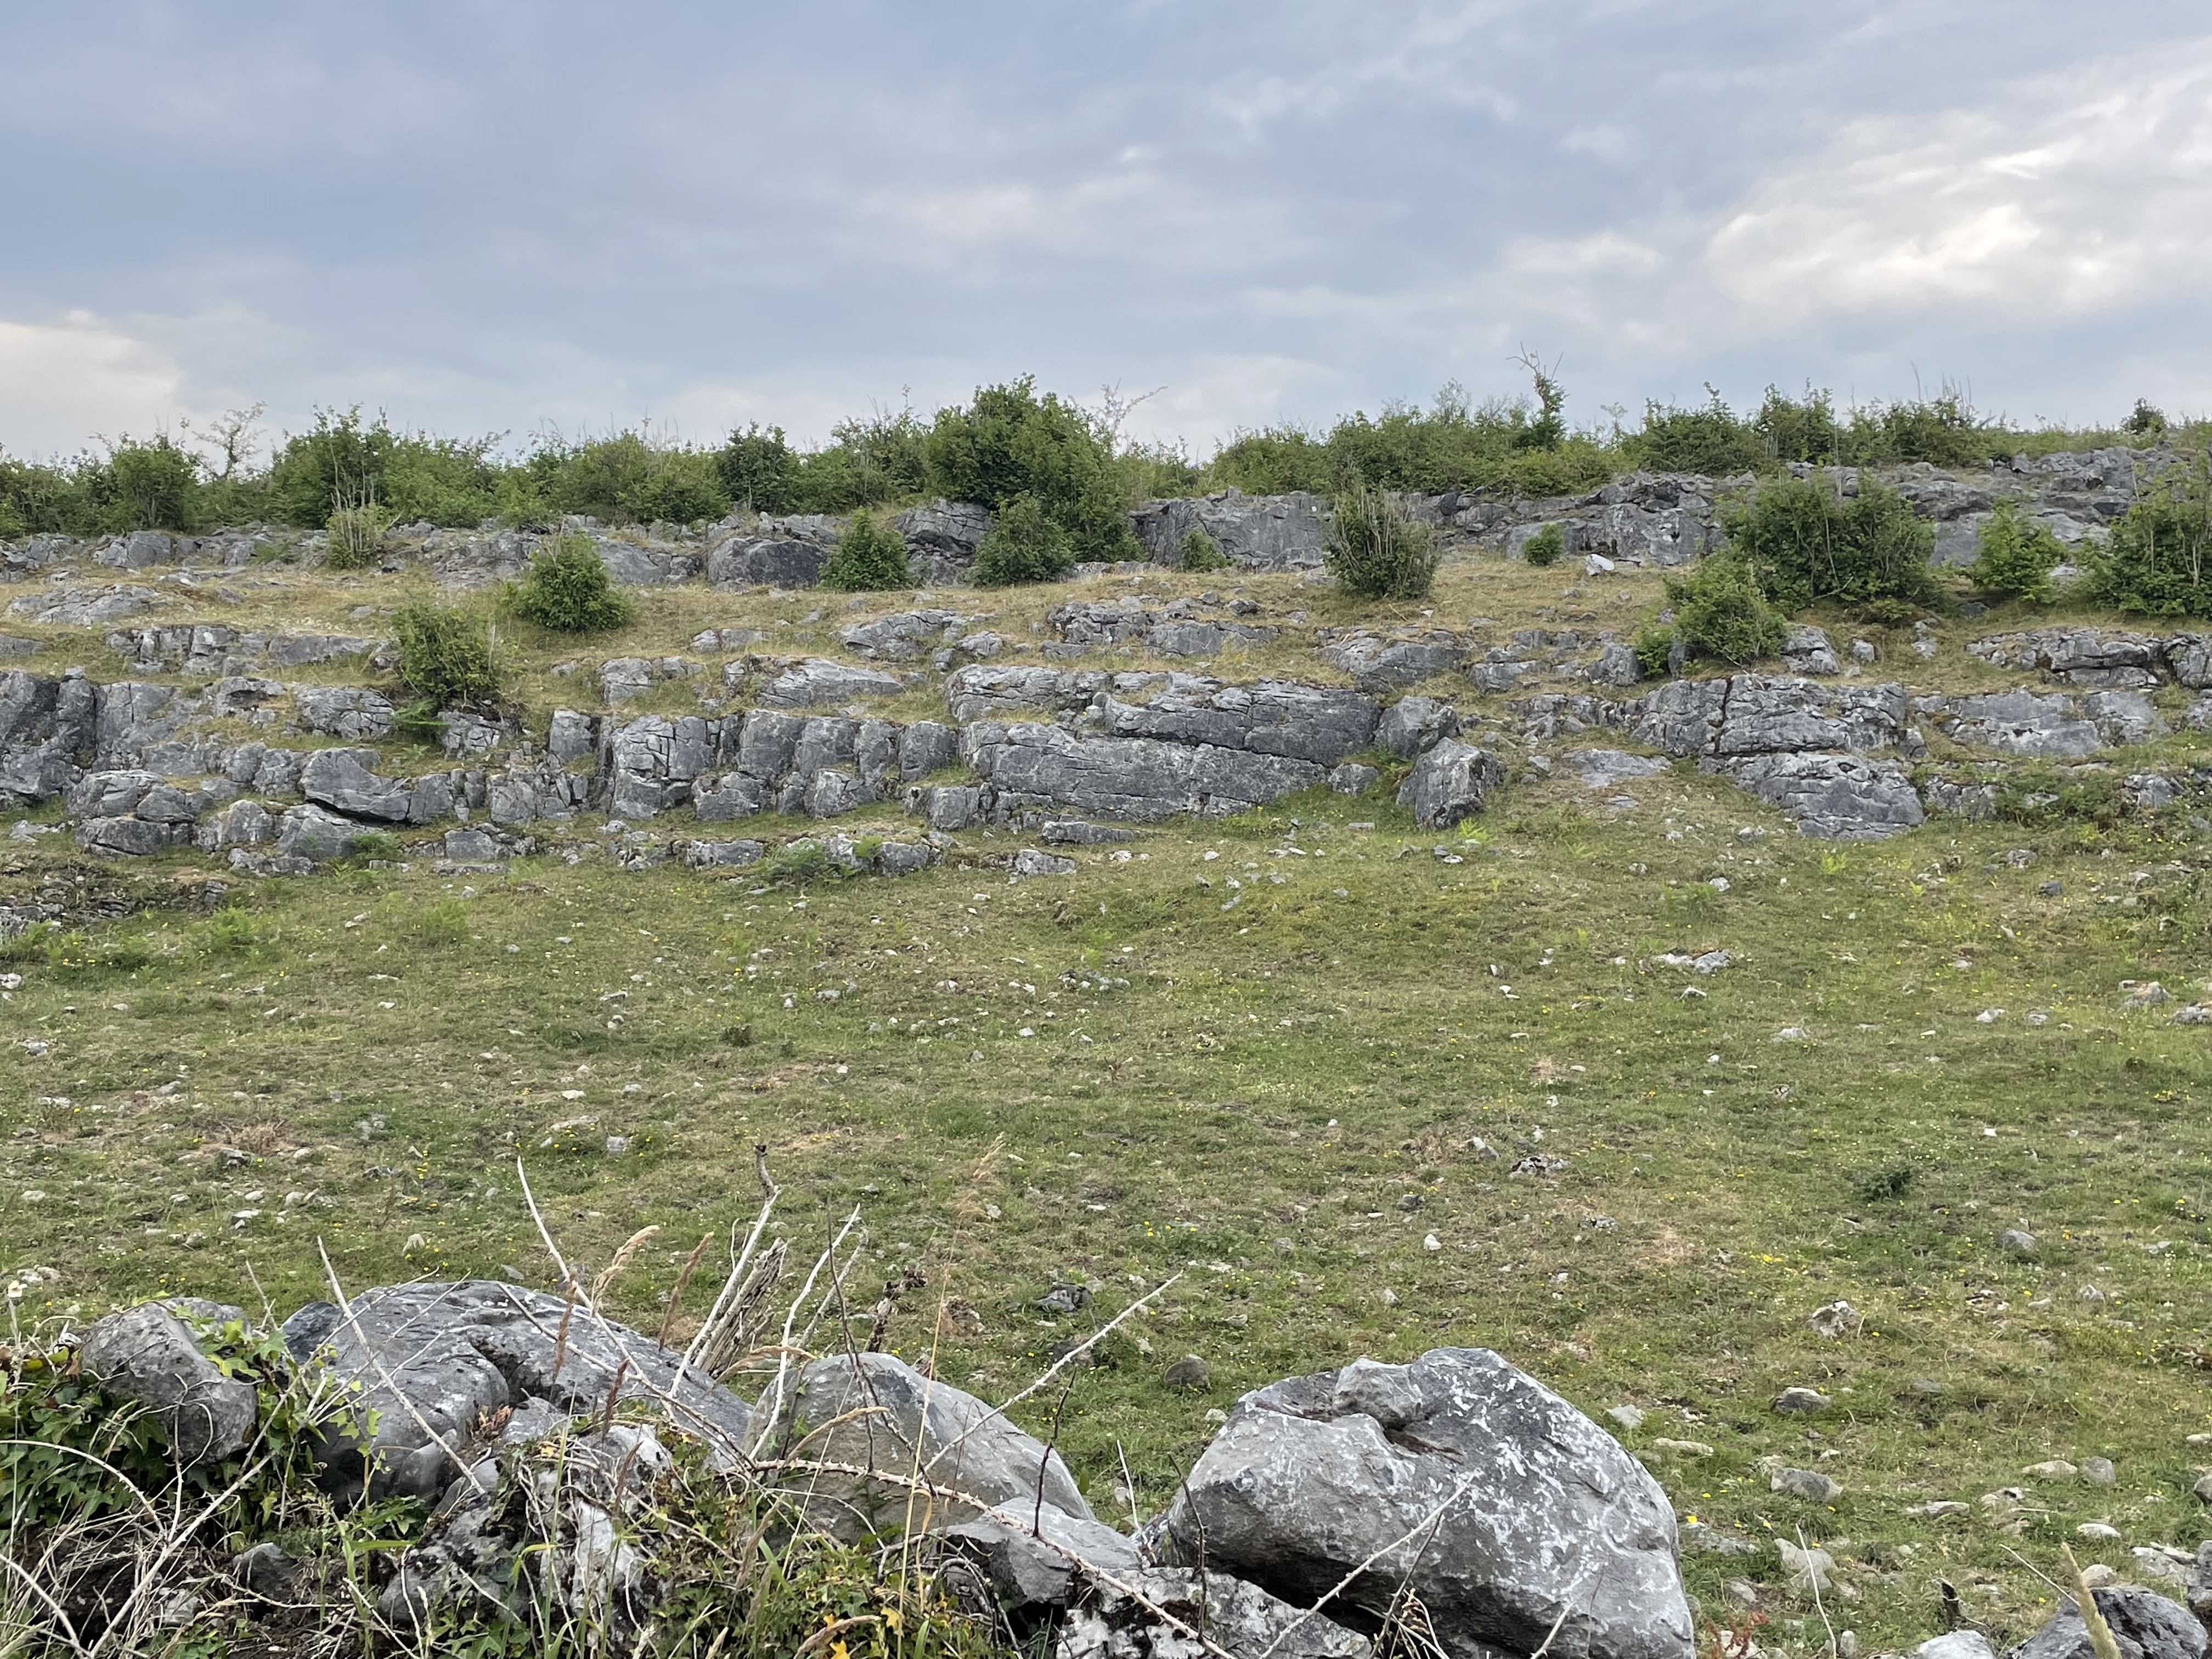
Figure 2. These layers of limestone are dipping at less than 20 degrees (field guesstimate), revealing different strata within the section. Low hills within the area indicated by a pin in the inset map of Fig. 1 were constructed of such tilted strata.

Figure 3. Geologic map of Ireland with the region discussed in this post highlighted by a black rectangle. The blue areas are the limestones we’ve seen before, indicated in the stratigraphic column (right of figure) with a matching arrow. These are the youngest rocks in this area. The pink area at the top of the study area is Ordovician (gray arrow in stratigraphic column), between 495 and 440 million-years old; these sedimentary and volcanic rocks are much older than the limestone. We’ll be focusing on Cambrian (545-495 Ma) sandstones that have been metamorphosed after burial and heating. This is the yellow-shaded area on the map and stratigraphic column. These are the oldest rocks we’ve seen in Ireland. Note the red area, and arrow in the lower map key (igneous rocks are shown separately in this map). These are Ordovician in age and thus much younger than the metasediments we’ll be looking at in this post.
Figure 4. The inset map focuses on the upper-left portion of the inset map in Fig. 3. The three main rock types introduced above are labeled for clarity; note the presence of older (Cambrian) metasediments sandwiched between intrusive granite and sedimentary and volcanic rocks of Ordovician age. This curious stratigraphic relationship is due to an orogeny that occurred during the Ordovician geologic period. Cambrian sediments, mostly sand and shale, were buried several miles beneath the surface, when even deeper rocks melted to form magma, which rose as granite. The sediments were heated under moderate pressure, and then injected with fluids from the magma. The Ordovician sediments were deposited during this orogeny but were not buried as deeply as the subjacent Cambrian rocks.
Plate A shows a typical exposure of the Cambrian metasediments. Note the general appearance of a bedding plane, tilted steeply, facing towards the camera. Plate B is a boulder (possibly loose) of weathered meta-sandstone that reveals a dense area (lower right of outcrop) and indistinct bedding with resistant grains (probably quartz) set in a weathered matrix of darker material. Plate C, a photo taken less than a mile from Plate B, shows a small boulder comprising mixed grain sizes, with quartz inclusions (circled in yellow). The heterogeneity of this sample indicates that these sediments weren’t buried deeply enough for recrystallization to occur AND they were close enough to the magma to be injected with fluids .
These samples were observed near the boundary with the Ordovician granite (see inset map). These same sediments look very different further from the granitic intrusion.
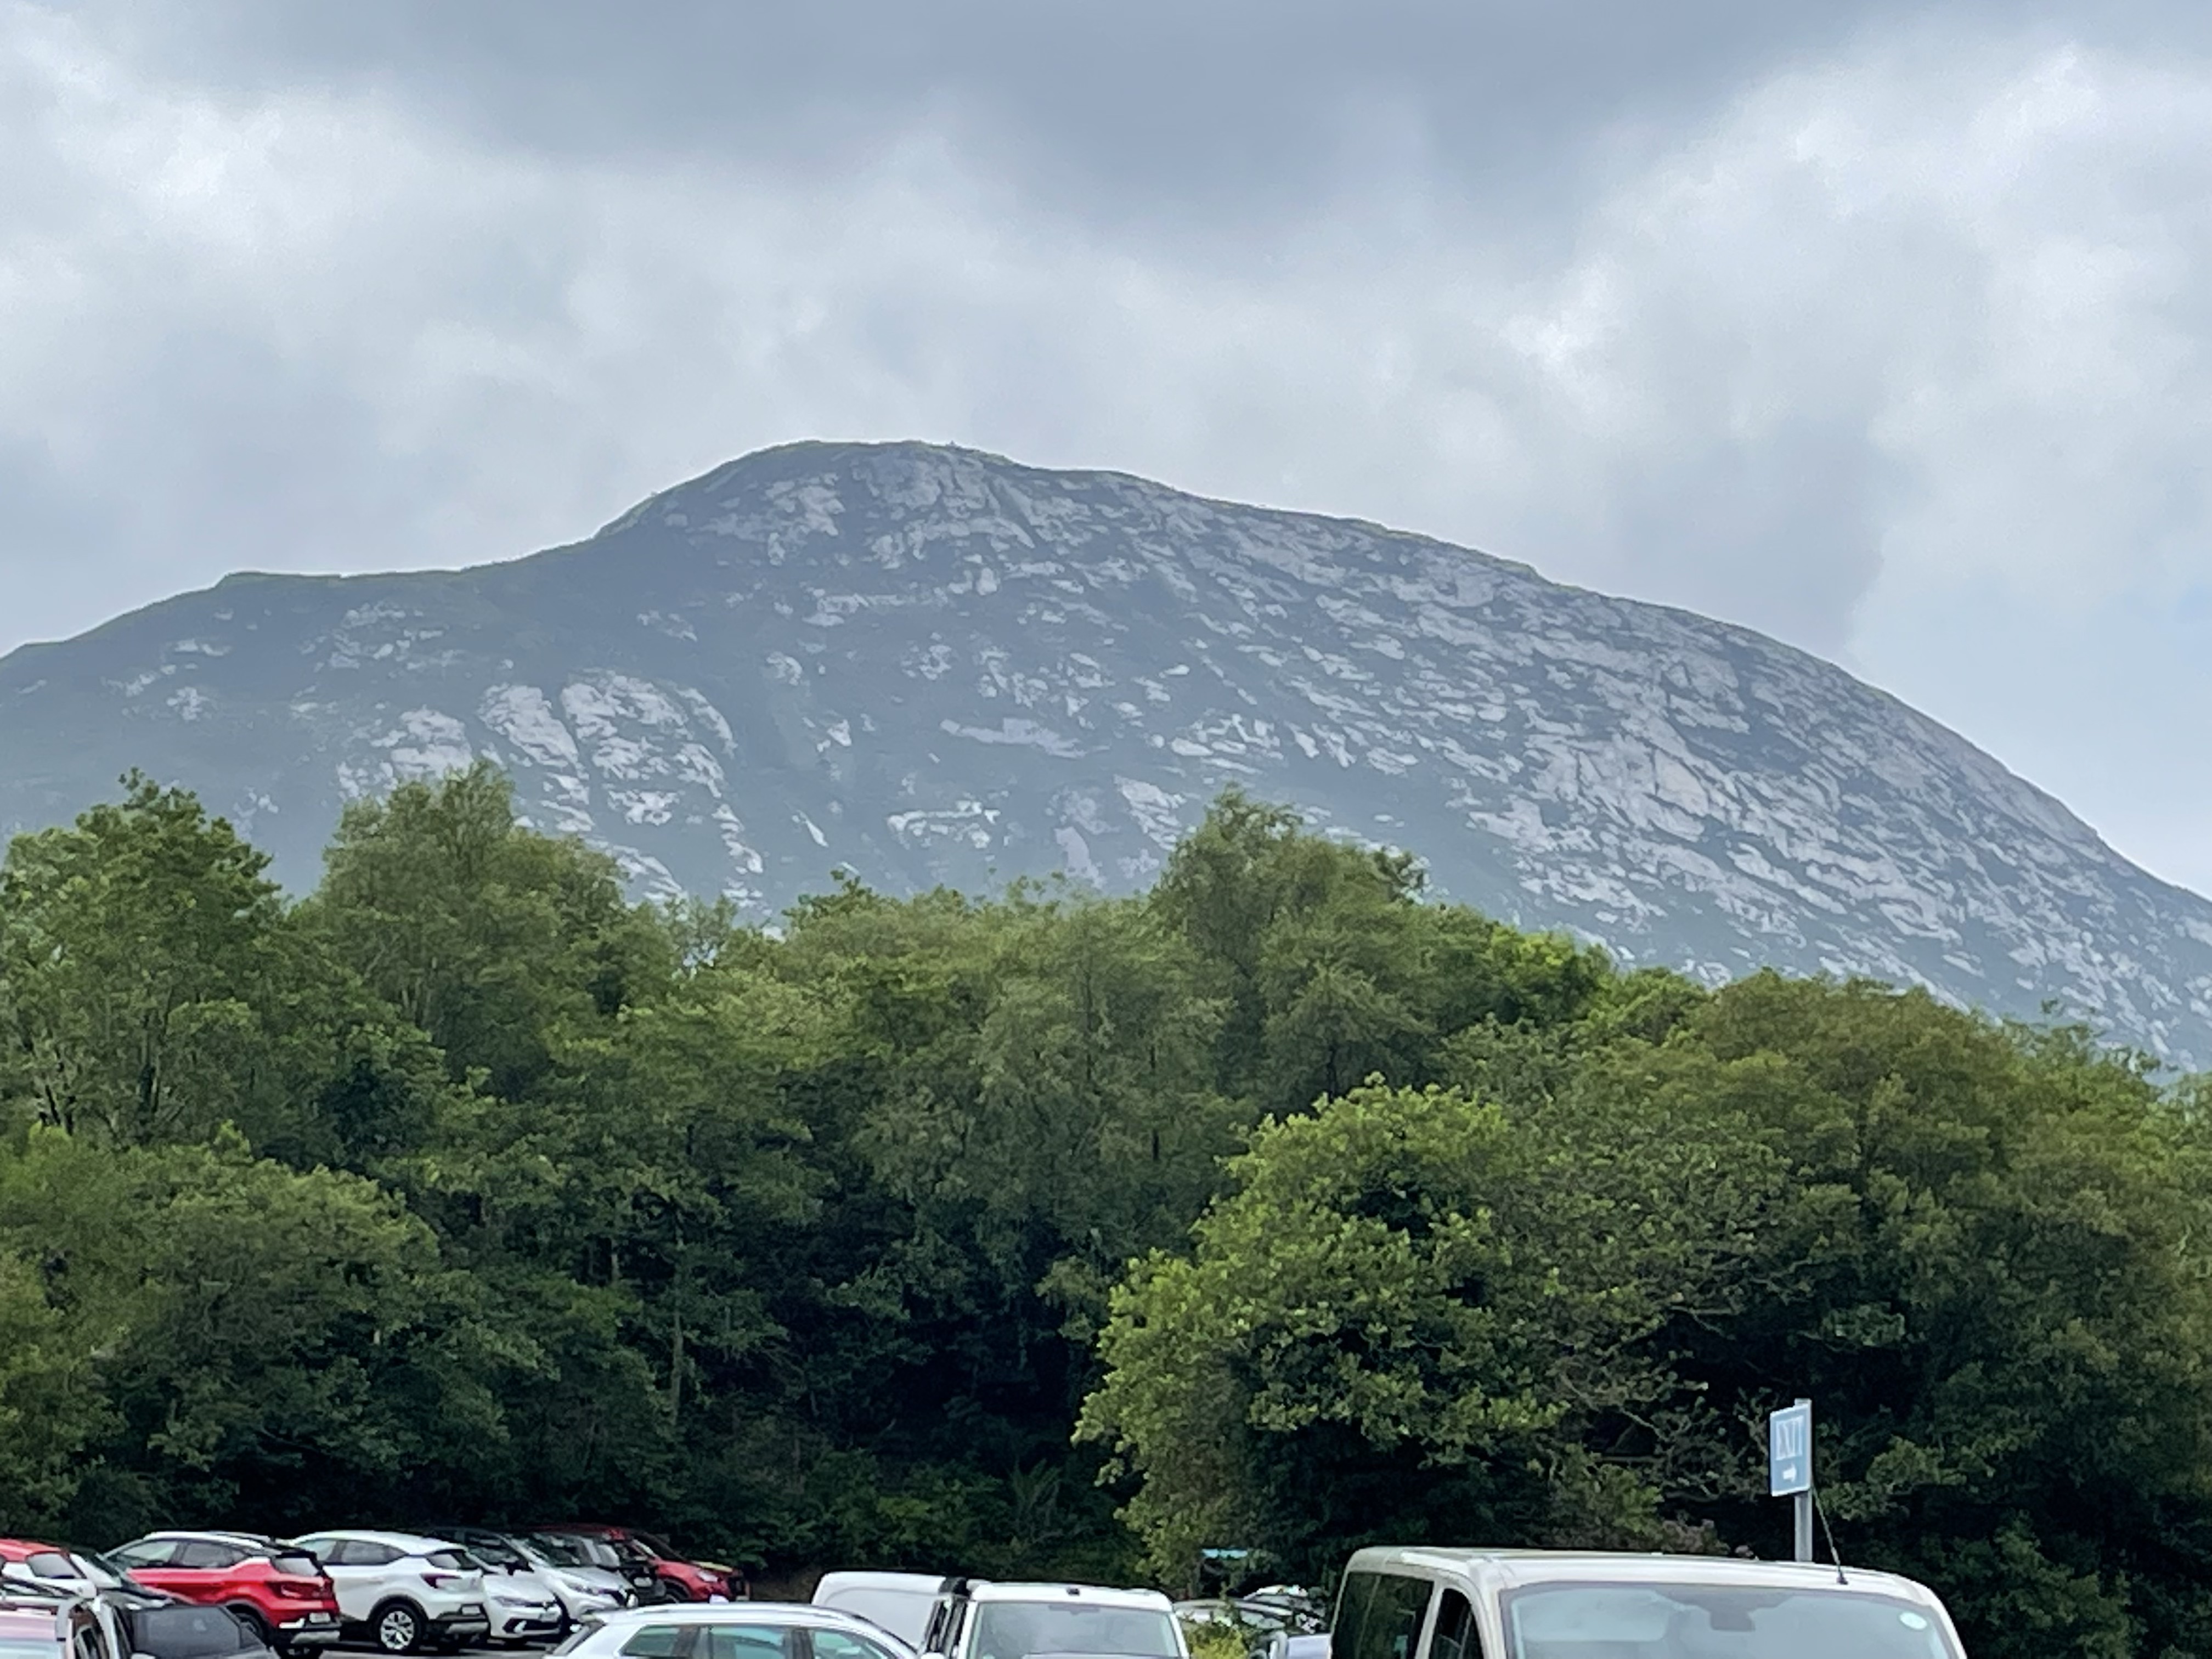
Figure 5. Photo of the Cambrian metasediments further from the boundary with the Ordovician granite. The topography here (see inset map of Fig. 4) consists of a series of high, steep mountains comprising these resistant rocks.

Figure 6. Images of outcrops (in-place rock) away from the intrusive contact zone. (A) This photo (two-feet across) shows nearly vertical bedding planes, indicated by a yellow line. Note the uniform surface of this quartzite, which retains original bedding, as shown by dark laminae. (B) This photo shows a contact (yellow line) between the quartzite and a dark rock, which cuts across sediment layers (horizontal in the photo). This stratigraphic enigma may be caused by differential weathering along a fracture, long after deposition and subsequent deformation. (C) This close-up (photo is two-feet across) shows quartz veins dispersed within quartzite.
Let’s quickly return to the inset map of Fig. 4. Now that we know that the sedimentary layers were tilted almost 90 degrees during a mountain-building period, it makes sense that the Cambrian sediments are juxtaposed between younger rocks; they were intruded by granite, while younger sediments were deposited on top of them. These older rocks were heated to a higher temperature by contact metamorphism, and injected with magmatic fluids.

Figure 7. This figure shows a high-resolution image (inset) of the area we discussed in this post. The lower part of the map coincides with the Ordovician granite and the upper part reflects glacial carving of the Cambrian metasediments. Granite weathers much faster than quartzite and is less resistant to physical erosion; thus, the bogs we encountered on our drive are located to the south. This weathering occurred after all of these rocks were tilted during the Paleozoic, and uplifted during the Mesozoic; but before glaciers moved southward (black arrow), forming steep hillsides devoid of soil and trees, during the Pleistocene. That’s a time span of 200 million years.
Summary. Mountain building in Northern Virginia was active between 1000 and 500 Ma. Erosion has removed all geological evidence from the rocks I’ve seen in Virginia, until 200 Ma, when Pangea was torn apart; and North America and Europe were created.
About 550 Ma, sandy sediment was being deposited in shallow seas of Southern Ireland, continuing for at least 100 million years while magma collected in the shallow crust, producing granite intrusions for another hundred-million years. During this dark age in Virginia, the mountains grew then eroded in Ireland and a shallow sea formed, filling with sand, silt, and mud; the shells of marine invertebrates collected in this now-quiet marine environment.
Glaciers never reached Virginia but they covered Ireland throughout the Pleistocene, transforming its landscape.
That’s it in a nutshell …
So far.
The Big Picture: Moher Cliffs
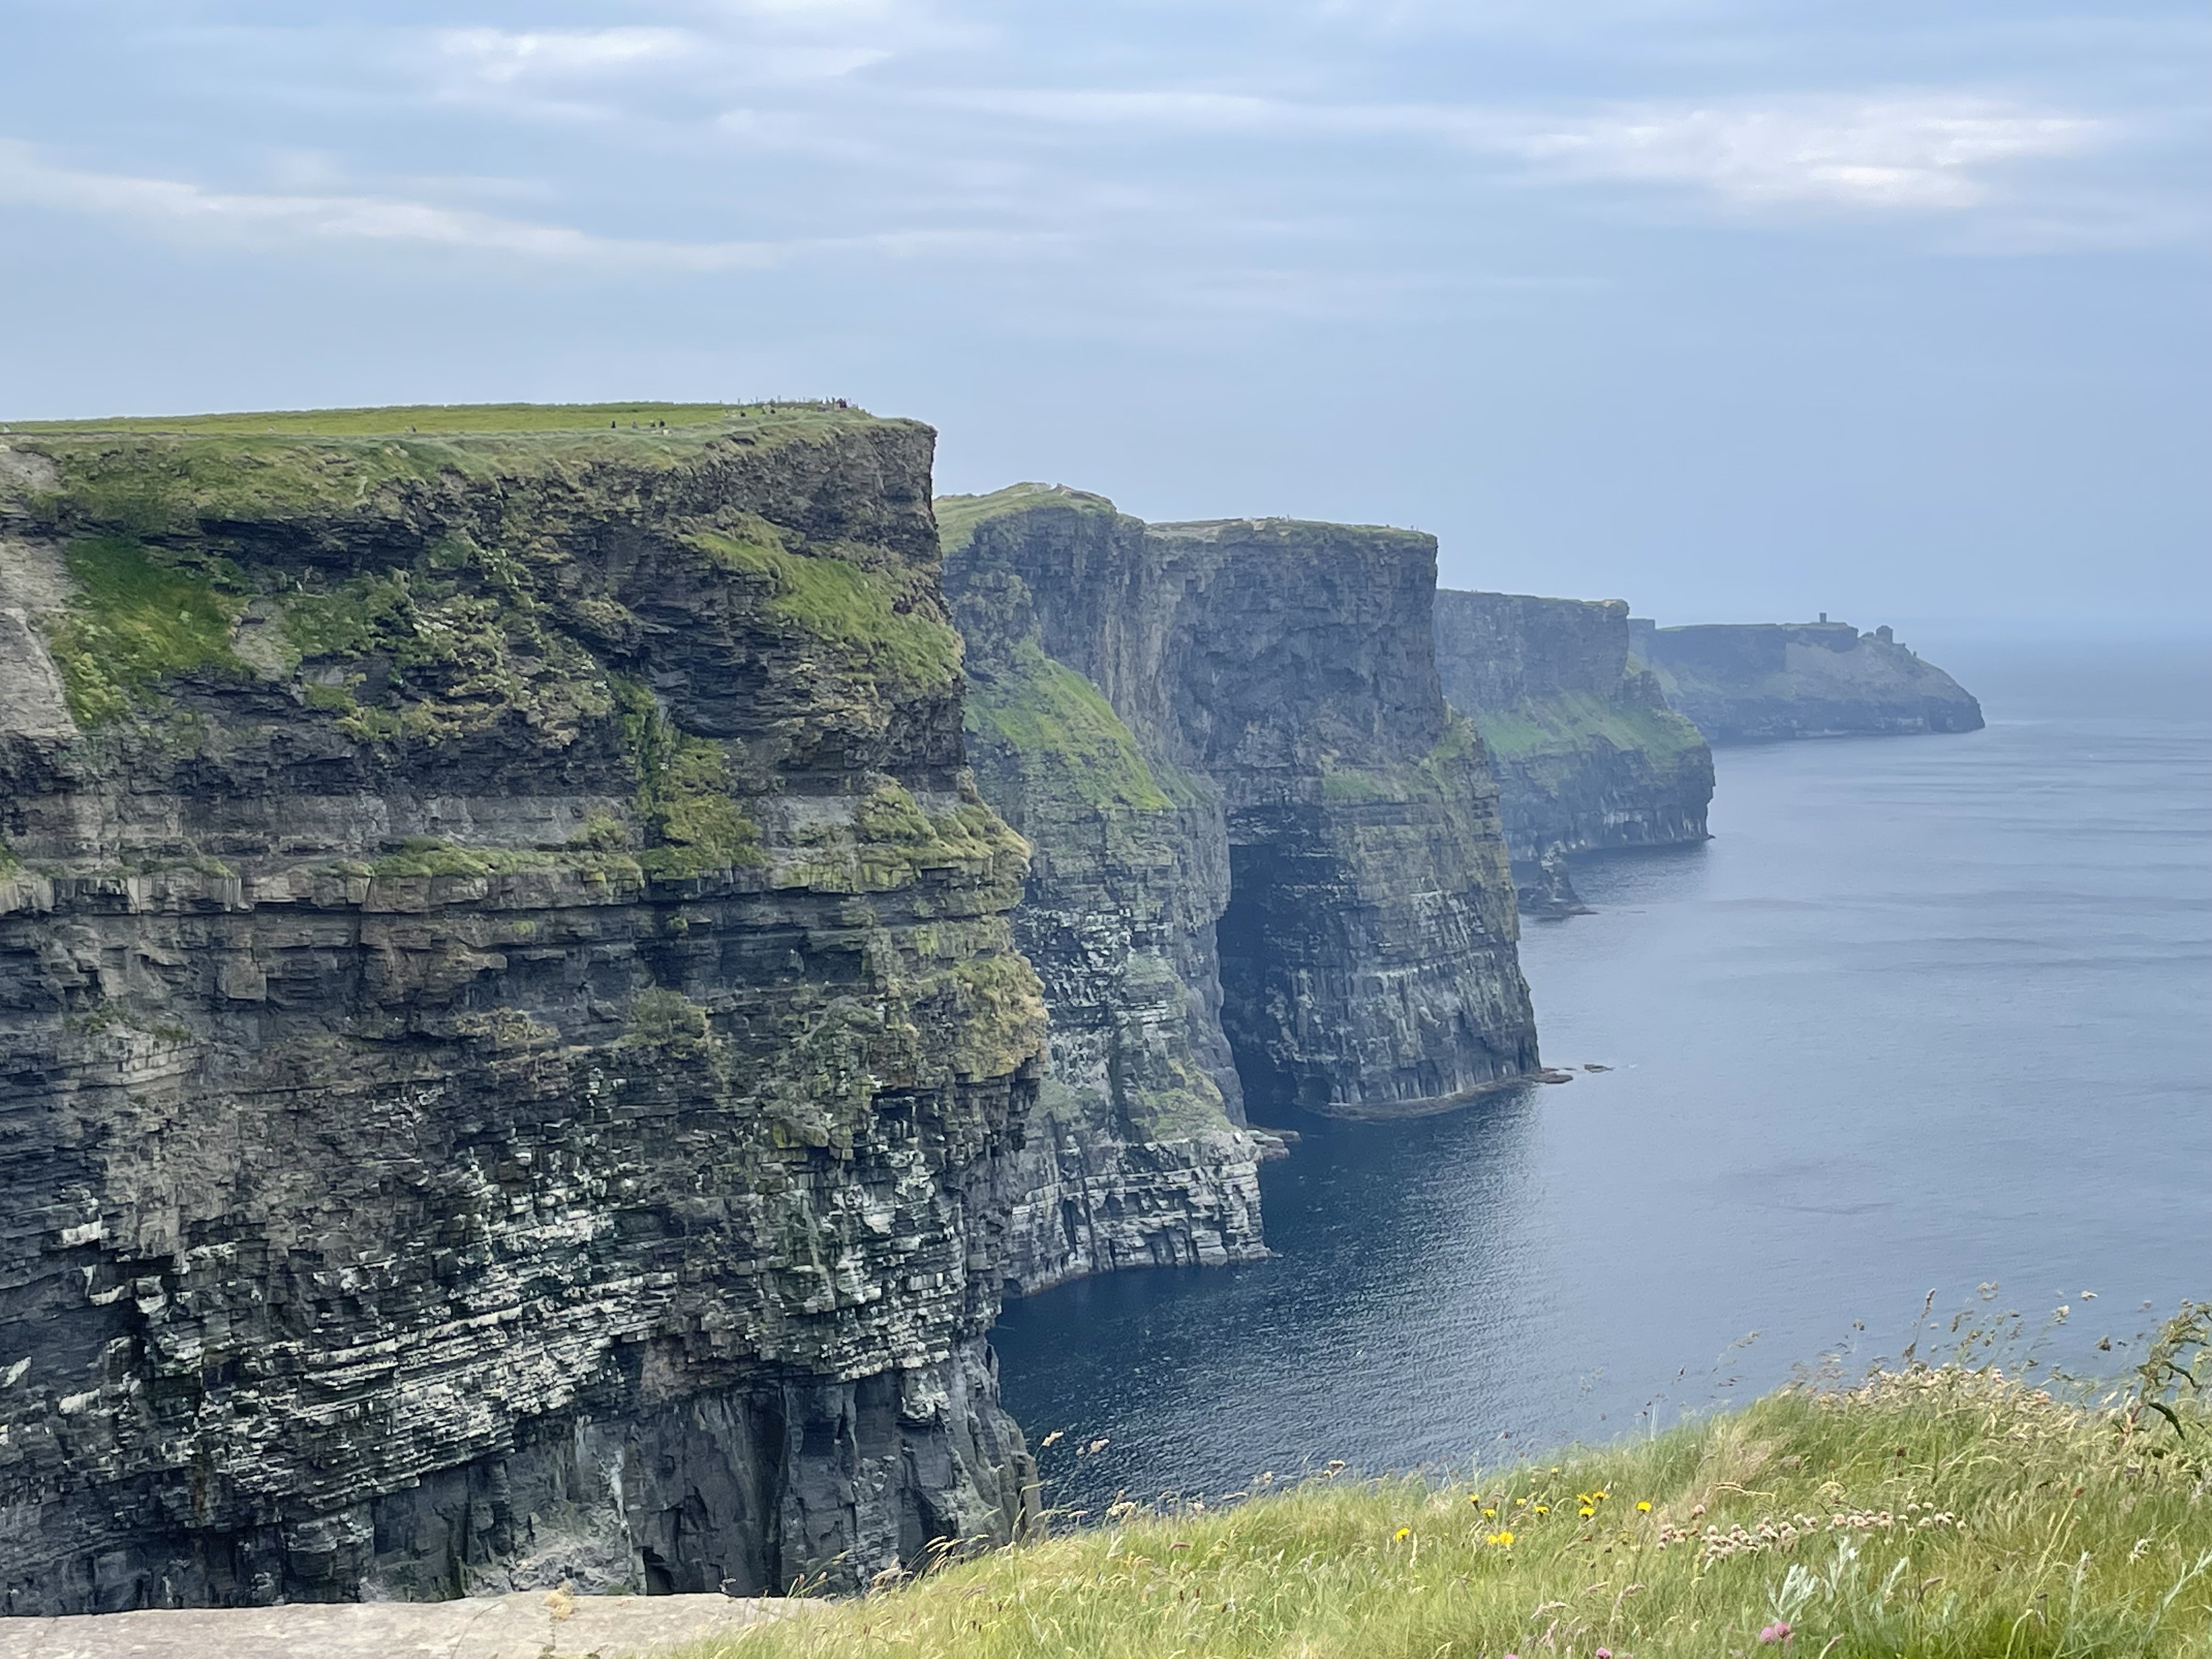
This is a famous photo (taken by me) of the Moher Cliffs that reveals the Late Carboniferous (320-300 Ma) mud/silt/sand stone we saw at Foynes and again at Kilkee. The silt/sand layers are thinner at the bottom of the cliff (white accentuates them) and thicker towards the upper parts. This pattern suggests a transition to shallower water, from turbidites and other delta-front sand deposits, to massive nearshore submarine bars. The land was rising relative to the sea.
These layers of sedimentary rock are flat while gently dipping to the south, unlike the steeply tilted strata at Foynes, or the undulating rocks at Kilkee. The delta system represented by these rocks was extensive and not subjected to major deformation during the collision of tectonic plates that created Pangea.
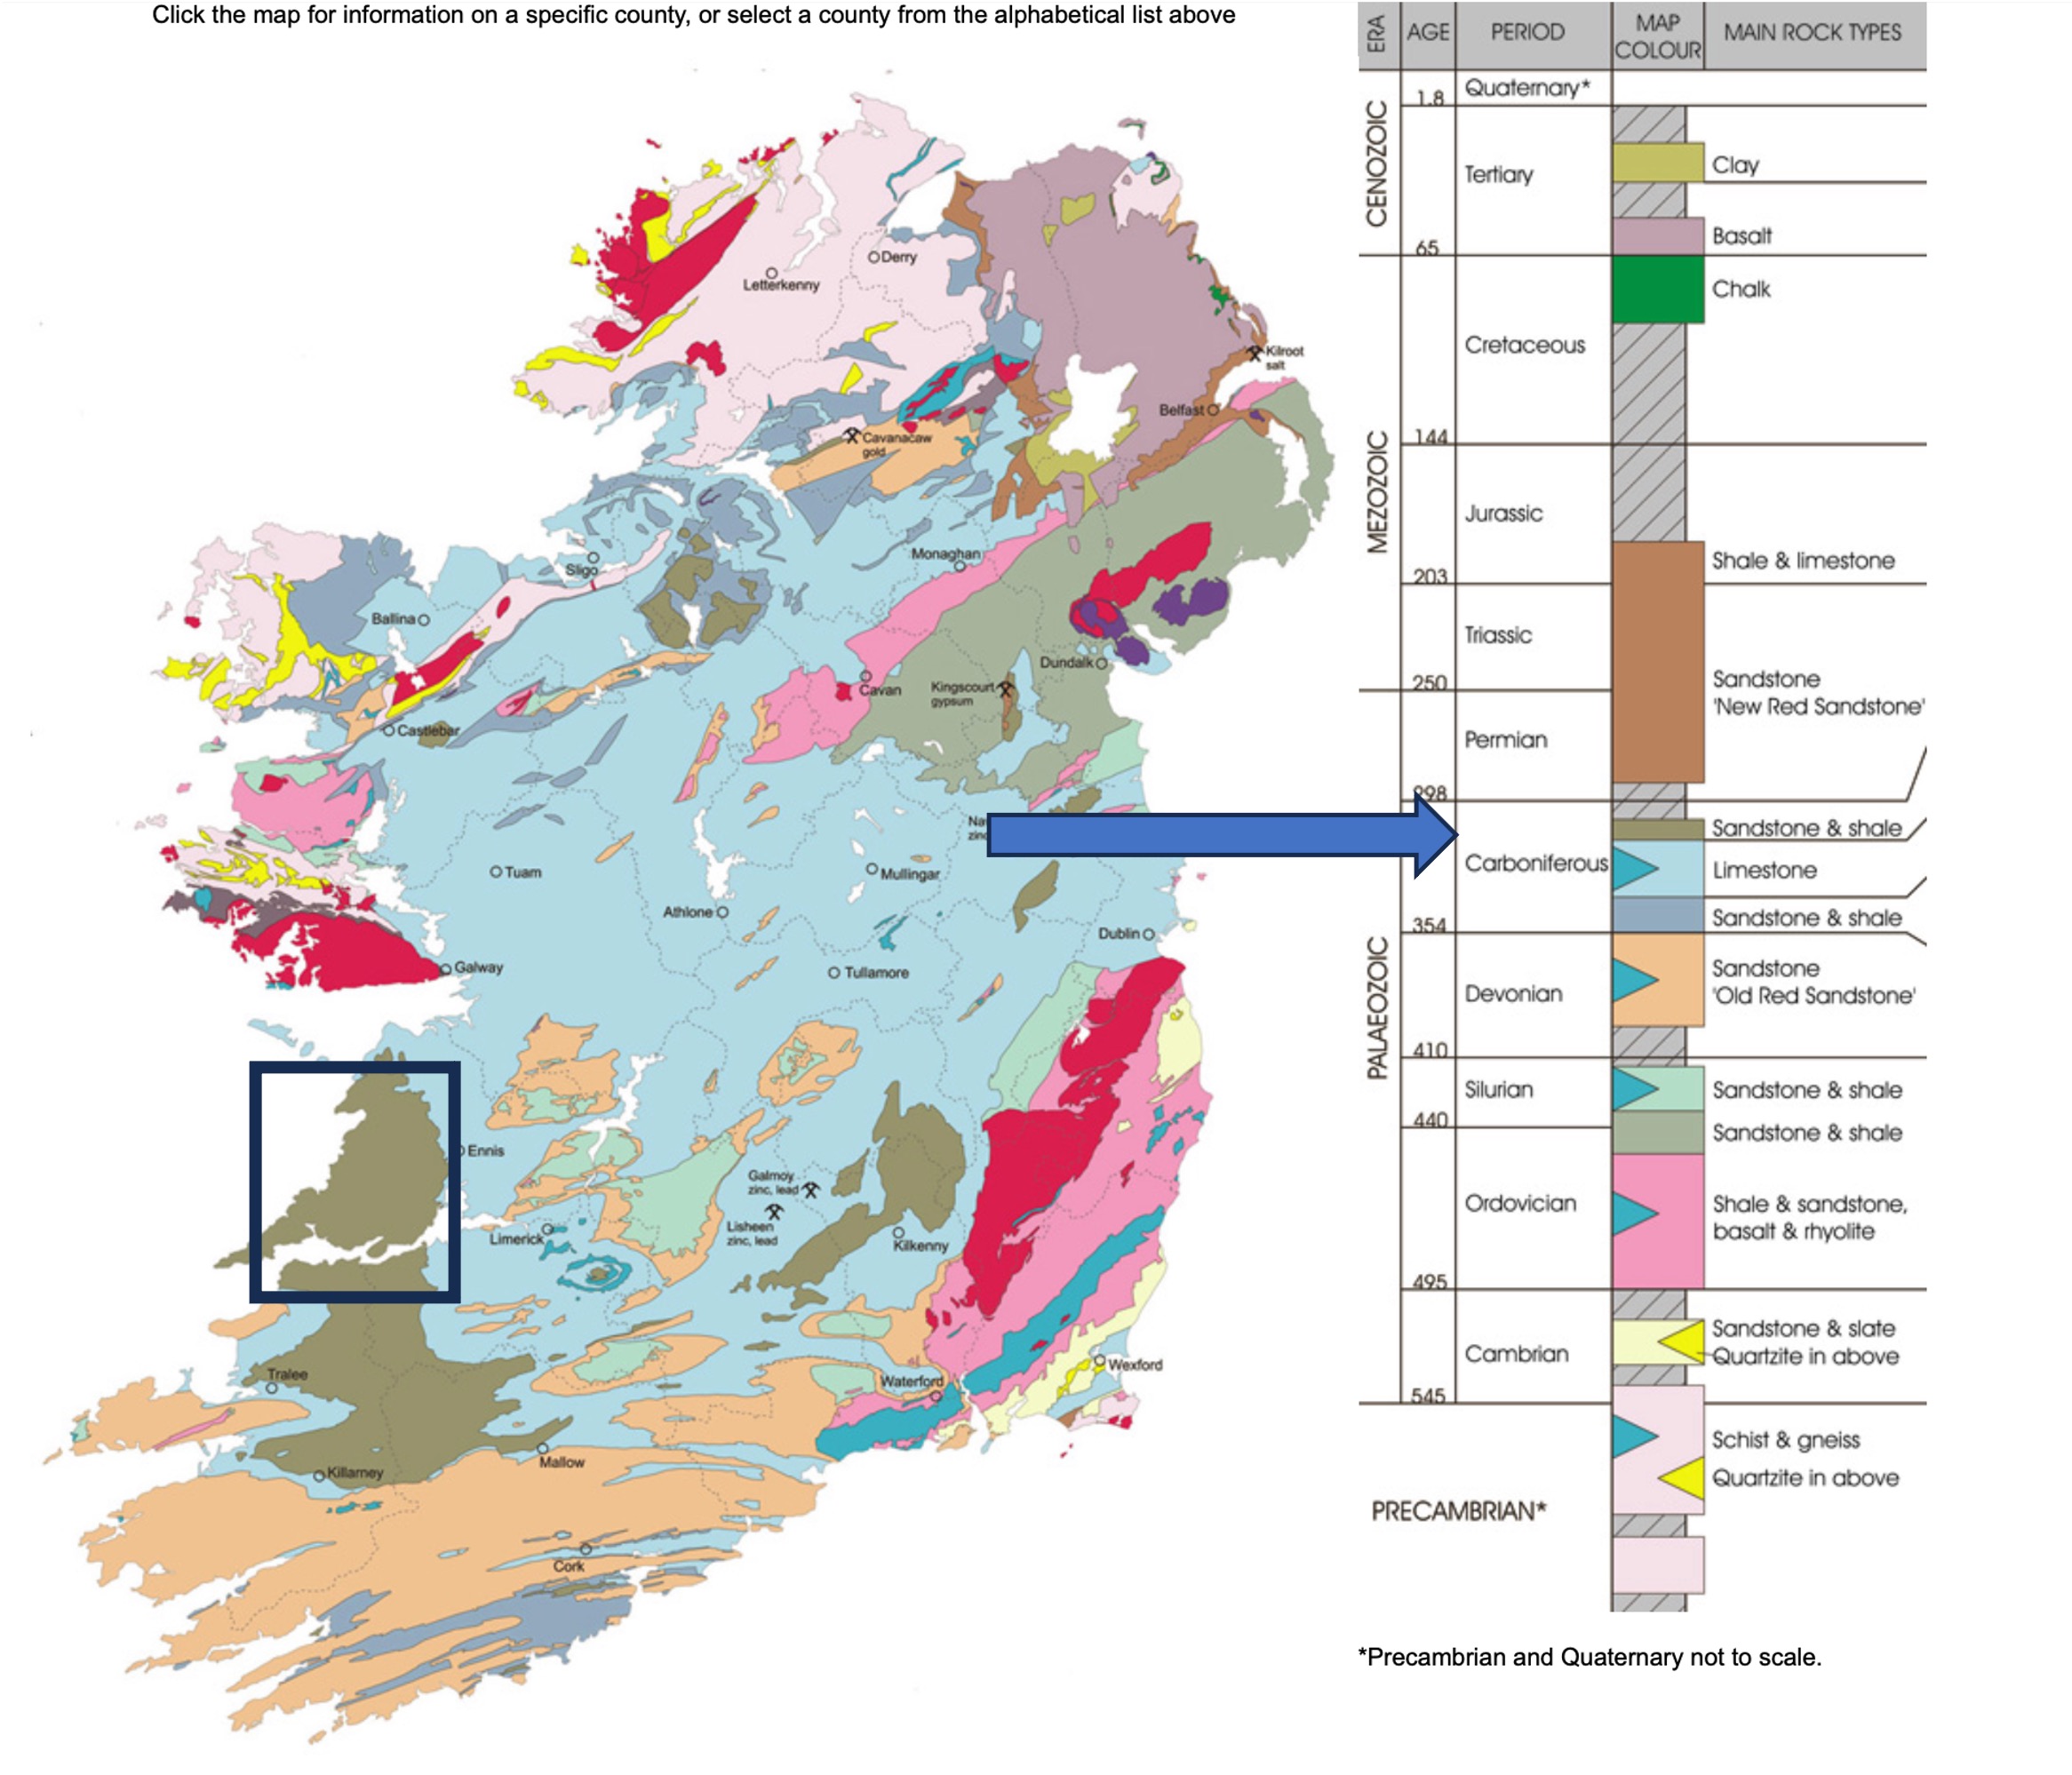
This figure shows the geology of Ireland with the delta sequence colored in brown. Note its extent south from the rectangle that includes the locations discussed in this and previous posts. This area was a delta several hundred miles in extent, about 310 million years ago. The green rocks that cover most of Ireland are the same ones we saw before, and will see again. These limestones were deposited in the extensive, shallow sea that waited for the imminent collision.
My next post will look at the red area on the map, due north of the rectangle, as well as the glacial topography that defines Ireland today.
Kilkee Cliffs: A Closer Look at Late Carboniferous Delta Sediments

Figure 1. Wide view of the area called Kilkee Cliffs, showing the nearly horizontal bedding plane of these Late Carboniferous (about 310 Ma) rocks. Note the slight dip towards the right (northeast) of the cliff in the distance. These are the same rocks I saw at Foynes.
Figure 2. Geologic map of Ireland, showing the area reported on today and in the next post, colored brown and offset with a black rectangle. The view in Fig. 1 is looking to the northwest near the center of the rectangle. The stratigraphy of Ireland is shown on the right, with the arrow indicating where these rocks fall within the sequence that has been identified in Ireland. The limestones I reported on earlier are just below these rocks in the stratigraphic column.

Figure 3. These rocks comprise thin beds of sandstone and shale towards the top of this image, and thicker beds of sandstone and siltstone lower in the section. These rocks have been identified as turbidites and delta sediments. I discussed this in the previous post.
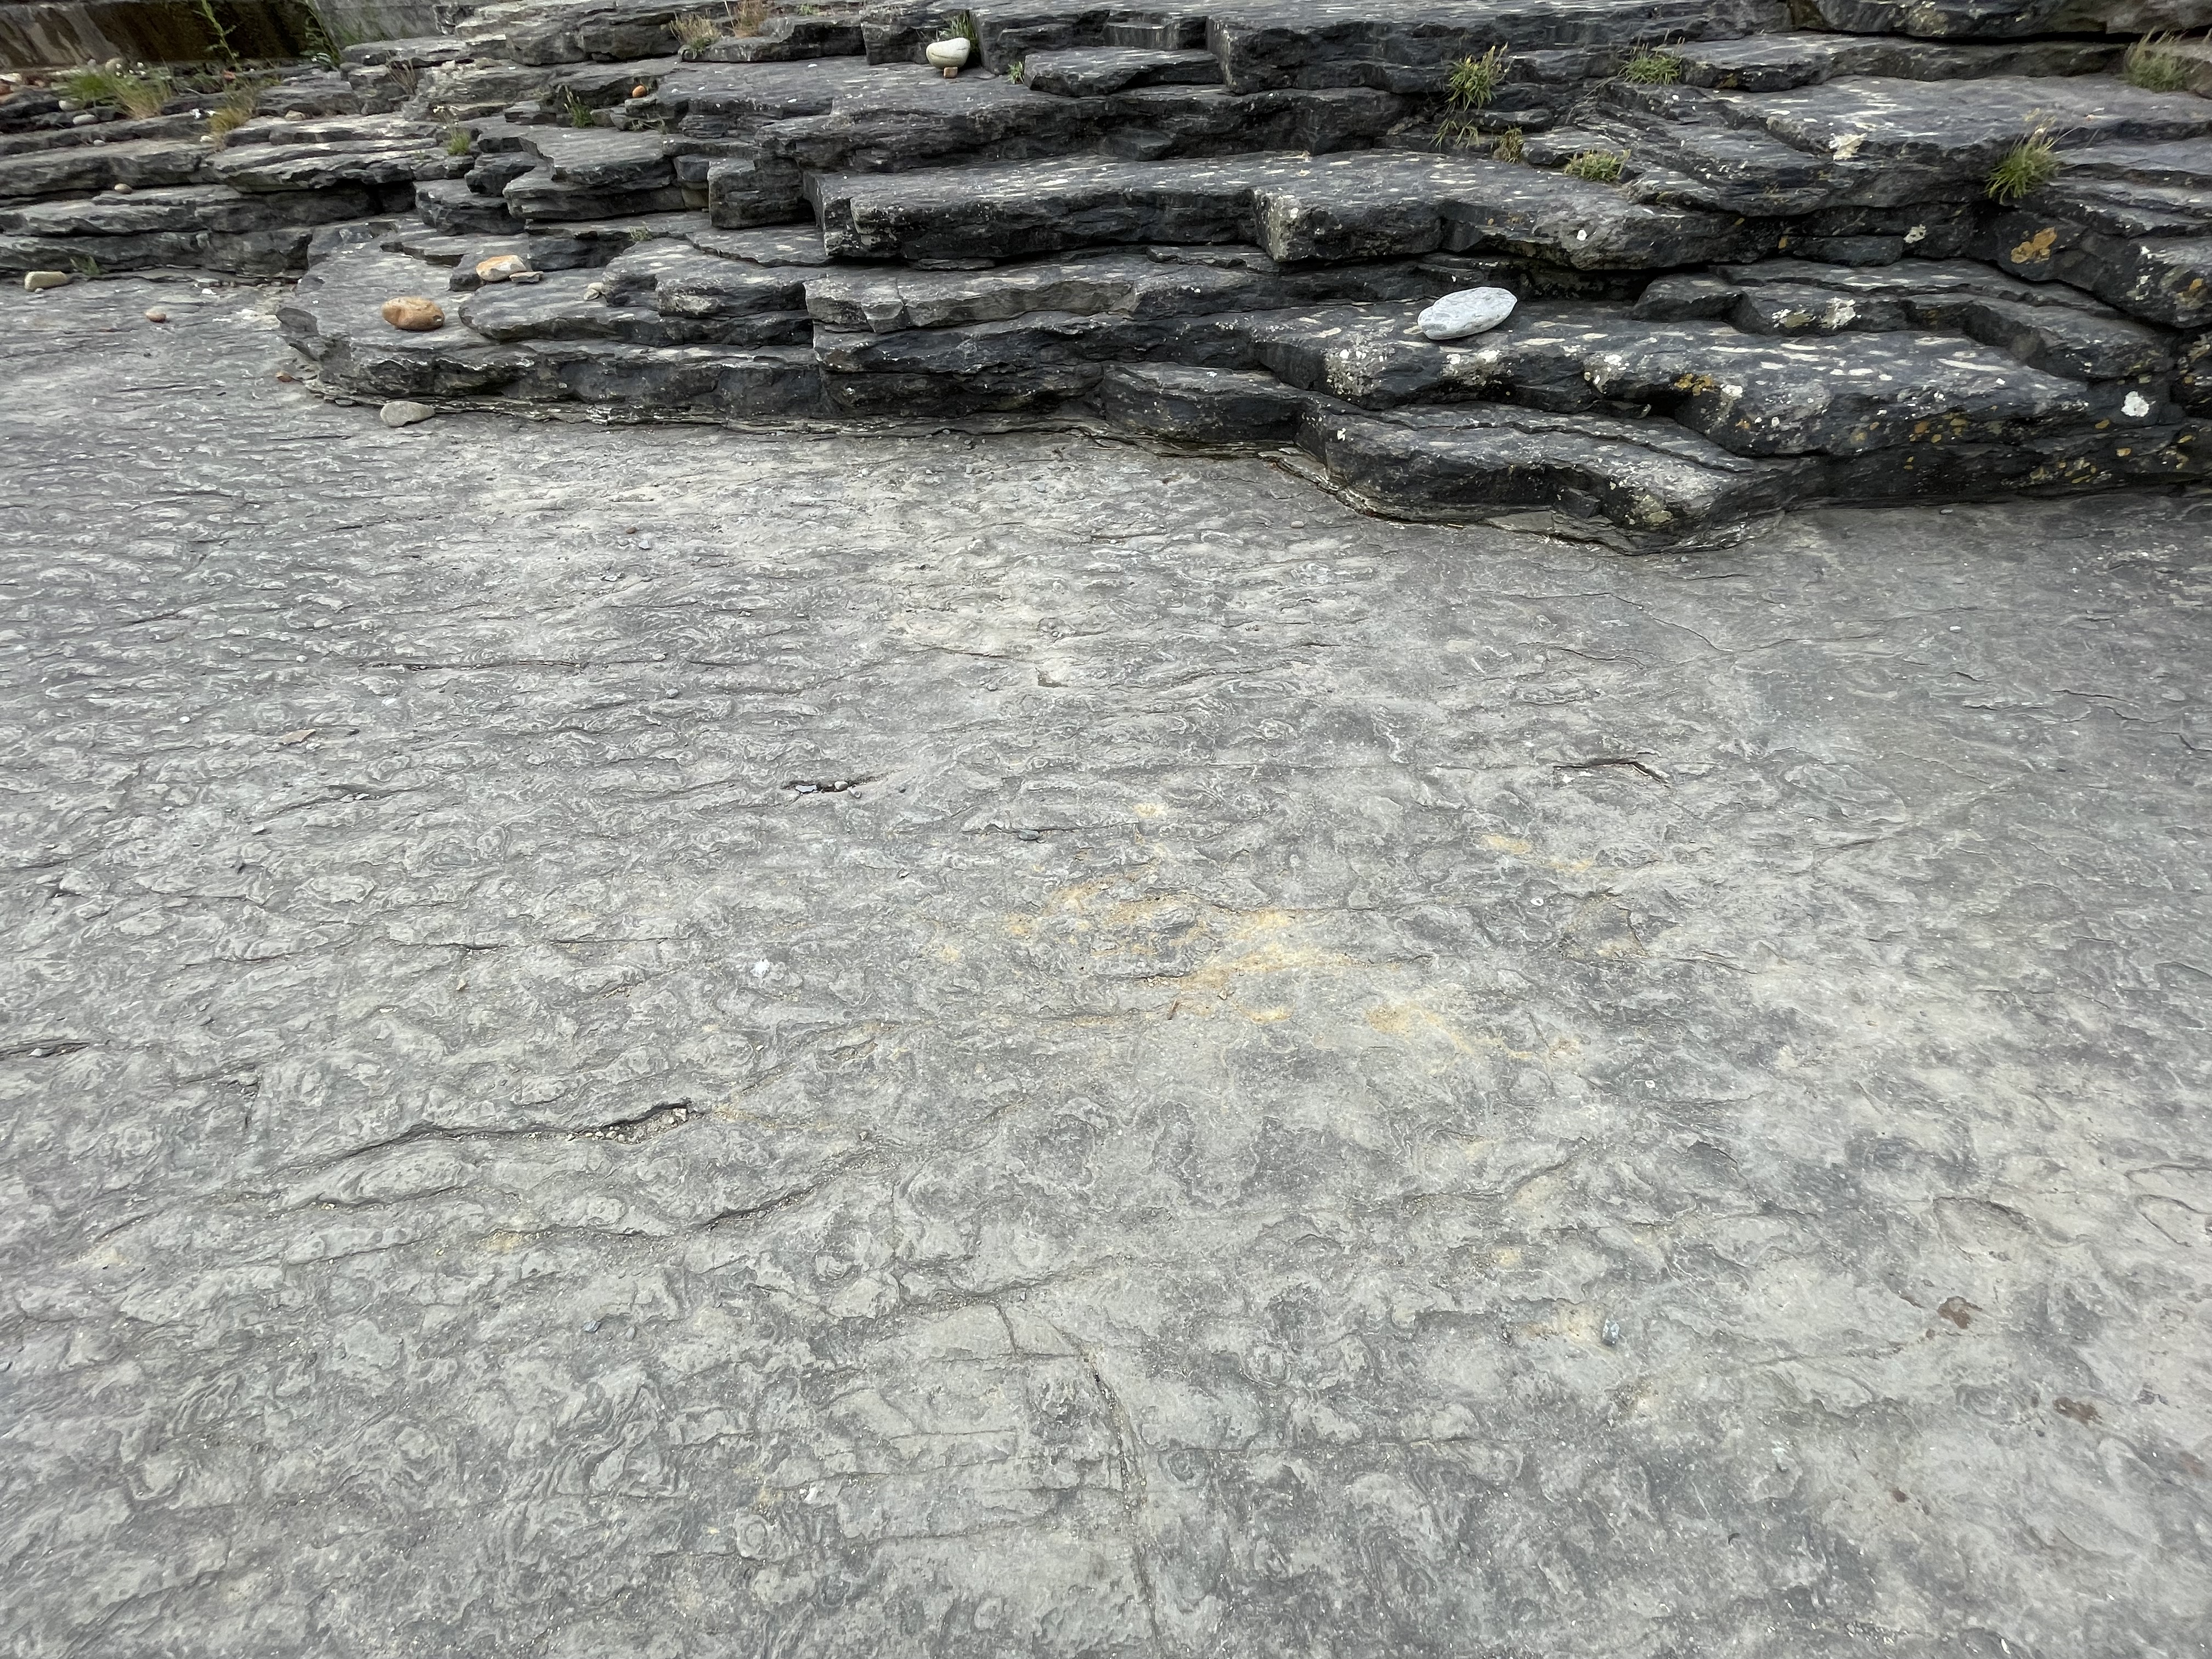
Figure 4. Close-up of a bedding plane within the thin beds shown in Fig. 3. The surface is covered with elongate ripples in the background, and more lunate ripples towards the lower-right. These ripple marks are more common in a nearshore environment (e.g. water shallower than 100 feet) than in turbidity flows, which are not as spatially uniform.
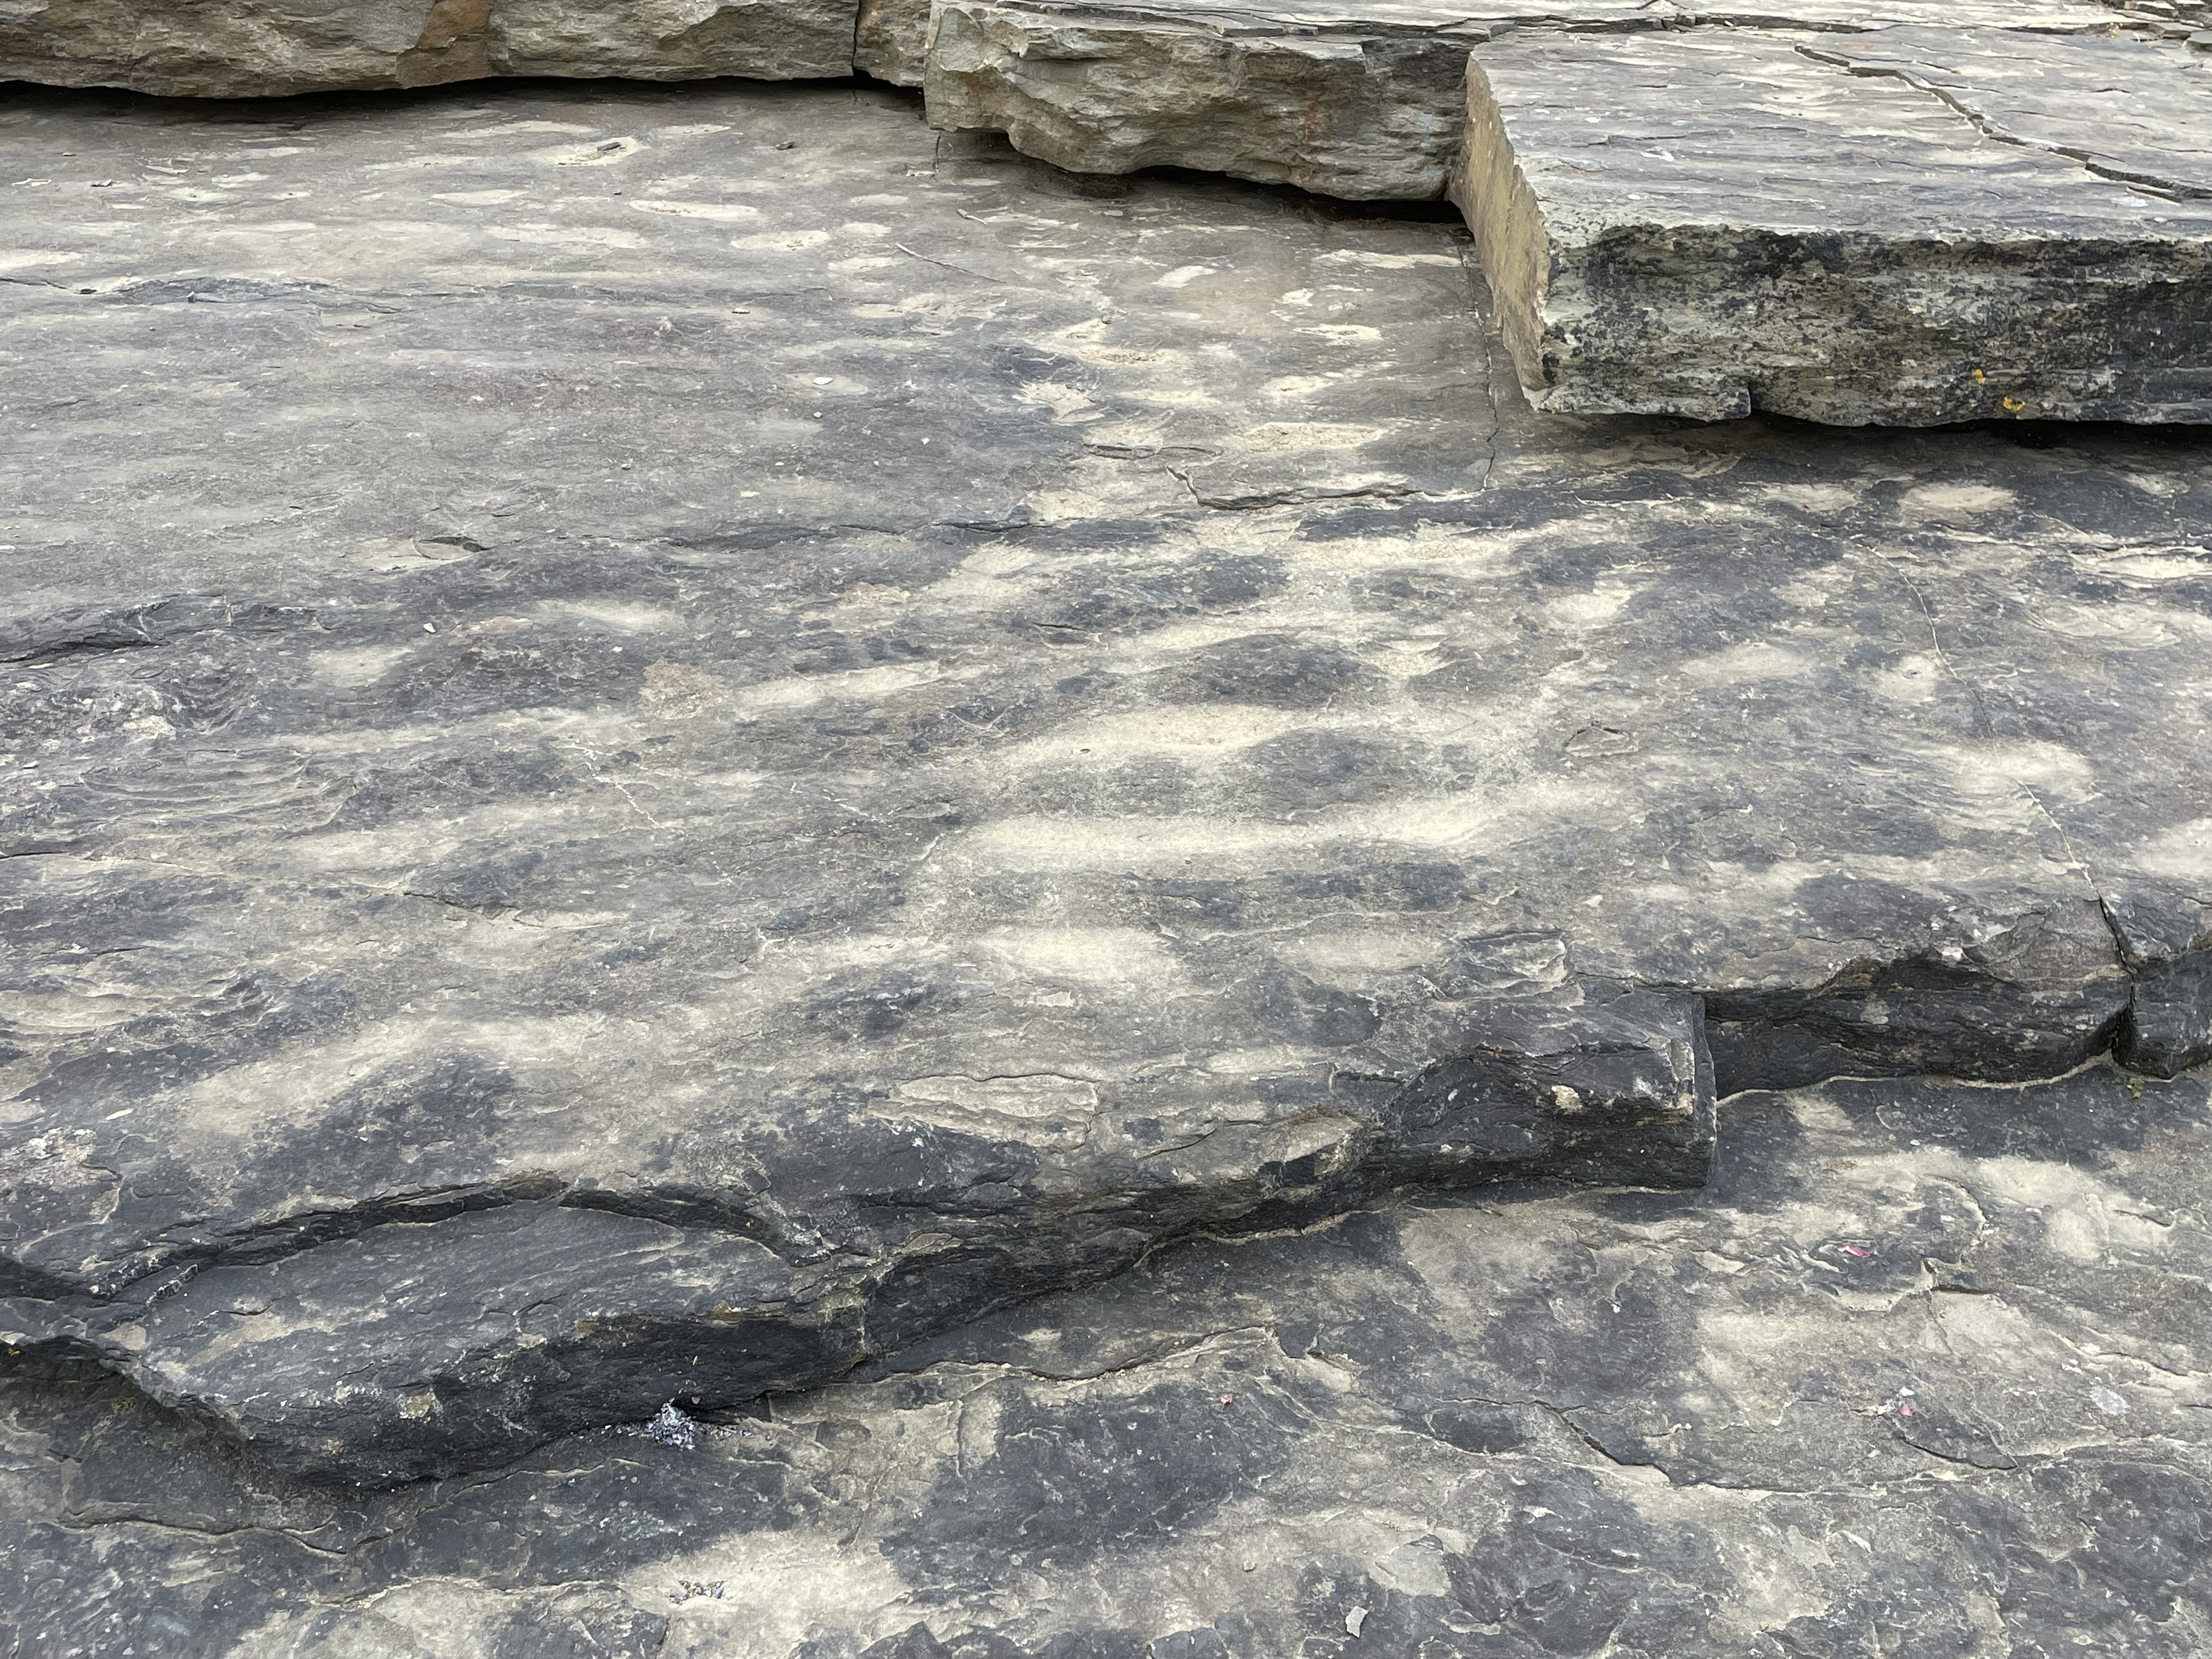
Figure 5. Detail of wave ripple marks. The water depth of the silty sediment in which they formed depends on several factors: grain size, surface wave properties (e.g. wave height and period), water depth; thus, the exact water depth cannot be determined. However, if these ripples were buried by a sudden influx of sand/silt during a storm, the water would have been deeper than if the waves were fair-weather and the silt/sand was introduced by a river flood.
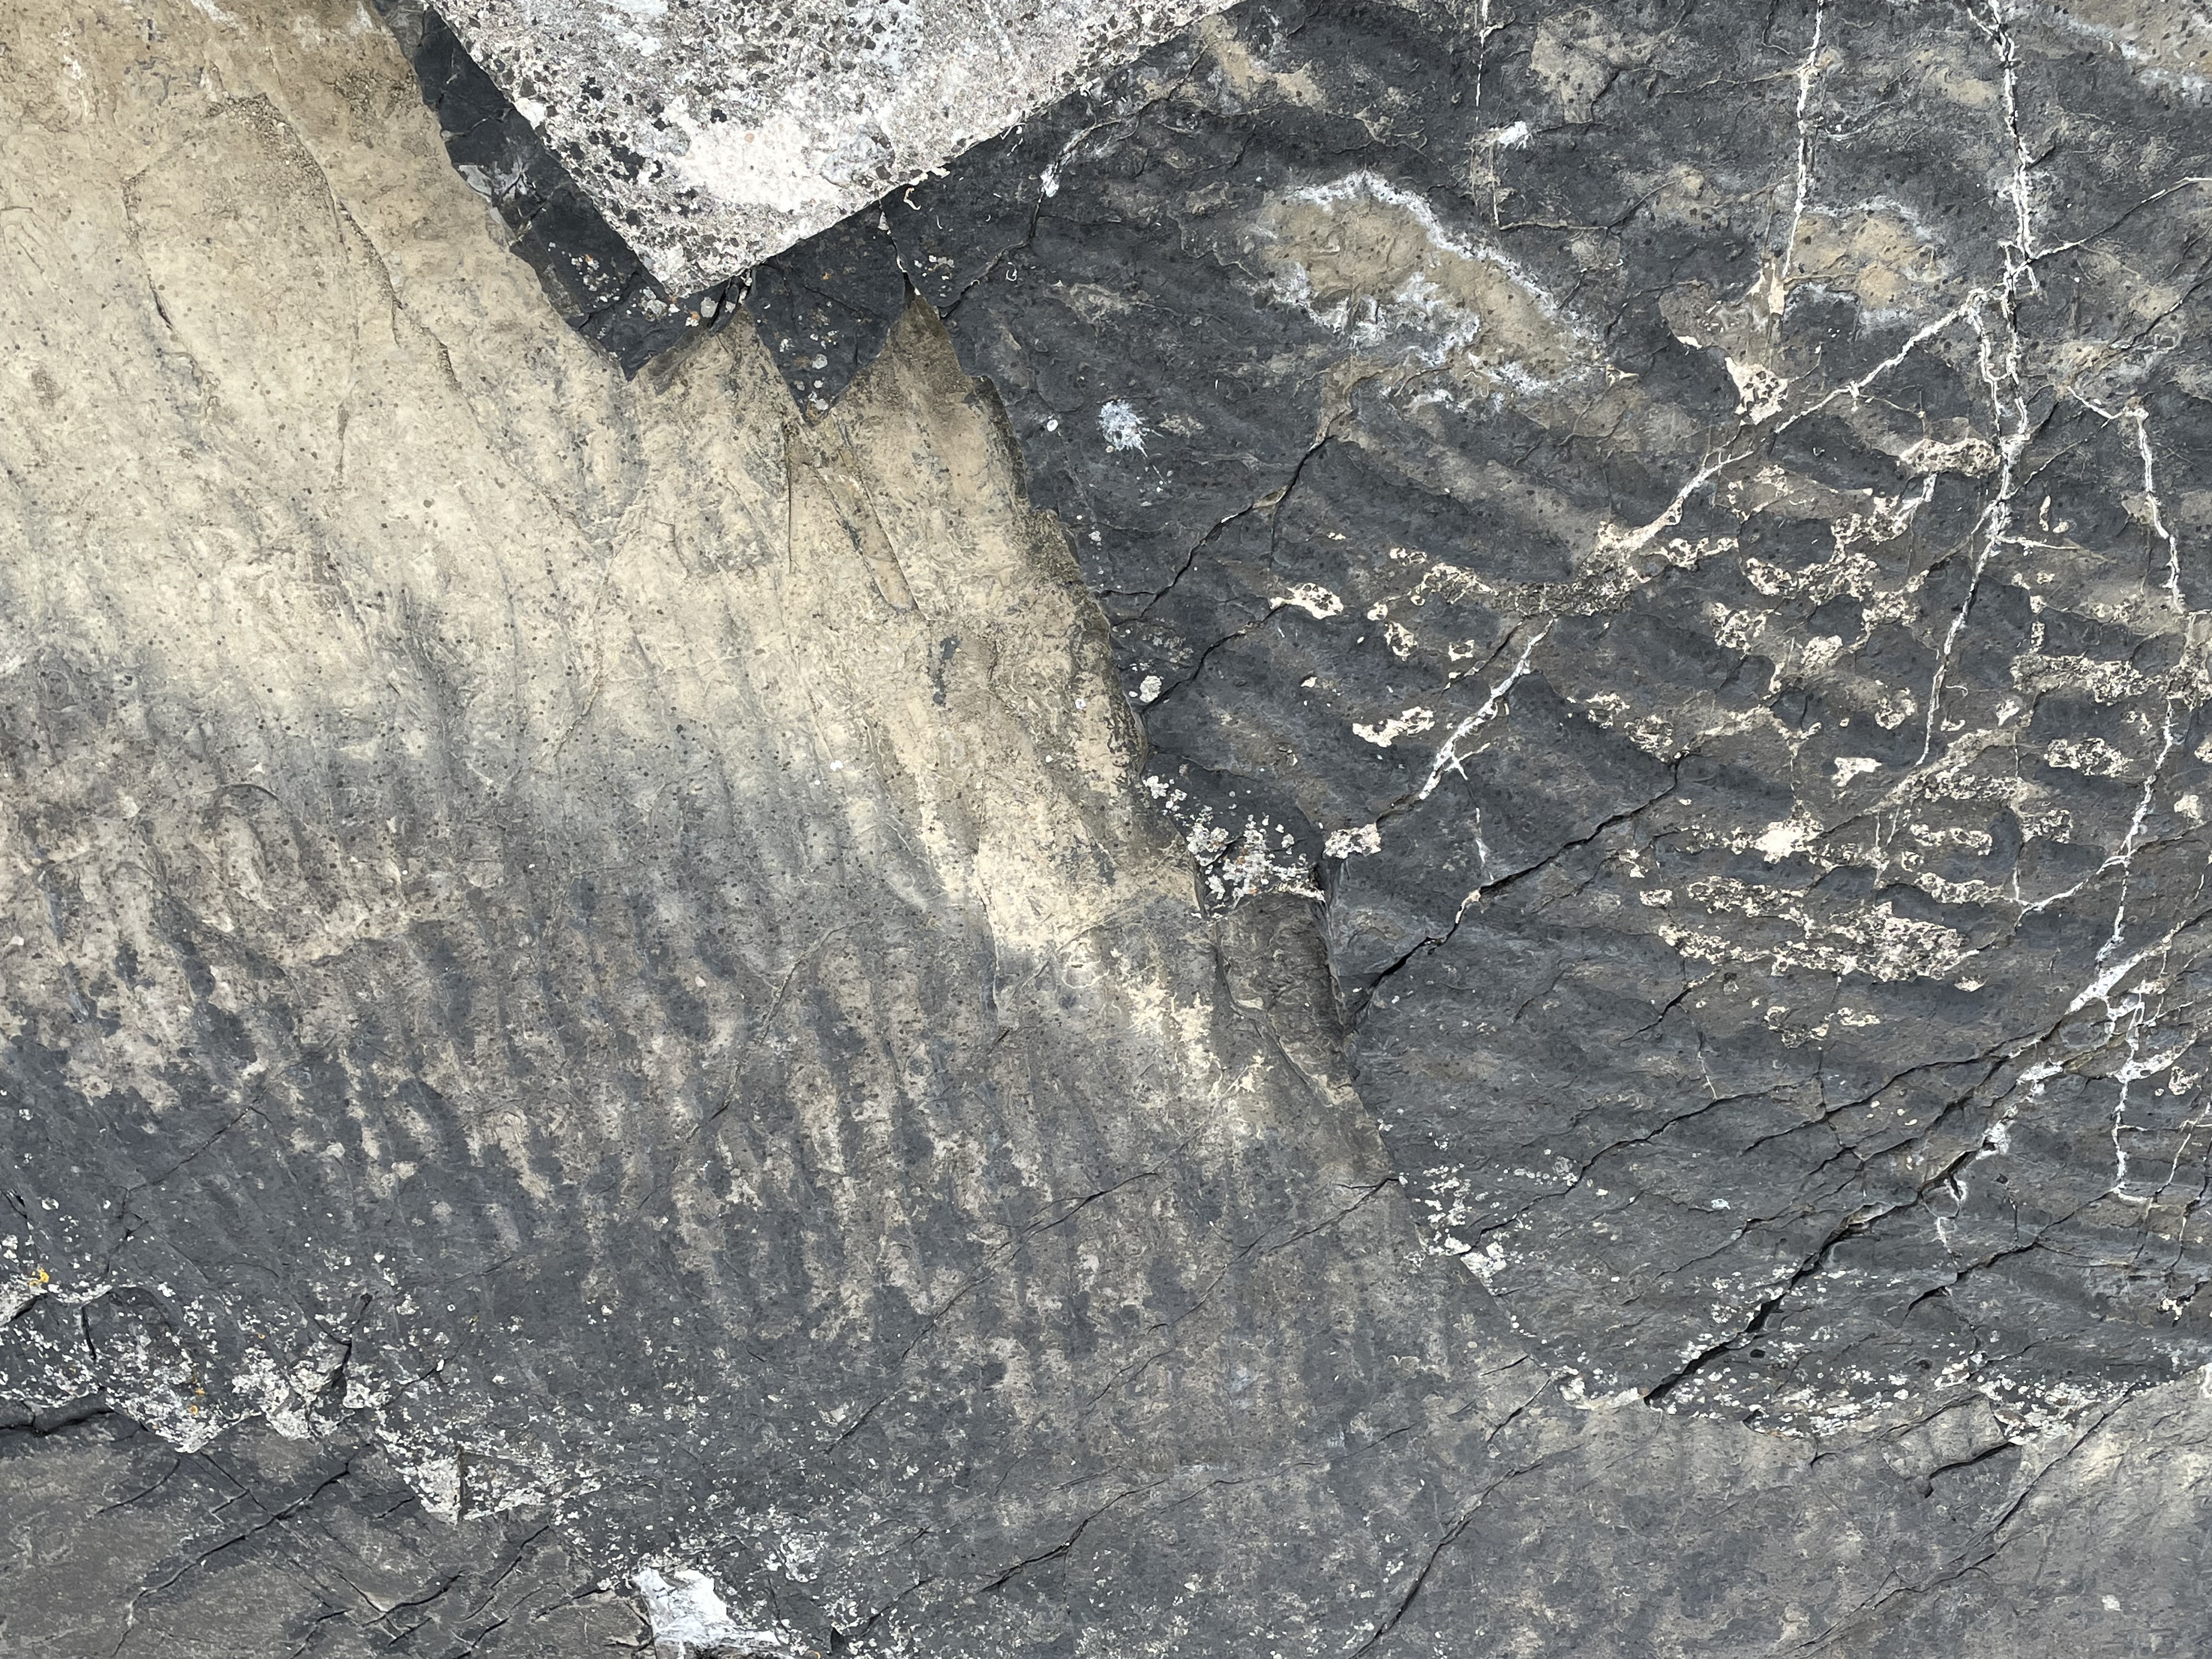
Figure 6. This image (looking down) shows ripple marks on bedding planes less than six inches apart vertically, in sediment deposited within months. The upper ripple marks (finer and more continuous) indicate waves arriving from the left of the photo; the lower (darker and larger) ripple marks suggest waves coming from the top of the photo. If I had to guess, I’d say that the older ripples were formed during a storm (i.e. larger waves produce larger and more irregular sand ripples); the younger set (buried within a few months) suggest quieter conditions. We don’t see details of past environments preserved much better than this.

Figure 7. This photo shows a set of uniform joints as X’s in the center of the image. They are very dense and form right angles. Sets of these joints occurred about 20 feet apart. These sets of joints were aligned with fracturing and preferential erosion along lines oriented from the top to bottom of this photo; the ‘V’ at the top of the image is the seaward extension of one such set of joints; the white patch in the upper-center shows where a layer has spalled off. The same delamination can be seen in the foreground. Imagine layers of paper being folded slightly; they slip against each other. The rock seen in this photo did that and, because it was no longer soft from burial and geothermal heating, it fractured on the outside of bends as the layers slipped.

Figure 8. This photo (image width is about two inches) shows crystals filling some of the joints as seen in Fig. 7; this could be quartz or calcite, but the orientation of the crystals’ long axes at an angle to the joint margins suggests that they formed during slippage, i.e. as the layers were sliding past each other. This is probably calcite, which precipitates readily from ground water (e.g. stalactites in caves) whereas hydrothermal fluids rich in quartz are rare without a nearby source of magma. There is no evidence of that in this region at this time.
These rocks weren’t folded or faulted as we would expect if this area was compressed during collision of the porto-North American and porto-European tectonic plates during the Paleozoic era. Maybe these sediments were deposited when mountains were uplifted during that ancient orogeny.
As I said before, mountains are as often as not identified by their erosional remains rather than their cores …
Deformed Marl at Knockainey
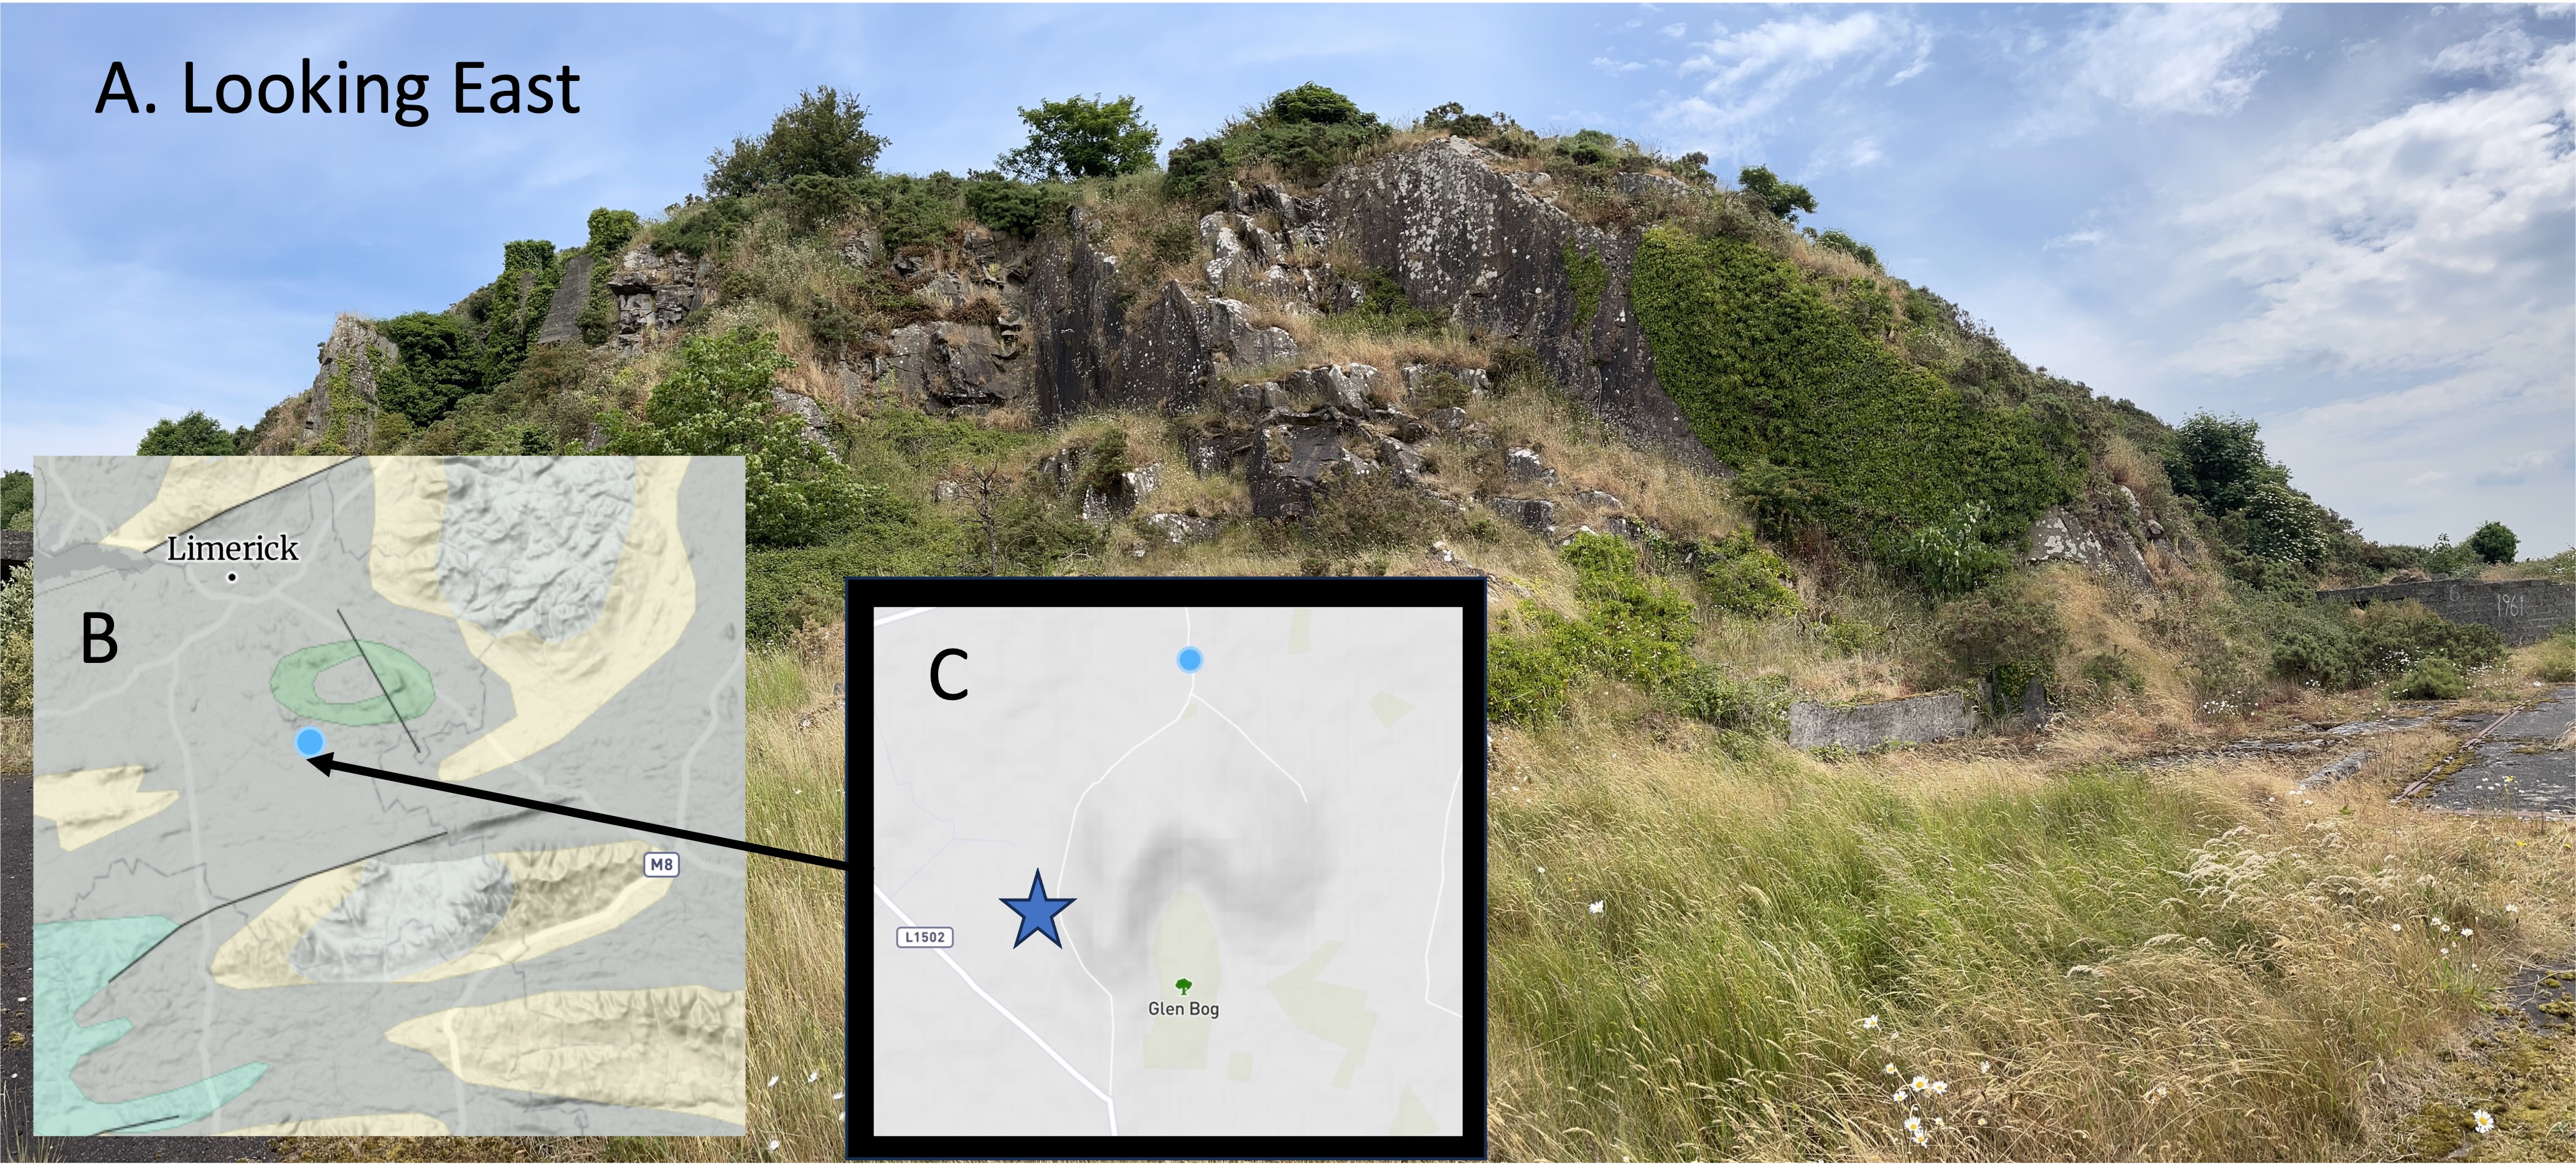
Figure 1. (A) This hill is more than 50 feet high, standing out above a gently rolling countryside. It got my attention because it looks like another source of building stone in a farming area the walls between fields are built of field stone. (B) The location places it just south of metabasalt alluded to in a previous post, which is the ring of light-brown on the inset map from Rockd. The major lithology of the green area is limestone, with some clay and sandstone; this Early Carboniferous (360-323 Ma) limestone is coeval with the rocks from Loch Gur. (C) The distinctive shape of the hill is seen in the topographic map The star is the small study area, located near the remains of an abandoned automotive service facility.

Figure 2. The rocks here are relatively massive but larger, in-place, exposures had a common plane oriented approximately like those labeled “Bedding Plane” in the photo. These beds are close to vertical whereas those at Loch Gur were much less steep. This could have been caused when the basalts (brown ring in Fig. 1B) were emplaced sometime after burial; the forced eruption of basalt would have folded the layers of limestone back like a flower opening.

Figure 3. Close-ups of boulders lying at the base of the cliff (inset photos), reveal similar textures but have slightly different hues; plate (B) is slightly redder, but both have a texture similar to unweathered limestone we saw near Loch Gur. The surface color is caused by the weathering of iron-bearing silicate minerals like amphibole and biotite.
Besides the color, there is another important difference between these samples and those: there is no evidence of the dark inclusions we saw at Loch Gur, which were also absent in the rocks from the stone circles described previously. There are also no dissolution cavities in these rocks, as seen at the quarry.
The photos in Fig. 3 have black circles drawn around inclusions. They are representative only. Some of these inclusions appear to be regular (e.g. the lowest circle in Fig. 3A) whereas others are highly irregular, such as the leftmost circle in Fig. 3B. These are NOT fragments of rock, or sand grains; however, they may be the remnants of fossils within the original carbonate sediments that were partly dissolved during burial.
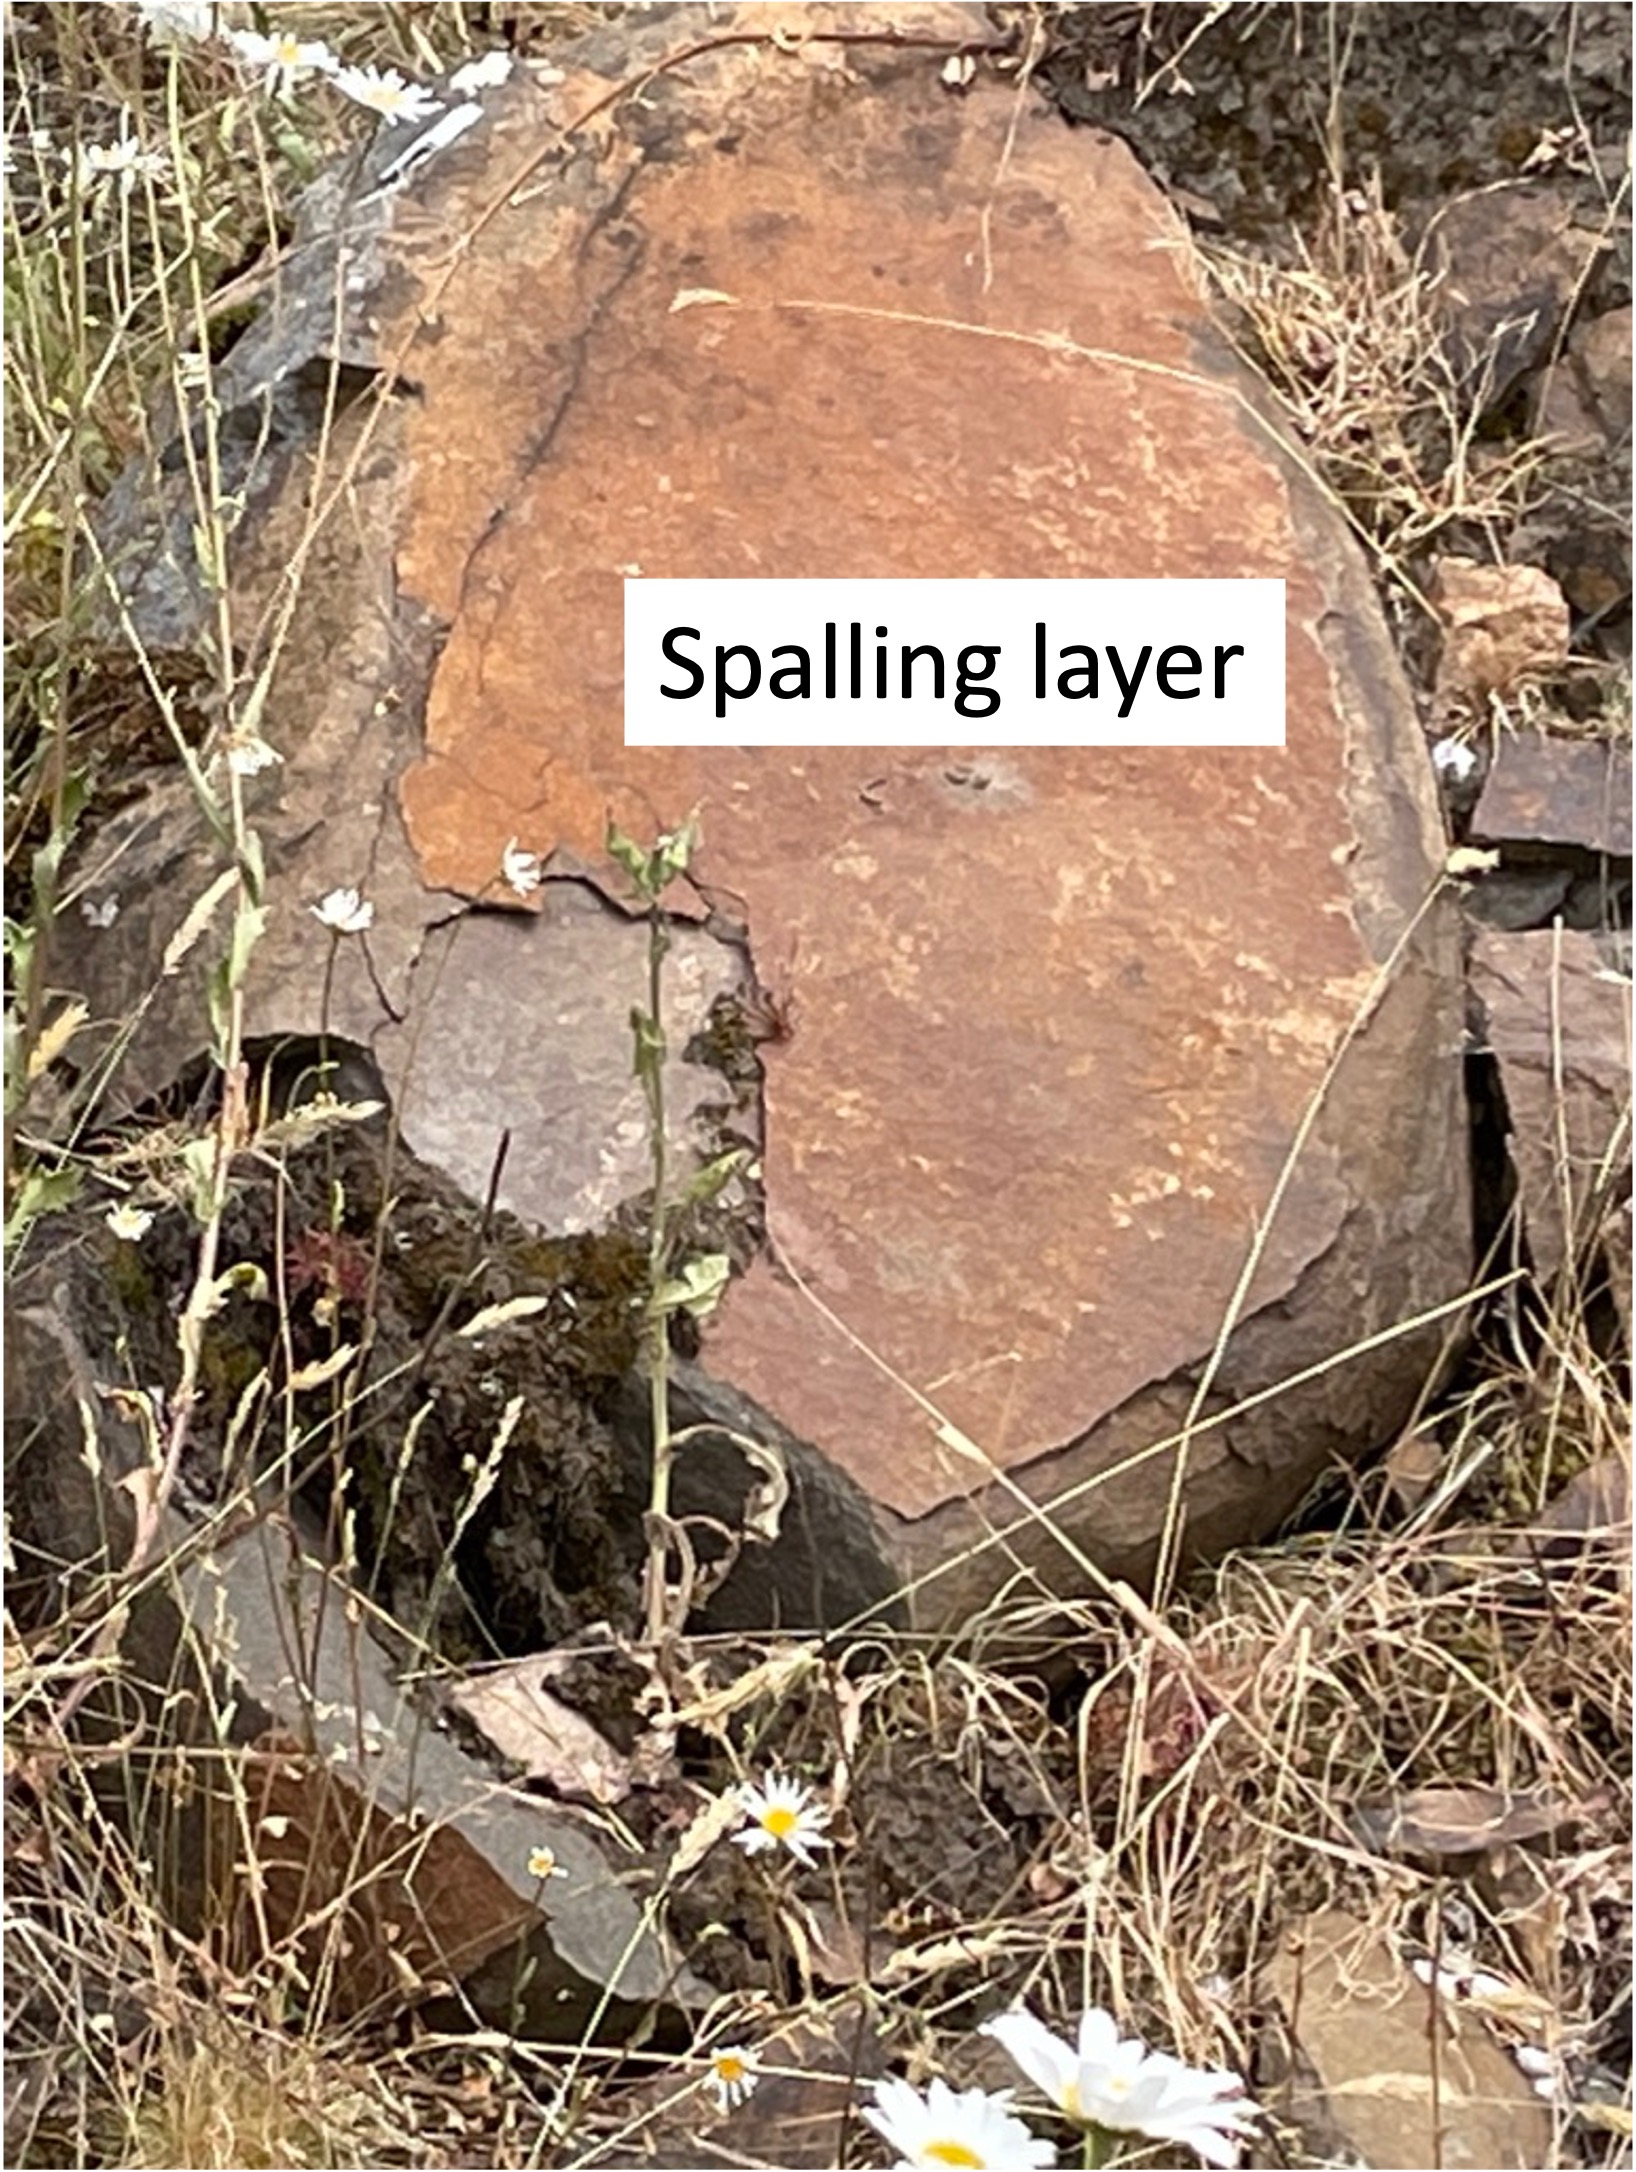
Figure 4. This boulder has a surface layer (labeled “Spalling layer”) that has separated from the subjacent, unweathered rock. This delamination occurs because the weathering products (e.g. limonite and hematite) of minerals high in iron (e.g. amphibole, biotite) expand in volume; consequently, this boulder is peeling like an onion, exposing an unweathered, gray layer.
Mixtures of carbonates and clastic sediments are called marl or marlstone. Typically, marlstone incorporates so much sand and silt that it doesn’t become very hard and is thus crumbly. However, without using a petrographic microscope to observe the composition of the rock, I can’t say if it’s 5 percent, 10 percent, or 20 percent terrigenous sediments — so it’s marlstone.
This post isn’t a summary of the geological history of Ireland, so all I will say in summary is that these rocks verify what I suspected already: a broad, shallow sea (e.g. a bay or estuary) began to receive sediments eroded from mountains between 360 and 320 Ma; the percentage of siliciclastic sediments increased to the point that, sometime after 320 Ma, this area had become part of river delta, as we saw at Foynes in the last post.
What Came After: Carboniferous Shales at Foynes
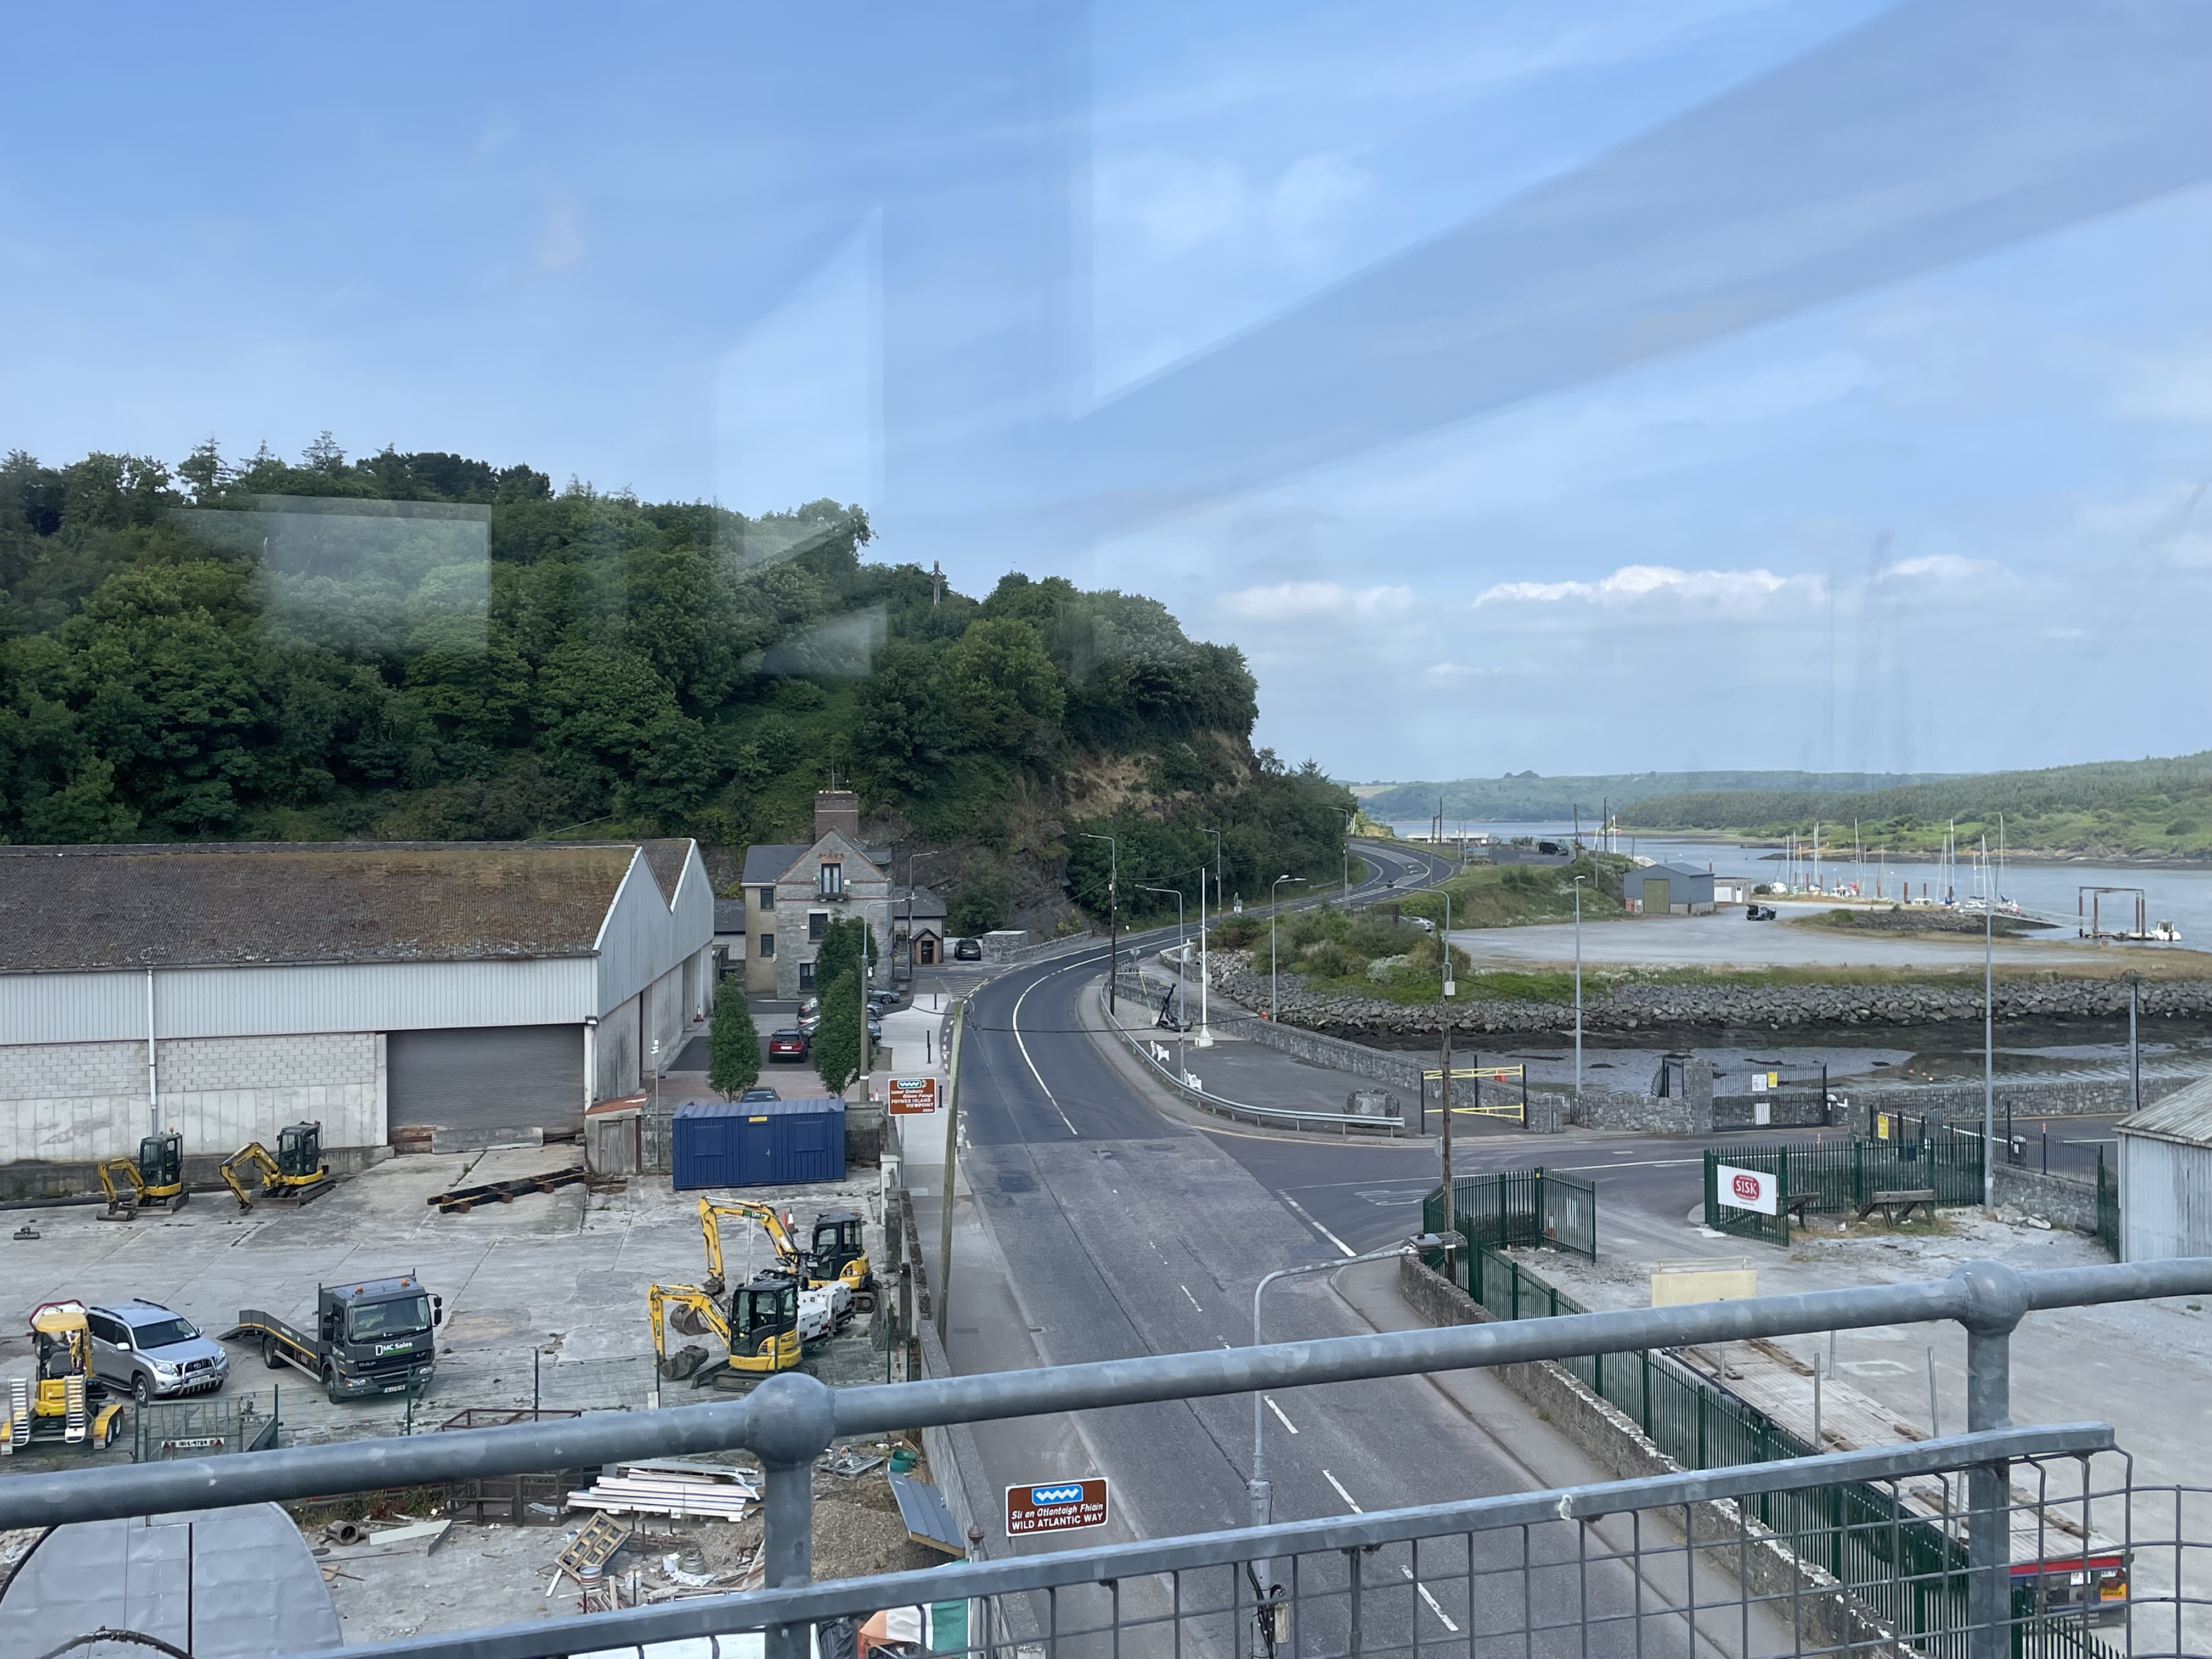
Figure 1. View looking west along the southern shore of Shannon Estuary in the town of Foynes. The ridge in the image got my attention, so I investigated it further. The gently rising land to the right is Foynes Island, which is elevated but not as high as the ridge.
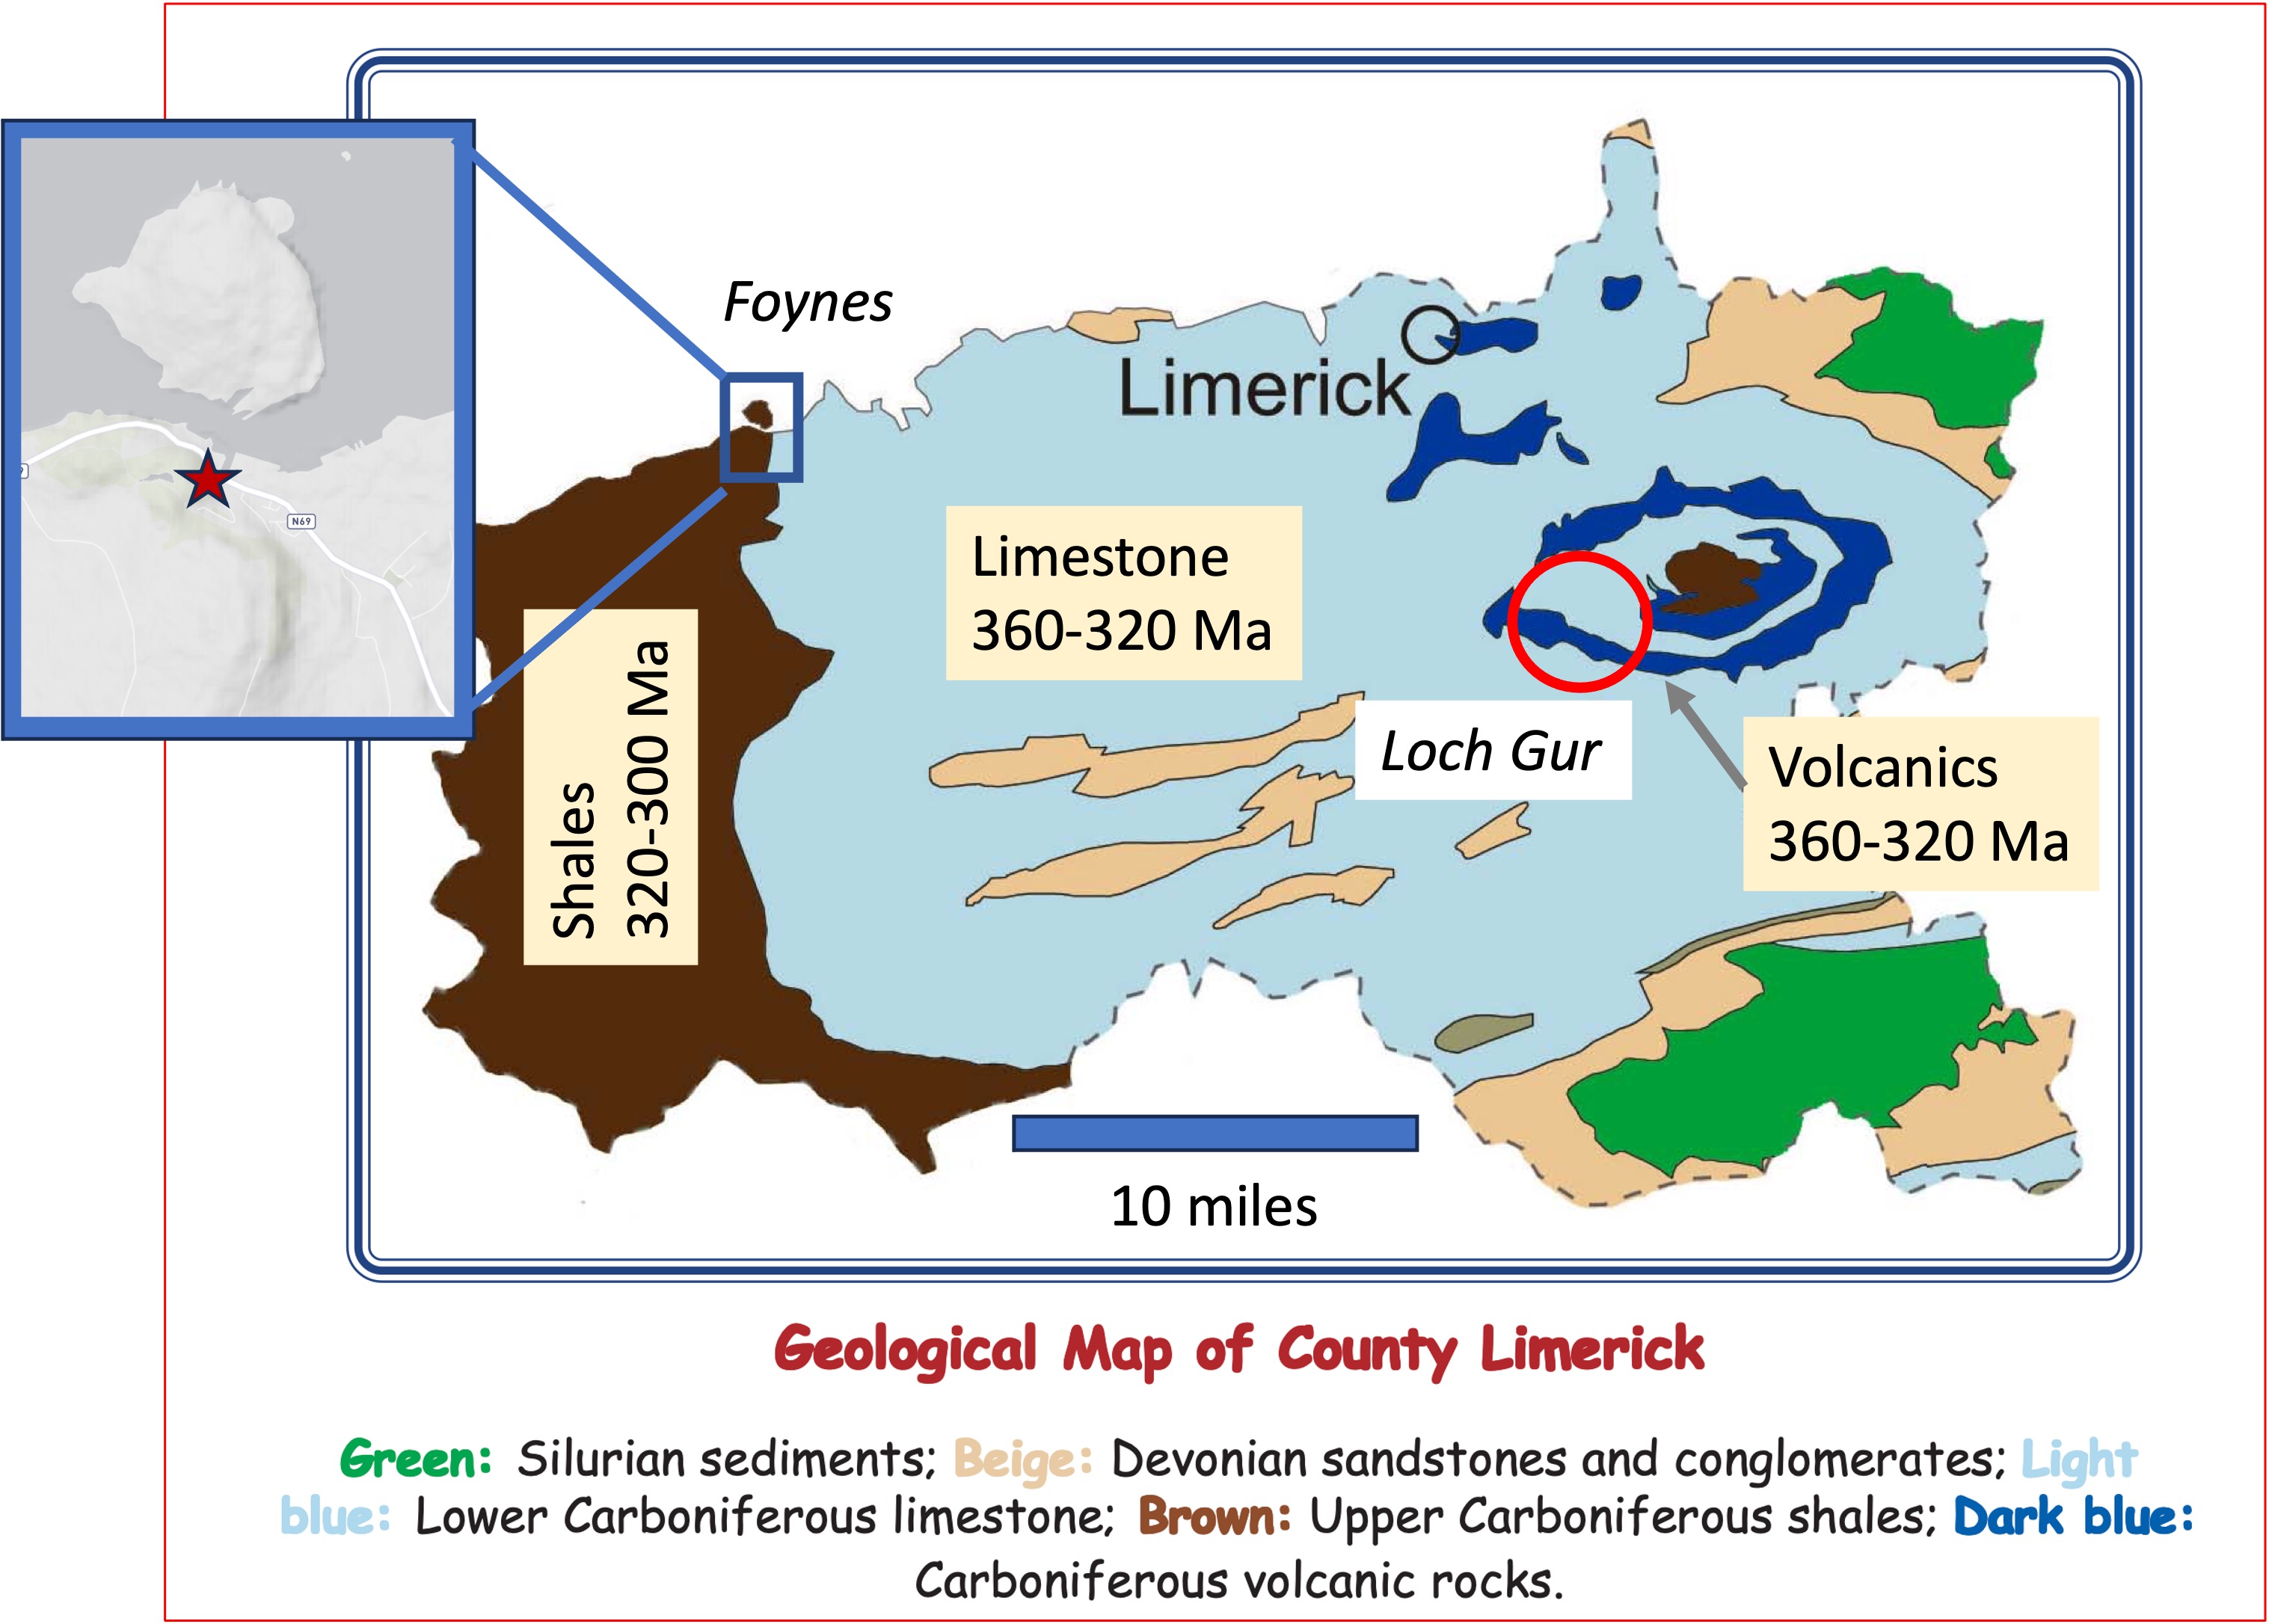
Figure 2. My last post was from Loch Gur (red circle to the right), where we saw limestones with evidence of contamination by terrigenous sediment (i.e. mud) and no fossils. These chemical/biological sediments were deposited between 360 and 320 Ma (Ma refers to mega annums, roughly millions of years ago). This post travels thirty miles westward to Foynes (blue rectangle), where we discovered the ridge in Fig. 1. These are slightly younger shales geologically. The inset map shows the topography of Foynes (the star is the location of Fig. 1); the ridge follows the outline of these rocks on the geological map (brown).

Figure 3. The left image shows the bluff (see Fig. 1), which is composed of mud, sand, and silt. The white circle is shown in more detail in the center photo: Massive sand/silt beds sandwich a thick sequence of thin layers of fine-grained sediment with a dark color, which suggests a high organic carbon content (i.e. decayed plant matter), low-oxygen environment. For example, black shale may form in stratified, shallow seas and is a source of petroleum.
The orange circle was photographed at higher resolution in the right image, which shows thin layers of sand/silt intercalated with fine-grained, dark laminae. Sand balls and lenses (labeled in the figure) suggest that sand was deposited into unconsolidated mud.
One depositional model that is often applied to these kinds of sediments is the Turbidite; coarser sediment slides down steep delta fronts, often activated by wave action, and form discontinuous layers inches in thickness, in deep water. Another, simpler, model is deposition in tidal flats where daily flows slowly sort the fine and coarser sediment into interweaving layers. Without more data, it isn’t possible to choose which is more likely; however, both would occur in similar environments: deltas where rivers debouch into a sea. The brief explanation of these rocks in RockD suggests they are turbidites, although it is likely that the depositional setting changed over time, as we’ll see in the next figure.

Figure 4. This section was exposed about 200 feet from Fig. 3; the rocks here are dipping about 30 degrees away from the camera, so I estimate that this exposure is about 100 feet (this is a “back of the envelope” estimate — a guesstimate) further up-section. These layers are younger than those seen in Fig. 3; using a sedimentation rate of 5 mm/year (I do calculations in metric units), these mixed sediments were deposited less than 10,000 years later.
During that interval, the supply of silt/sand increased substantially; here we see mud at the bottom, then thick (~1 foot) beds of silt/sand appear, first as discrete beds separated by muddy sediment, then as massive layers with no discernible cross-bedding. The white, dotted line is an approximate depositional surface that shows how the silt/sand might have filled low points in the seafloor, or formed sand bars. Turbidite layers as thick as the silt/sand bed at the top of the exposure are uncommon because that is a lot of sand to be mobilized in one event and it is very uniform in thickness.
The photos at the right represent the change in depositional environment that might have occurred during the approximately thousand years required to deposit these sediments. The lower image shows a series of turbidite layers at the bottom of a marine delta; the upper photo shows a typical depositional environment for massive silt/sand beds, with muddy sediment limited to mud flats.
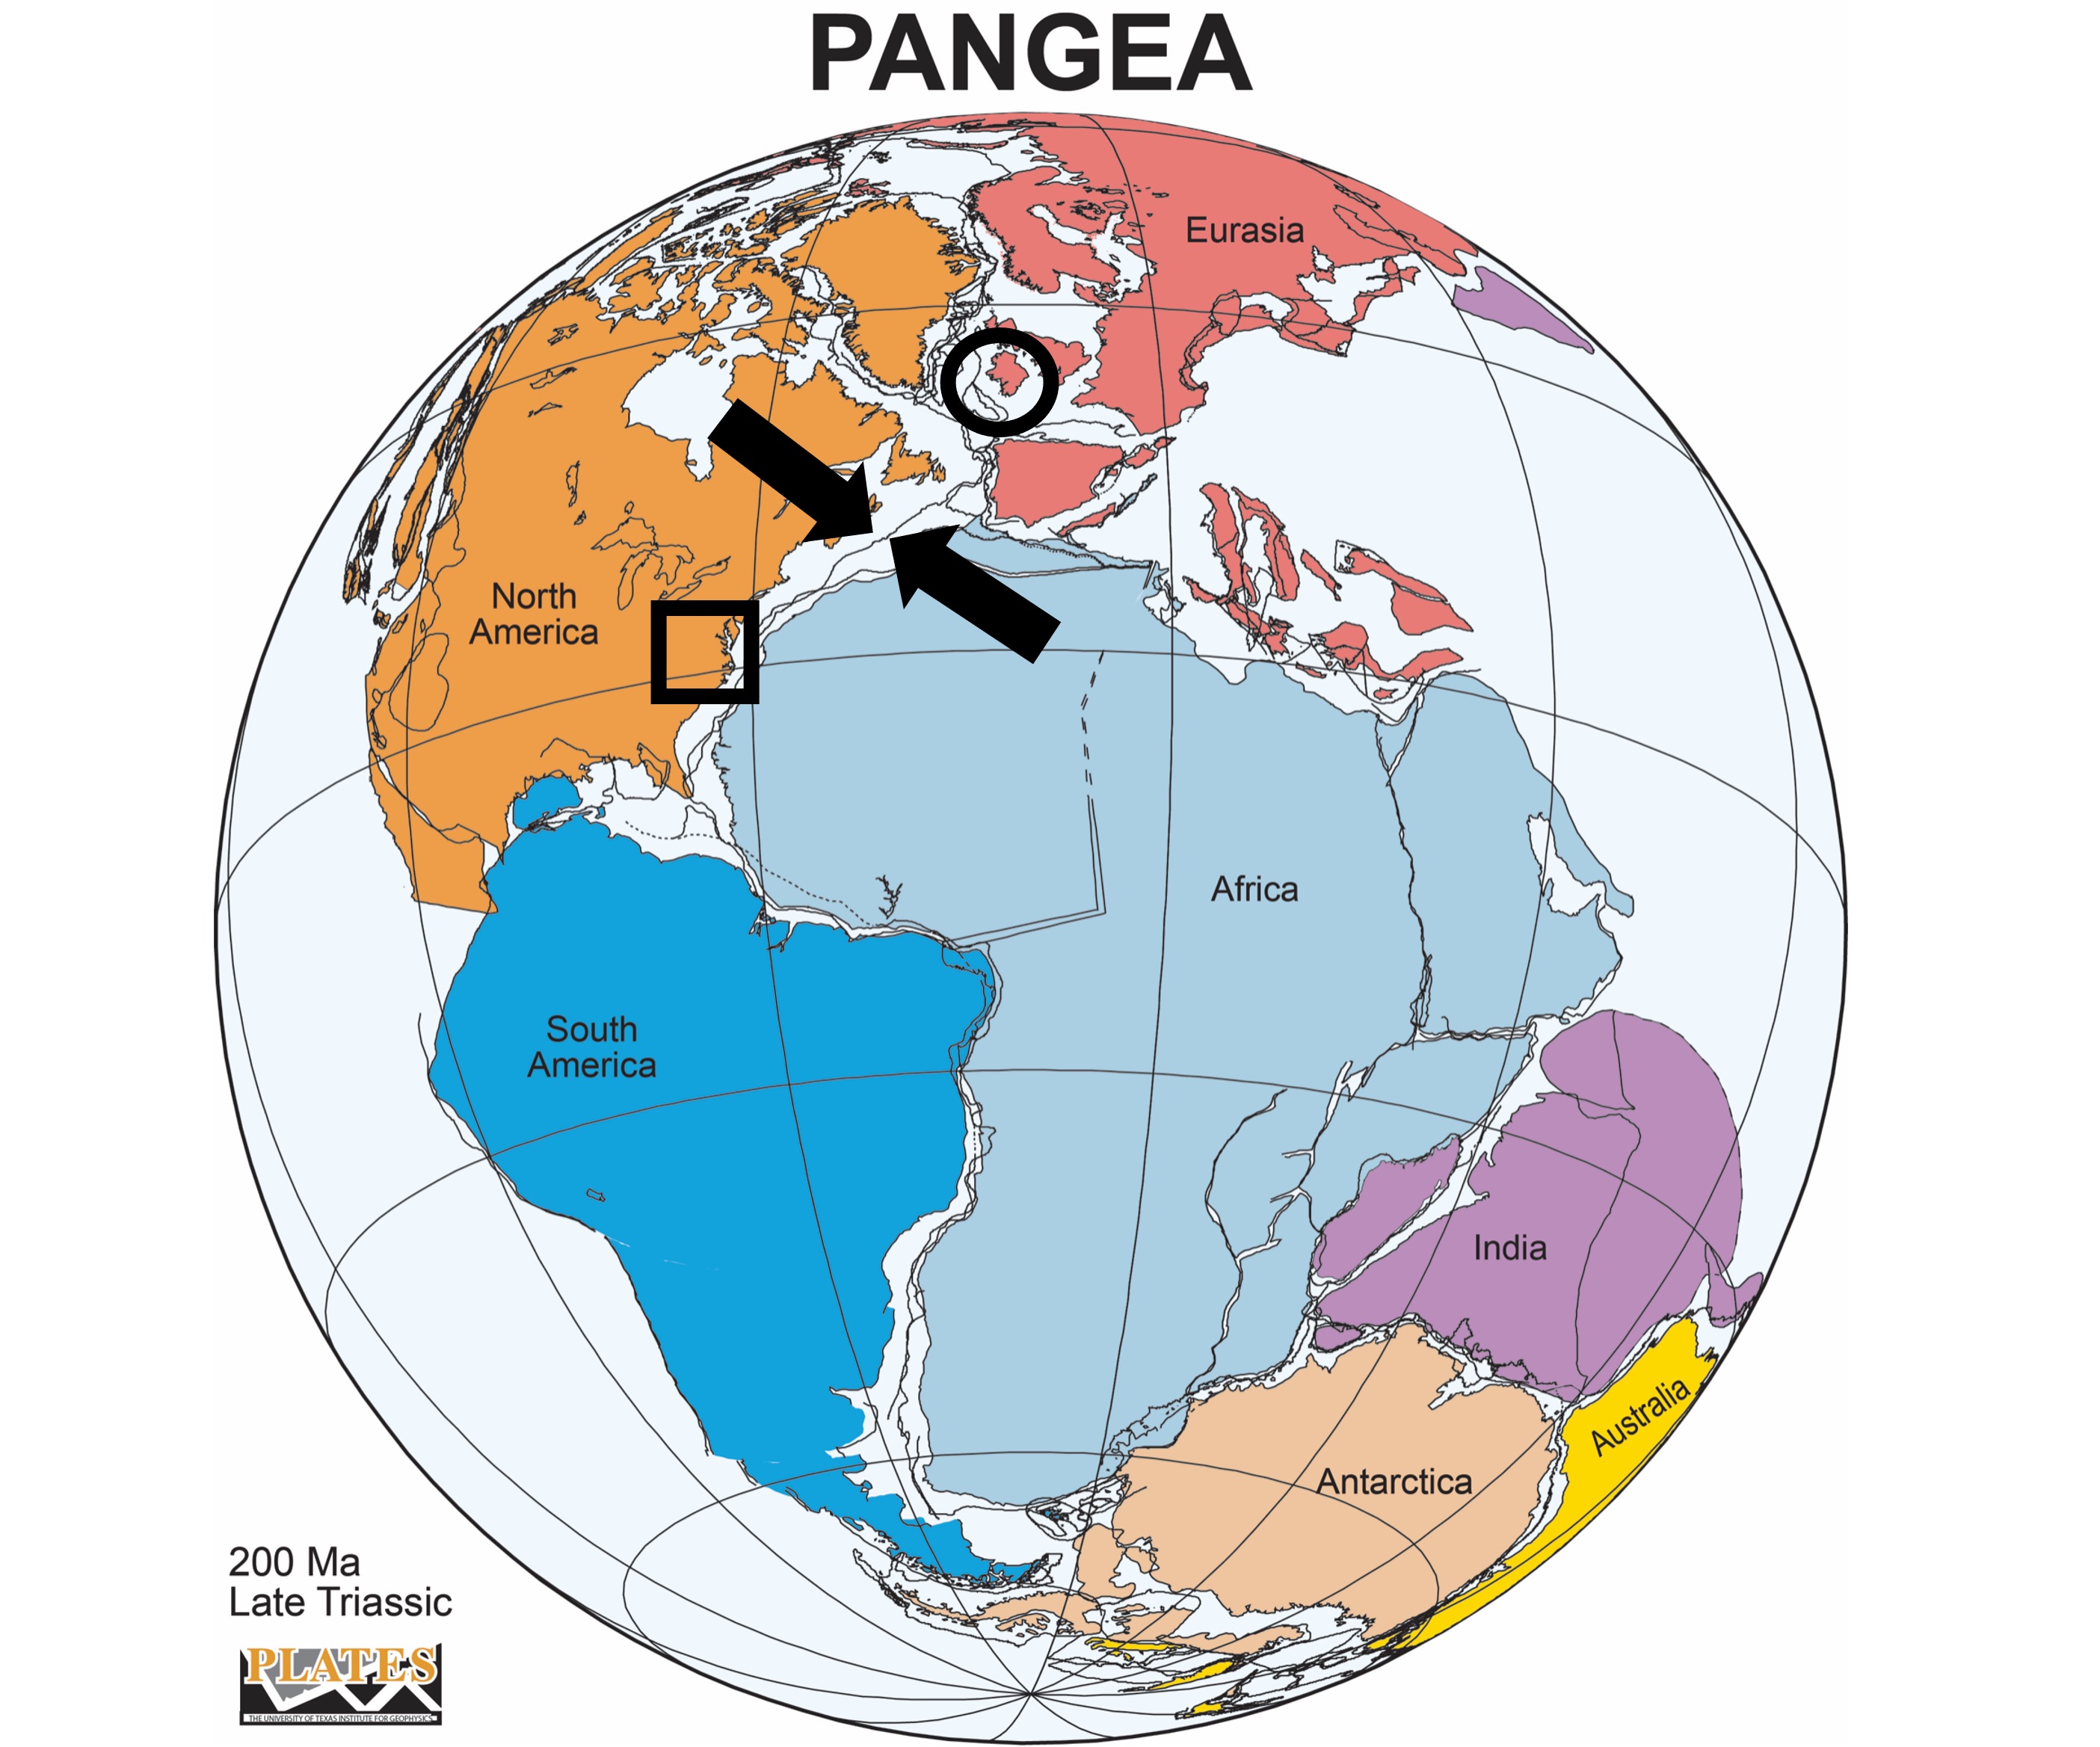
Figure 5. Reconstruction of Pangea 100 Ma after the rocks we saw at Foynes were deposited (circled area).
The section exposed at Foynes represents about 10,000 years of nearshore deposition between 320 and 300 Ma. When we put this together with the rocks we saw at Loch Gur, we see a classic coarsening-upward sequence.
These can be short or long and be caused by many processes: for example, a single sediment source can be rising and dumping larger grains, which cannot travel as far as mud; however, this is a much slower process than the 10,000 years represented in this exposure. It is also possible for several sources (e.g. different mountains in the area) to contribute sediment at different times as they erode. Sea level can fluctuate, changing the potential energy of transporting streams, but this is also a slow process; for example, sea level fluctuations within a ten-thousand year interval wouldn’t be more than a few meters. It is also possible that, as mountains erode, different rocks are exposed and contribute to the sediment load.
I favor the turbidite model with this caveat: Sandy event beds, especially thin ones as we see here, can be deposited in relatively shallow water where sediment input is high and produce gravity flows generated by waves or earthquakes. This model would allow the relatively rapid change in environment, to one more like the delta seen on the upper right of Fig. 4.
One fact is indisputable, however, over millions of years this location evolved from quiet water, where calcium carbonate (primarily from the shells of marine plants and animals) collected, to a deltaic environment with large volumes of terrigenous input.
In other words, what happened in Northern Virginia (square in Fig. 5) about 500 Ma reached Ireland 200 million years later.
The sediment didn’t come from the same mountains — not that far away — but something new …
First Look at Ireland: County Limerick
Here I am on the other side of the Atlantic Ocean, seeing what the rocks say from this side of the still-expanding sea that split Pangea in two, creating North America and Europe. I have written a lot about the long-lasting collision of land masses during the Neoproterozoic and Paleozoic eras in many posts from Northern Virginia (NOVA) and surrounding areas, but only from the perspective of North America.
Jumping ahead a little, after hundreds of millions of years of tectonic stability (geologically speaking), the earth’s crust fractured about 200 million years ago and another Wilson cycle began.

Figure 1. View of Loch Gur near the city of Limerick. Such irregular, often deep, lakes are common throughout Ireland and Scotland. They are the product of extreme glaciation; thick ice sheets shaped the topography in ways unrelated to erosion caused by rain and river transport of sediment. To get to the bottom line, we have to first recognize the discontinuity between the topography and the geological history of the area.
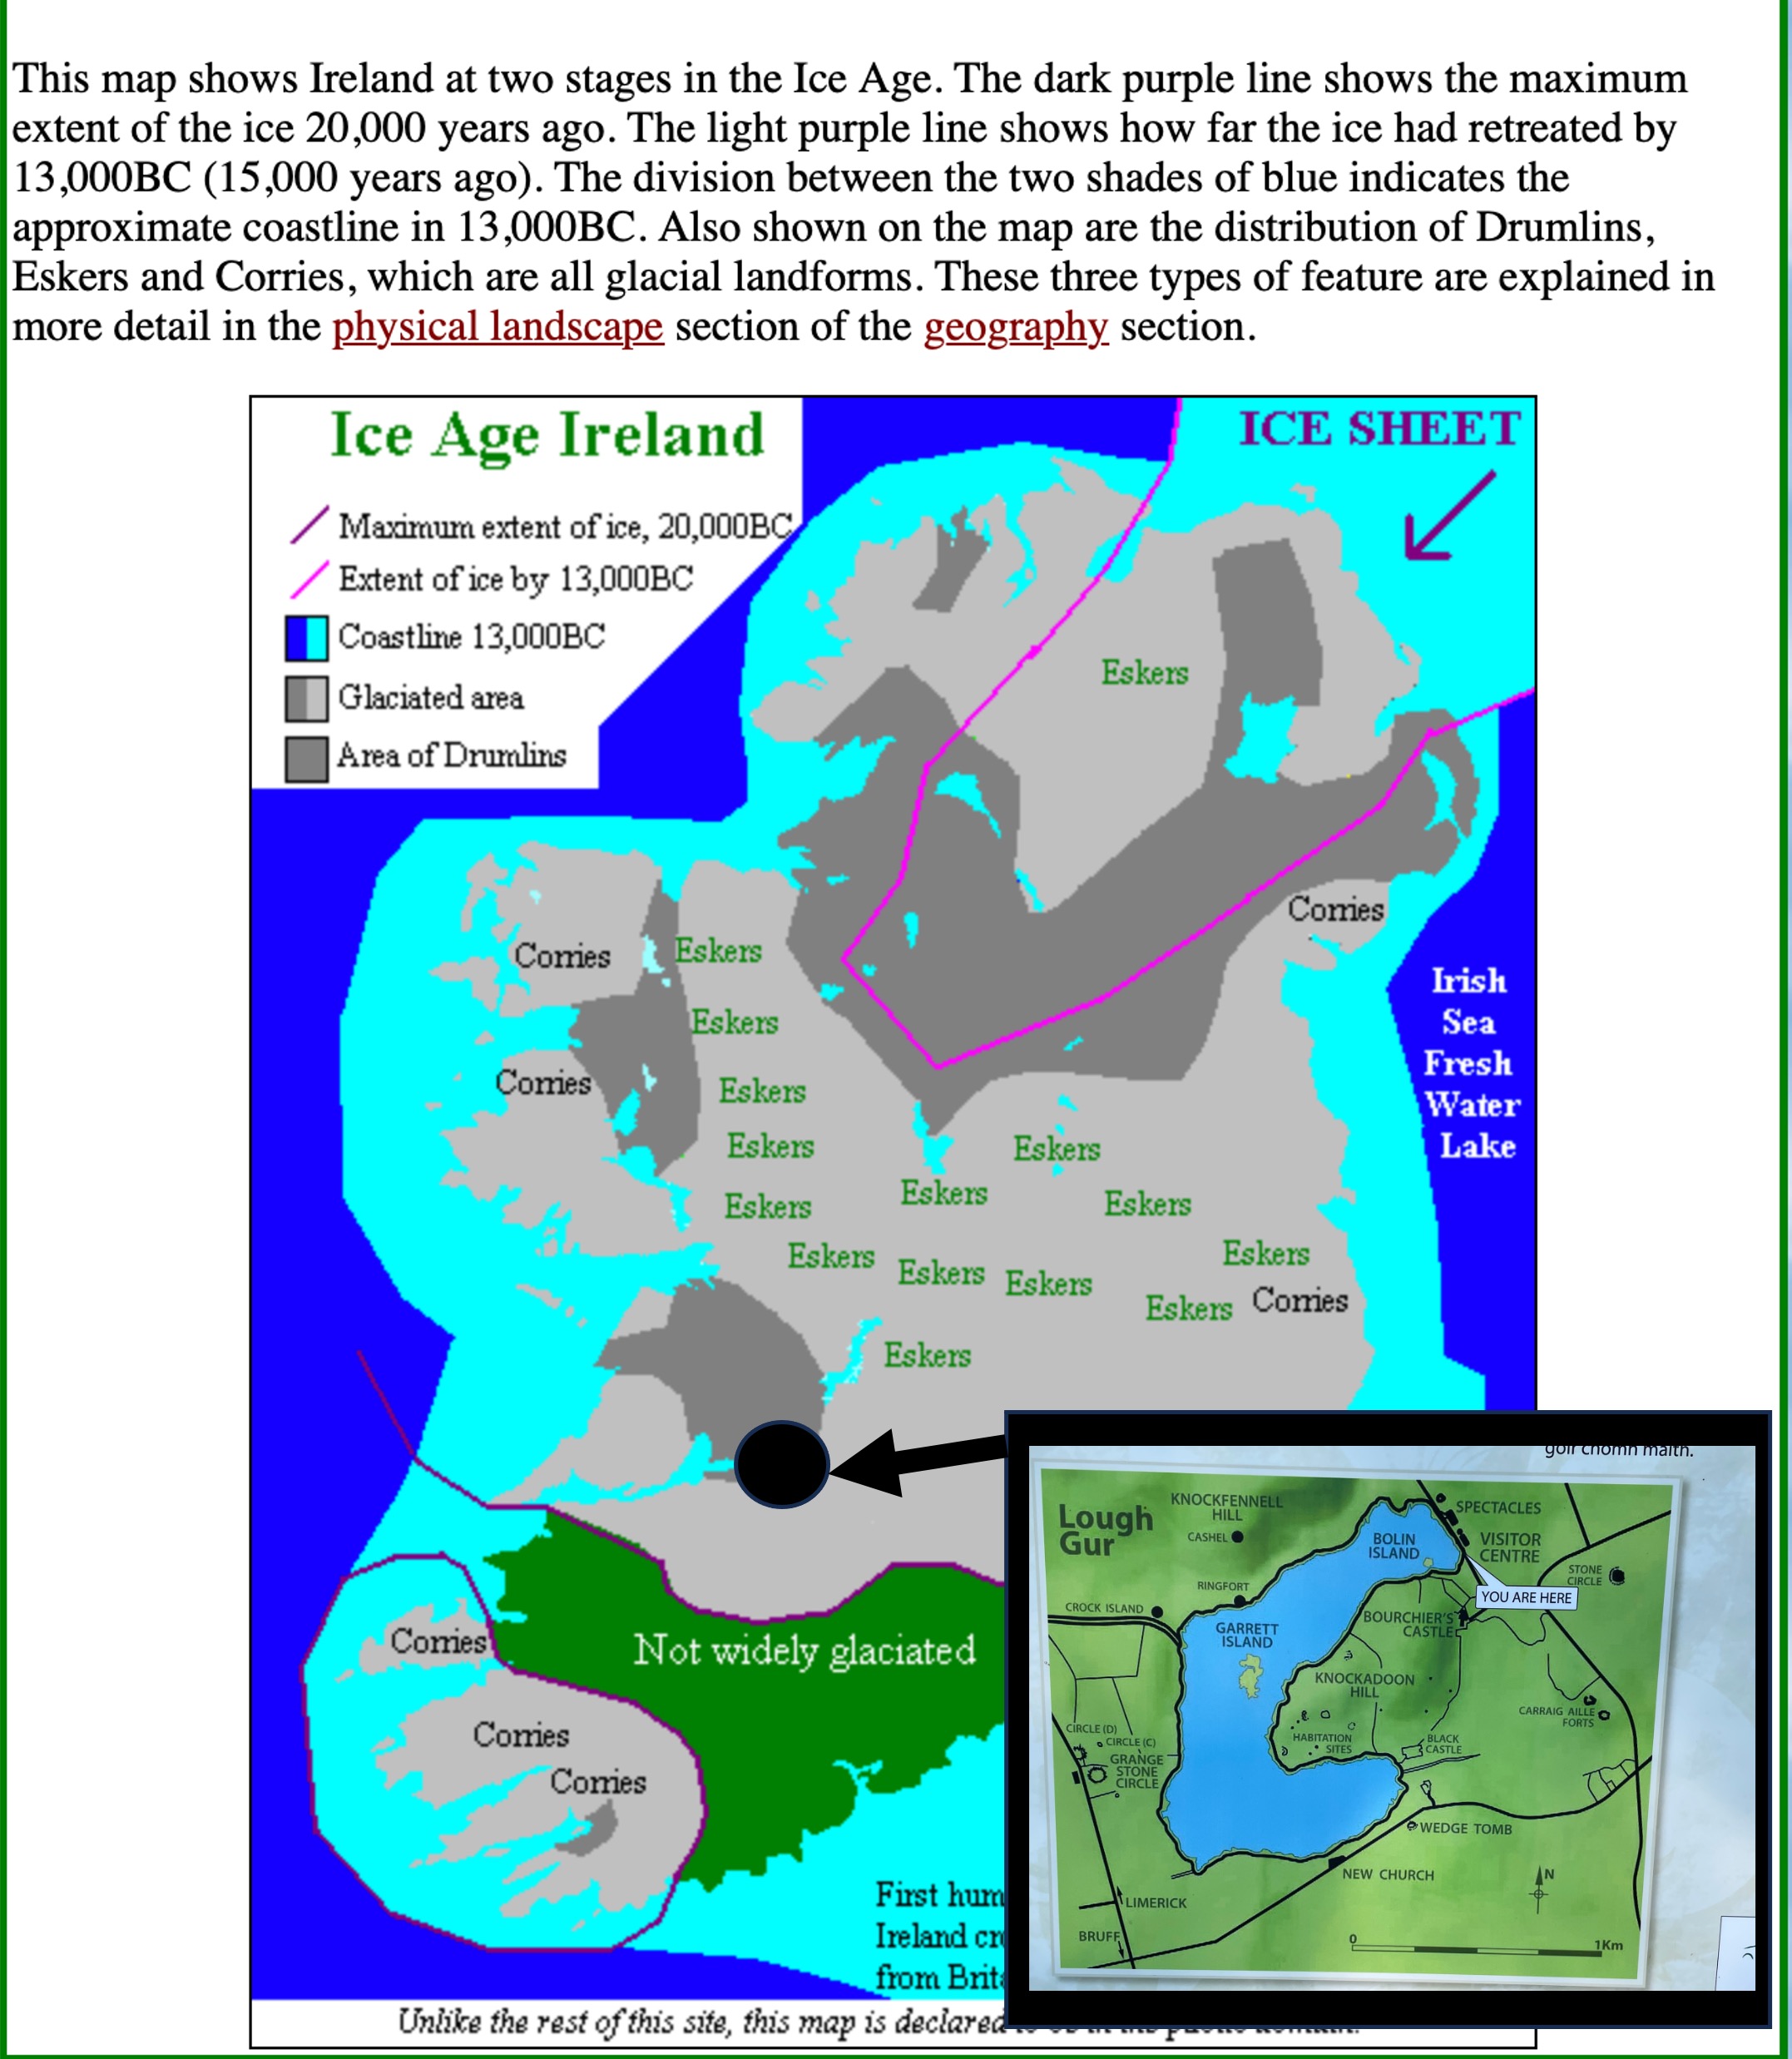
Figure 2. Ireland was almost completely covered by ice, almost a mile thick at times, which didn’t melt until about 15,000 years ago. The study area (inset map) is located SE of the end of the Shannon Estuary, in a region that contains drumlins; however, the hills seen in Fig. 1 are not unconsolidated glacial till, but instead limestone which is the bedrock of this region. Eskers are similarly unconsolidated glacial debris deposited by rivers that run under the ice, carrying away meltwater and sediment. Corries, on the other hand, are what North American geologists call cirques; these are semicircular basins carved out where glaciers form and expand outward. Loch Gur fits this geomorphologic model from its shape and the lack of depositional glacial features.
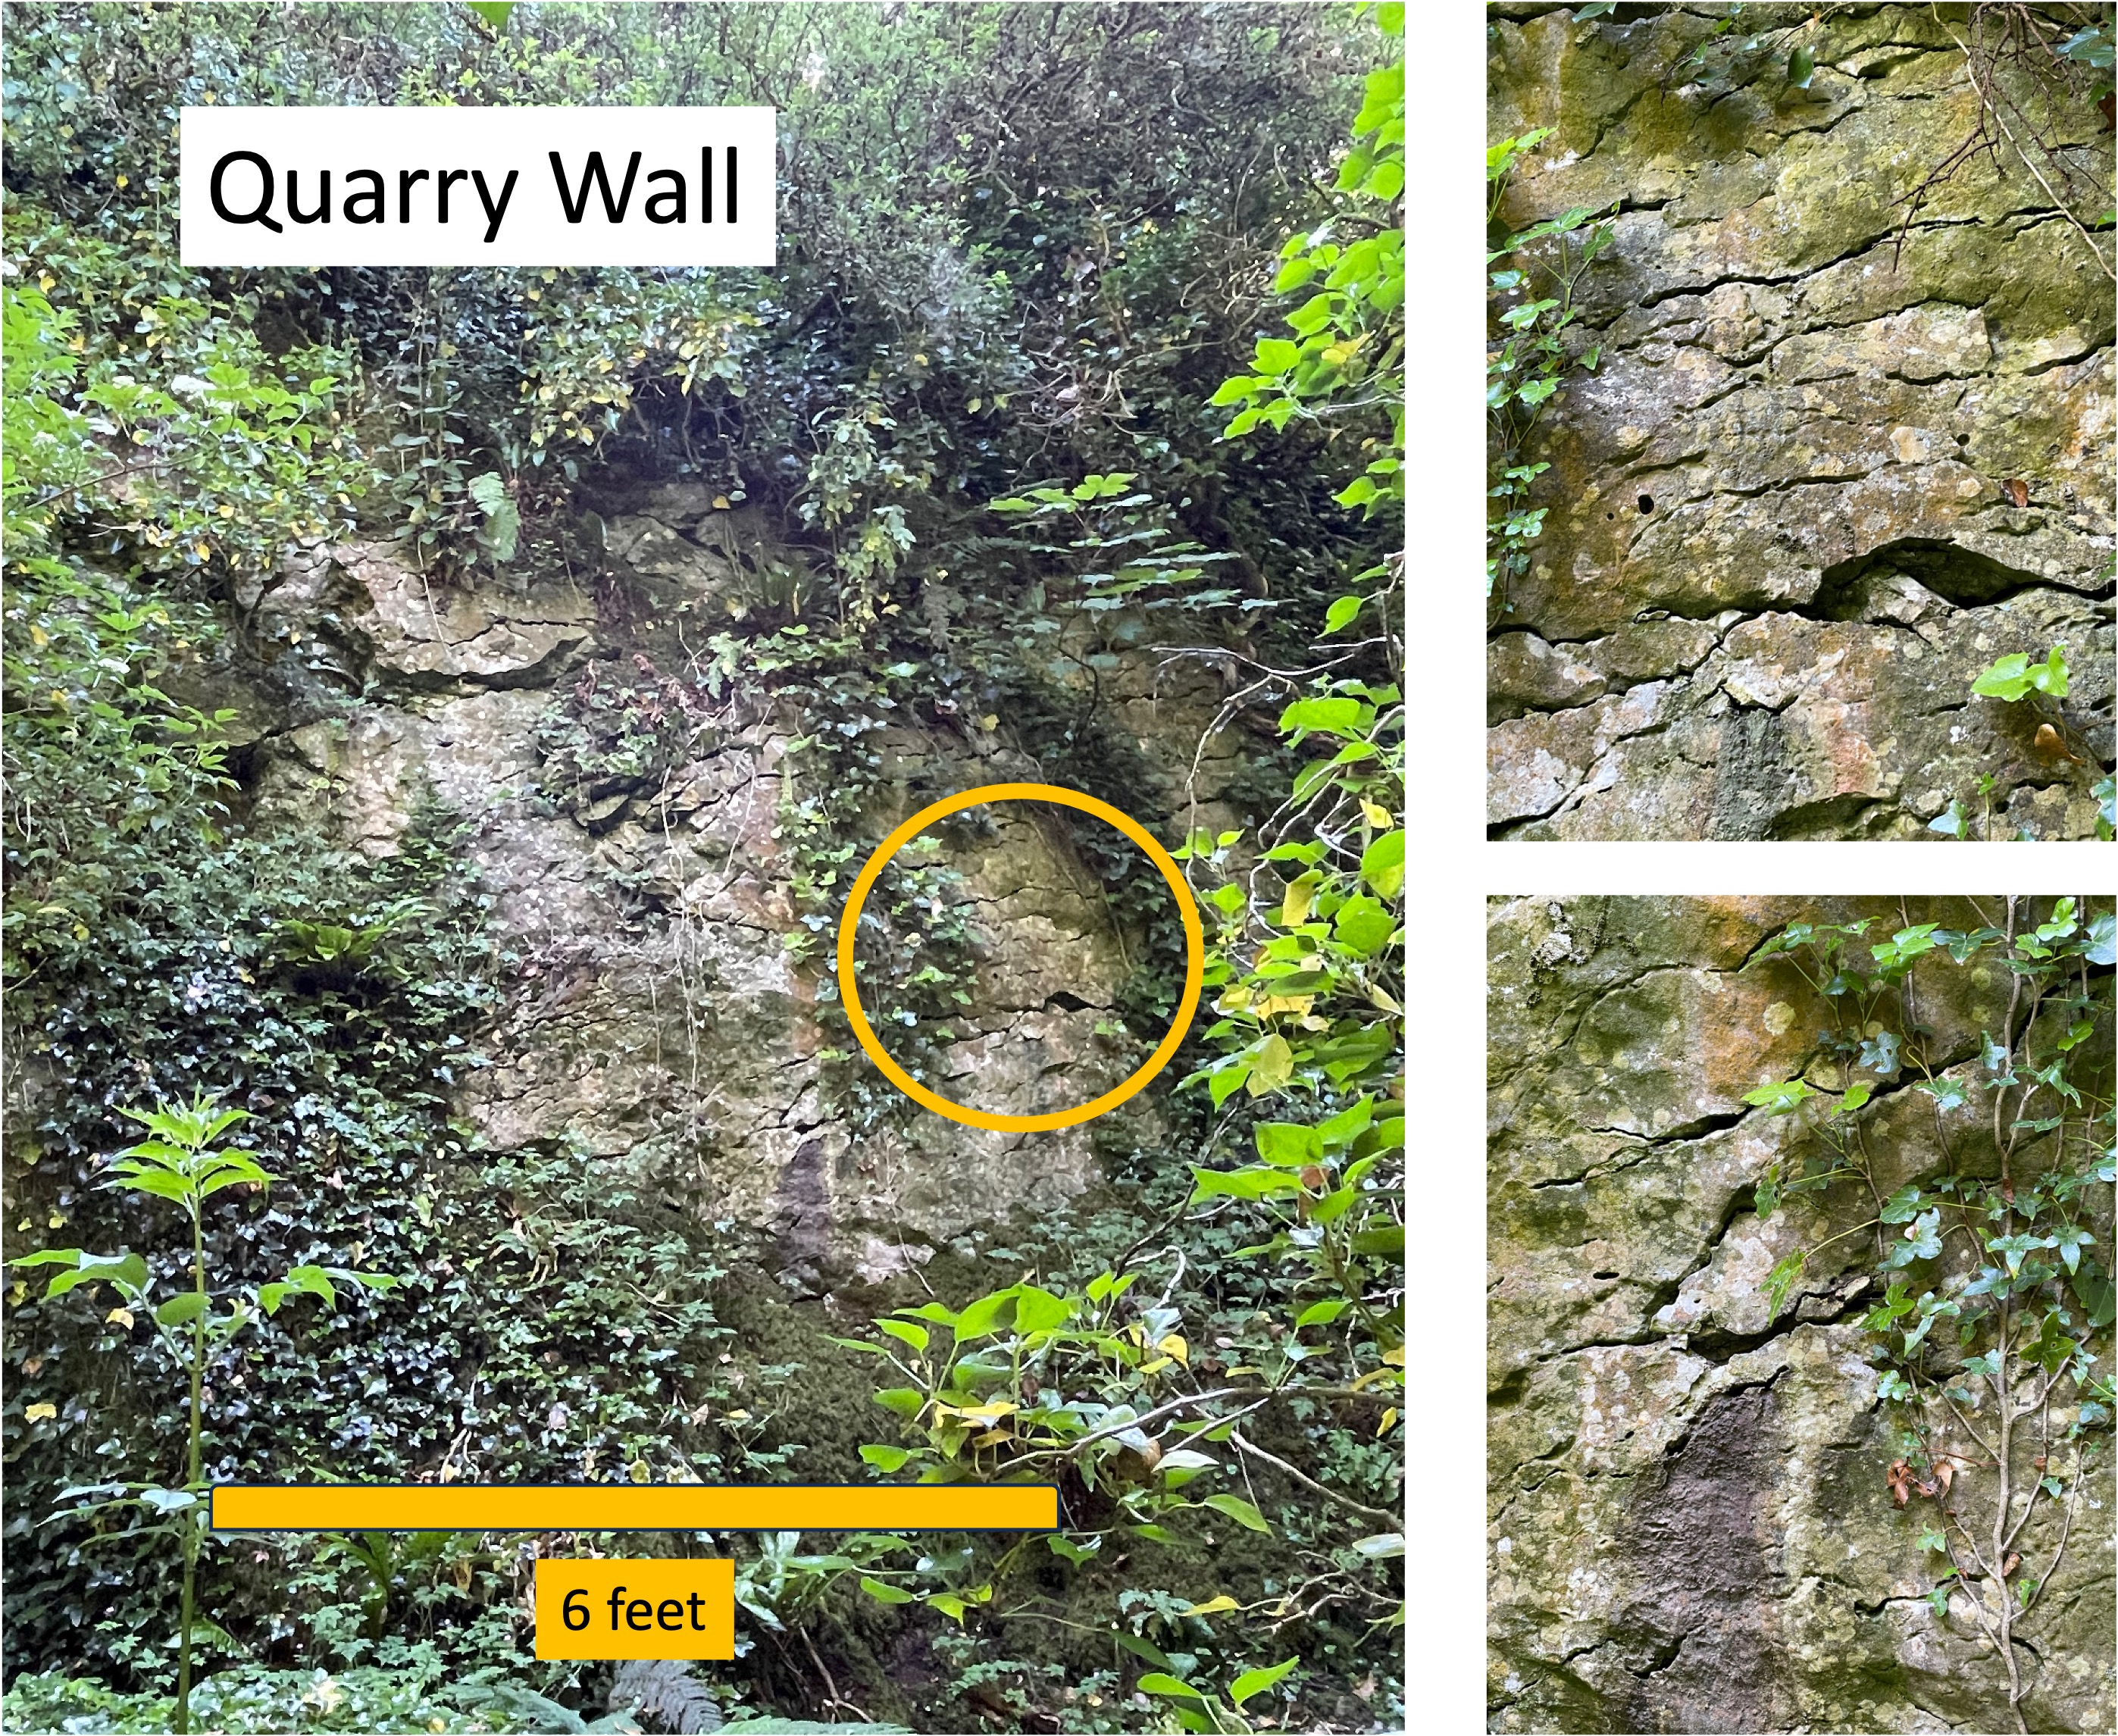
Figure 3. Images of quarry face along south shore of Loch Gur (see Fig. 2 for location), showing dissolution along fractures and bedding (inset photos). This process, if it continues, can lead to the development of karst features such as sinkholes and caves. This doesn’t seem to have occurred in the study area however.

Figure 4. Details of limestone boulders from Loch Gur. (A) Highly weathered block at the current shoreline, showing preferential weathering of dark areas. (B) Dark areas like those in Panel A were present throughout large boulders (> 4 feet across) lying loose at the foot of the quarry cliff. (C) A close-up reveals a difference in grain size between the dark and the light areas. The dark zones may be concentrations of contaminants (e.g., clay) or the product of partial recrystallization with contamination by ground water after deposition. Comparing (B) to (A) suggests that the dark areas chemically weather faster when continuously exposed to water (panel A was beneath the water line until recently). I think (microscopic analysis would confirm this) that the dark splotches contain more clay, a mineral group that weathers faster than most other minerals. The dissolution seen in Fig. 3 may be a completely different process, however; chemical dissolution accelerates in limestone where rainwater is concentrated along fractures (as opposed to clay weathering on exposed surfaces, as suggested by this figure). In summary, I think these limestones were deposited in a shallow-water area with a high inflow of clay minerals, which migrated during diagenesis to form the dark splotches. These carbonate rocks weren’t buried deeply enough to melt and become marble, a metamorphic process that would have removed the contaminants.

Figure 5. One of the many hills present within the study area. This one is capped by a prehistoric site encircled by a stone wall. The limestone to build the original wall and houses was quarried from the hill, which produced the low cliff seen in this image. Other exposures were exploited further down the slope to expand the settlement.

Figure 6. Prehistoric quarry showing thick bedding of the upper layer of sandstone and the thinner bedding of the lower layer (seen in the foreground, partly covered by grass). Any fossils contained within the limestone were destroyed during burial; however, the lack of any macrofossils from these rocks, which were deposited between about 360 and 320 my ago, suggests that they weren’t in the most favorable of environments for shellfish.

Figure 7. Geologic map of County Limerick. The study area is encircled by a ring of Carboniferous volcanic rocks (dark blue), which suggests that there was igneous activity (associated with orogeny) between 360 and 320 my ago, on the east side of the tectonic collision zone; the outcrop pattern suggests that a magma chamber was venting through a caldera. I didn’t see any evidence of the timing of this volcanism, so it may have been into unconsolidated sediments or later, when they were lithified. The limestone we saw in Figs. 3-6 is indicated by the light-blue areas on this map. As a side note, there is a 4500 year-old stone circle (Grange Stone Circle) at the western limit of the dark blue ring; it contains large blocks of volcanic breccia that I couldn’t identify in the field, because all of the blocks comprising the prehistoric circle were weathered to the same gray color. The identification is from a detailed archaeological map of the site that I did not photograph.

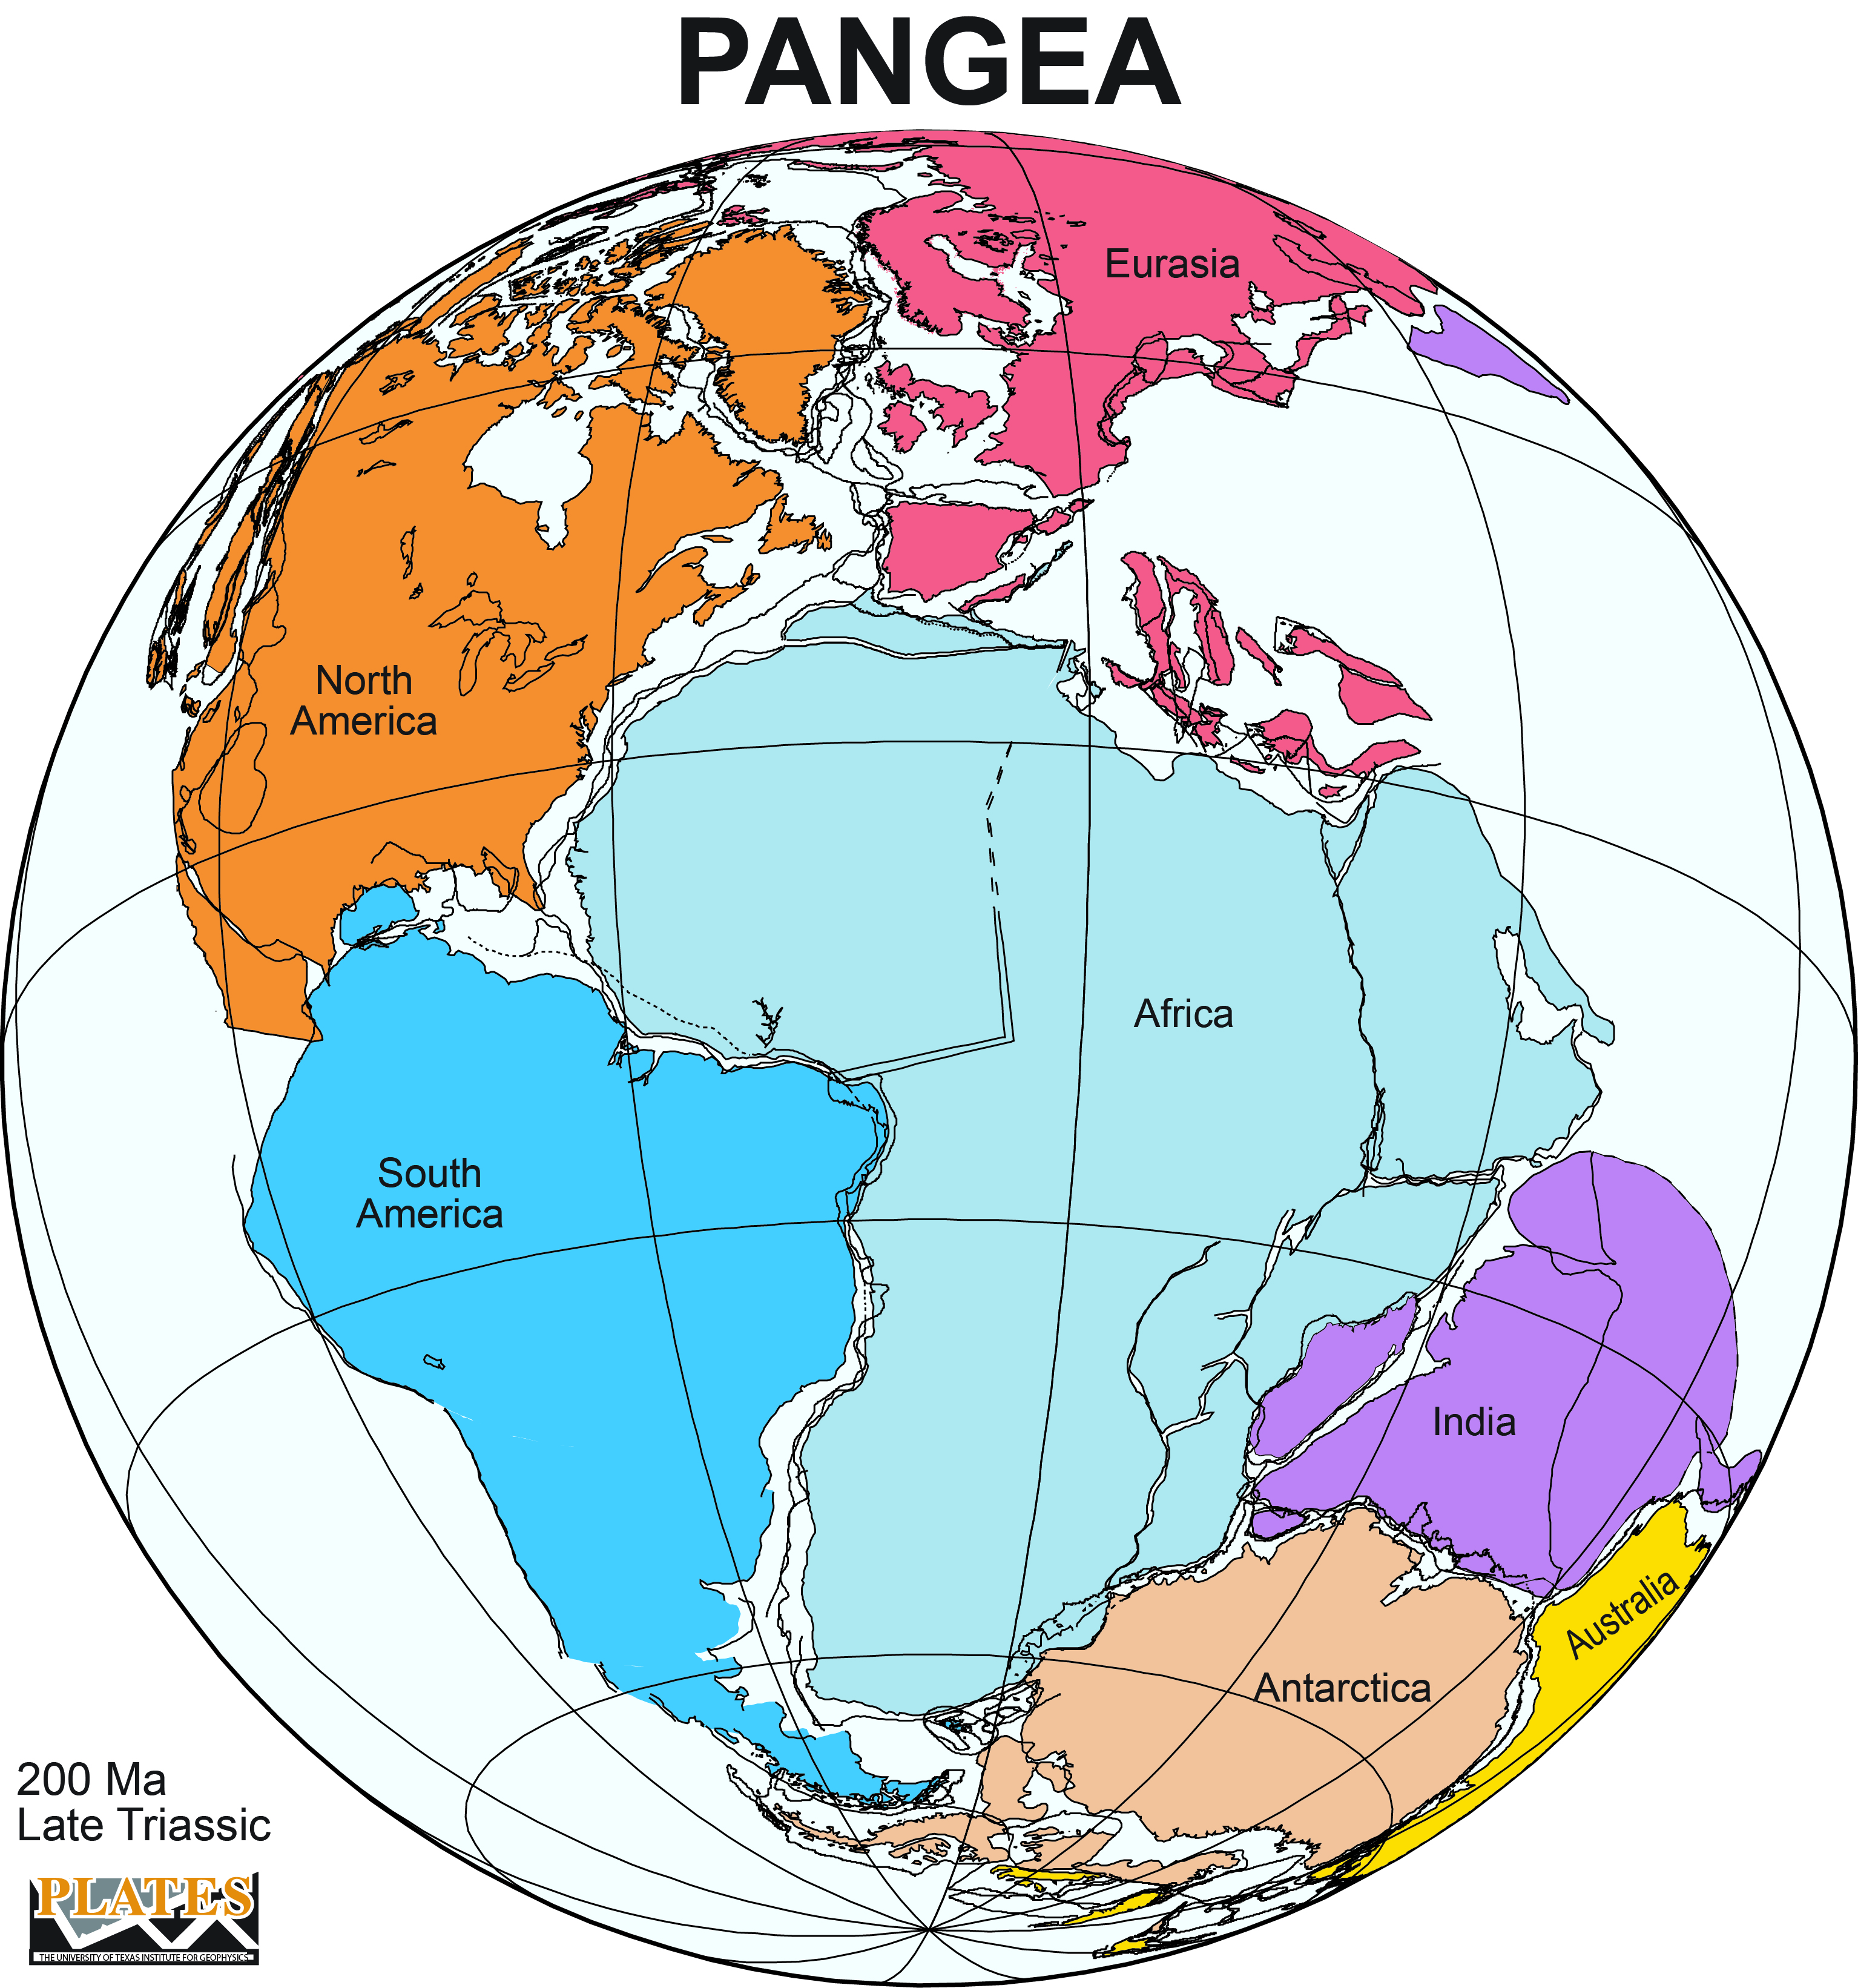
Figure 8. Reconstruction of Pangea about 200 my ago. The arrows indicate the collision of two tectonic plates. The square is where I have been reporting from NOVA; the circle is Ireland, where I am reporting now. Note that the two areas are offset by more than a thousand miles along the suture zone.
Comparison to North America. The rocks in the areas I have reported on in NOVA (square in Fig. 8) are either from the late Proterozoic eon and early Paleozoic era; or from the Triassic period, which is the time represented in Fig. 8. The Lower Carboniferous period (about 360 – 320 my)falls within a hiatus of more than 300 my in NOVA. Cambrian sediments were deposited unconformably on Proterozoic volcanics about 540 my ago there — the youngest being conglomerates exposed at Weverton Cliff.
The limestones exposed at Loch Gur were deposited in quiet water during this hiatus, which represents mountain building and subsequent erosion. The lack of evidence of this orogeny in NOVA while carbonate sediment was accumulating in Ireland makes sense because the latter was far removed from this Neoproterozoic/Paleozoic mountain range.
However, when we look further to the west and north from NOVA, we find thick layers of shale, sandstone, limestone and even coal beds; the states of Pennsylvania and New York reveal this orogeny in a continuous sedimentary sequence that contains rocks like those we’ve seen thus far in Ireland. I have reported on those in a previous post.
It is the nature of orogeny that crustal upheavals don’t leave direct evidence because high mountains are eroded by water, and produce a blanket of sediments in an immutable process.
We’ll see what else the Irish rocks have to say about that …
The View from Maryland

Figure 1. This post describes the geology along a short hike along the Appalachian trail (see Fig. 2) to the top of Weverton Cliff, in Maryland. This photo is looking west from the top, towards Harpers Ferry, West Virginia . The Potomac River runs below Weverton Cliff and through the pass in the distance.
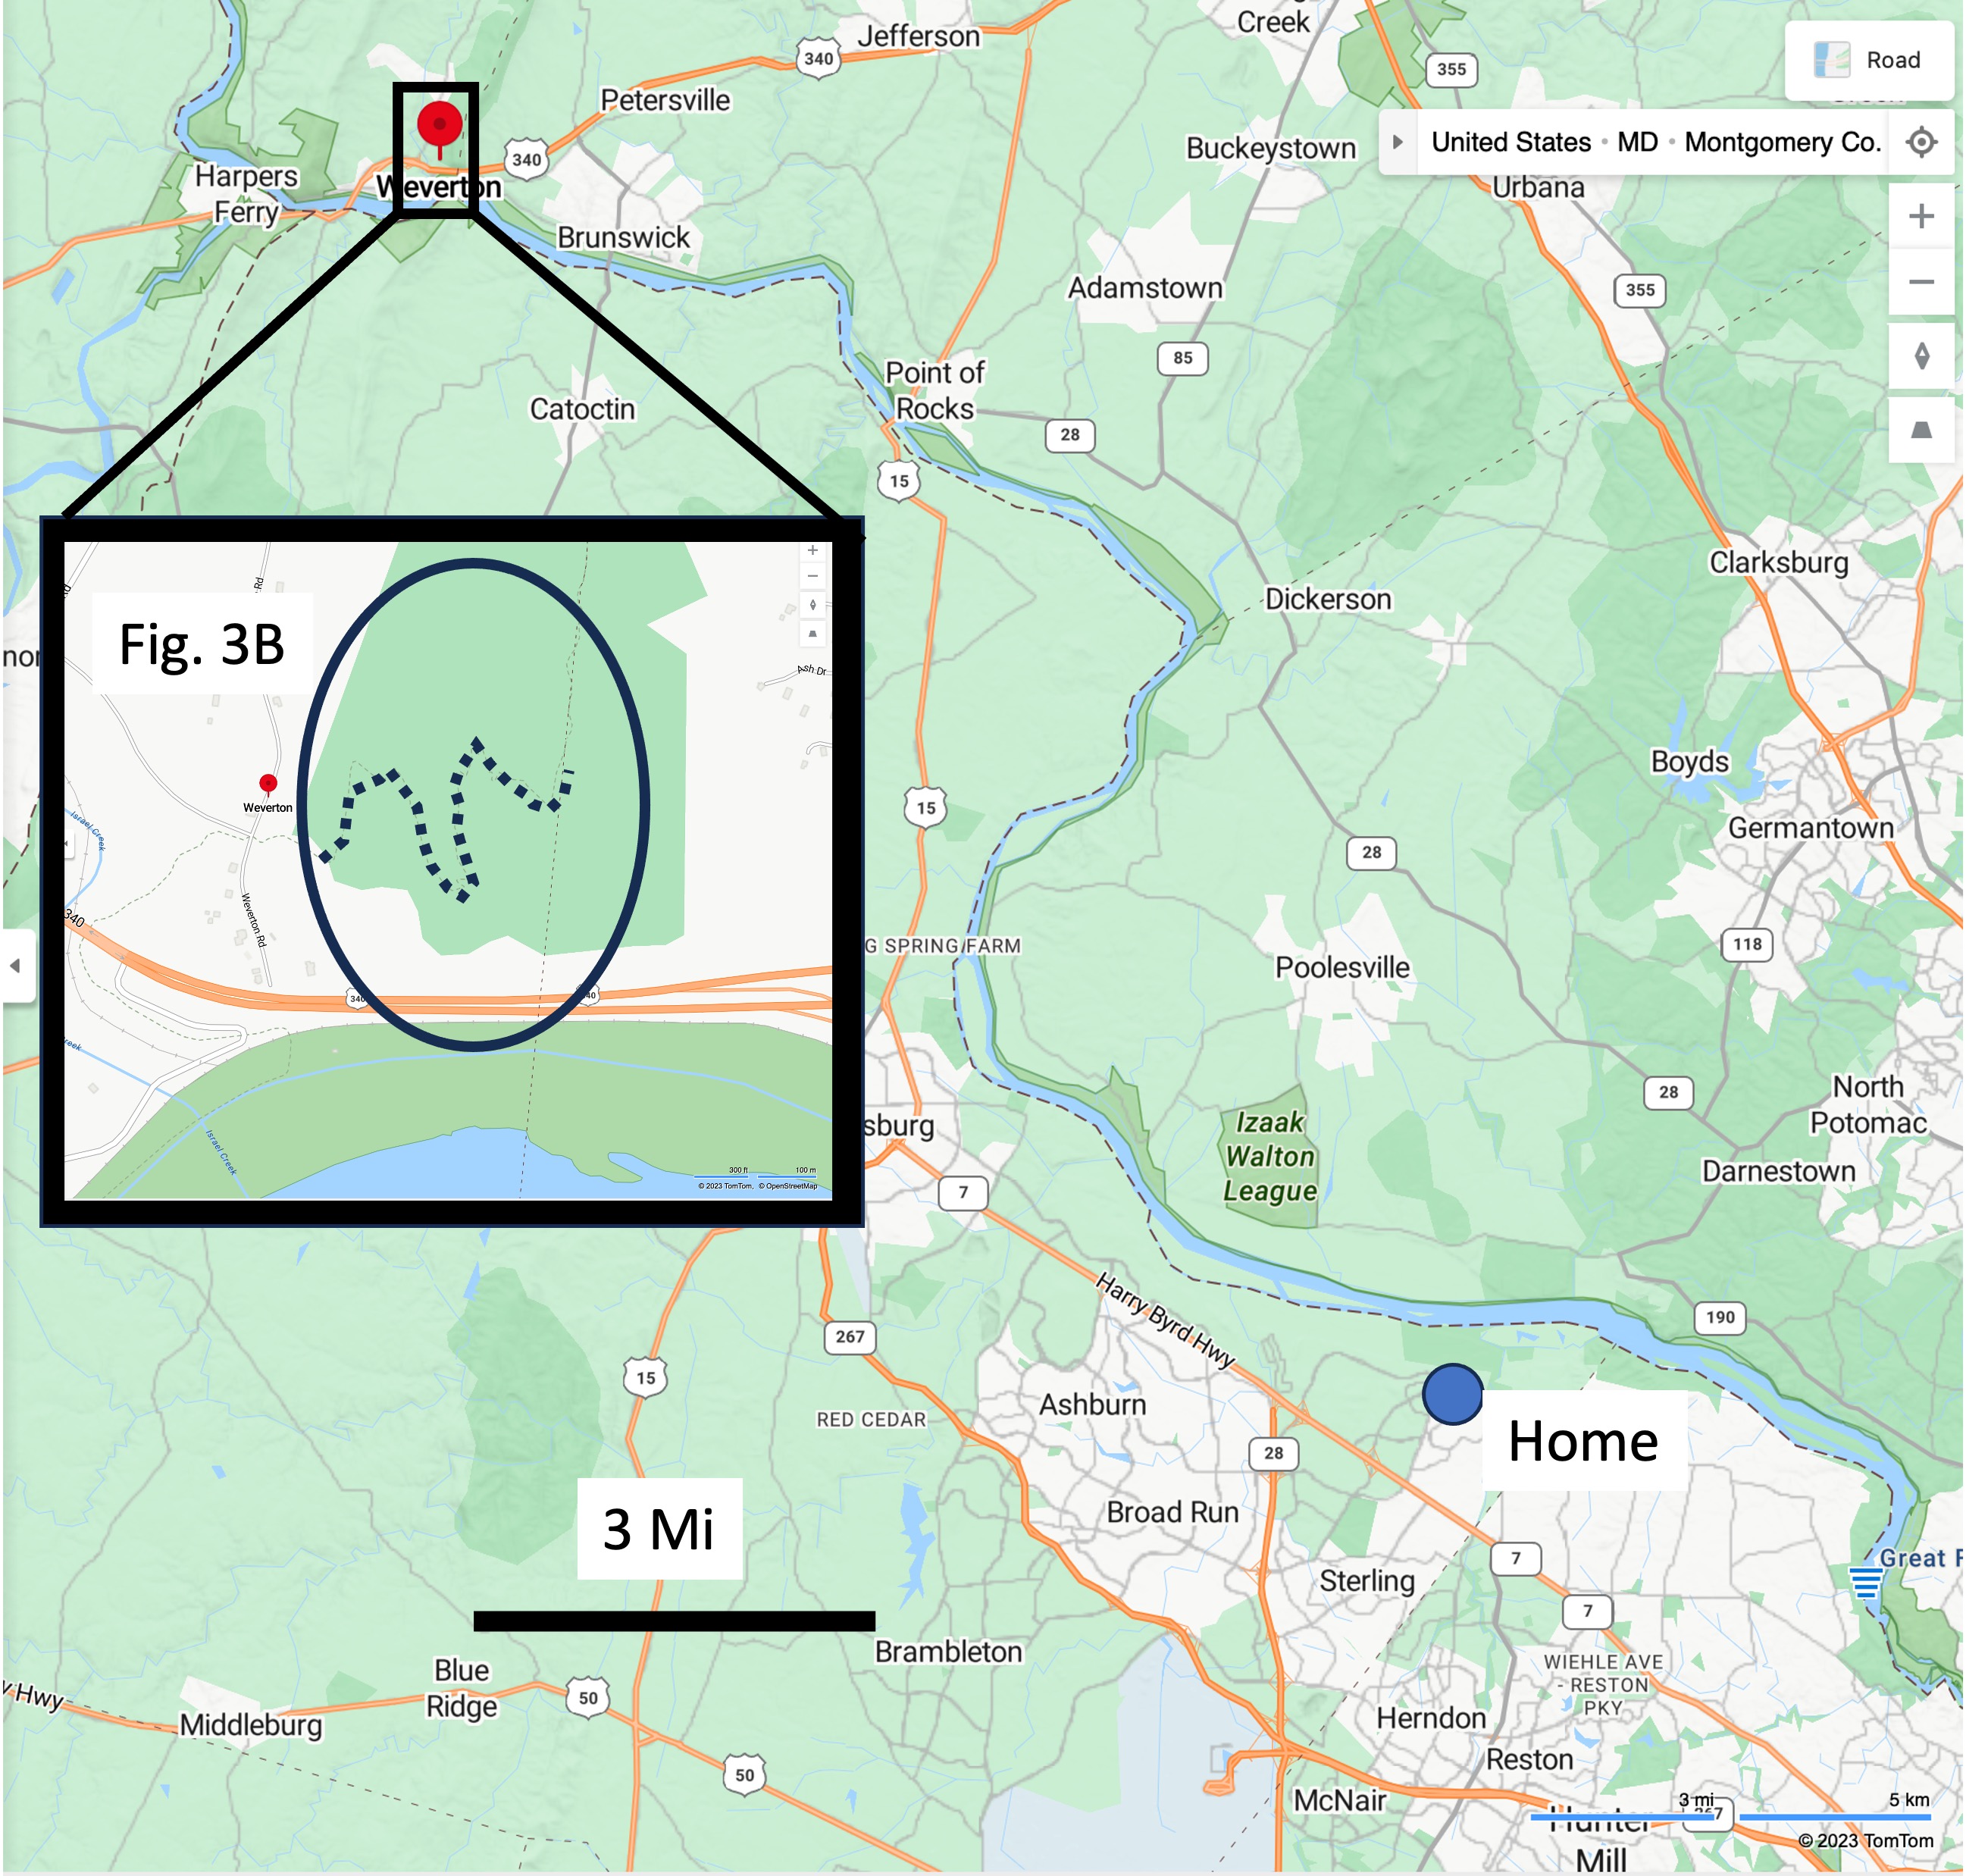
Figure 2. The study area is located on the Maryland side of the Potomac River near the border with West Virginia (inset map), only a few miles as the crow flies from my home in Sterling. The trail climbs the ridge through a series of switchbacks (dotted line in inset map).

Figure 3. Geologic maps of the study area. (A) This larger scale image shows the structural trend common to this part of the Appalachian orogenic belt. The green colors are Paleozoic metasedimentary rocks, which hold up better to erosion than Precambrian metavolcanic rocks (pink shades). (B) The Appalachian trail (dotted line) traverses Proterozoic rocks before crossing a normal fault (dashed line), and encountering Cambrian schist and metasedimentary rocks (Ch and Cw). The rocks are oriented with approximate strike (long line of T-shape at upper center) of 30 degrees east of north; and a dip (short line segment) to the SE of about 45 degrees.
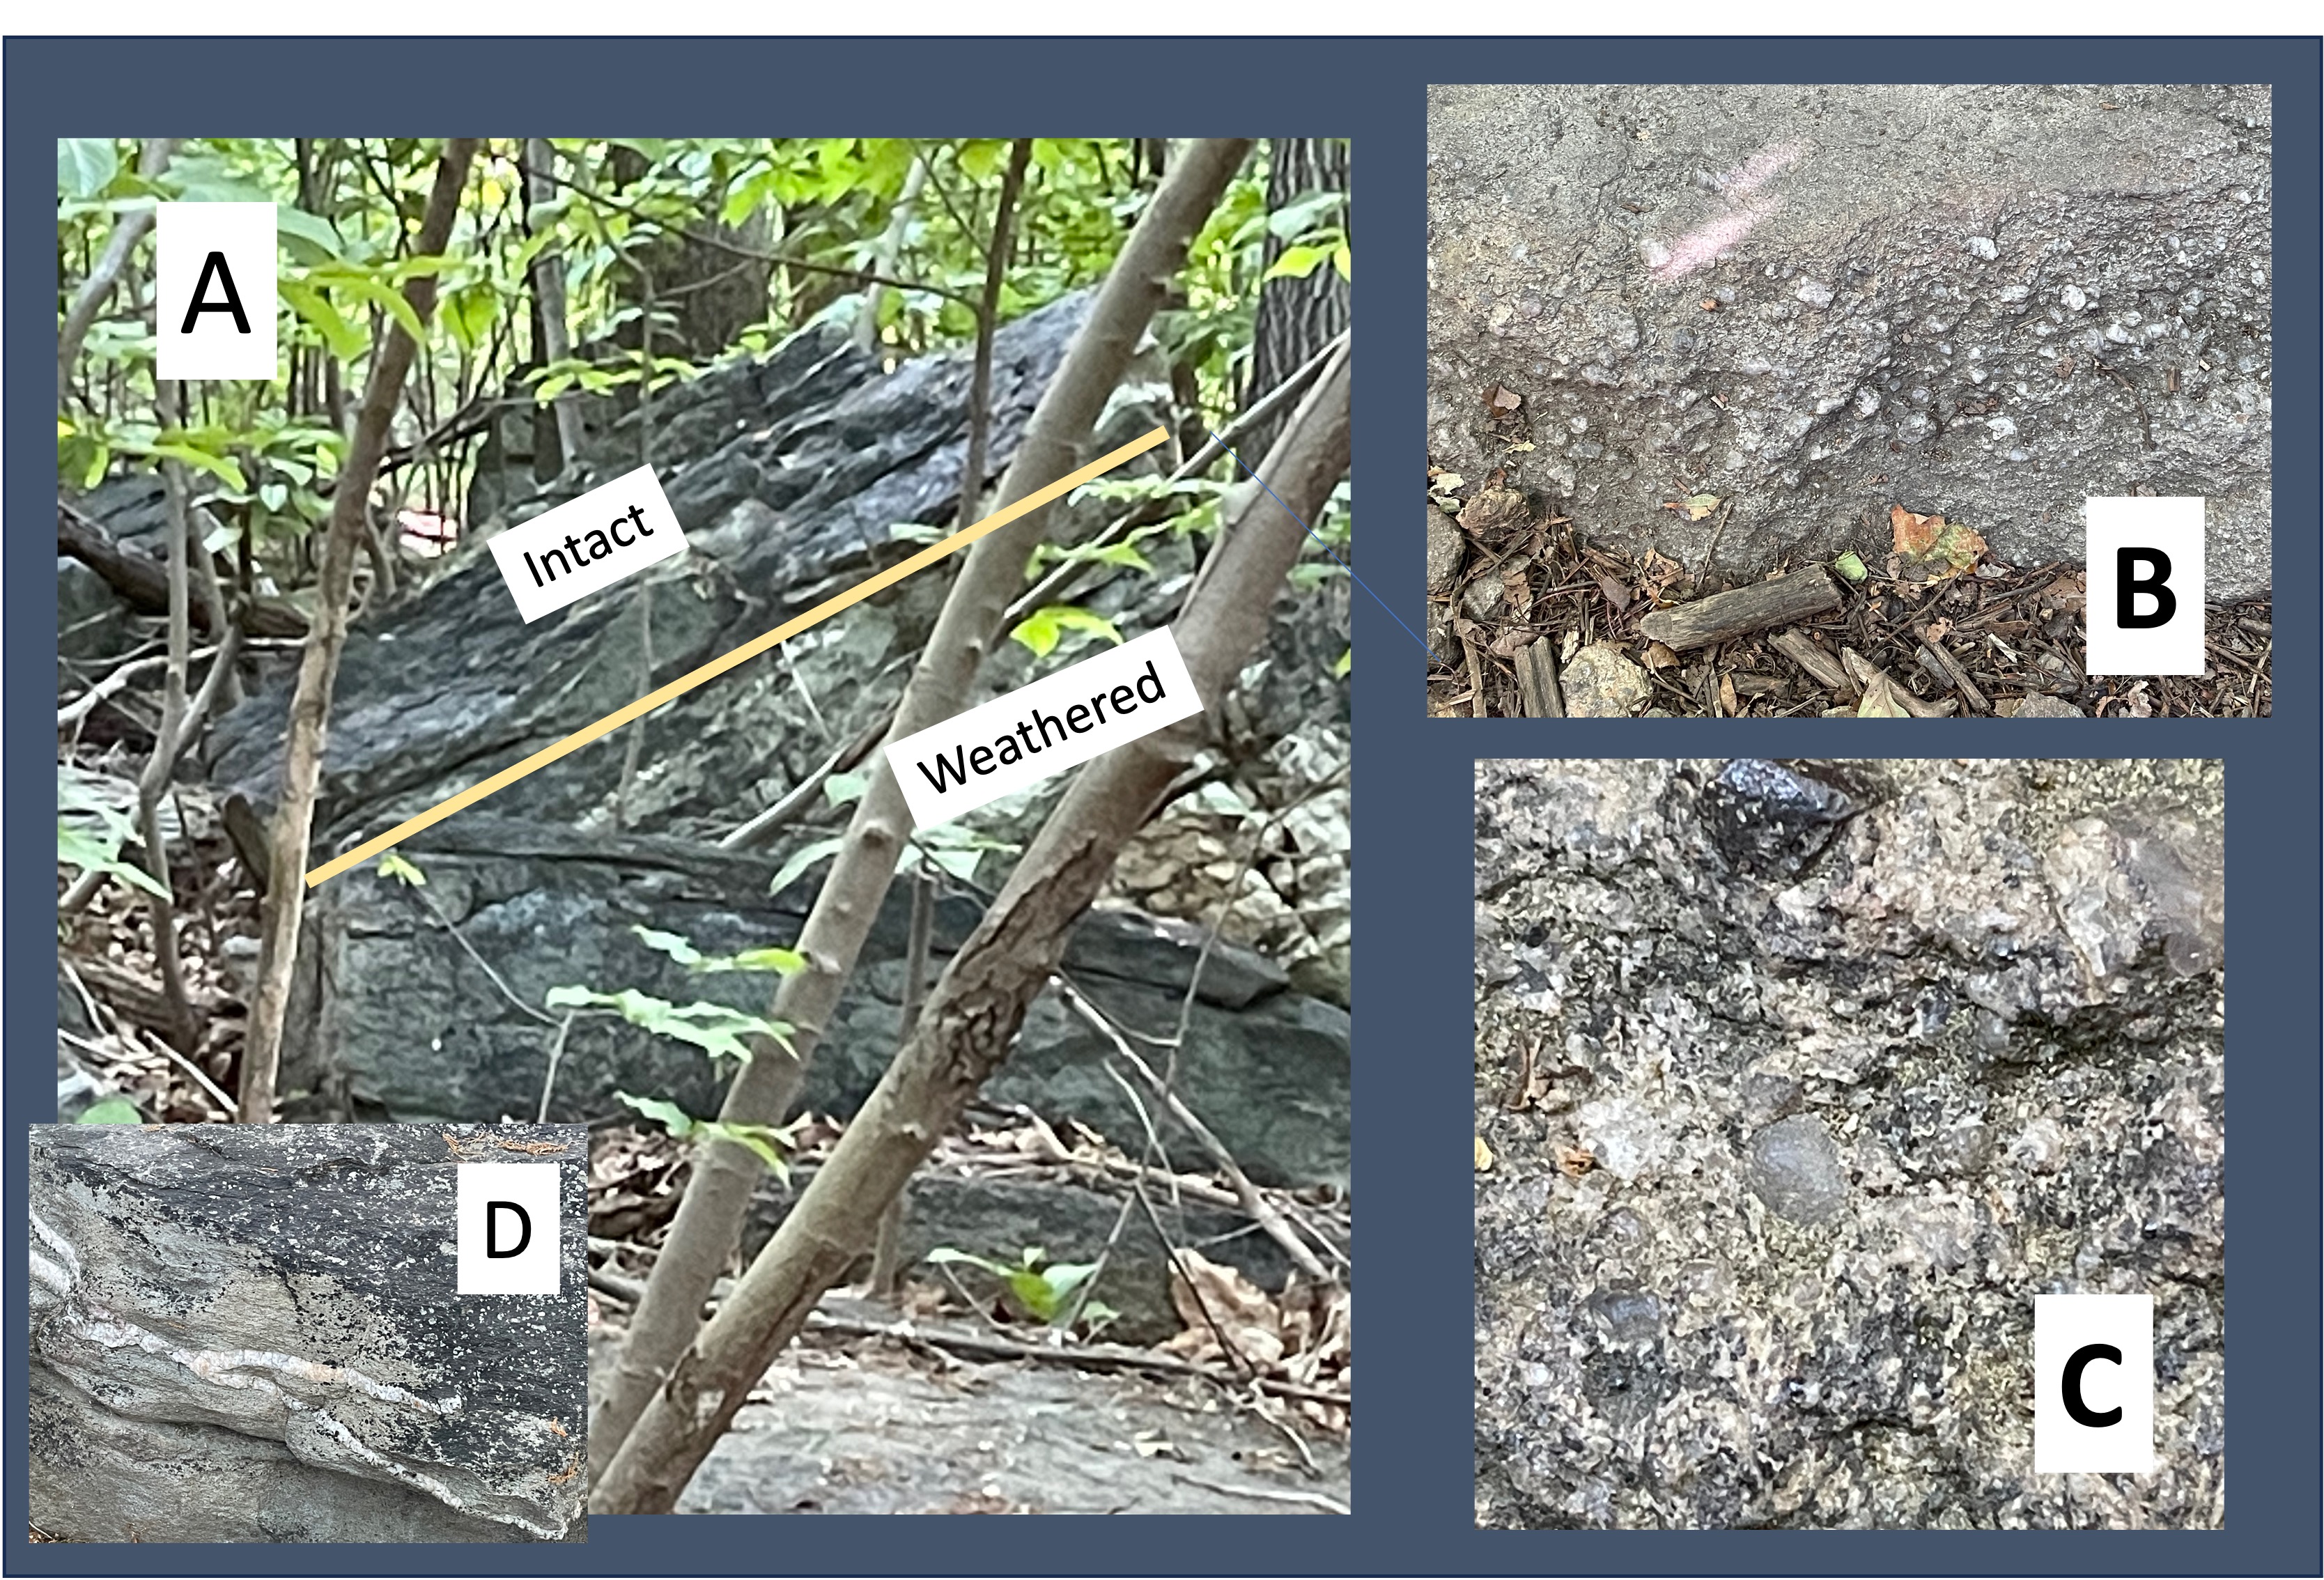
Figure 4. Images of the Harpers Formation taken at site 1 (see Fig. 3B for location). (A) Outcrop showing highly weathered schist at the bottom of the tilted section, similar to what we saw at Bull Run Nature Preserve. The rocks above are relatively intact but show fissility typical of metamorphosed sediments with a relatively high clay content. (B) Close-up of a loose boulder of conglomerate. Note the concentration of larger particles within a layer, with finer grains above and below. This suggests episodic high-flow transport events that transported gravel (there weren’t any land plants to reduce erosion 538 million years ago, when these sediments were originally deposited). (C) Image at 5X magnification of some of the larger grains: the gray is quartz; the irregularly colored clasts are rock fragments; and the dark one at the top may be a metamorphic mineral like garnet. (D) Light-colored minerals like quartz fill fractures and joints throughout the study area, especially within the Harpers Formation. This implies that the sediments had been buried and lithified, then uplifted; jointing occurs during stress relief, like mud cracks; then magma intruded the area and injected liquid (not thick magma) into every available crack.

Figure 5. Photos of Weverton Formation at Site 2 (see Fig. 3B for location): (A) The total exposed section is at least 100 feet thick, comprising mostly sandstone and siltstone with thin layers of shale (identified by being eroded to look like soil). Note the steep dip of the bedding. (B) Conglomerate similar to the Harpers Formation, but with a larger range of sizes, and less matrix. (C) Close-up (5X magnification) of the sandy matrix; the poorly sorted nature of the sediment is evident in the finer sizes, including silt and sand, as well as (originally) clay; this range of particle sizes produced the irregular surface seen in this photo. (D) The exposure at Site 3 shows original bedding warped during burial and deformation; the sediment layers were squeezed like a sponge and produced the lenticular bedding seen in this image.

Figure 6. The bed of the Potomac River reveals resistant layers, which produce the rocky sections seen in this photo taken from Site 3 (top of Weverton cliff).
We saw the Harpers and Weverton Formations before but this is the best exposure so far, which isn’t surprising because the Weverton Formation was named after this location. Let’s see what this field trip adds to what we already learned about the geologic history of the tri-state area (VA-WV-MD).
The proto-North American and Europe plates were moving towards each other during the Proterozoic (~2.5 by to 540 my ago), closing the Iapetus Ocean and smashing any intervening islands onto their margins. Metavolcanic rocks (pink in Fig. 3) were produced during this time, spewed into submarine trenches or along continental margins. Vast quantities of clay were deposited in shallow seas as the continents converged, deposited as the Harpers Formation. The conglomerate of the upper Harpers and Weverton Formations were deposited from rapidly rising mountains and deposited on top of these much older rocks, which may have been exposed to erosion during the millions of years this process required. More sediments were deposited on top of these, burying them as much as ten miles, as the continents continued to collide.
Then … silence … the resulting mountain range stopped rising and began to erode; the sediments had become rock and they fractured, producing joints like we see in Fig. 4D. However, the magma produced by this titanic collision hadn’t cooled, and the joints were filled with hot fluids that flowed into every nook and cranny.
The transition from a collisional margin to an extensional one lasted from 538 my to 200 my ago (that’s 338 my!), at which time Pangea was torn apart by irresistible mantle convection. That is when these rocks were tilted along a series of faults like the Bull Run fault, as they slid into grabens produced by the stretching crust.
My next post will be from Ireland where we’ll see what the rocks tell us from the other side of the still-widening Atlantic Ocean …

Recent Comments