Australian Capital Territory: Sedimentology Homework
Introduction
I’m taking a break to examine the rocks exposed by the recent excavation of State Circle, which obviously hadn’t occurred when the documentation I used for our geological investigation of the ACT was written. Apparently, this site has become a part of the teaching of earth sciences from elementary school through a graduate program, and I can understand why. I briefly introduced these rocks in the last post. I promised to investigate them further.
The length of the road cut is more than 300 yards, but it’s never more than twenty feet high. It was so wide and narrow that creating a panorama was impossible, because of bridge supports, etc. I did my best (Fig 1).
 Fig. 1
This is only the western half of the exposure. It is a self-contained sedimentology laboratory, from rocks deposited more than 400 million years ago. I am unwilling to spend the time required to treat this exposure with the care it deserves, so I’m going to hit on a couple of sedimentological processes and try not to go too far out on a limb, but I’m certain I will fail. This is a blog, not a stratigraphy course. This blog is about thinking, not being told what to think, so I’ll be brief and rely on photographic evidence to make my points.
Depositional Environment
I mentioned the evidence for this exposure representing a nearshore shoal, submarine bar, or barrier island in my last post. Geologists are pretty familiar with the structures of nearshore marine sand bodies and we didn’t see anything surprising here. For example, the steep crossbedding observed to the right of Fig. 1 (landward) suggests that the silt/fine sand part of this unit (Fig. 2) was deposited in a sediment-dominated environment.
As an aside, the white sediment is very fine grained, so I tasted it. It is not sand, not even fine sand. I didn’t grind it between my teeth (the test for silt), but it didn’t have the greasy taste of clays, although it was a little salty tasting.
 Fig. 2
Thick sets of cross-bedded silt can only occur with weak waves and high input from a river transport system, from a source distant enough to reduce quartz and feldspar particles from granites (sand sized) to silt. A wild guess would be 50 miles from the source. These are relatively hard minerals. Even correcting for any structural deformation, it is obvious that the silt beds in Fig. 2 are close to their original orientation because the adjacent intercalated silt/sand/mud is sub-horizontal.
It isn’t so obvious when we look at the landward side of this sand feature, where post-depostional deformation has occurred (Fig. 3).
 Fig. 3
The failed seaward margin (in the distance) of the sand body can be seen at the left margin of the photo. We have seen that the sediment layers are nearly horizontal there. That isn’t the case on the landward side of the feature, where we see draped intercalated silt/mud dipping at 30 degrees. I don’t want to say too much yet because I’ll address this in the next section, but we need to remember that the landward side of the sand body would have been shielded from wave action; thus, the sediments would not have been as winnowed or dewatered. When an infrequent storm event occurred, therefore, the effects would have been erratic. That is what we see in Fig. 3.
The only other issue to raise, but only briefly, is the sudden change from uniform silt to mixed sand/silt/mud. This is only conjecture, but I’d be willing to propose that transitions are not easily recognized in the stratigraphic record. I’m going out on a limb…maybe I’ll wait.
I should spend a few words on the mixed silt and mud layers, which are obviously important. This area (god only knows how many millennia later) became a tidal flat, as indicated by the mixed sand and mud above the silts we’ve been discussing (Fig. 4).
 Fig. 4
The depositional environment here in central Canberra didn’t change in a heartbeat. Figure 4 is about 10 feet in height. This looks like a pretty stable environment, from the rhythmic layering of clay and sand/silty sediment. How stable was it?
Figure 4 reveals a stable depositional environment that created at least 3.3 m (I’m using SI for convenience) of sand and mud. Using a conservative depositional rate (for a tectonically active region) of 3 mm/year, we can look at the sediment in Fig. 4 from a temporal perspective: Yoko is standing in front of about 1000 years of sediment. My jaw drops just like yours (should). I had expected it to be at least a million years; there is a caveat, however. Tectonic processes have to make accommodation space (as it’s called in sedimentology) for all that sediment. We can skip to the chase and say that in the Canberra basin, the accommodation space was available because tectonic plate movements (vertical as well as horizontal) made it happen.
Syndepositional Deformation
Anyone who has ever walked along the seashore understands syndepositional deformation. How in the world were the footprints of dinosaurs, birds, even people, preserved in ancient sediments? To be clear, very few events are preserved. When I go to the beach and stand there, letting the waves dig a hole around my feet, my pleasant experience will not be shared with future generations. Very little is preserved in the constantly moving surface world, kept in flux by wind and water. I can’t answer my own question (it’s rhetorical), but here are a couple of examples that might make sense.
I used this picture (Fig. 5) to suggest that mud is stronger than sand and would form boudins but, to be honest I don’t think I have to prove anything. Just look at the record that was in front of my eyes (Fig. 4).
 Fig. 5
The slip-face and resulting Shear Zone led to failure of the seaward-facing (to the left) sand body, so the newly accumulating (over centuries) mud slipped down the slippery slope, forming boudins (indicated by ellipses with squiggling lines), and then everything stabilized. The reason the boundary between the sandy sediment and the mixed sediment is so distinct is the buffering effect of hydrodynamics.
There’s a saying, “It will all come out in the wash.”
That is what coastal hydrodynamics does. Here’s another example (Fig. 6), this time showing how wet sediments can do things impossible for rocks.
 Fig. 6
Figure 6 is less than 10 inches across. The heavy black line tracks a single layer of sediment folded at a ridiculous angle. The ellipses, sometimes filled with squiggles, are boudin structures. The hand-drawn arrow shows the continuity of the “bedding.”
The basic process revealed in Fig. 6 scales up (Fig. 7).
 Fig. 7
Figure 7 is key to understanding syndepositional deformation. It doesn’t matter what caused the shear zone in the figure. The orange lines show layers of sediment remaining coherent while sliding downhill, until the rate of shear/strain was too great, when they became jumbled (scribbly orange lines at bottom-left of Fig. 7). The incompressible sands of the subjacent unit flowed smoothly (black lines), jamming into the shear zone. Some turbulence is indicated at the top of the transition after the slump, but then sedimentation continues, only now dominated by mixed sand and mud (see Fig. 5 above).
Postdepositional Deformation
I haven’t covered a fraction of what this site offers. I am overwhelmed. Serious research studies, integrating this exposure into the other stratigraphic and sedimentological data from the area, are probably underway. I’m going to limit my analysis to what I’ve seen with my own eyes. My interpretation is probably incorrect, but it isn’t because of negligence.
Recalling that these sediments were deposited between 443 and 427 Ma, it is surprising that they are not in worse condition than they are. For example, compare Fig. 3 to photos of the Canberra Formation and the Black Mountain Sandstone from my post on Siliciclastic Sedimentation. All of these rocks are about the same age and were deposited within a few miles of each other.
The rocks comprising the Black Mountain Sandstone are fractured, show signs of extensive cementation, and are tilted in different directions because of faulting. The Canberra Formation rocks are faulted and folded to the point of being overturned. It’s true that the time interval for deposition at these three locations was large (16 million years), which is a very long time. However, we know that regional deformation hadn’t ended because of folding of the younger (424 Ma) rocks at Deakin Anticline.
I would have thought these were Tertiary sediments if I hadn’t looked at a geological map (actually, I used the ROCKD app on my phone). This is an anomalous site.
Nevertheless, these rocks have been deformed. There are high-angle normal faults in this sediment with no evidence of brittle fracture (Fig. 8), i.e., no crushed zones (breccia) or re-cementation (unique minerals and micro veins).
 Fig. 8
Examining Fig. 3 above, we see that the outcrop reveals a very low-angle anticline, which implies that these rocks were compressed (folded) and later went through an extensional stress regime, as clearly indicated by normal faults in Fig. 8. The thin, upper beds have been folded, however, and the faults also show some curvature.
The next example could be discussed as either syndepositional or post-depositional deformation (Fig. 9). It has some elements of both, but mostly I think this feature was created during shallow burial, no longer at the surface and thus post-depositional.
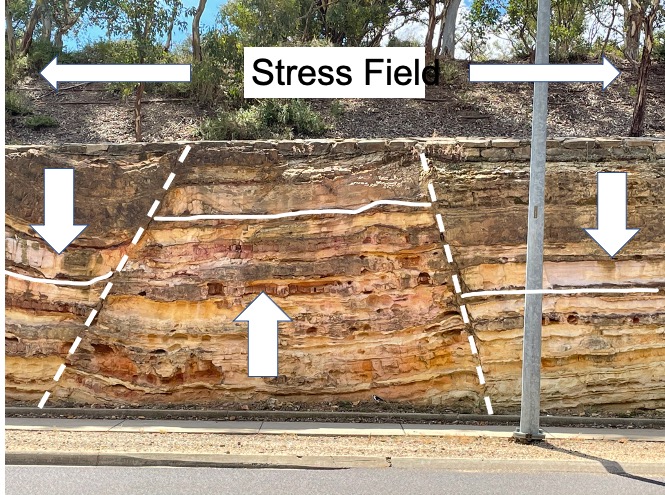 Fig. 9
The white, horizontal line indicates what I think was originally a continuous sediment layer, so there’s about 3 feet of displacement along the normal faults indicated by dashed lines. The block arrows show relative direction of movement of the three blocks seen in the photo. The stress field is tensional, i.e., the sediments/rocks were being pulled from both ends, somewhere other than this outcrop. Note the upward curvature of the sub-horizontal line on the left side of the image. This sediment was not cemented when faulting occurred.
I admit this is pure conjecture but, the narrowness of the Horst (upward moving block) suggests that the two normal faults either converged less than 20 feet up the section, or these sediments were very close to the seafloor when this brittle deformation occurred. It isn’t too difficult to imagine faults splitting and joining because rocks are heterogeneous when buried and somewhat ductile, so maybe…
Spatial and Temporal Variability
I was unwilling to say too much earlier, but now is the time to speak openly. The sudden change from relatively pure very-fine sand and silt to intercalated silt/mud that is so obvious in this outcrop didn’t happen. The river and ocean system didn’t switch one day, and stop delivering/depositing massive volumes of silt. Mud didn’t occur magically as if a dump truck (of immense size) had unloaded into whatever primordial river ran through this area ~430 million years ago.
This is an example of how subtle changes in a complex system like the earth’s surface aren’t evident immediately. A system as complex as the lithosphere-atmosphere-hydrosphere adjusts to slight changes, until it doesn’t. Then — Voila — a suddenly very different situation. The childish interpretation, that the world is a very simple place and abrupt changes in the geological record, as we’ve shown in this post, are the result of intelligent-design — Gaia, God, a horned toad with superpowers, Aliens…whatever — fails to account for our nascent understanding of nonlinear systems.
I have a simpler explanation: Stratigraphy doesn’t immediately record transitions in the geological environment because fluid-dynamic-driven, processes like sedimentation, act as a buffer that smears transitions out, over thousands of years. The earth’s surface is three dimensional. The stratigraphic sections we’ve been examining make that obvious. Time is another element; but it isn’t directly correlated to the vertical dimension in stratigraphic sections of sedimentary and volcanic rocks (both deposited horizontally).
I will address the disparity in deformation in the last post of this series.

Recent Comments