The Flora of Carbon River, Pierce County, Washington
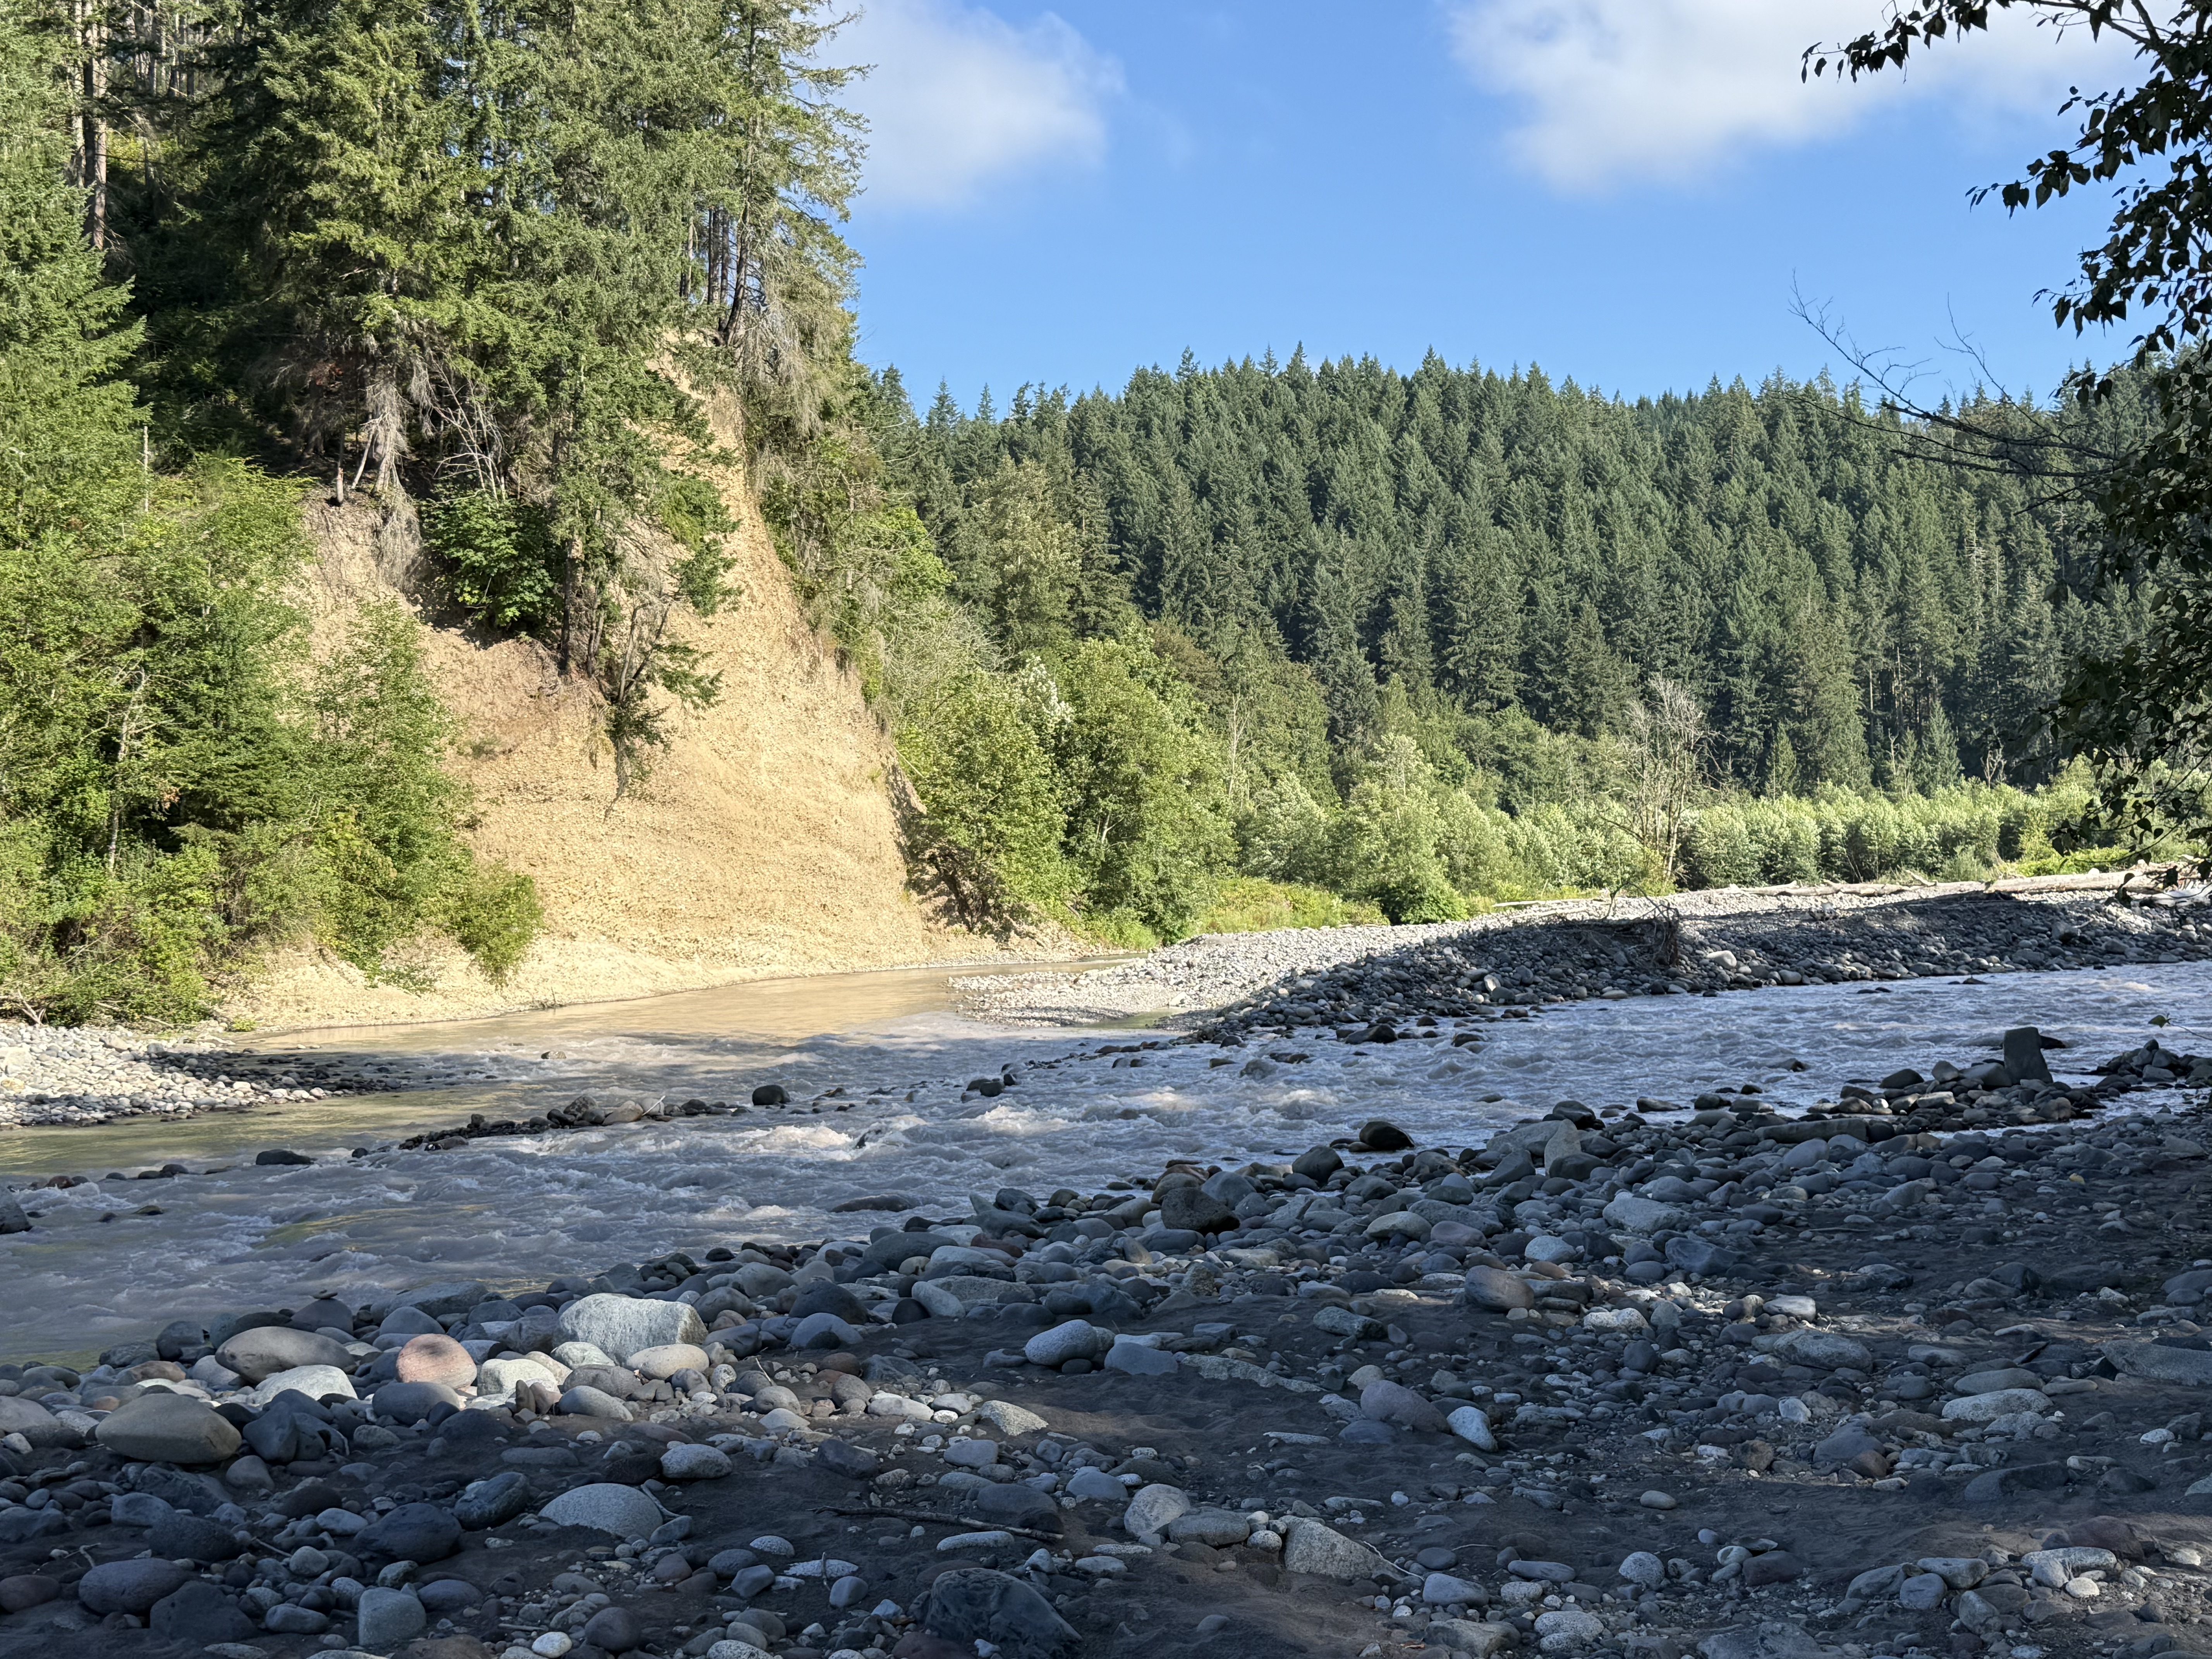
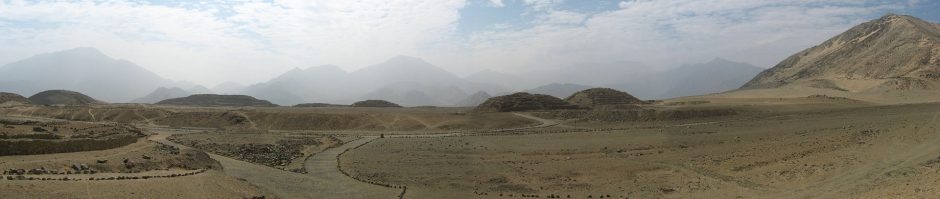
Plate 1. Our first stop was at Carbonado, where the Carbon River exits the canyon that has constrained it from its origin on Mt. Rainier. It immediately forms multiple channels as it cuts through glacial till on its circuitous path to Commencement Bay.
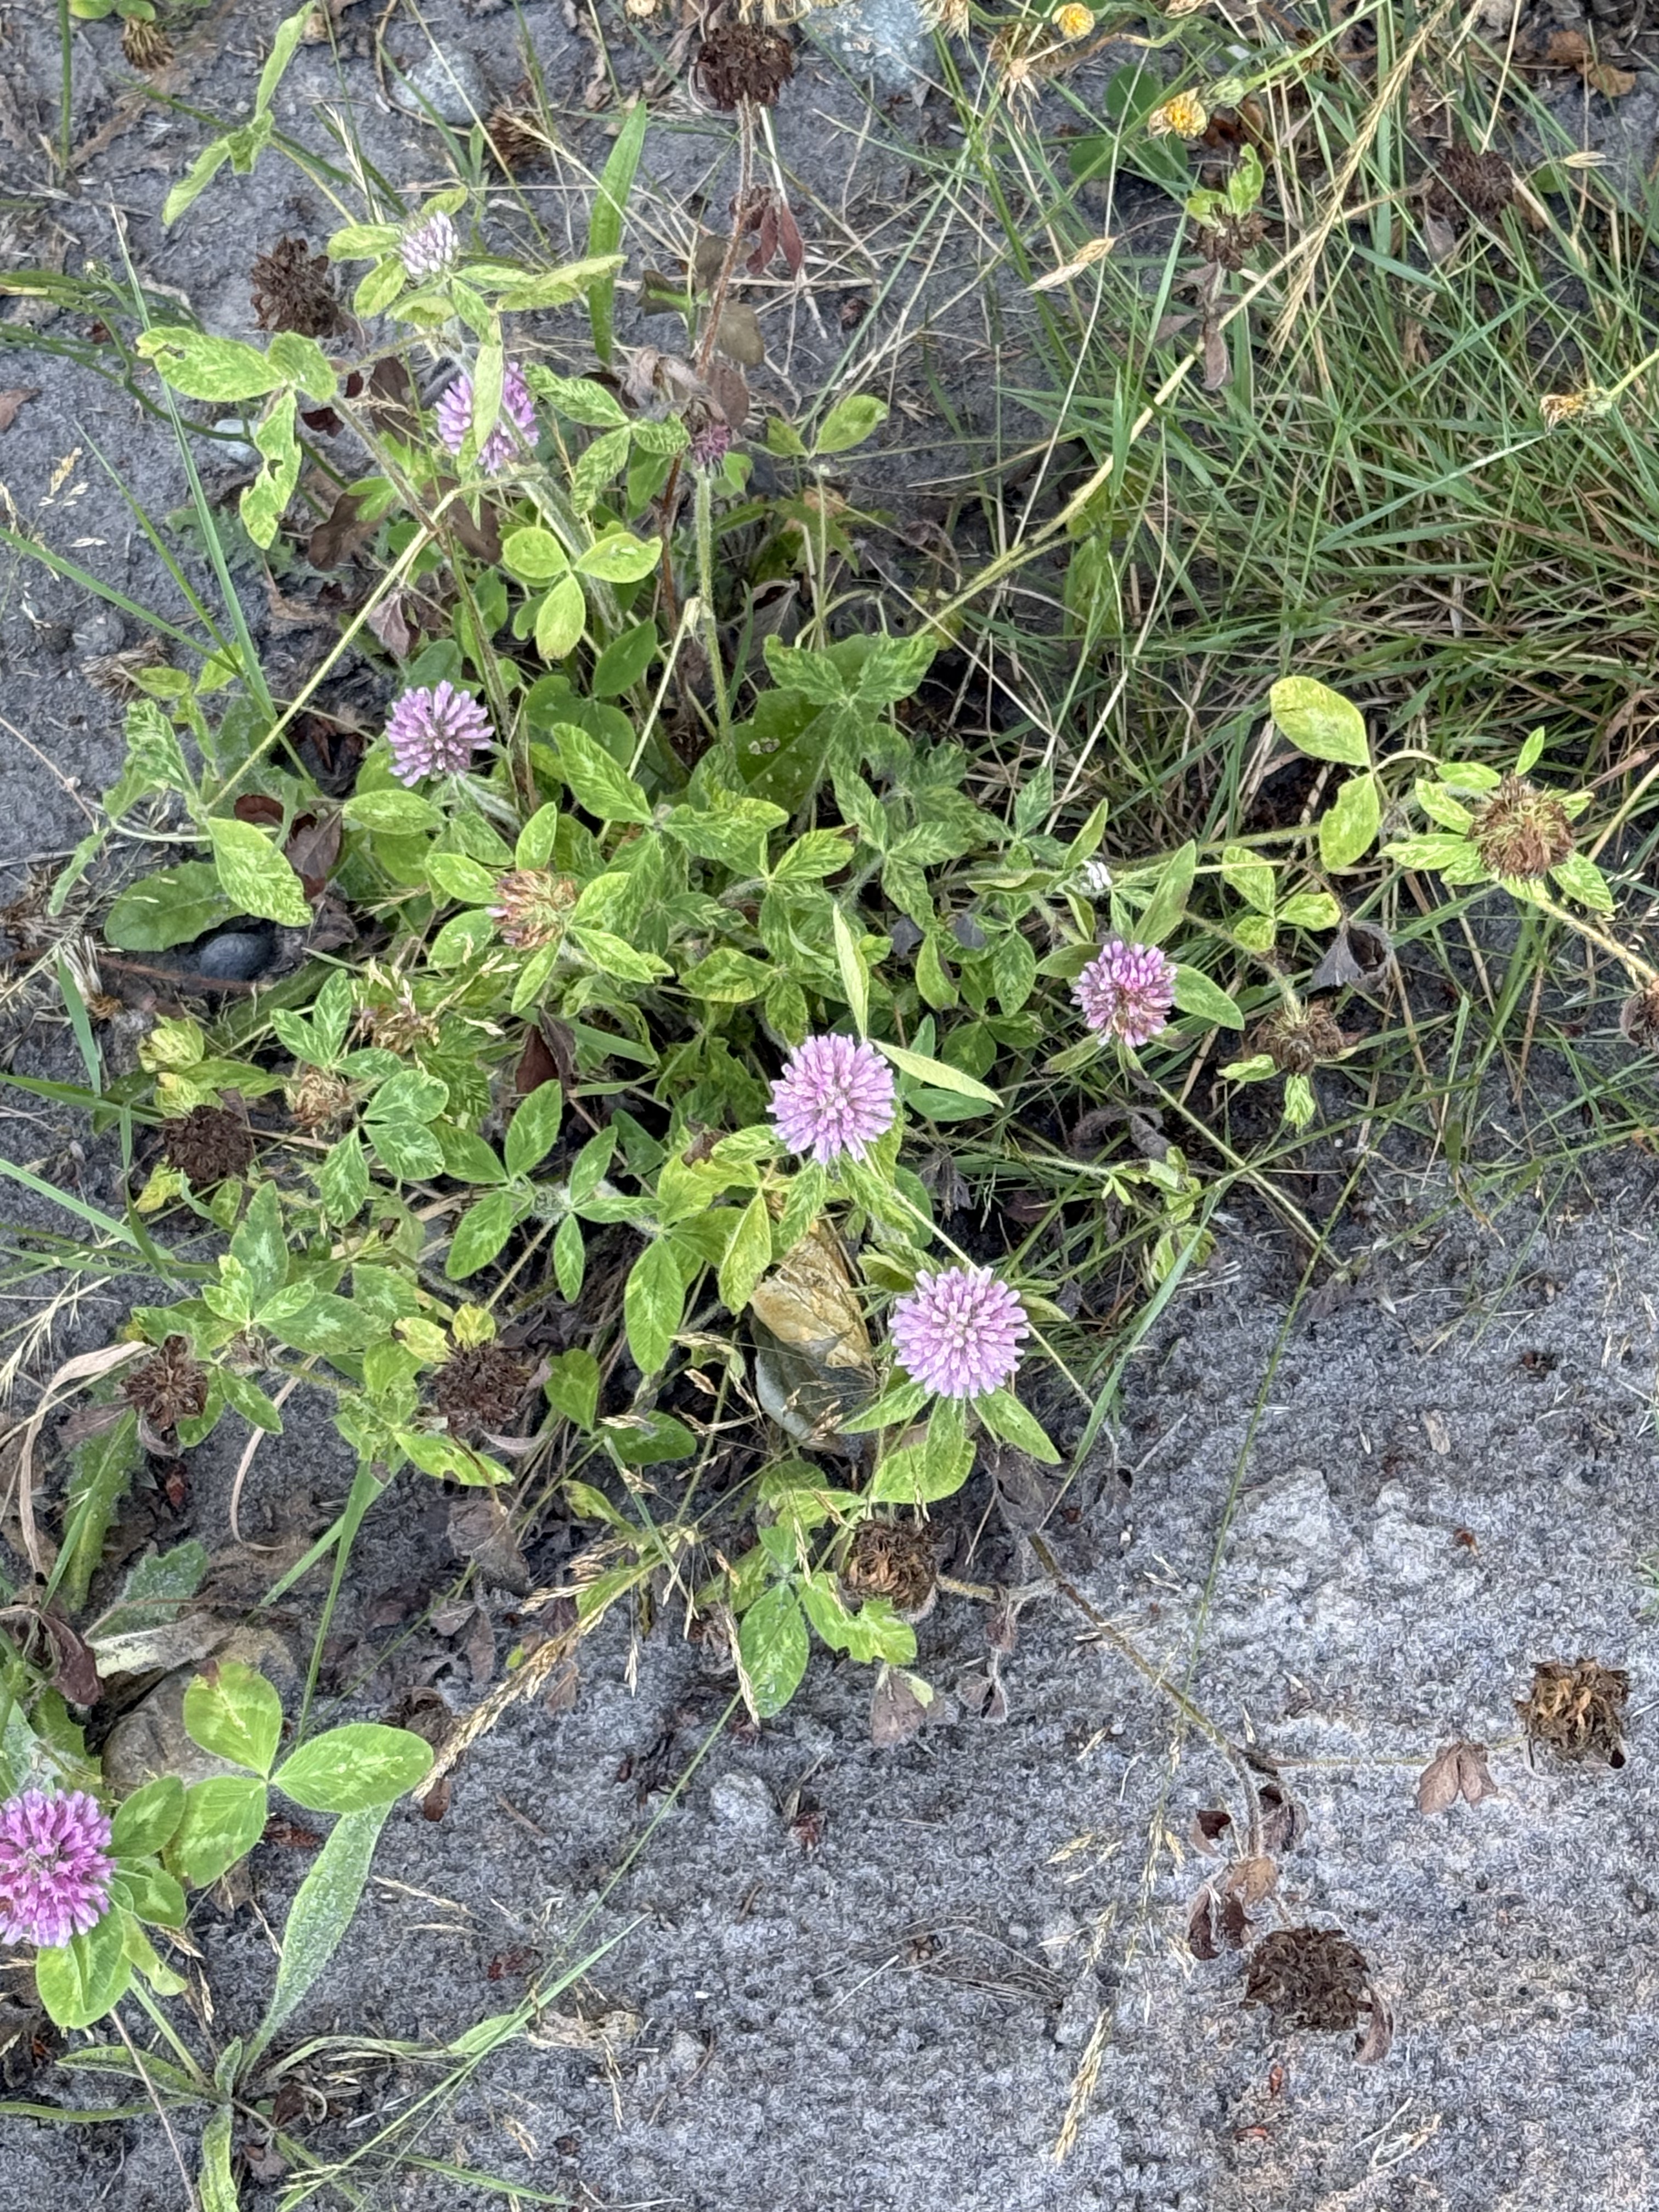
Plate 2. This lovely flower is red clover (Trifolium pratense), a common wildflower along rivers.
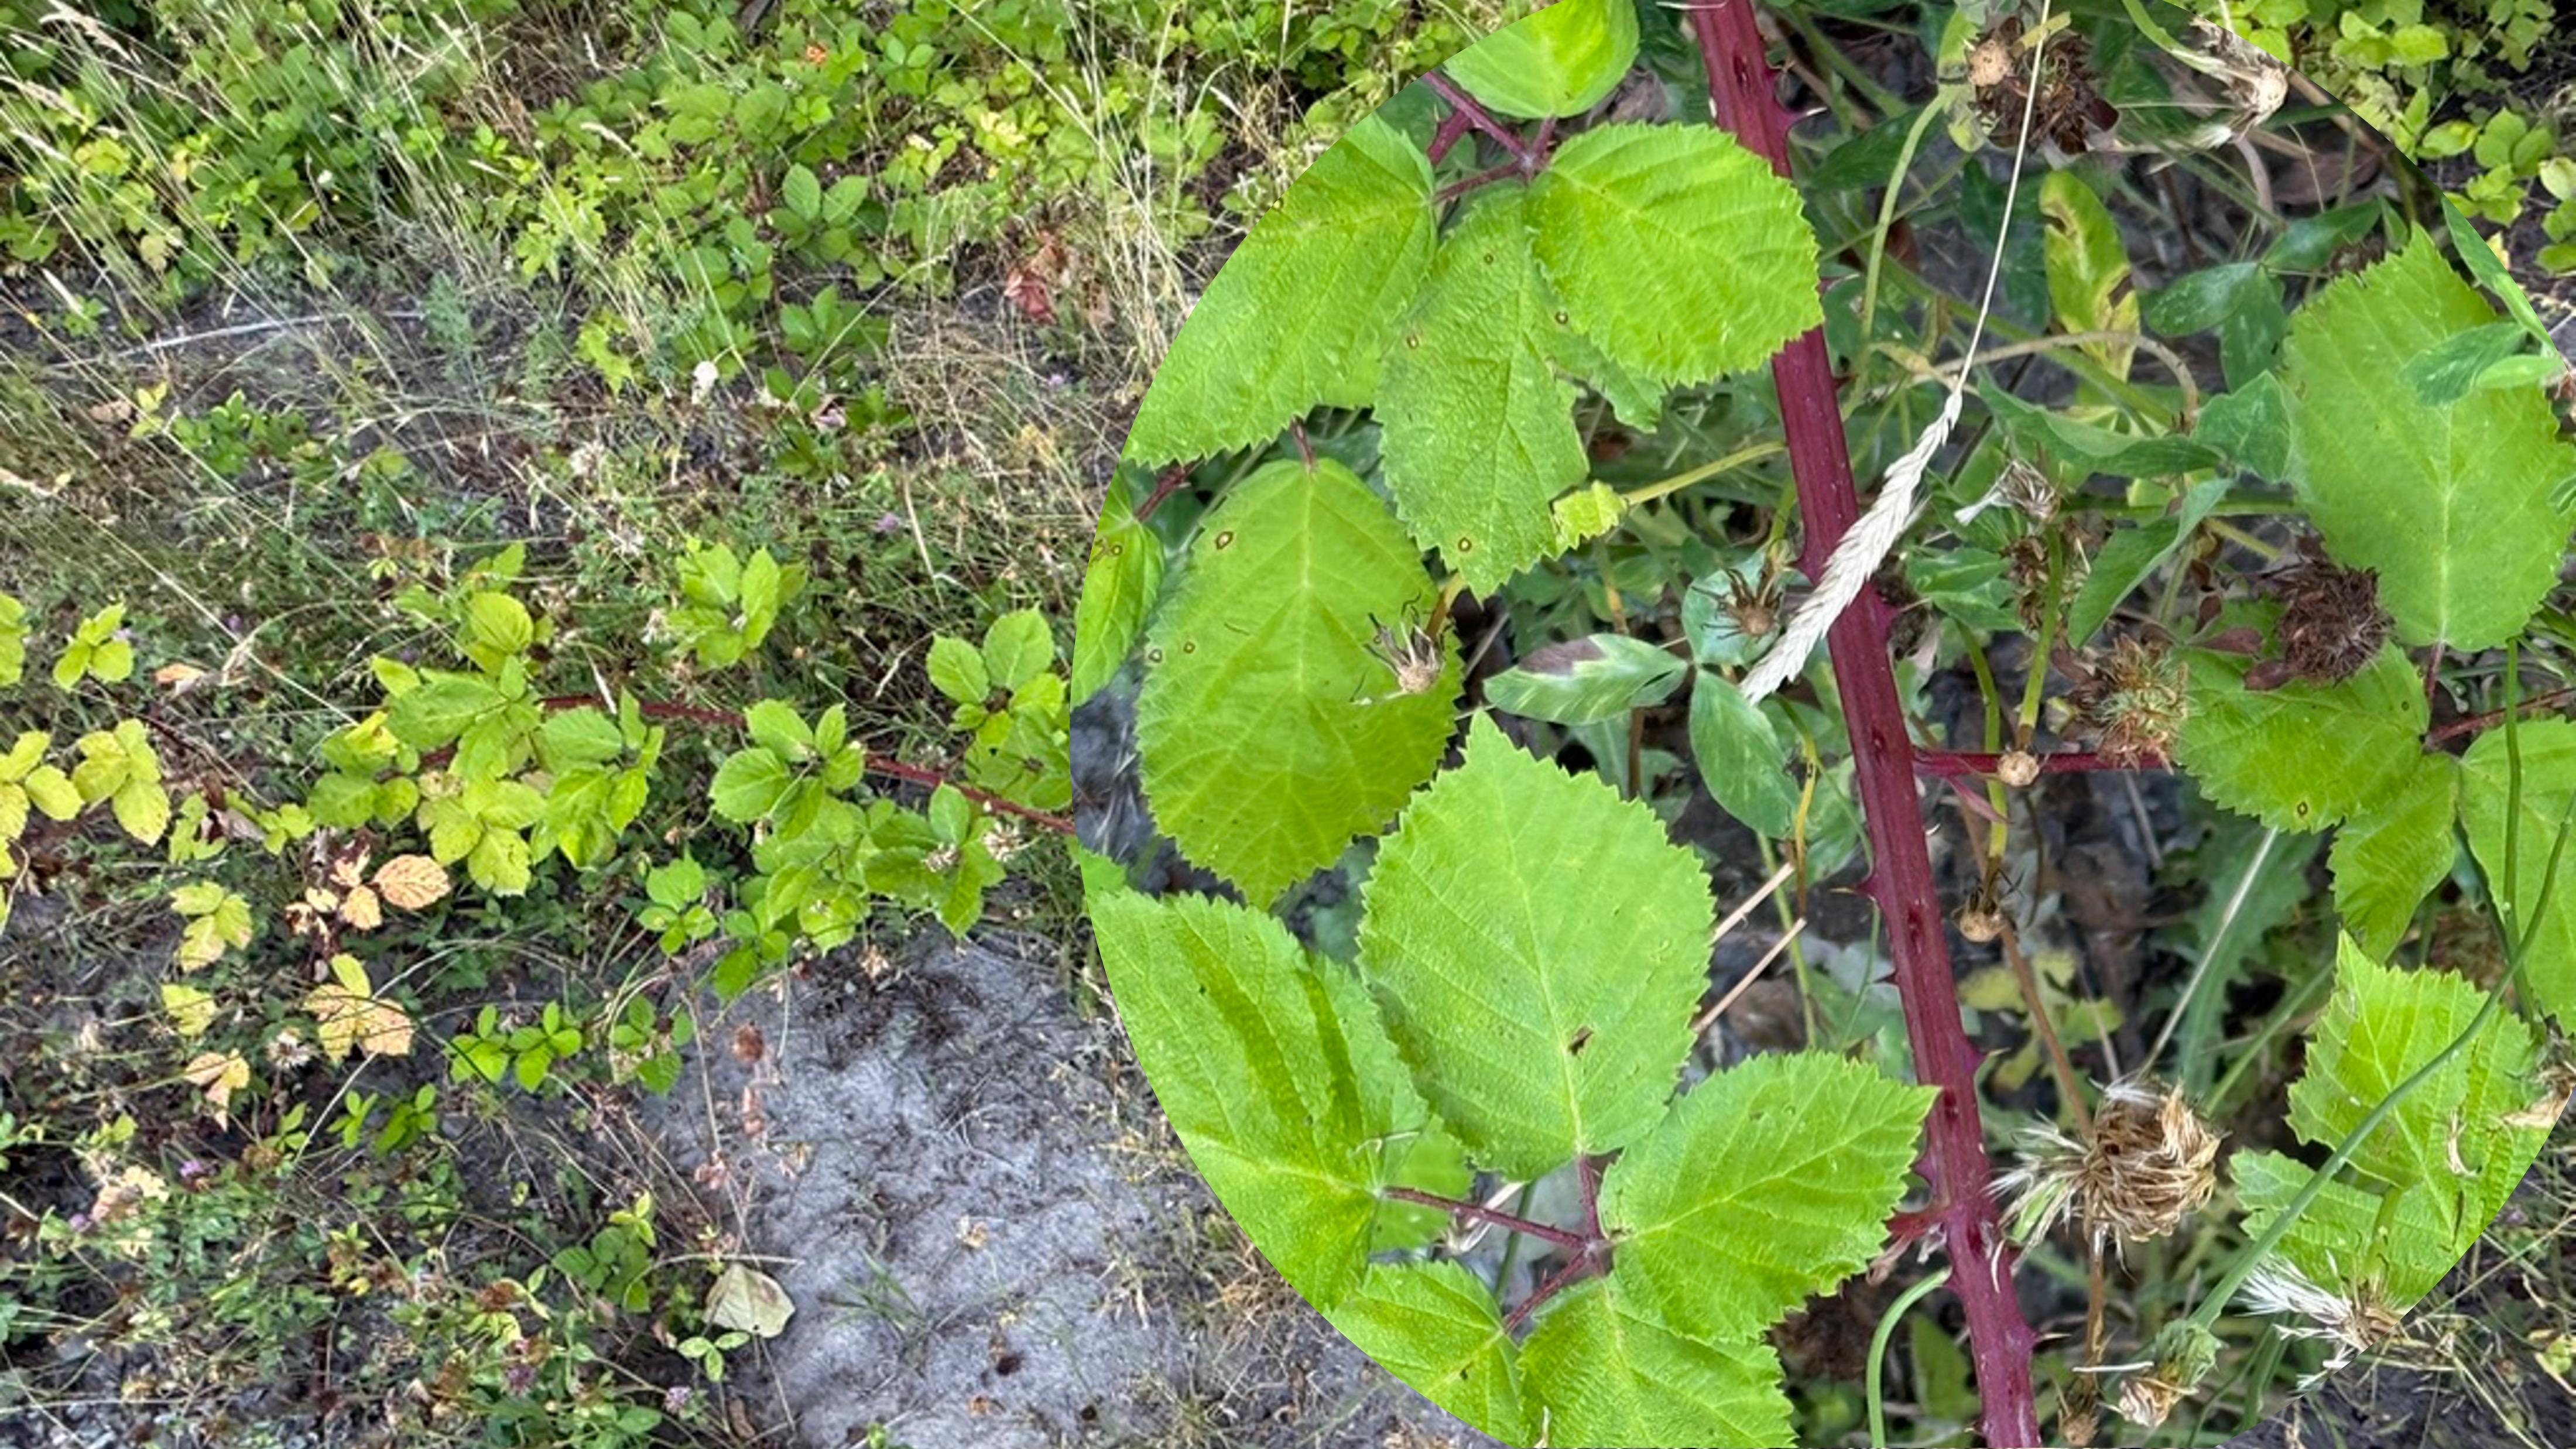
Plate 3. CoPilot and I argued too long about this one, but, after some back and forth, I decided it might be a genus of Spiraea. They are another common shrub in this ecosystem, but they aren’t in flower in July. Note the shriveled flowers in the right image. Too late to be sure. That’s why I’ve always ignored these bushes.
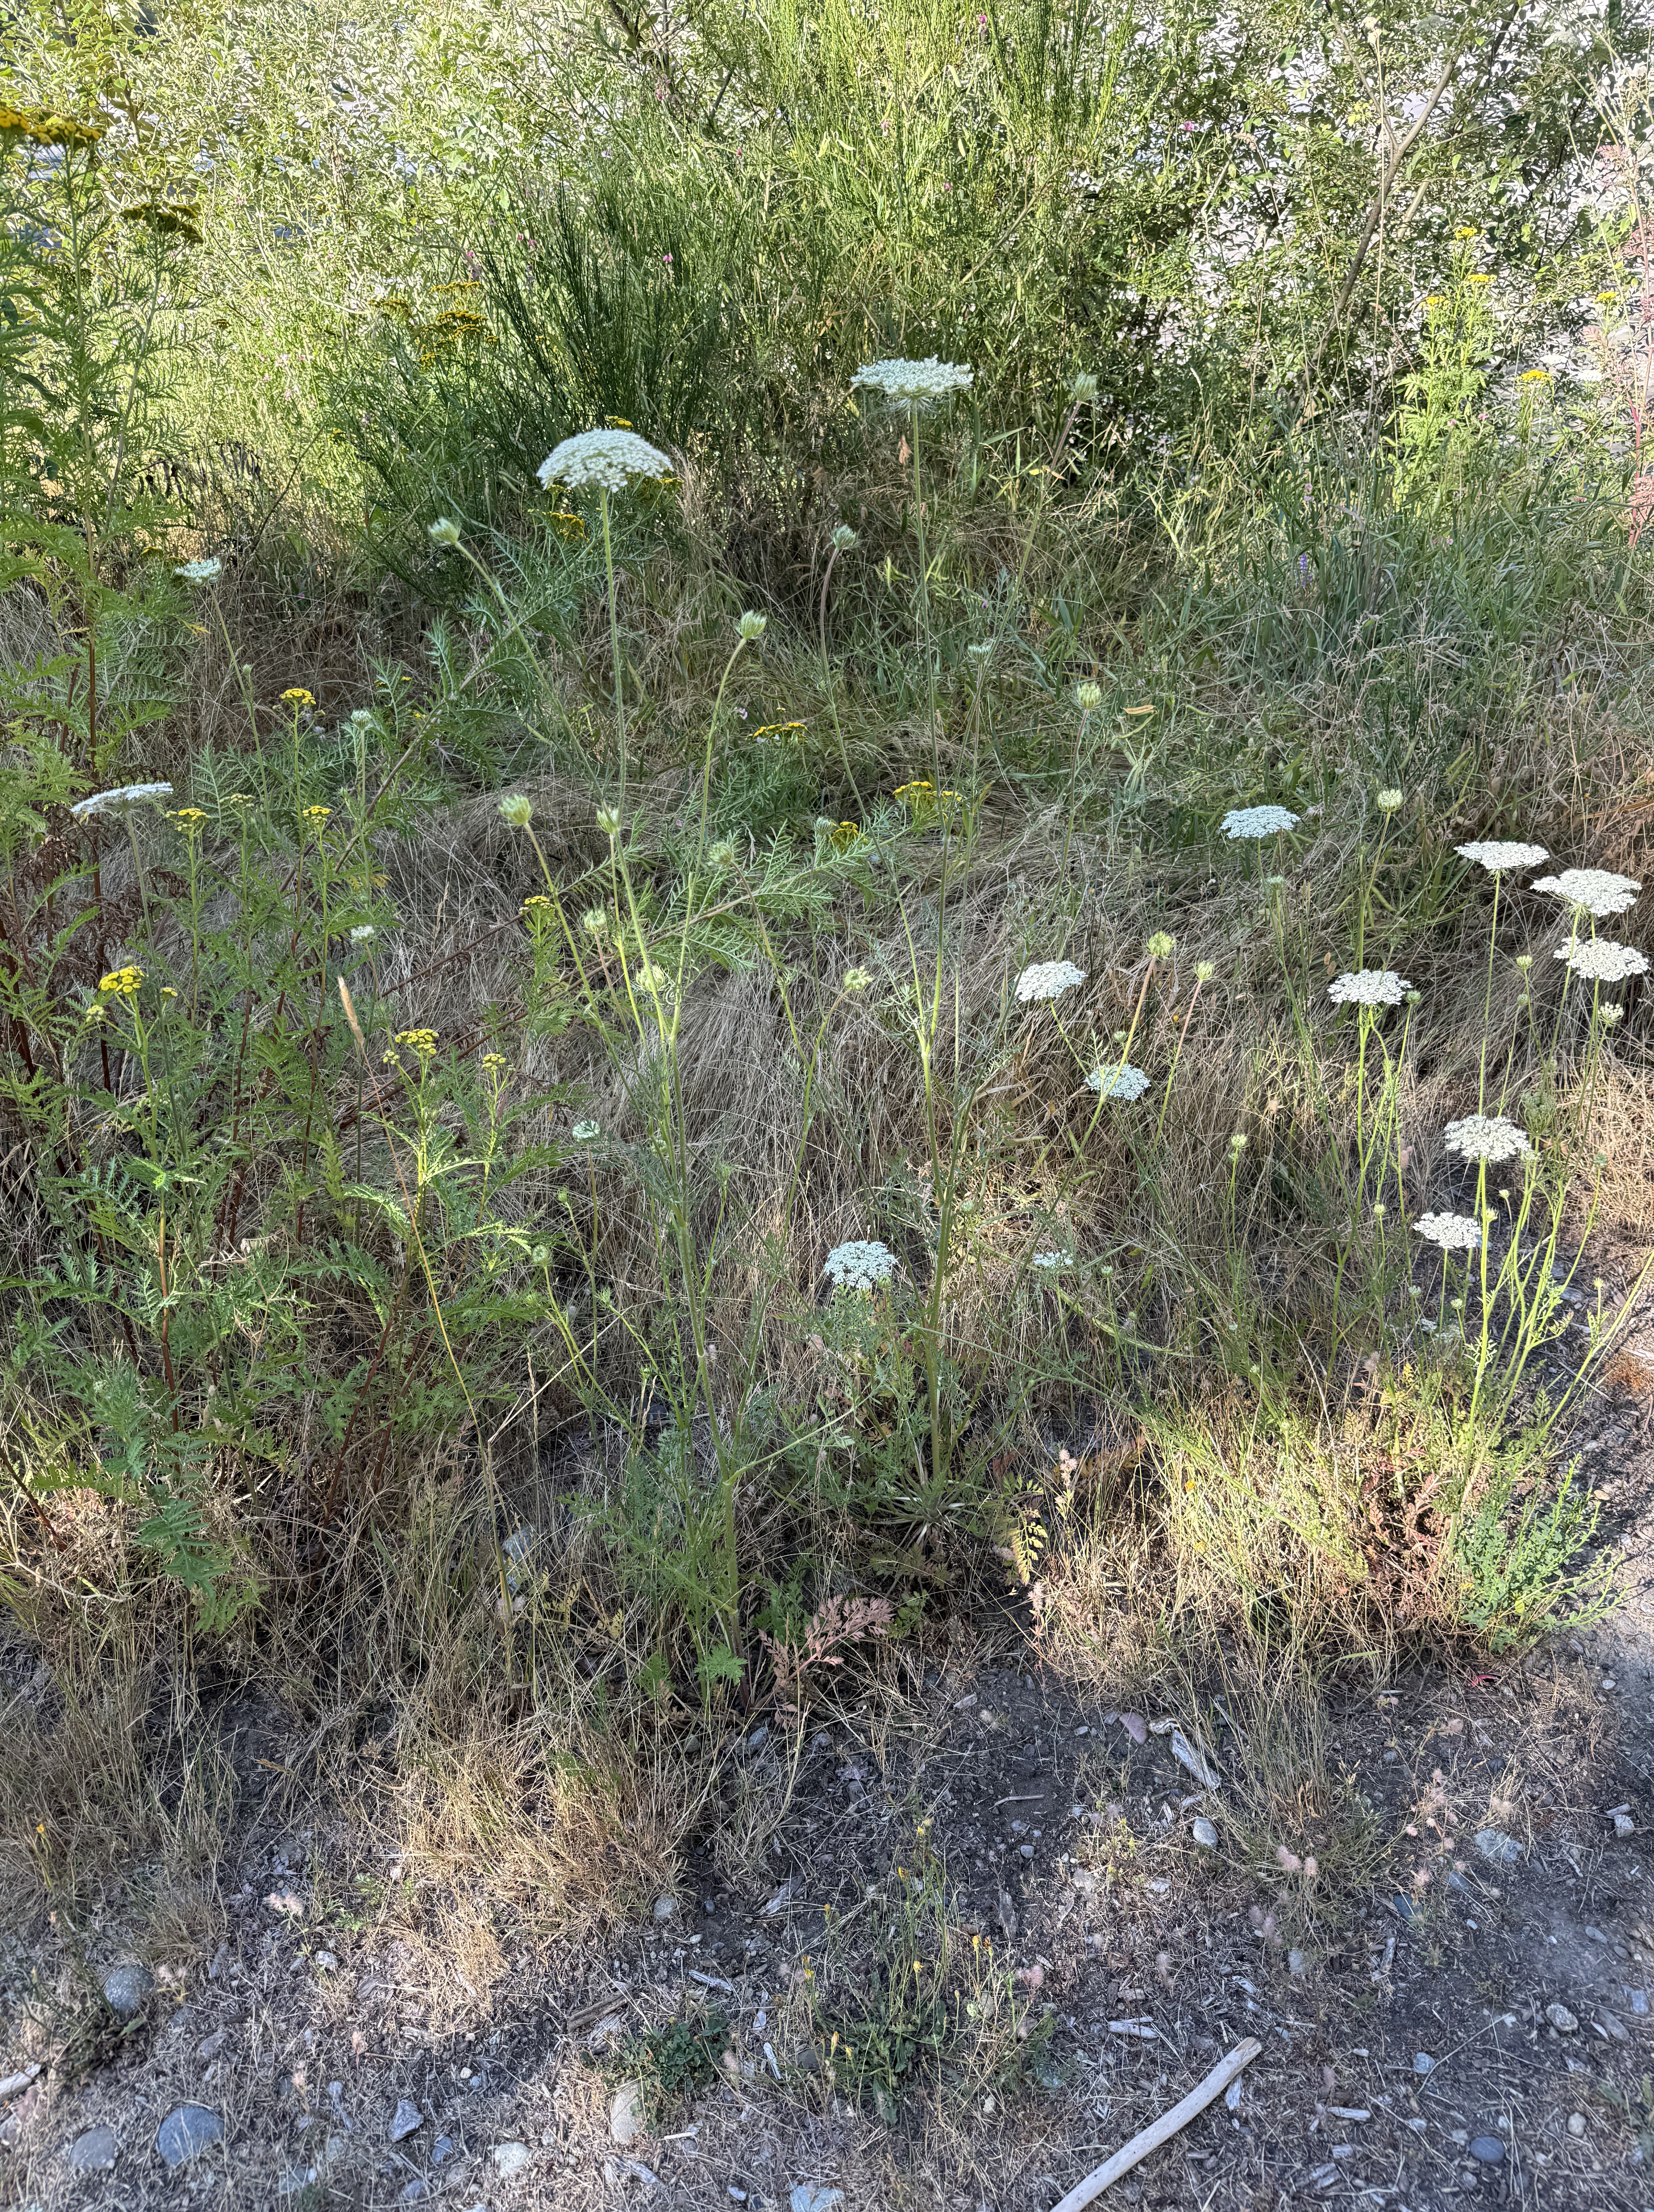
Plate 4. Cow parsnip (Heracleum maximus) is a common wildflower in meadows and roadsides in Washington.
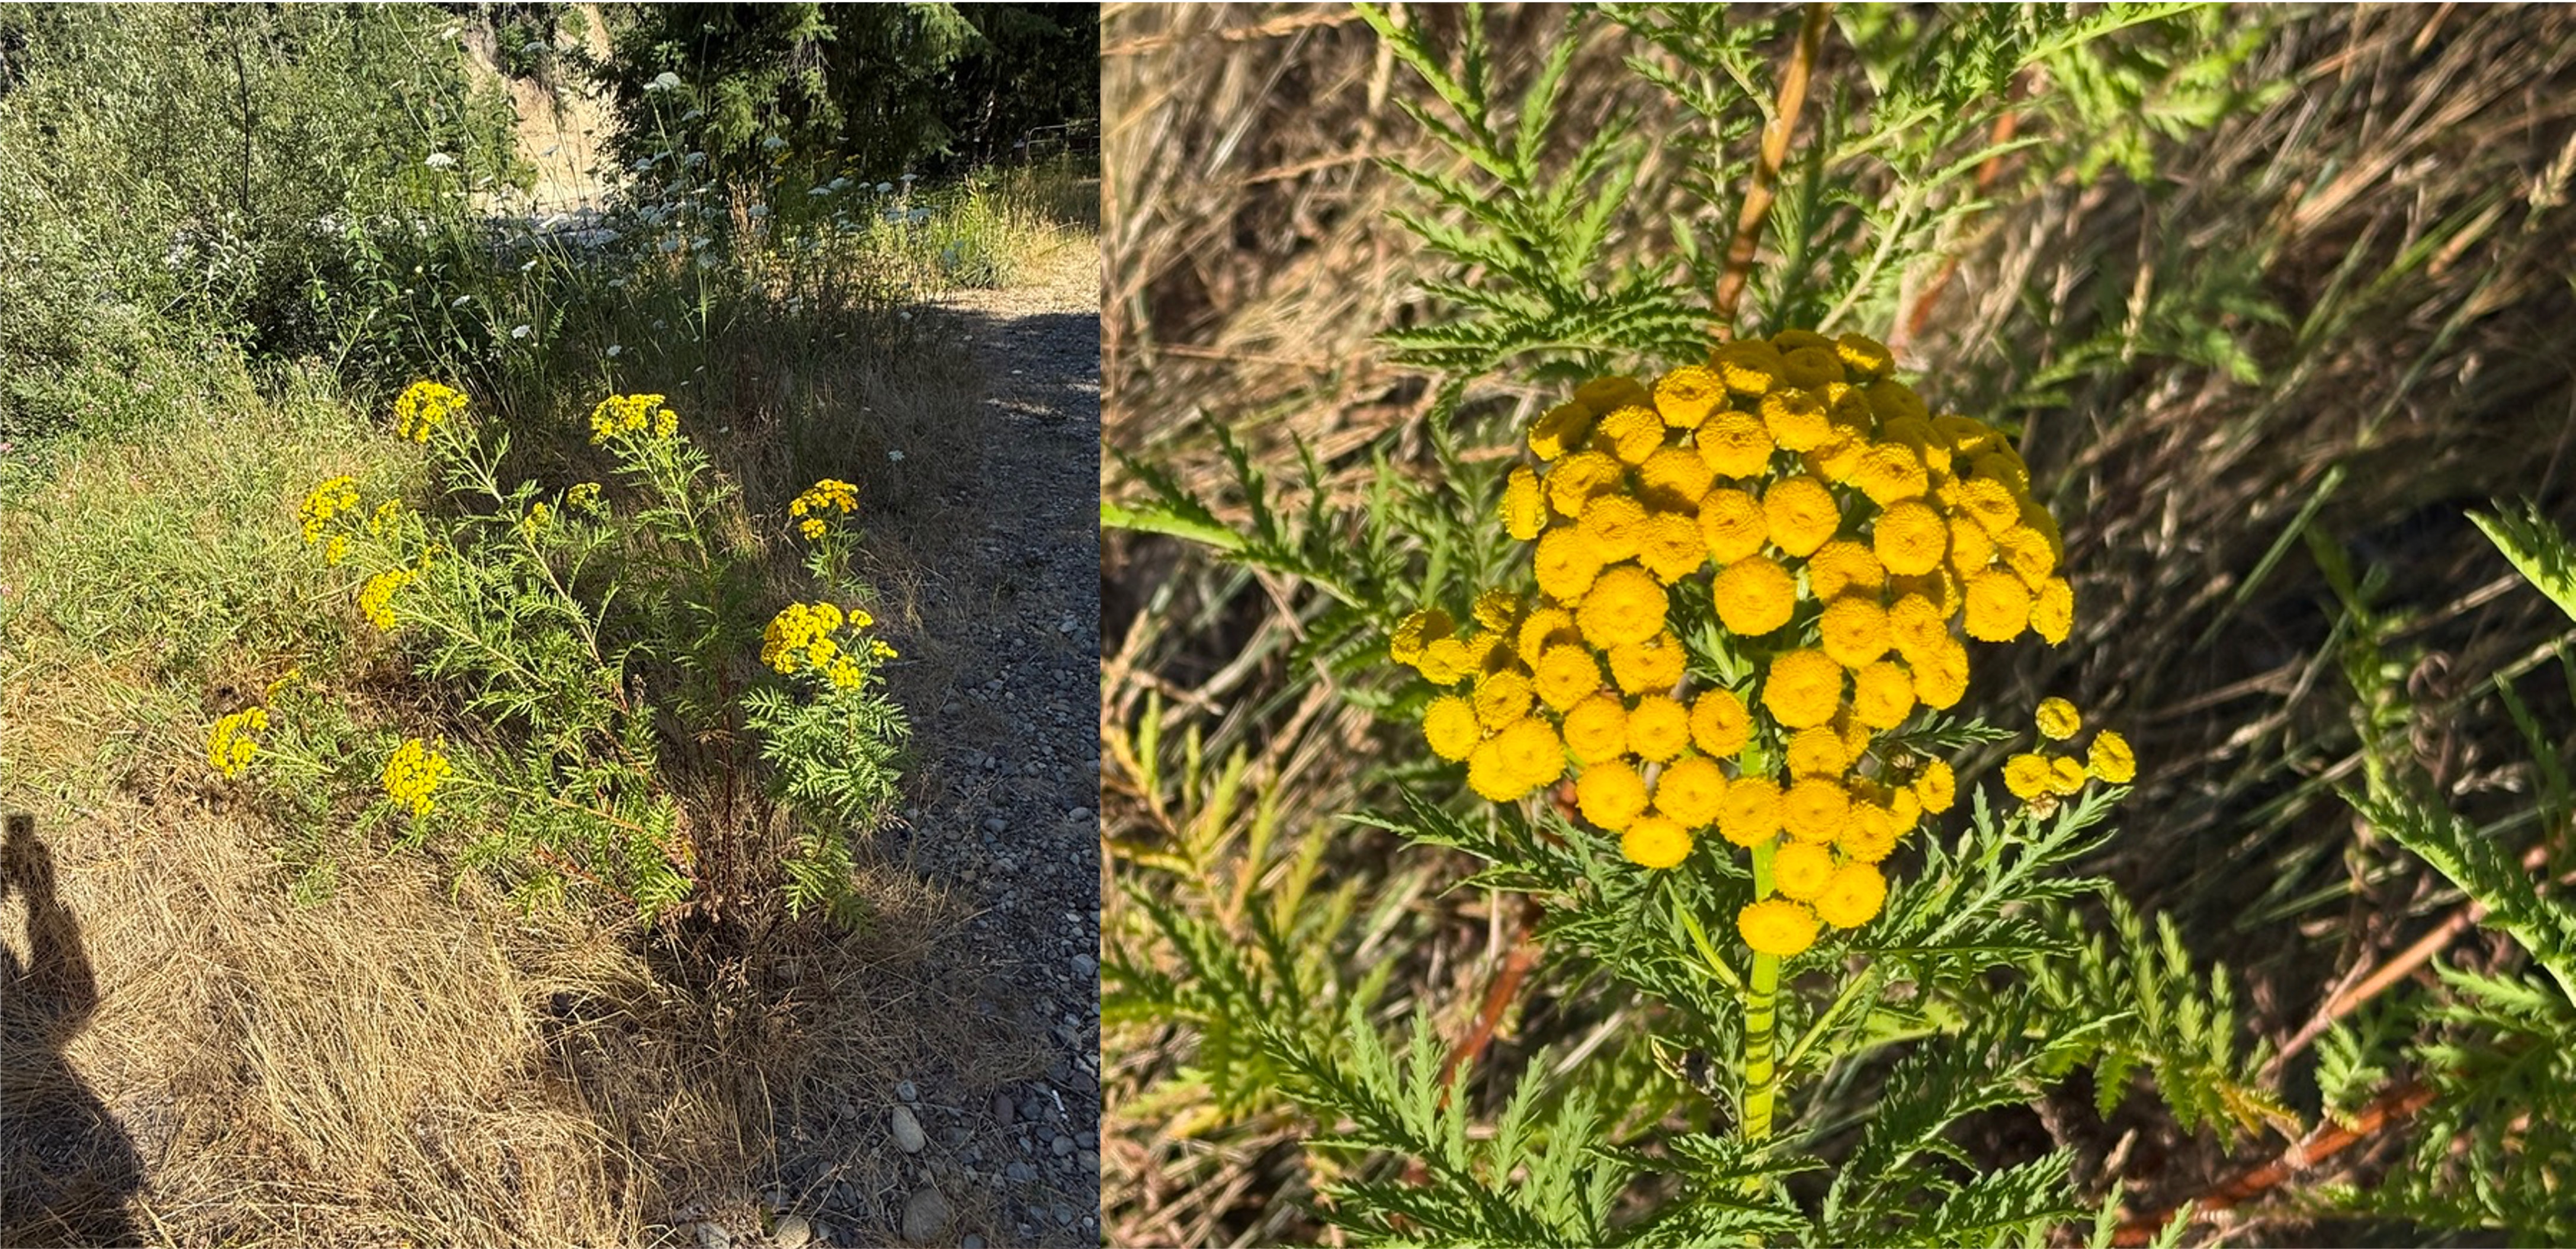
Plate 5. Tansy (Tanacetum vulgare) is a common wildflower along the Carbon River corridor.
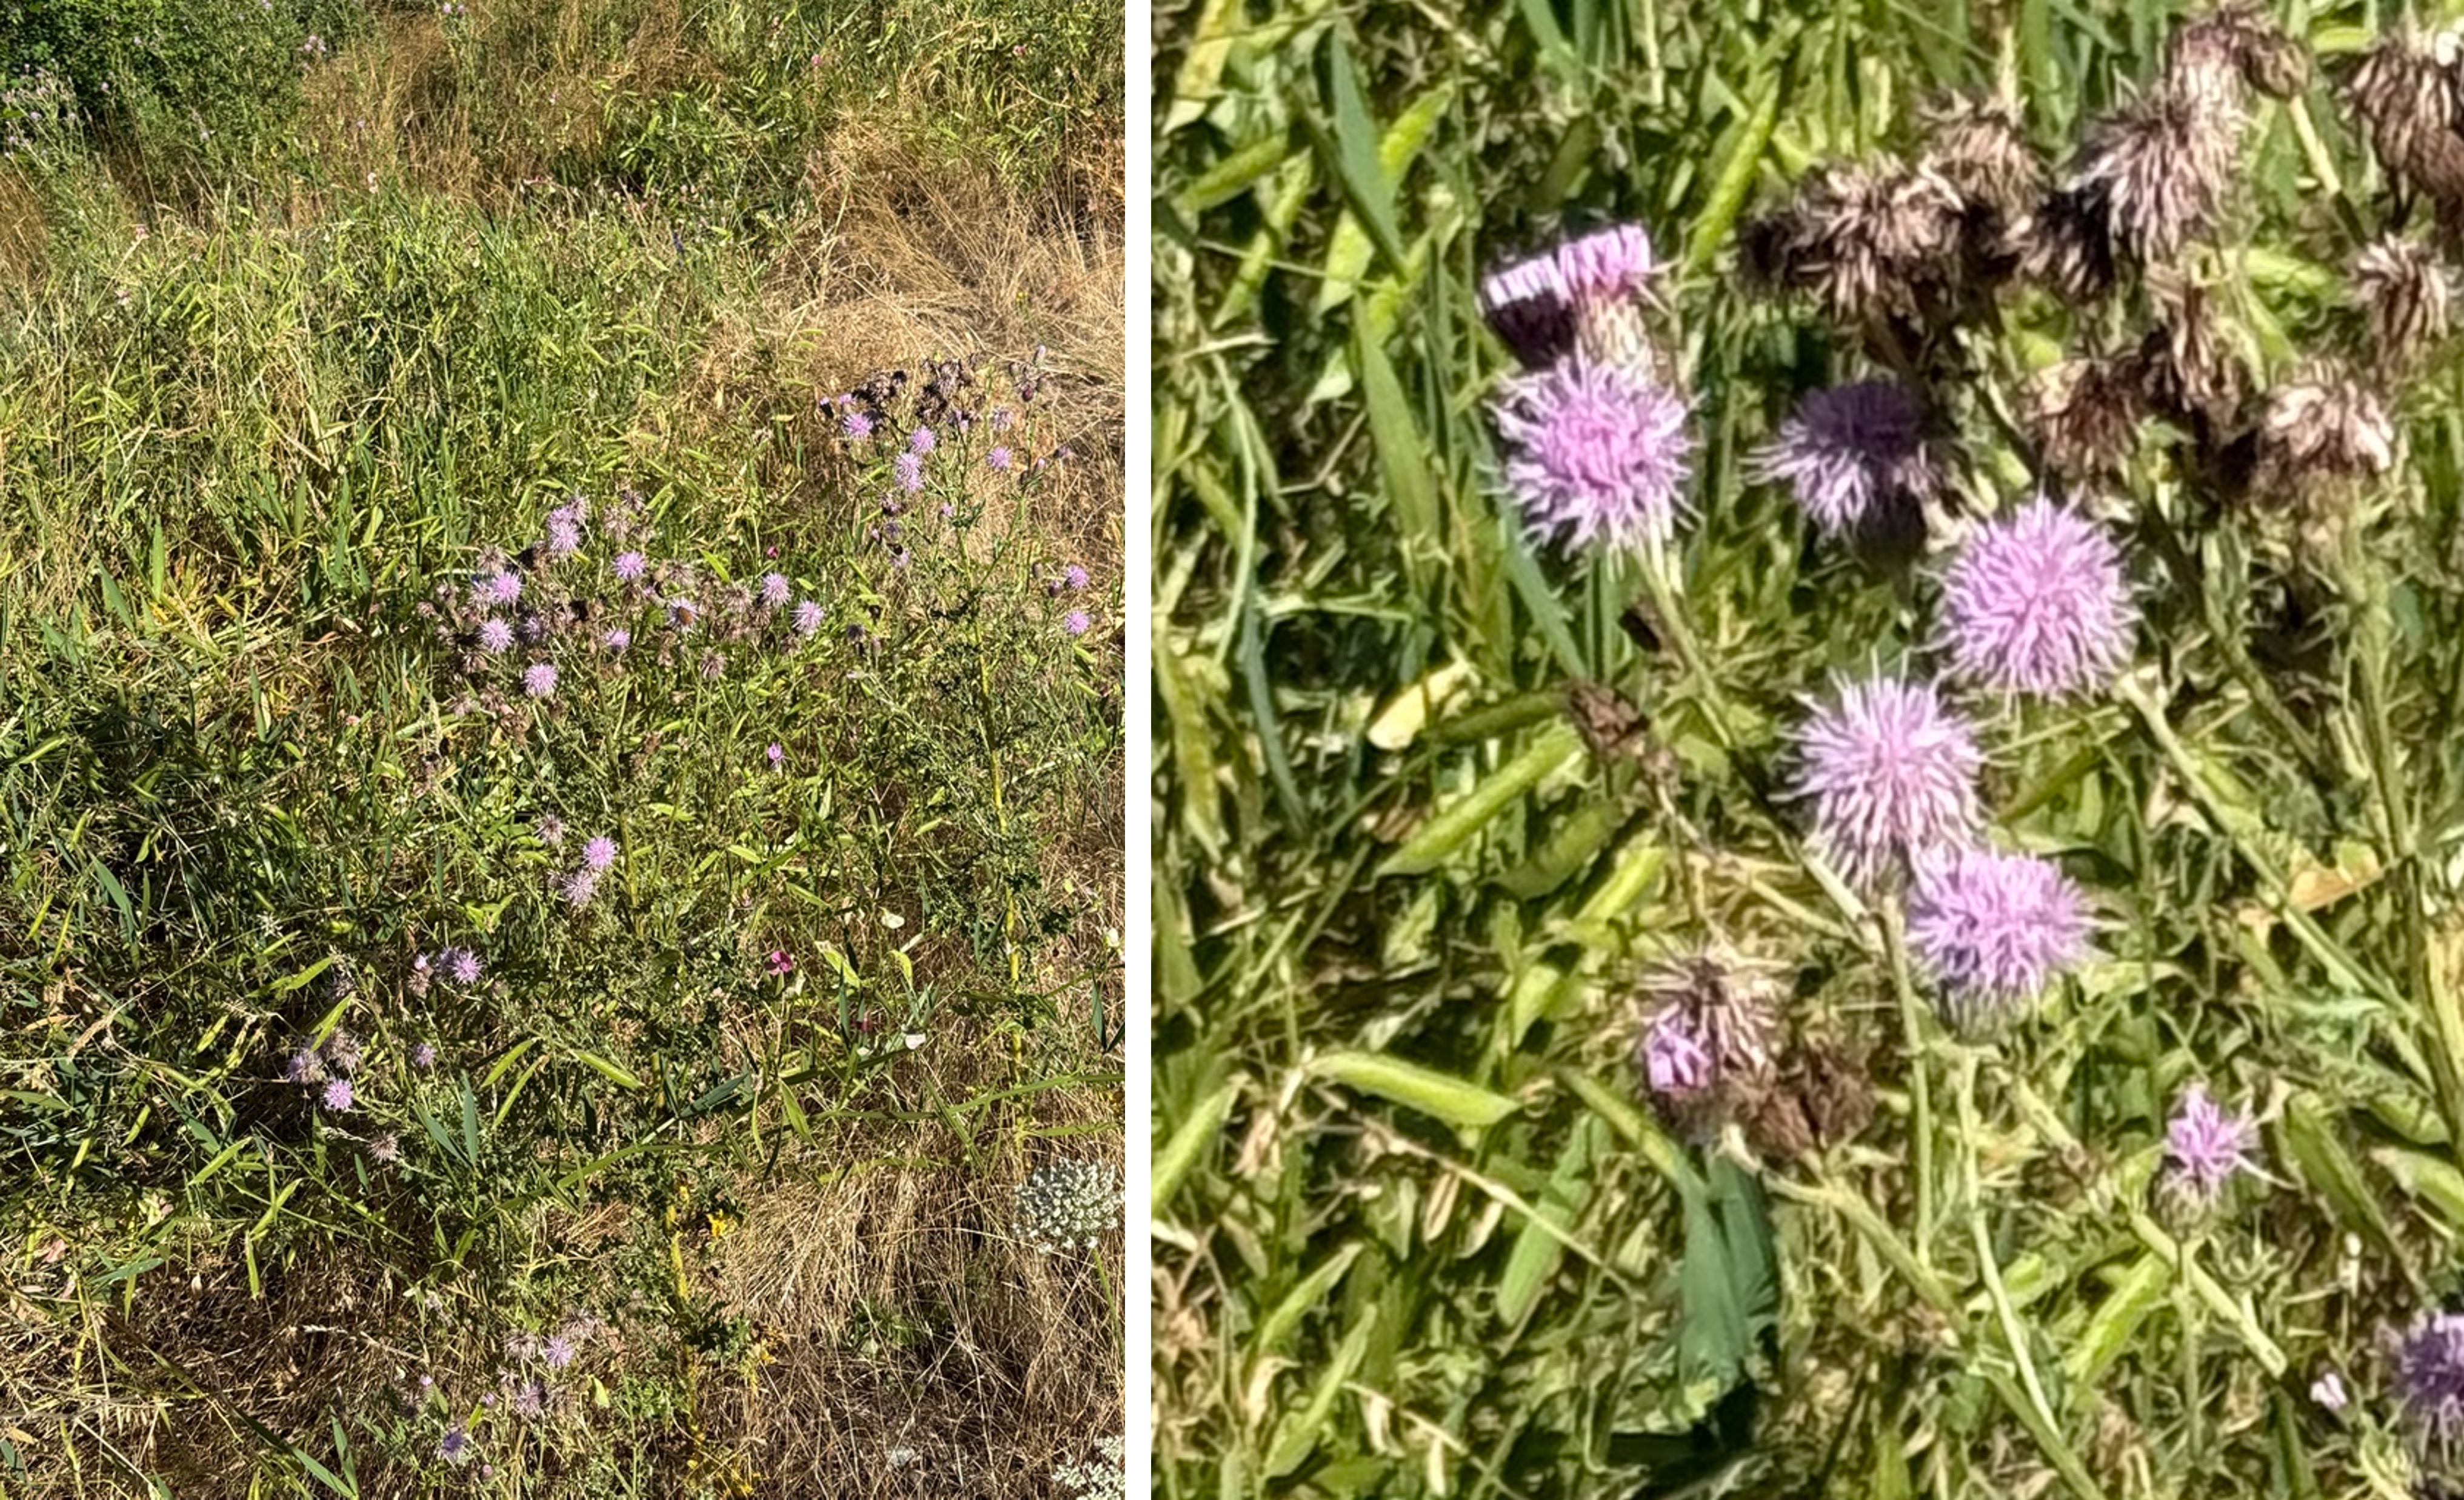
Plate 6. I thought, when putting this post together, that this was red clover (Plate 2), but CoPilot identified it as Canada thistle (Cirsium arvense). It loves disturbed areas like river edges. I did detect some spines when I zoomed in on the second photo. Why am I not surprised? If it’s pretty it will have spikes ready to draw blood from any inquisitive passers by.
Plate 7. This view is looking downriver from Franklin bridge, which is permanently closed. I’ll now describe some of the flora we encountered as we followed the river along a steep slope.
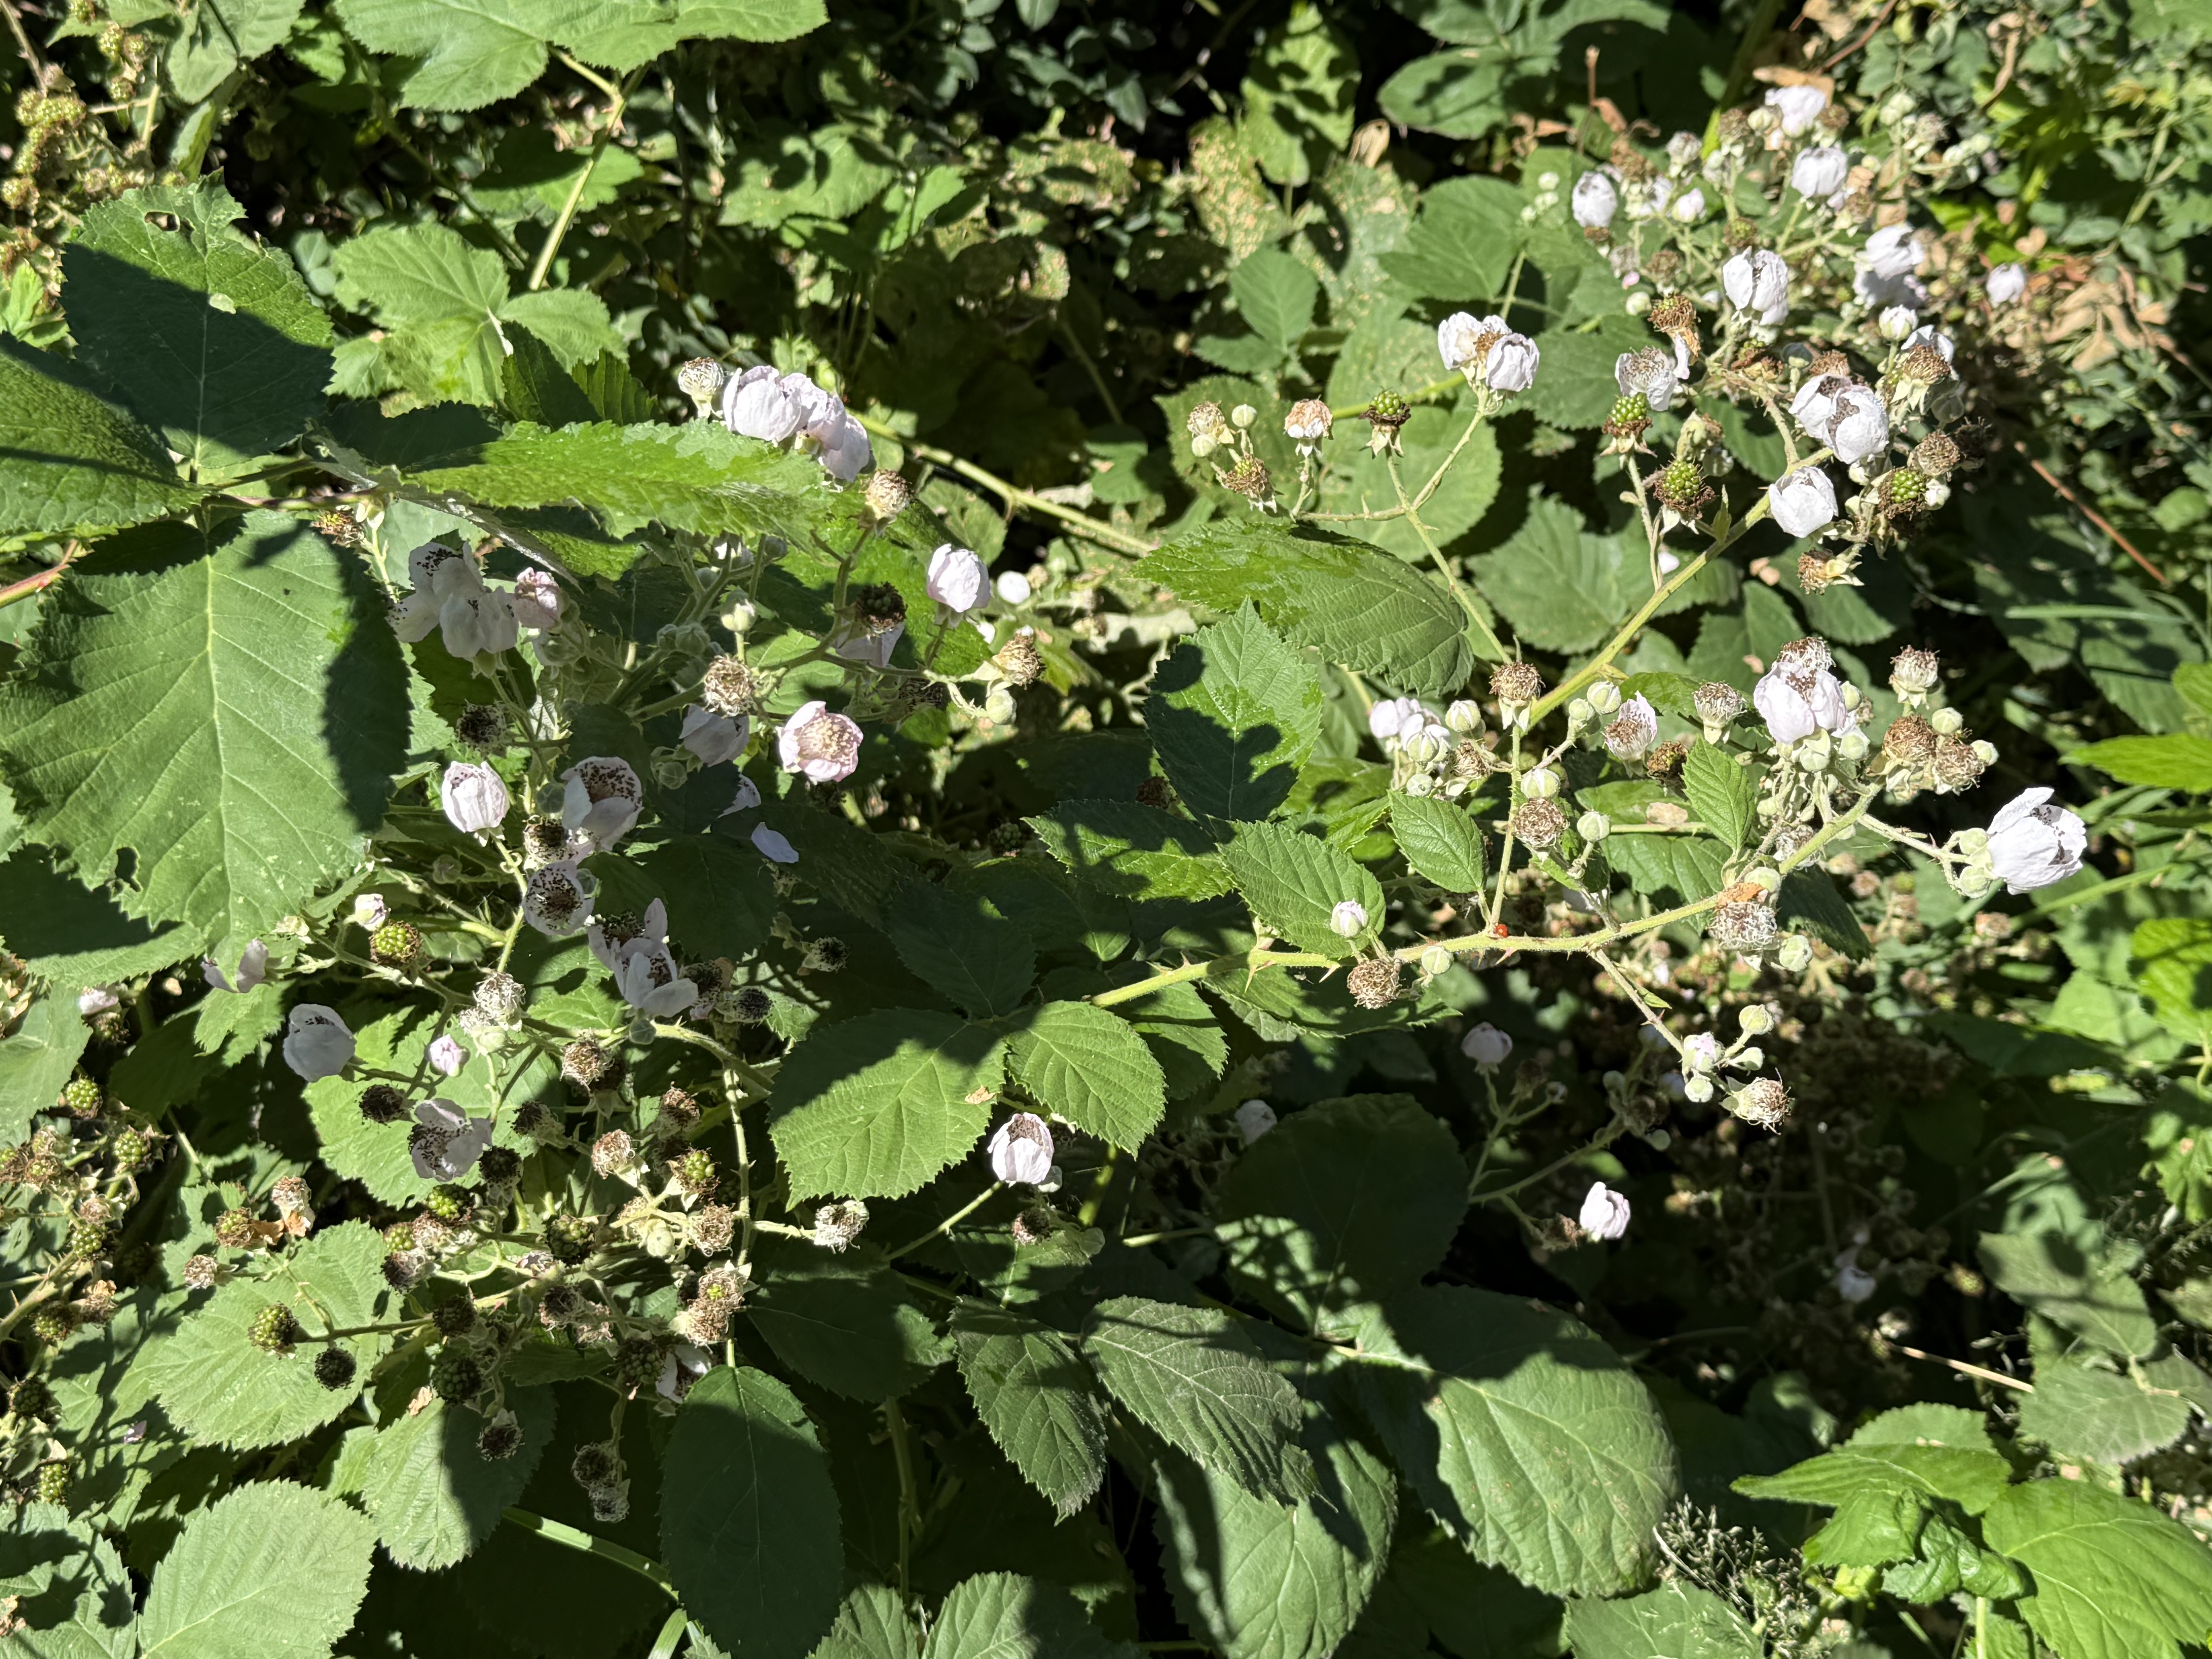
Plate 8. I (kinda) got this one right. This is a wild rose, Nootka rose (Rosa nutkana). This is another plant that waits for an opening in the forest canopy to grow, and then it colonizes like crazy — until the forest canopy catches up with it. Moist but well-drained soil pretty much sums up Carbon River canyon.
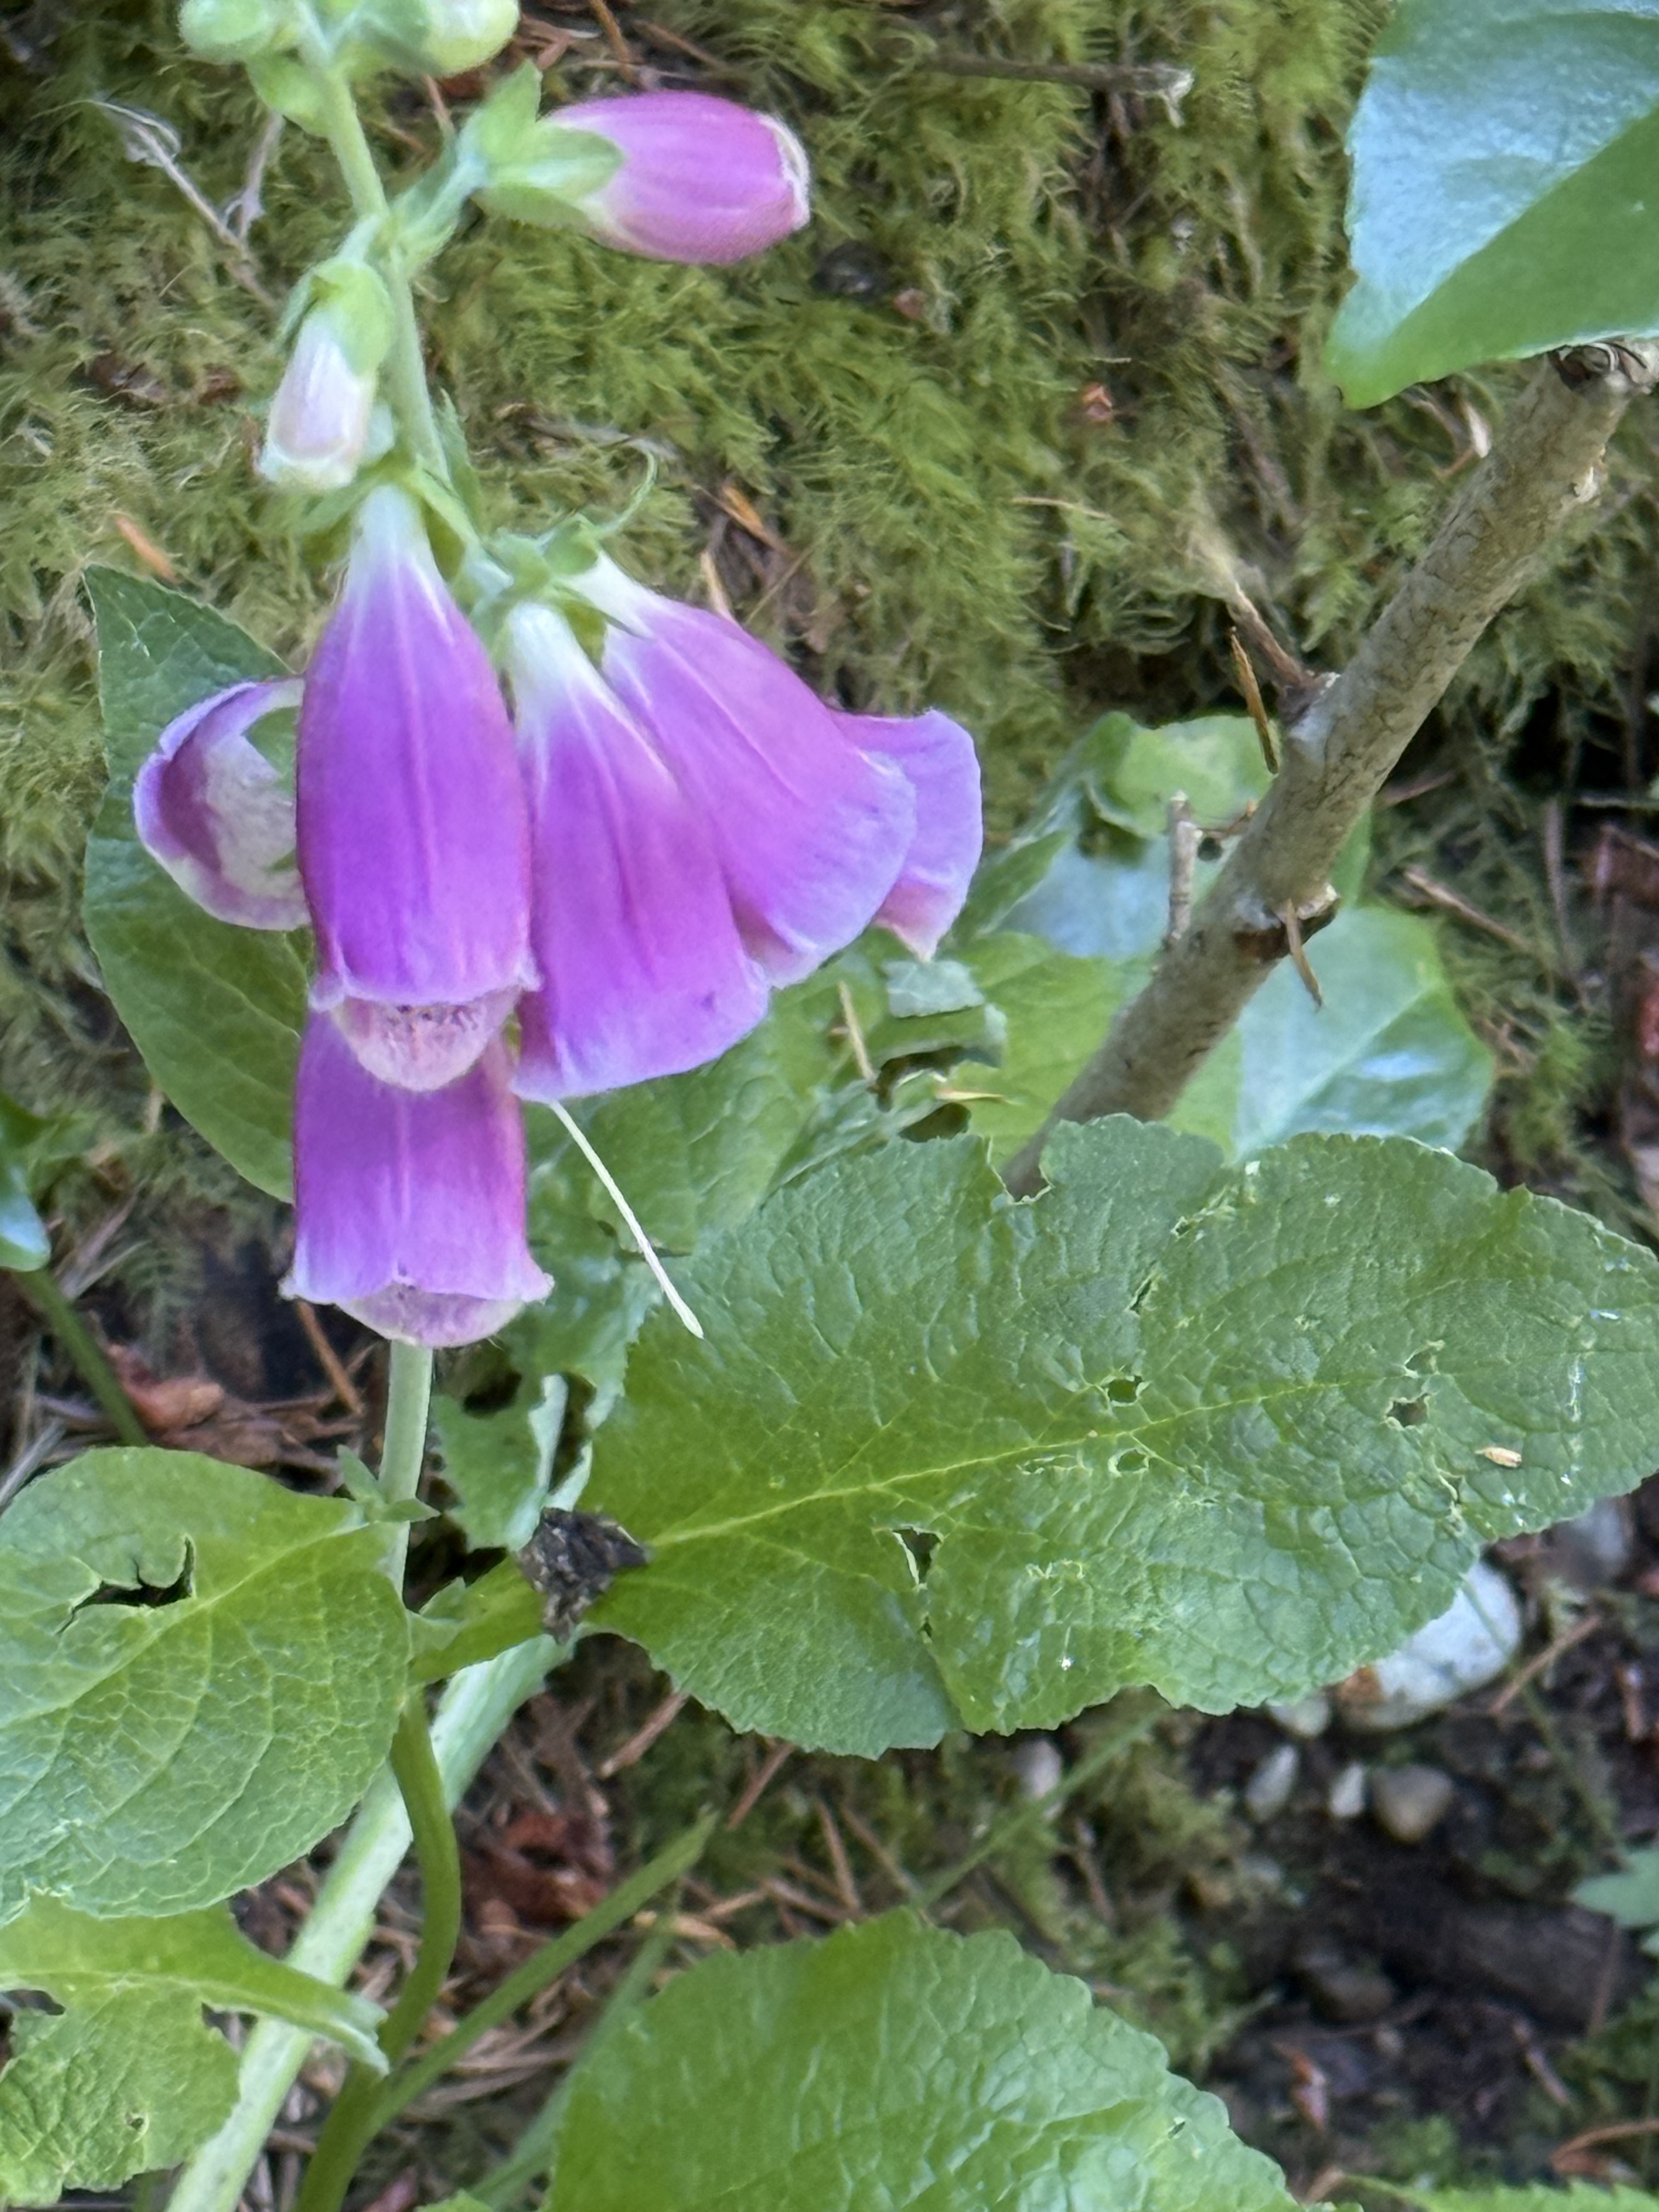
Plate 9. This familiar flower is foxglove (Digitalis purpurea), introduced from Europe; but it is so naturalized that it behaves like a native plant, similar to Cascade penstemon (see Plate 11), thriving in disturbed ground at the edge of conifer forests and in temporarily sunny areas.
Plate 10. Besides white flowers, I am also fixated on thorns; however, I don’t know anything about thorns except that roses have them, as well as many of the shrubs I’ve encountered on my nature walks. This is probably Himalayan blackberry (Rubus armeniacus), an invasive species to Pierce County. I guess that’s why it isn’t called Washington blackberry, or some such. I checked a previous post from Point Defiance, and there it was! Invasion of the forest snatchers.
Plate 11. This purple wildflower is probably Cascade penstemon (Penstemon serrulatus), a native to the PNW. It is what CoPilot calls an ecotone plant — one that thrives where a conifer forest is encroaching on a prairie environment. We encountered it where the conifers hadn’t yet blocked out the sun along the trail.
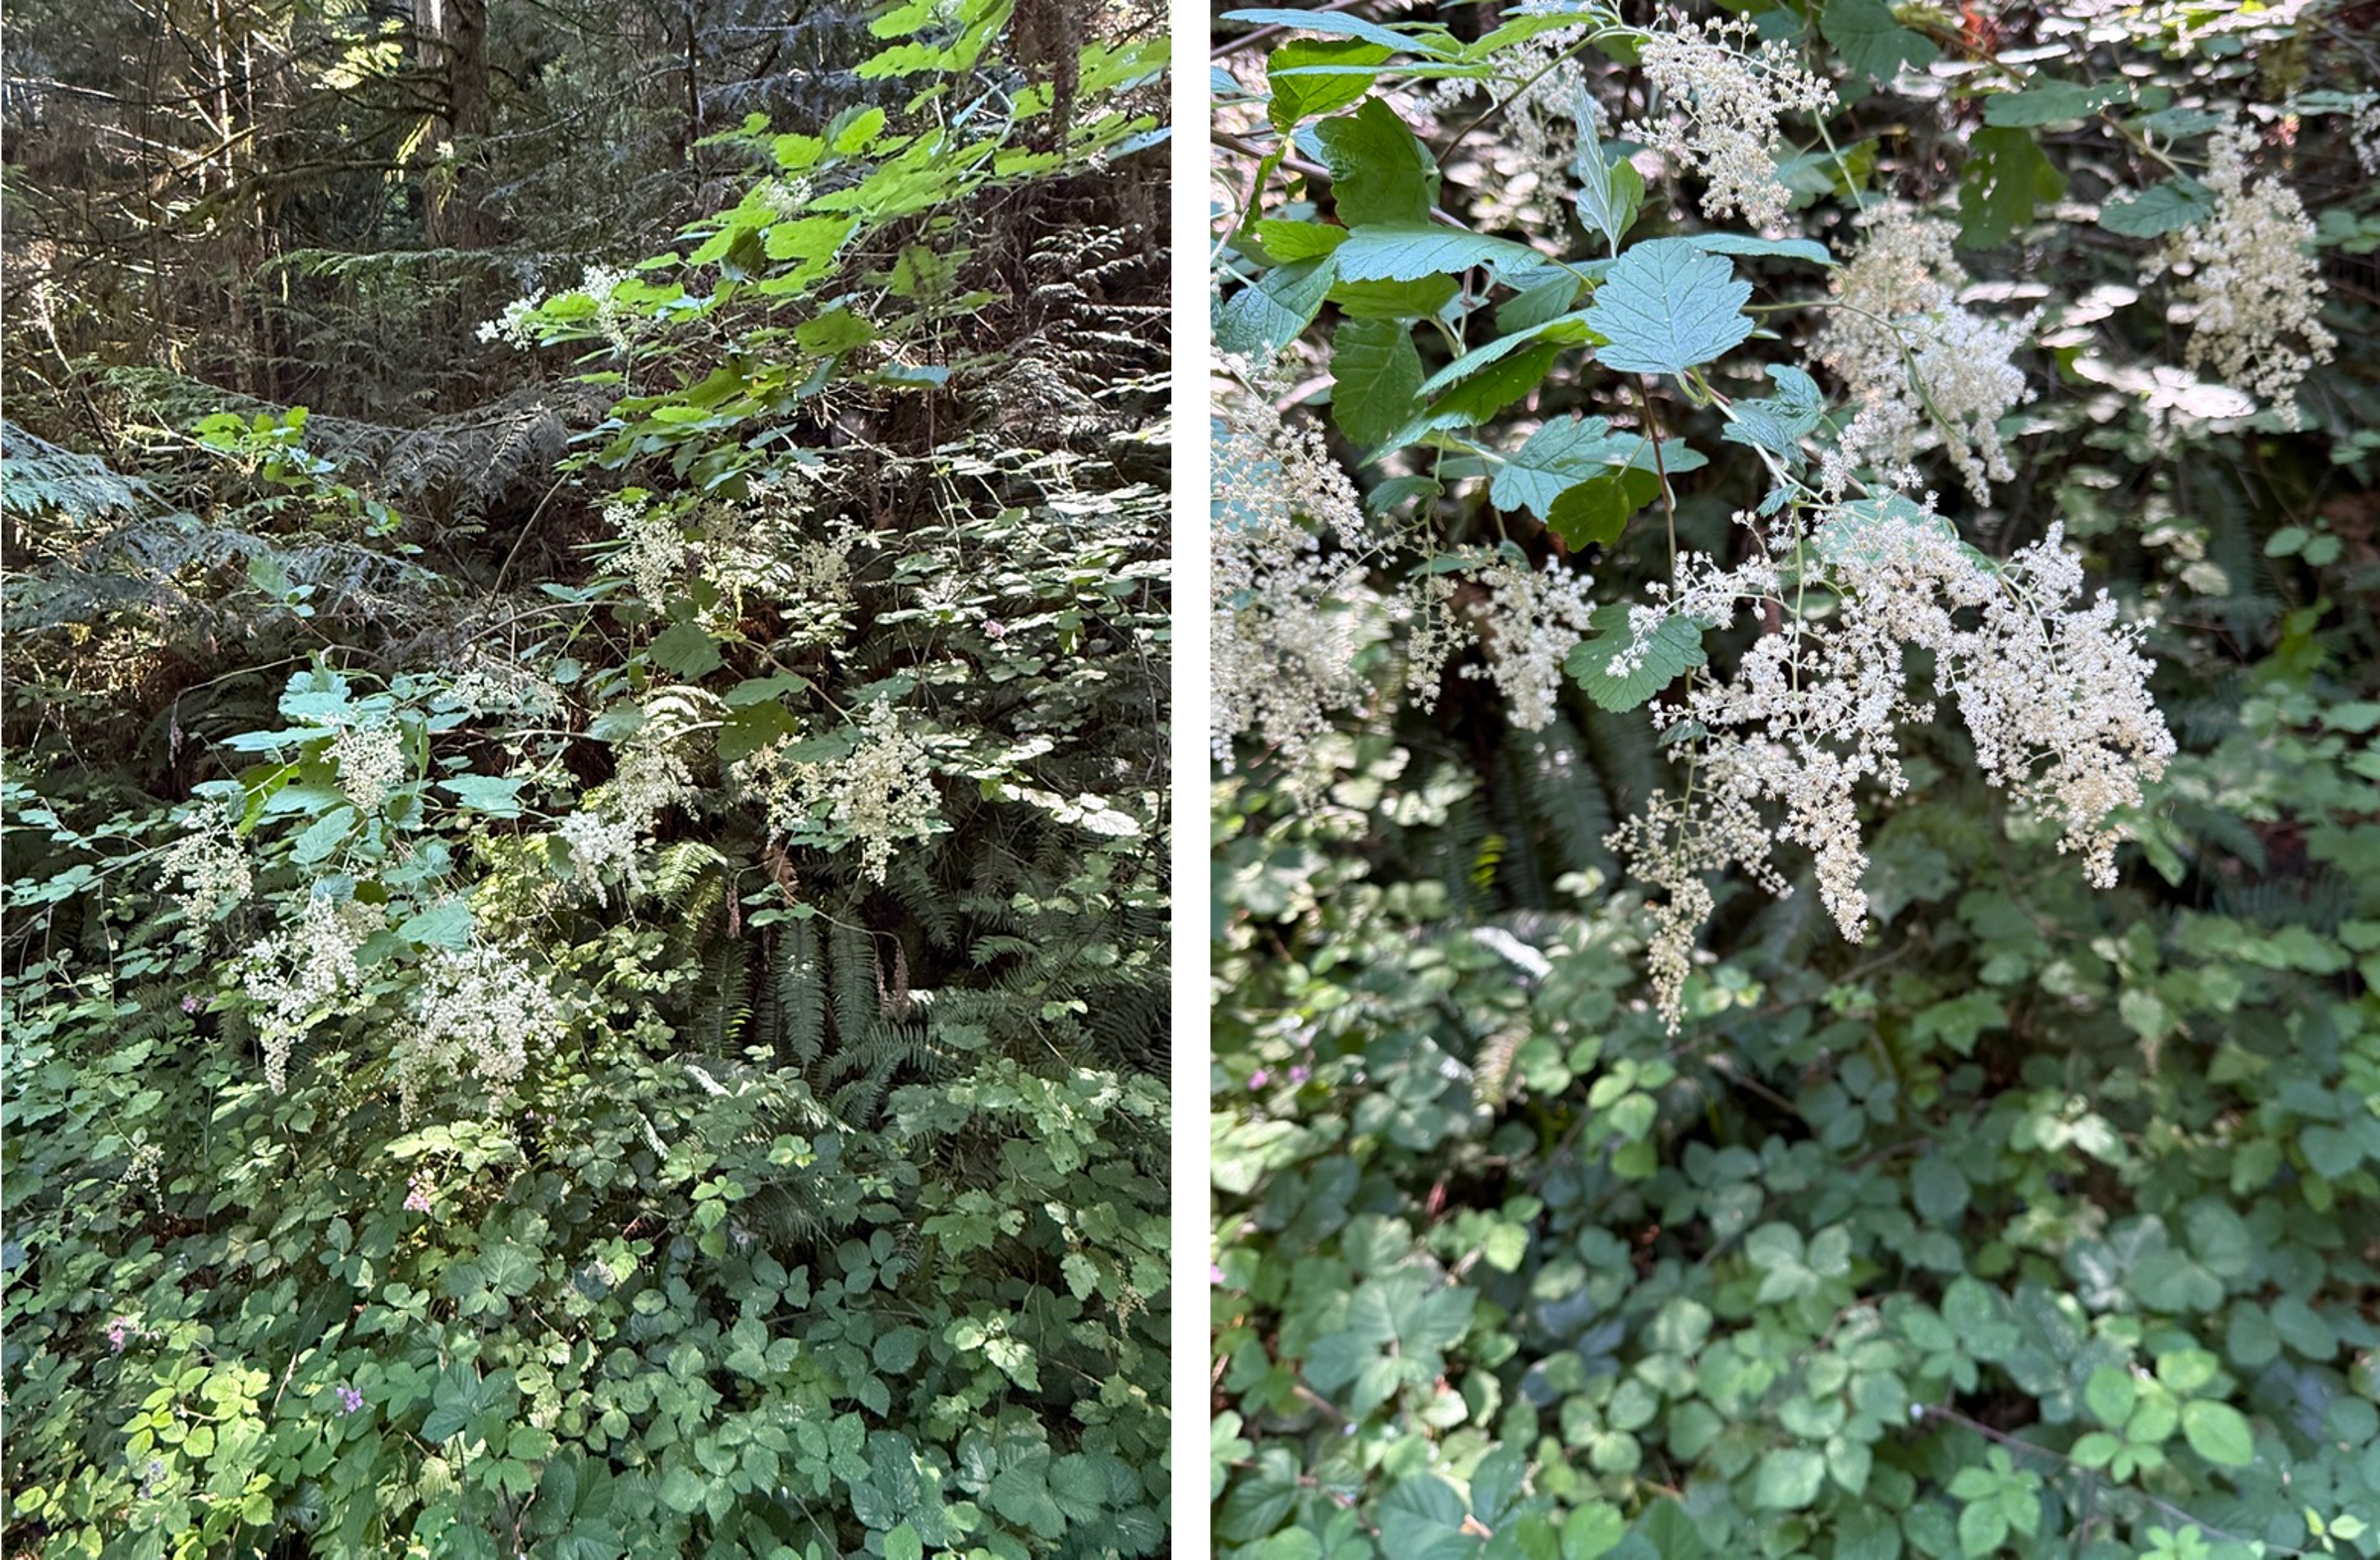
Plate 12. I’m easily fooled by white flowers. This non-woody shrub is False Solomon’s seal (Maianthemum racemosum). It grows in the understory of a conifer forest, which is a good description of Carbon River canyon.
Plate 13. This is the first triplet I’ve seen from a nurse log. These young hemlocks will certainly compete for sun and nutrients. There can be only one survivor.
Plate 14. I thought this was cow parsnip, but CoPilot identified it as ocean spray (Holodiscus discolor). The white flowers were all I needed to see, but this tall, woody shrub (6-12 feet) is completely different from the weed in Plate 4.
Final Thoughts
The only thing I can add to the photos is that Carbon River is part of a transitional ecosystem, not unlike Mima Mounds. I Imagine this borderland environment is also alternating between a lowland/prairie and an upland/conifer forest, depending on conditions. However, much to my disappointment, the plants here were different from those we saw before. Furthermore, there were far more species along the Carbon River corridor. We were fortunate to visit when many of the flowers were in bloom.
I enjoy taking pictures of flora and learning about the ecosystem, but this is too complex for me. I’m only a simple geologist.
Hood ornaments through the ages: A visit to Lemay–America’s Car Museum
This wasn’t my usual visit to the local automobile museum. Instead of glimpsing the big picture, as seen through the evolution of car bodies from wagons to sleek, steel superstructures sitting on rapidly changing chassis, I am going to take a rather myopic view of automobile development in the twentieth century. Cars and airplanes co-evolved once lightweight, powerful motors were developed; but, unlike aircraft, autos weren’t substantially influenced by wars. In fact, the redirection of civilian manufacturing to wartime needs was an impediment to progress in land transport. Nevertheless, similar lofty ideas influenced automotive design, especially their adornment with signs of the modern, technological age.

Inspiration for this post came from my son, whose attention to detail constantly reminded me to focus on the details. Thus, this post begins with a ~1903 Studebaker electric buggy, which has no adornment despite being painted an eye-catching red.

By 1913, International Harvester designed a logo for the radiator of this cargo wagon.

Pierce Arrow added a bit of flair to the insignia. A good part of this post will focus on the development of radiator caps, from fancy adornment of the cap, which was required to add water for the internal combustion engine, to …. let’s see what happened.


Graceful designs appeared early, as in this 1920s Cadillac. I think the flowing pattern behind this woman’s head represents water as she burst from the surface of the sea, as suggested by the fluted base. She is taking flight.

Lincoln turned to the graceful greyhound on the radiator cap to imply beauty and speed. Note the lean ribcage, coincidentally similar to the louvers used for cooling in early models.

The Nash corporation created the Metropolitan car to compete in European markets during the 1950s. Small, economical, but stylish, it nevertheless had an ornate hood ornament that was no longer attached to the radiator cap.

No long hair streaming in the wind here. This idealized female figure wears her hair in a bun and is … I don’t know what she’s lying on, but it looks like some kind of jet pack.

Chevrolet caught my attention because of the evolution of their logo. This 1940s grill looks like an idealized shield, i.e., coat of

By the 1950s the Chevrolet “coat of arms” had become wider to fit the full-body designs made possible by improvements in metal working, but they still added meaningless details like the crown icons on this design. Accompanied by a V that filled that gap in the wider hood.

By the 1960s the emblem was surrounded by an ellipse, which made it easier to attach it to the larger grill required for more powerful engines.

This 1950s Ford integrates several elements from different eras: The name of the model, the stylized coat of arms, and an icon representing the jet age–the hood ornament is reminiscent of the iconic F86 Sabre, the hero of air combat during the Korean conflict (it was never officially declared as a war).


This 1950s Oldsmobile integrates similar emblems: It adds a map of the Western Hemisphere, and updates the fighter jet to a bomber.

Mercury takes another twist by updating the old “coat of arms” to a minimalist Mercury icon (the head wearing wings on his hat), combined with a stylized M to fill that wide hood.

This 1930s Plymouth attempts to represent a mythical past by including a Valkyrie taking flight with what looks like a Mayflower ship–probably homage to the name, “Plymouth”.

This 1950s Ford looks like it has a pistol attached to the hood.

The color scheme on this 1930s Ford may not be original, but it is obvious that Ford wanted to advertise that this car was powered by an eight-cylinder motor, probably the famous flathead V-8 which they introduced to the working class.

Ford purchased Lincoln and claimed their greyhound, added a V8 emblem to make it clear this was NOT a straight eight, which was a powerful but problematic motor, and glommed their still-in-use emblem onto the grill of this late 1930s/early 1940s era car.

This early 1930s Ford dropped the decorative, exposed radiator cap but included a support bar to get the message out that this was a V-8 automobile.

When pressurized cooling systems were introduced in the early decades of the twentieth century, it was necessary to monitor water temperature, but in-dash gauges hadn’t been invented yet. This radiator cap incorporates a thermometer. This photo shows the side that the driver didn’t see: in a time before owner’s manuals, it tells the operator what the proper temperature range is. The other side, which faces the driver, shows hot water filling a bulb.

This temperature gauge is the only example I saw of a biplane, and it’s supplied by the instrument manufacturer.


According to ChatGPT, this youth is drawing a bowstring on the radiator cap of a Pierce Arrow (circa 1930). Note the bow he’s sitting on. I don’t quite understand the position, but I’m not an archer. It makes more sense than a child about to ride a slide, and it explains the curved, cylindrical object he’s sitting on. Who would’ve thunk…

The Buick Riviera, introduced in about 1962, had this unimpressive R set in a groove in the hood.

A couple of stylistic changes to Lincoln in the 1940s: The greyhound was swapped for what looks like a ball and bat; and the coat of arms became a body-sized shield.

The driver has to read this temperature gauge from behind the steering wheel. The strange symbols around the edge look like fish bones or trilobites …

Bentley wanted to be certain that people next to you at the traffic light knew how wealthy you were.

This 1950s car mixed a jet aircraft symbol with knight holding a shield.

This 1940a hood ornament pre-dated jet aircraft, but that androgynous figure is going pretty fast…


The proud owner of this 1920s Buick receives a crown (of thorns?) from an angel.


I wonder what this wading bird is looking for? According to ChatGPT, it is the Packard “Goddess of Speed”, an art deco representation of coiled power about to explode. I guess people looked at things differently in the 1930s…


International Harvester incorporated only their iconic IH symbol on the Scout’s hood in the 1960s, but culture doesn’t wait for corporations to add their own “art deco”. I don’t know how much more of this I saw at the museum, including all those Motometer temperature gauges…

This 1950s Pontiac Bonneville sports a jet on each fender instead of only one.


What the hell? CoPilot (aka ChatGPT) thinks that the weird arrowhead on top was just that–meant to imply as fast as an arrow. That’s a long way from an airplane or valkyrie. This bizarre hood ornamentation might explain why Hudson went out of business in the 1950s.

Since Earth doesn’t have any rings, this 3D circle must represent a satellite’s orbit. Pretty advanced for the mid-1950s. Too bad Oldsmobile didn’t make the cut when it was time to downsize GMC in 2004. Bummer.


They barely had room for the coat of arms between the jet intake and the aircraft on the hood on this 1950/51 Studebaker Champion. Despite the optimistic ornamentation, this car had a six-cylinder with about 100 hp. Bummer.


Mercedes added a badge for those who weren’t familiar with its iconic star.


There’s a lot going on here: a pair of “8”s for, presumably, the straight-eight engine that was a real powerhouse in the 30s; wings; an explicit acknowledgement of both Dodge boys; a Star of David; and a set of pipes, maybe for an organ, on the radiator cap.
Final Thoughts
If you made it through this long post, I hope you enjoyed the journey as much as I did. I have never examined one aspect of the evolution of automobiles in such detail before. It was worth it, even if hood bling isn’t as exciting as engines, brakes, body styles, and all the other mechanical components.
Two concepts seem to have been central during the twentieth century: having a coat of arms was probably an extension of custom-made coaches to horseless carriages; and associating cars with flight, either through birds, mythic creatures, or airplanes. The combination was often ludicrous but always entertaining. The phrase, “They don’t make them like they used to,” is nowhere more applicable than to stylistic choices in bodies and the chrome trim they sport.
Sights around Lake Washington
It promised to be a beautiful day, so we decided to take a look at Lake Washington, just east of Seattle. This elongate water body was carved by glaciers between 19 and 16 thousand years ago. It was part of Puget Sound until about 5700 years ago, when river sediment isolated it from the sea, allowing it to become fresh water. The original outlet at the southern end wasn’t good enough for early American settlers, so they got approval from Congress to construct a canal with locks to connect Lake Washington to Puget Sound, a drop of 20 feet in elevation. As fans of technological progress, we wanted to see this for ourselves.
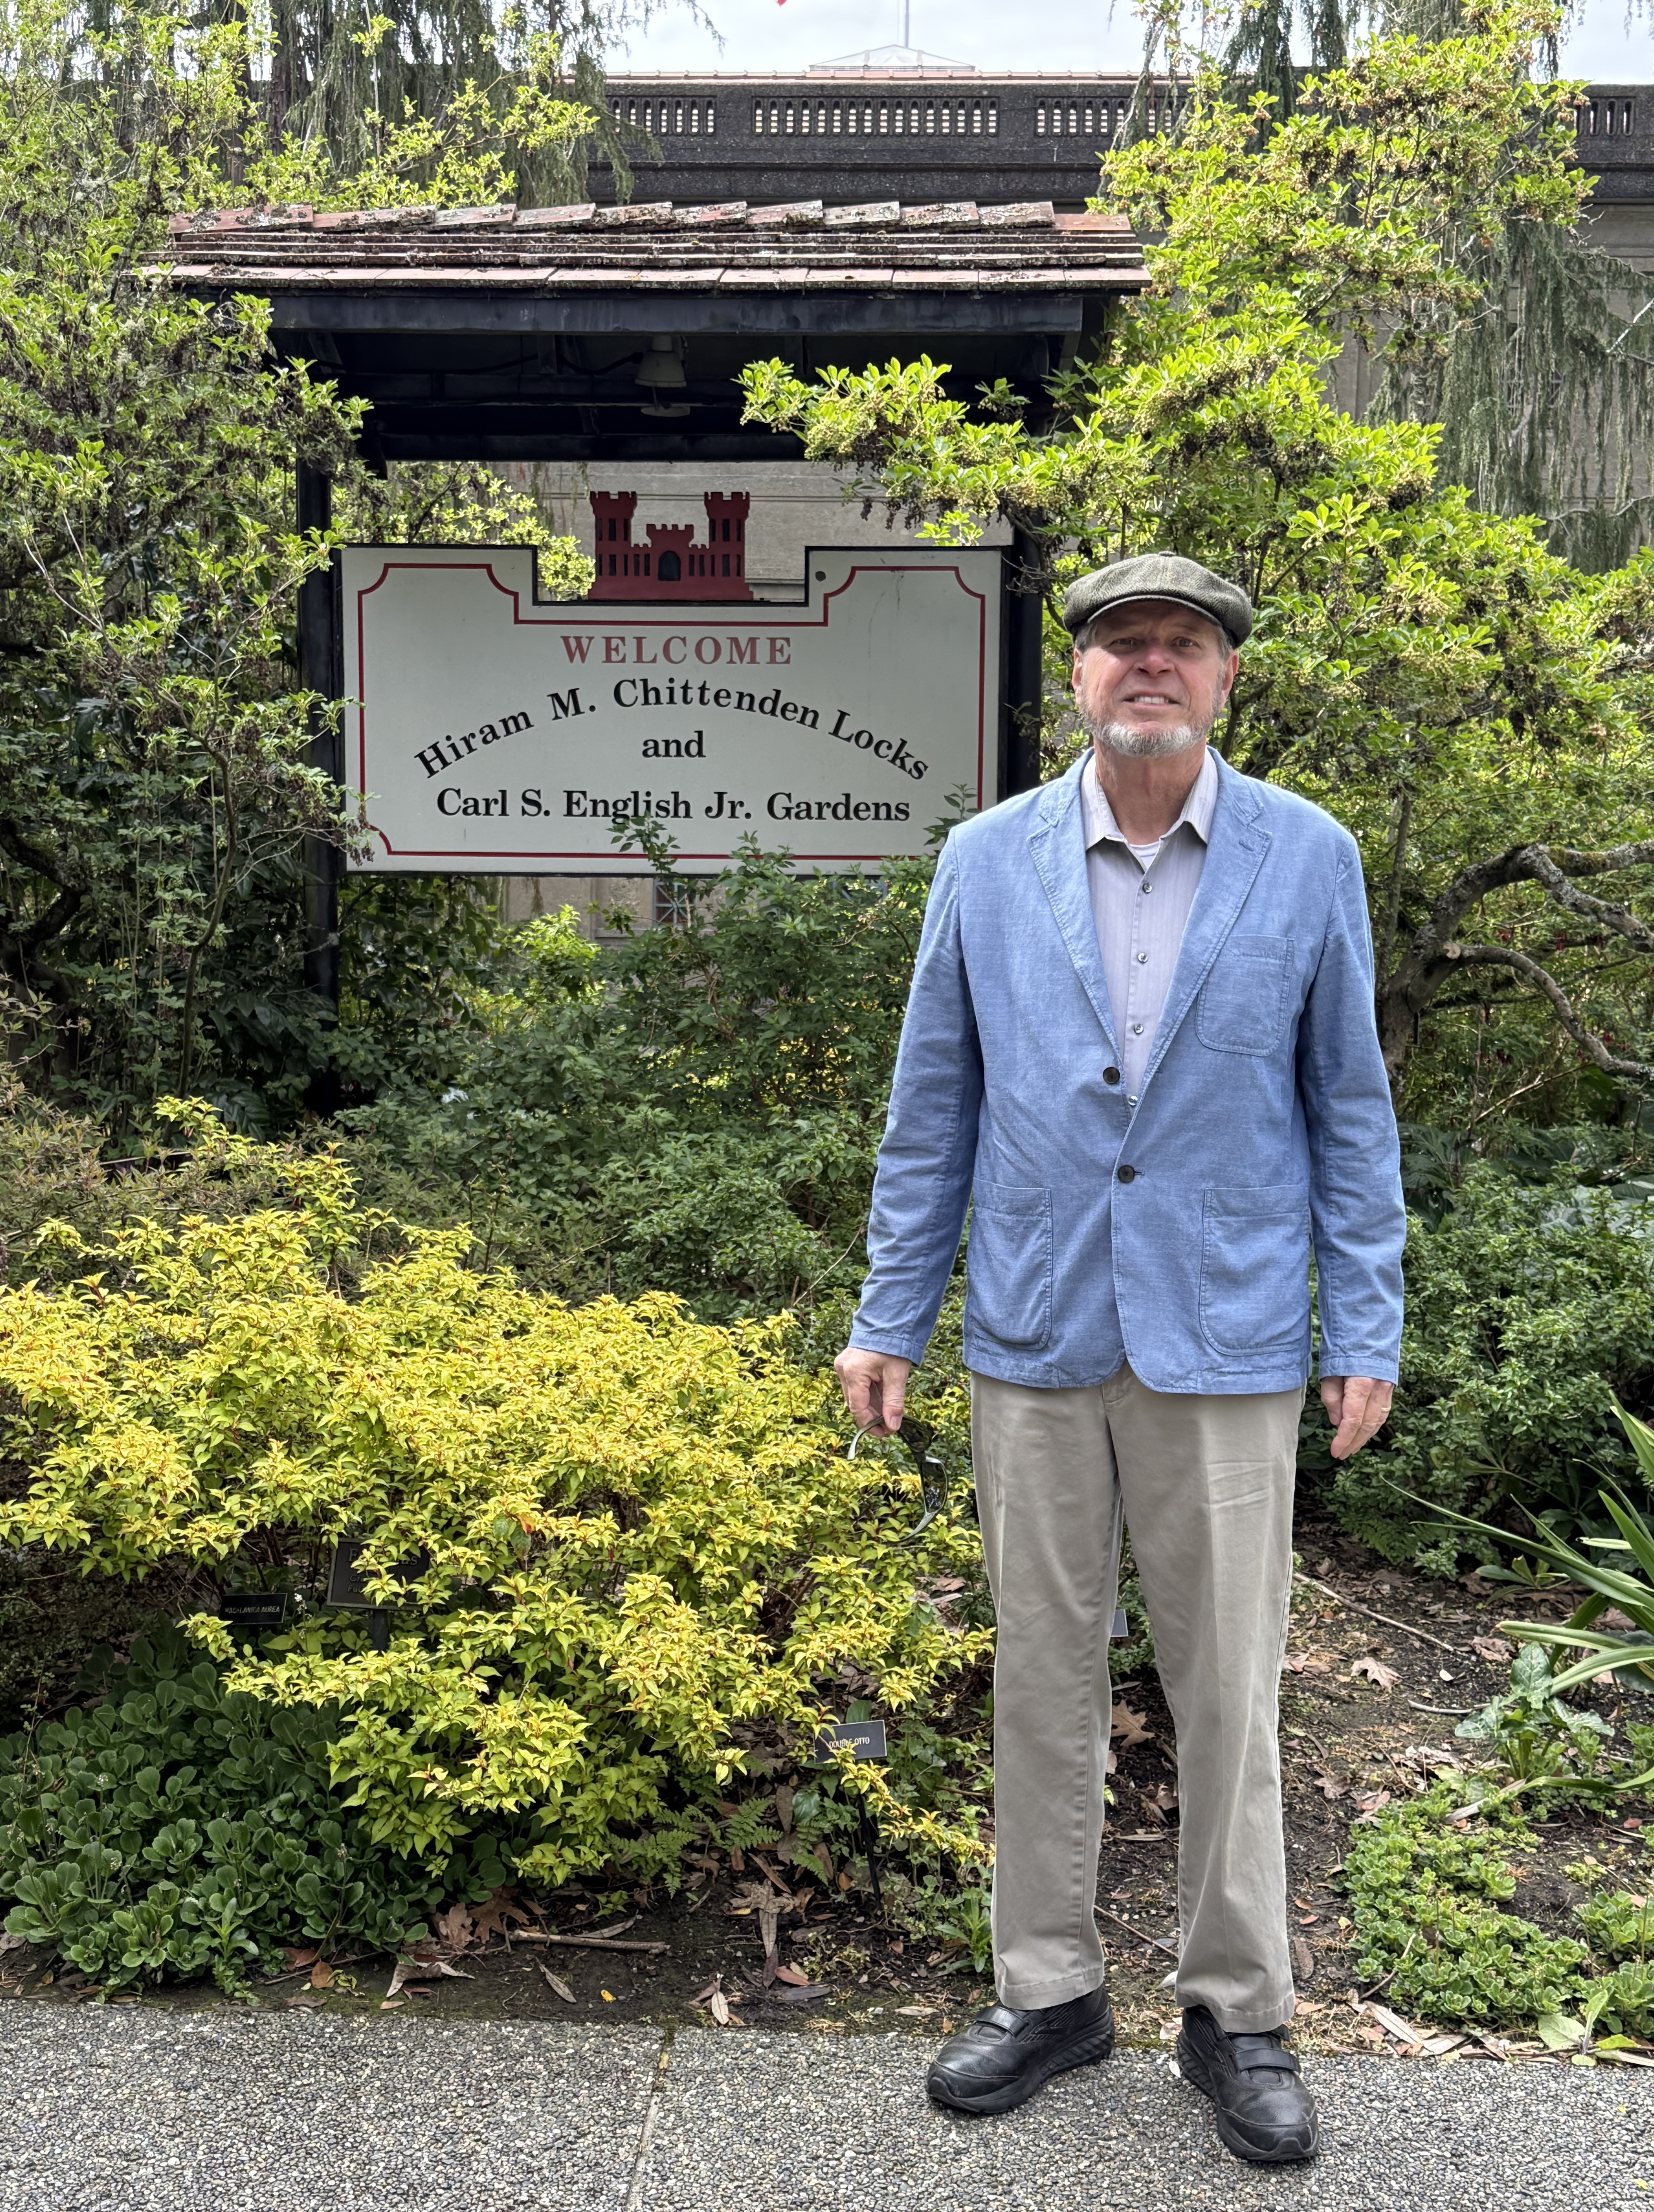
The Army Corps of Engineers began construction of a set of locks in 1911, under the supervision of Hiram M. Chittenden. As the sign proclaims, his name remains associated with them; however, they are more commonly known as the Ballard Locks after the city where they were built. The site includes a number of stone-faced buildings and has since come to include a botanical garden.
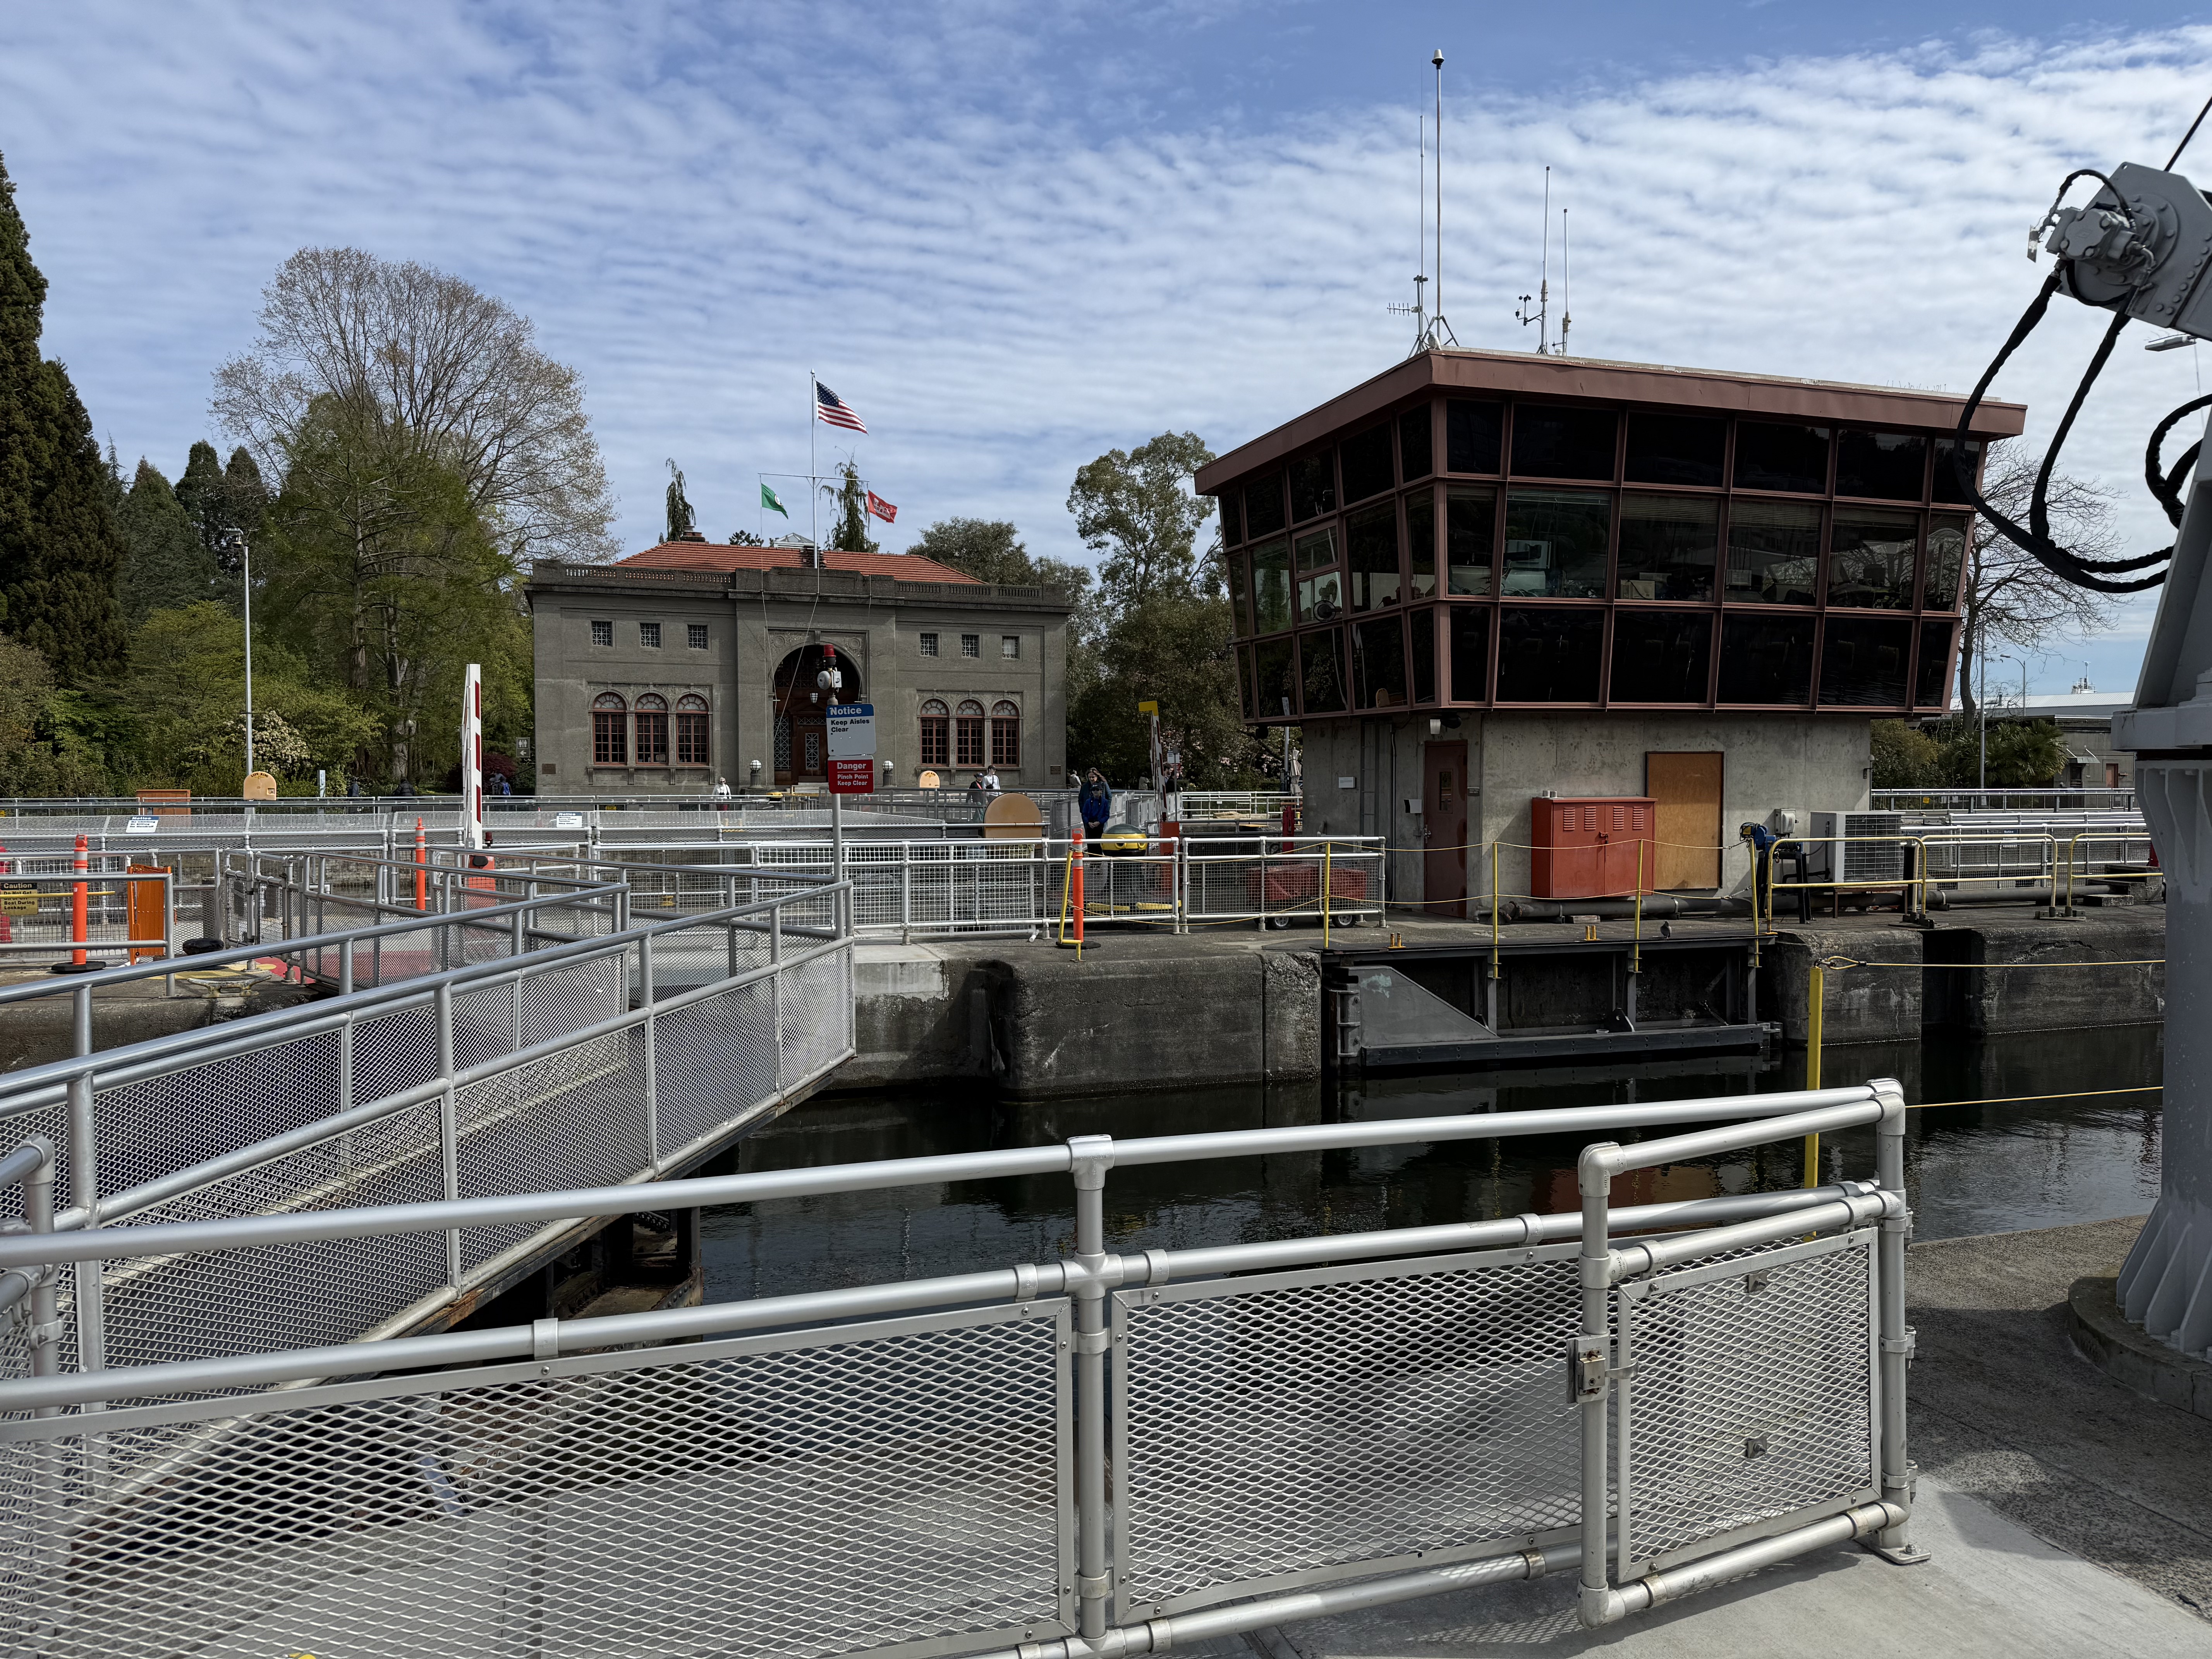
There are two locks, one for larger, commercial vessels (on the other side of the control building) and a smaller lock. The larger one has two sets of gates to accommodate barges.
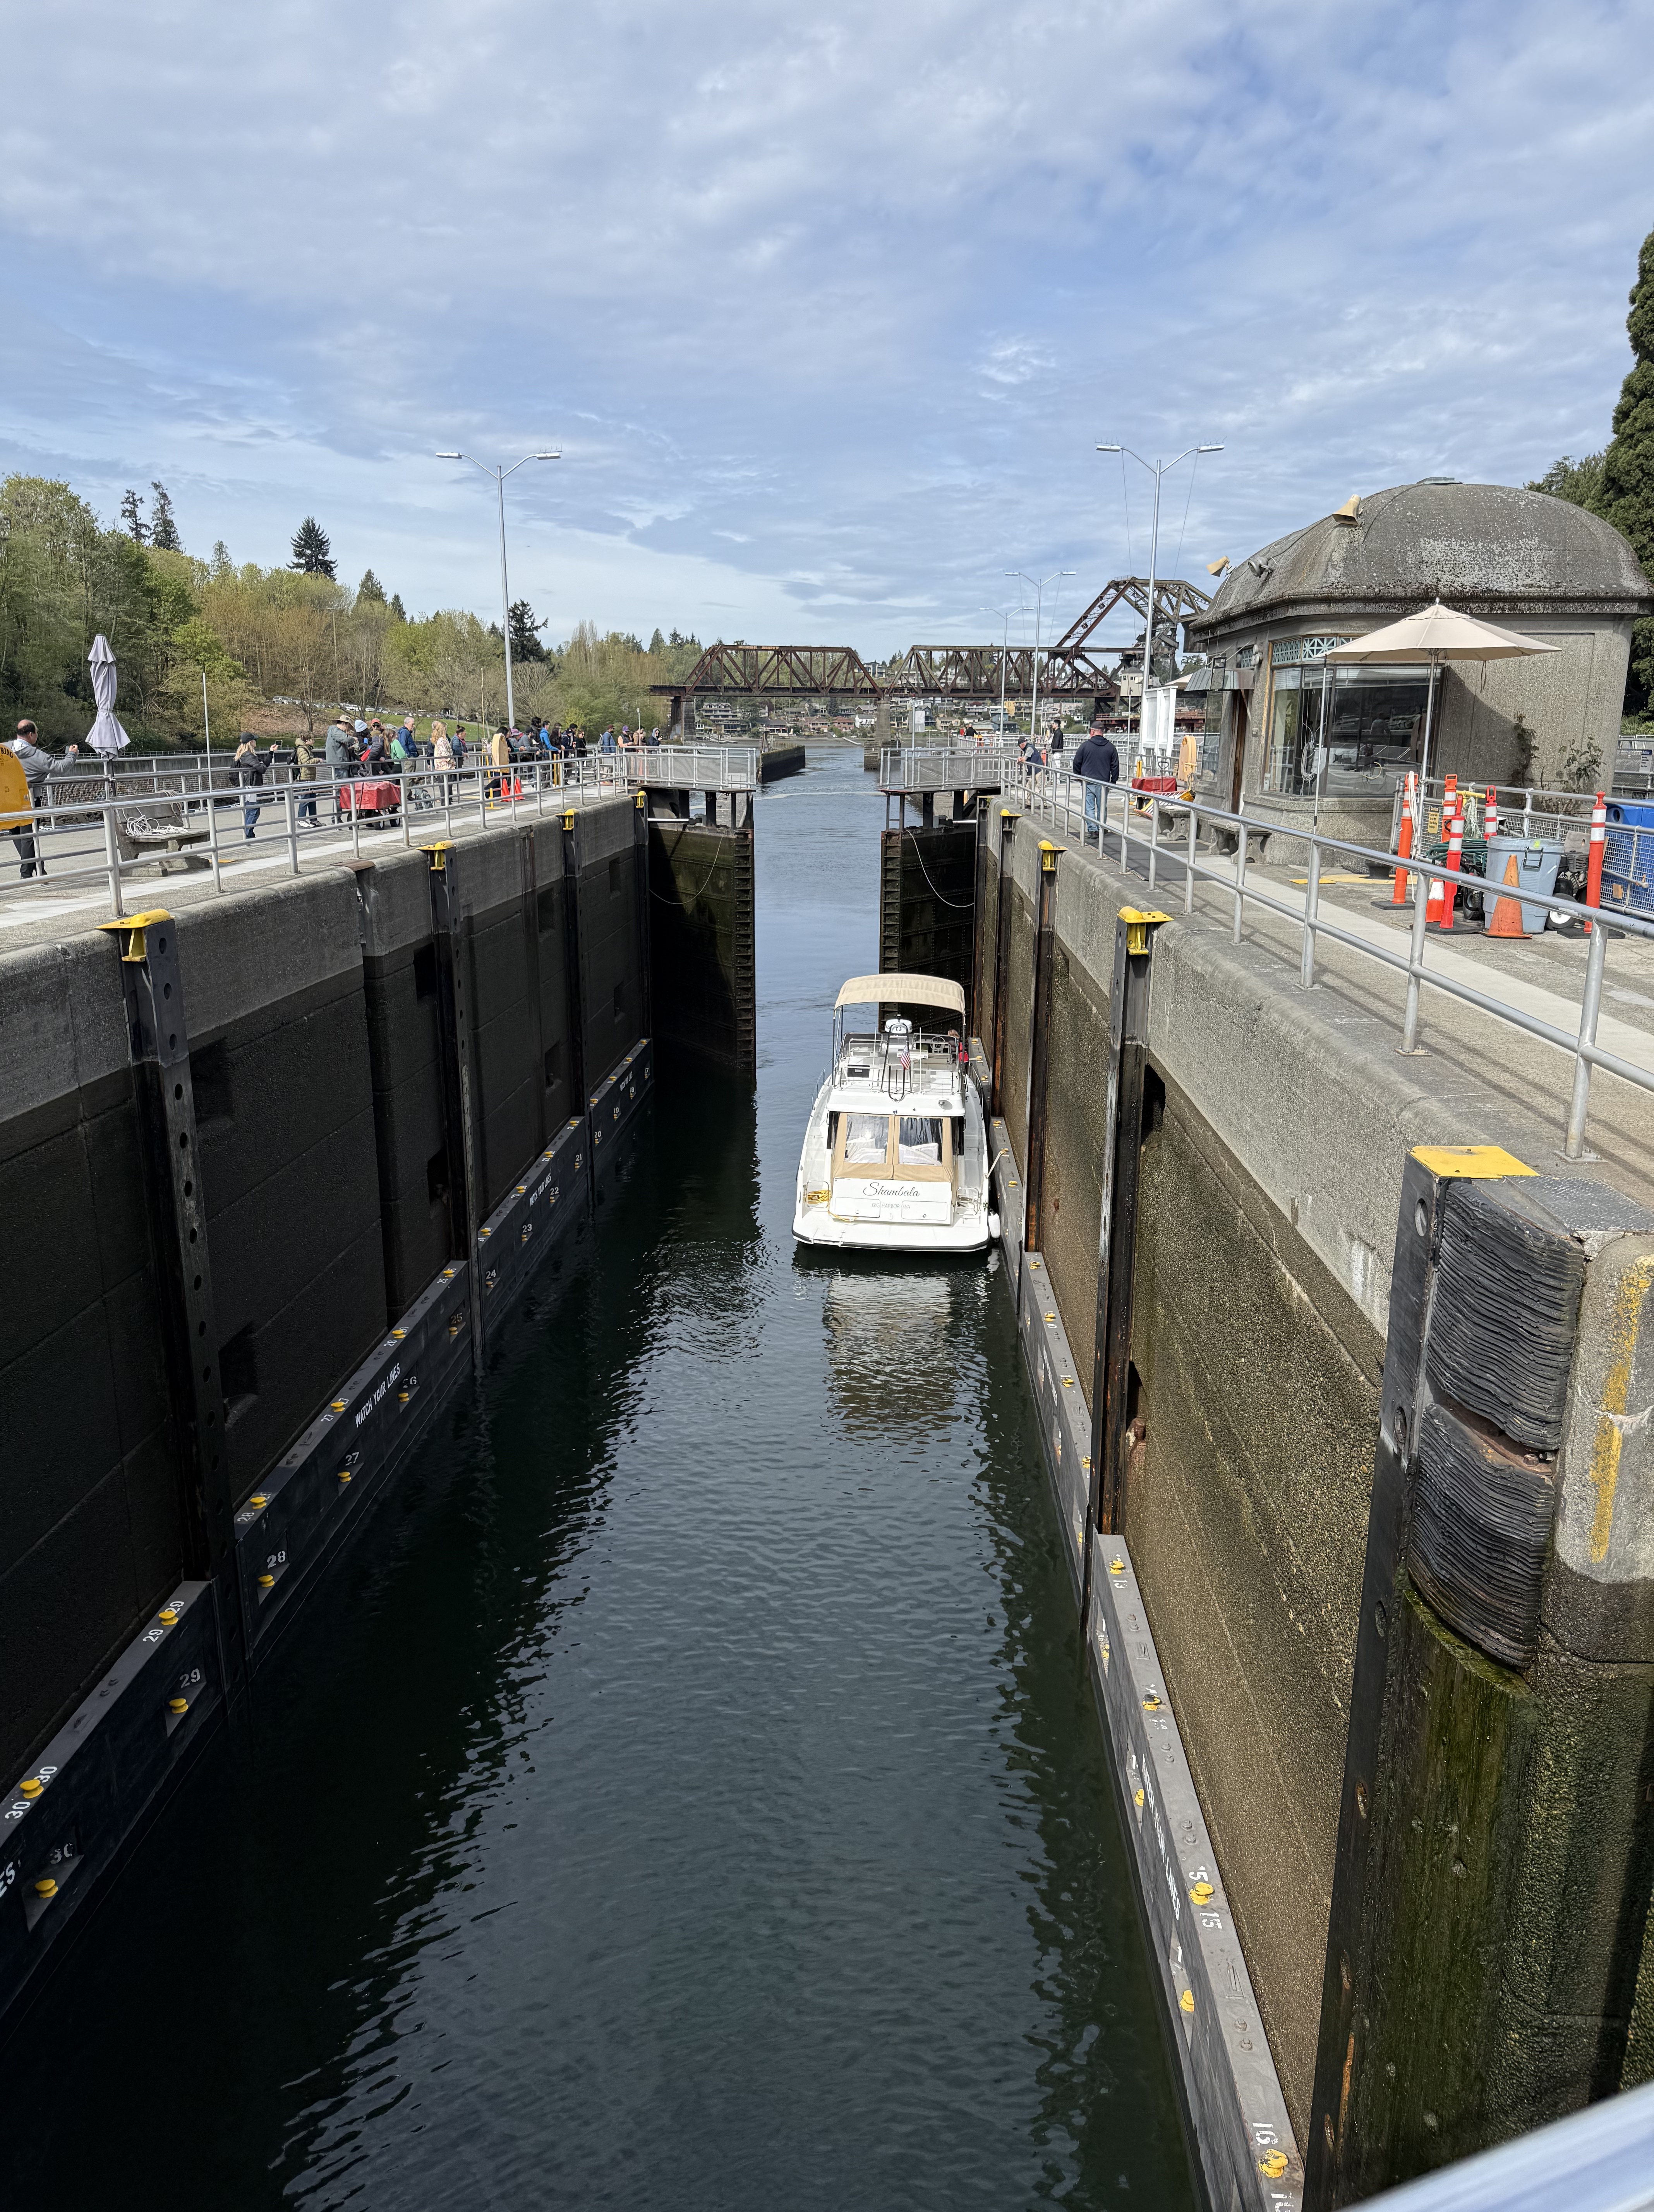
Several private boats used the lock while we were there. It takes maybe 15 minutes for the water level to equilibrate whether going upstream or downstream (towards Puget Sound).
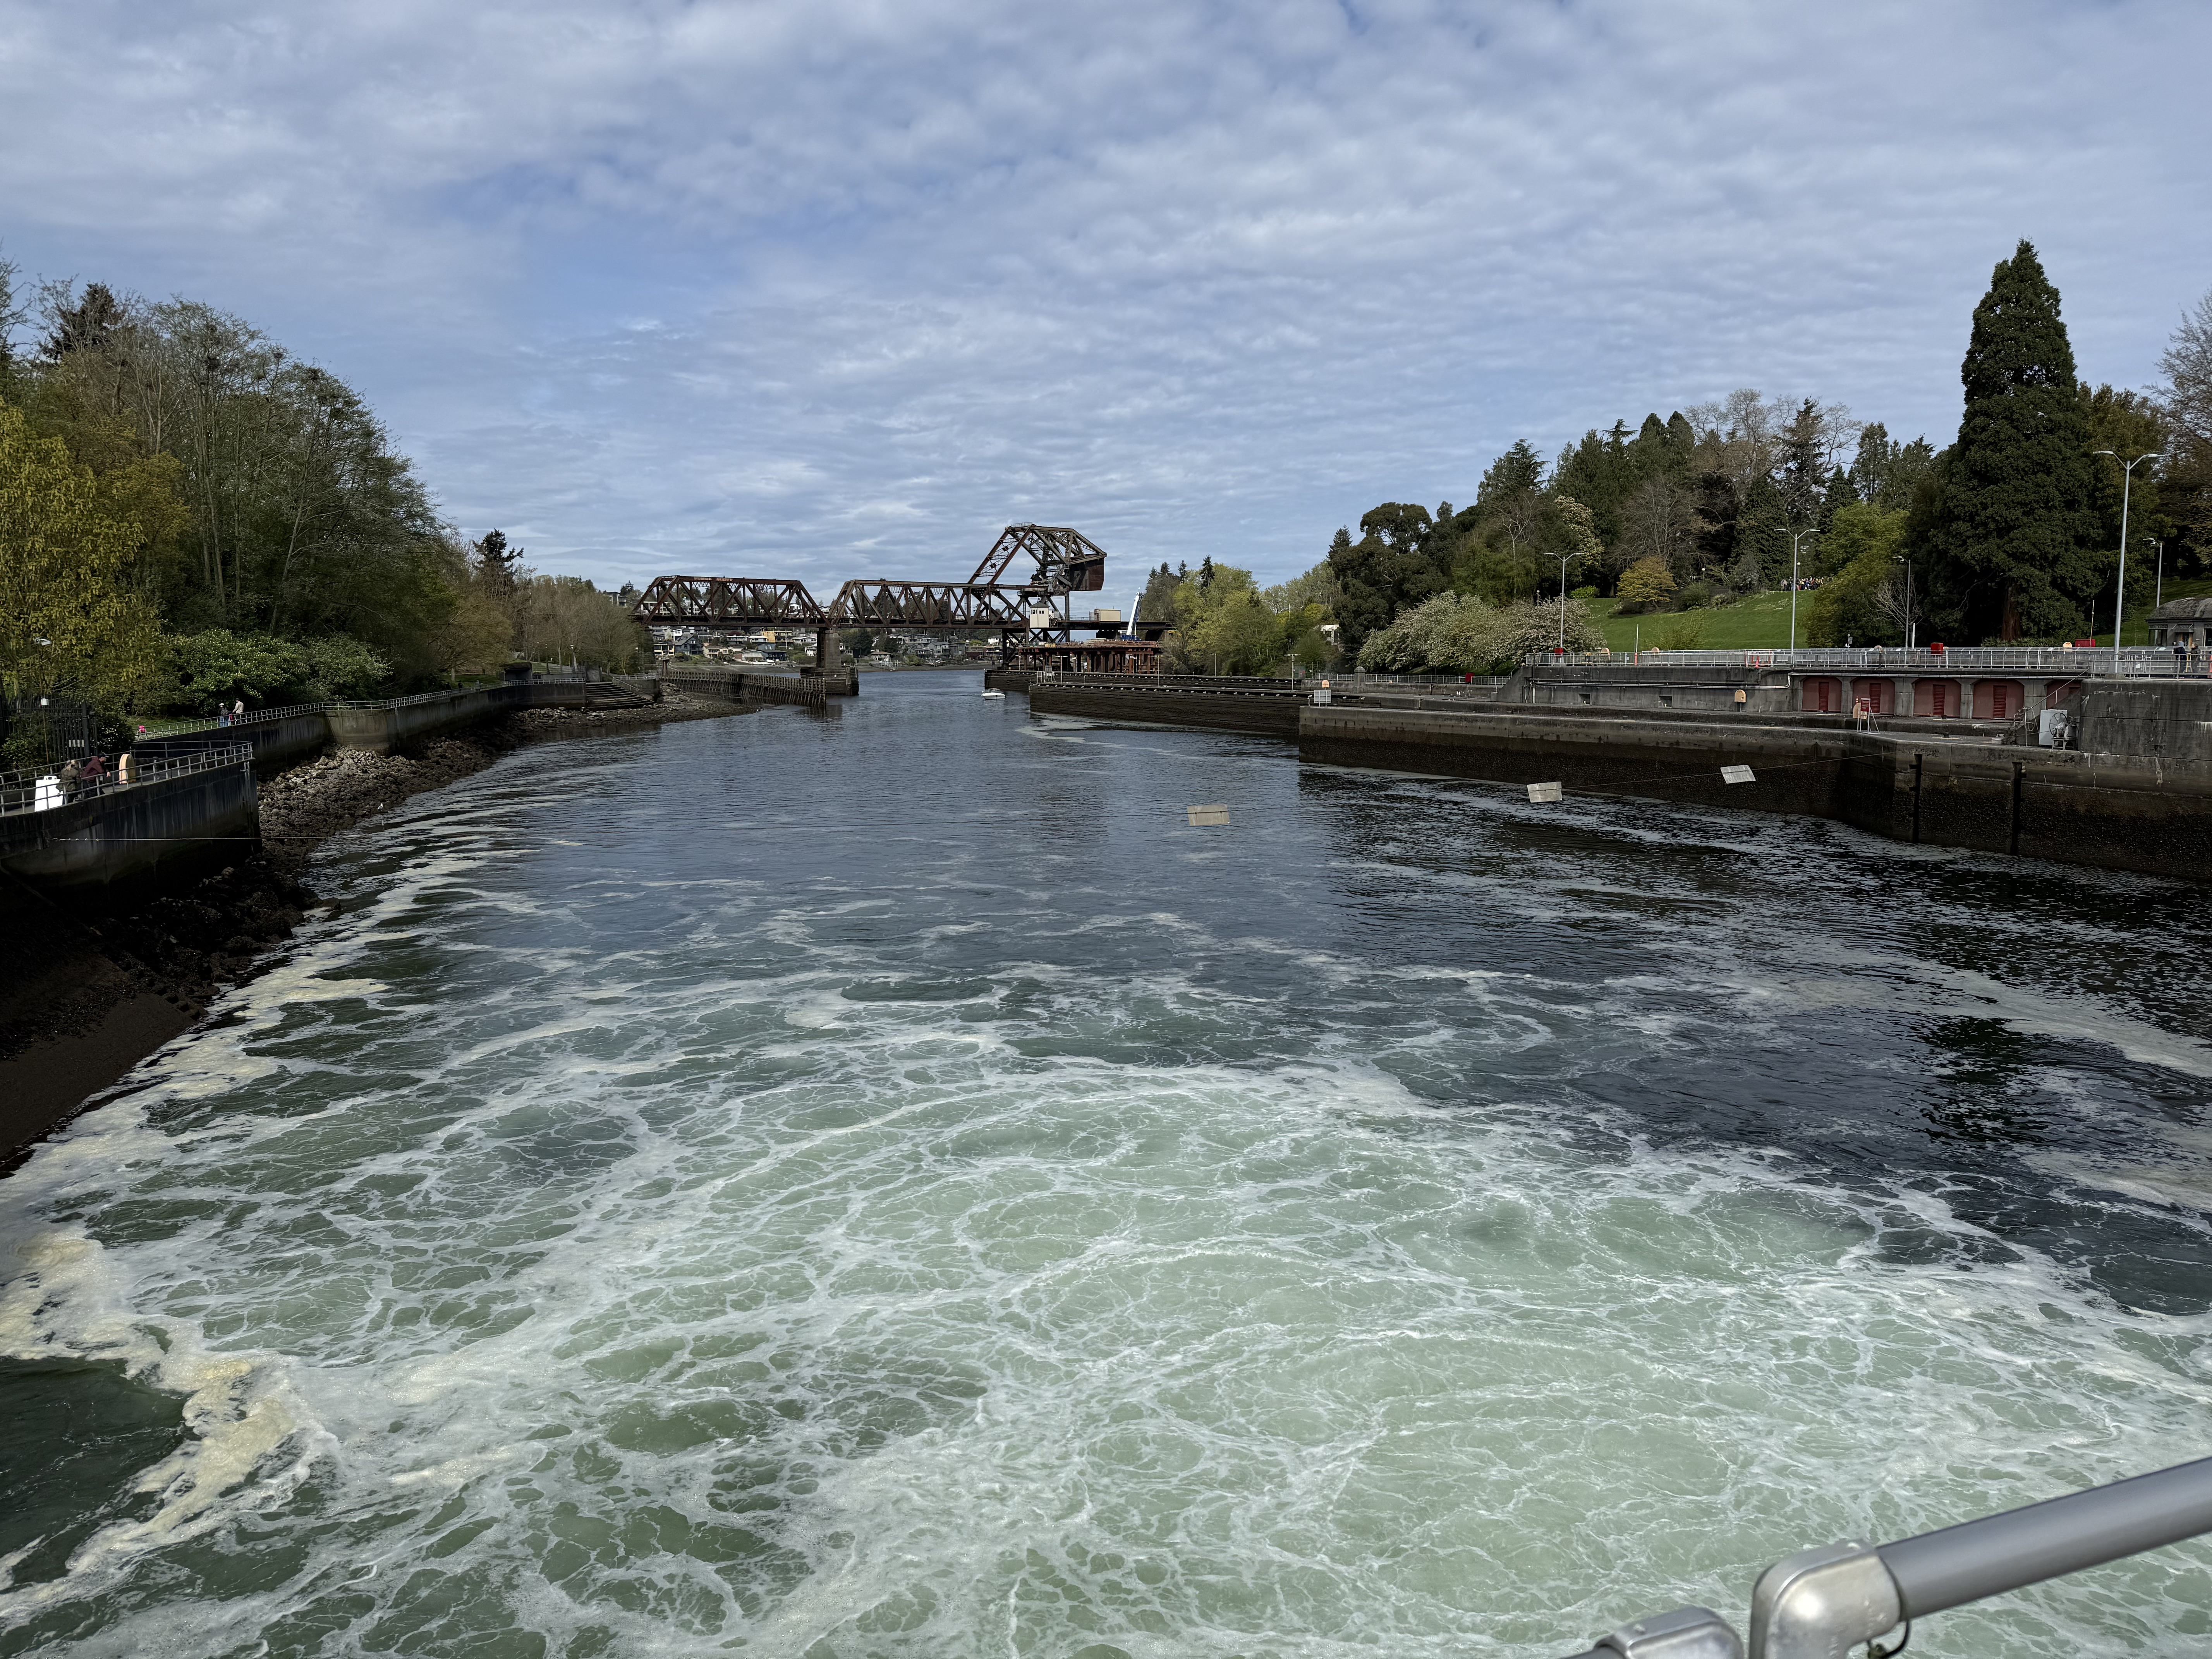
The spillway was partially open and the turbulent flow created a very dangerous scene. I wouldn’t want to fall into that water.
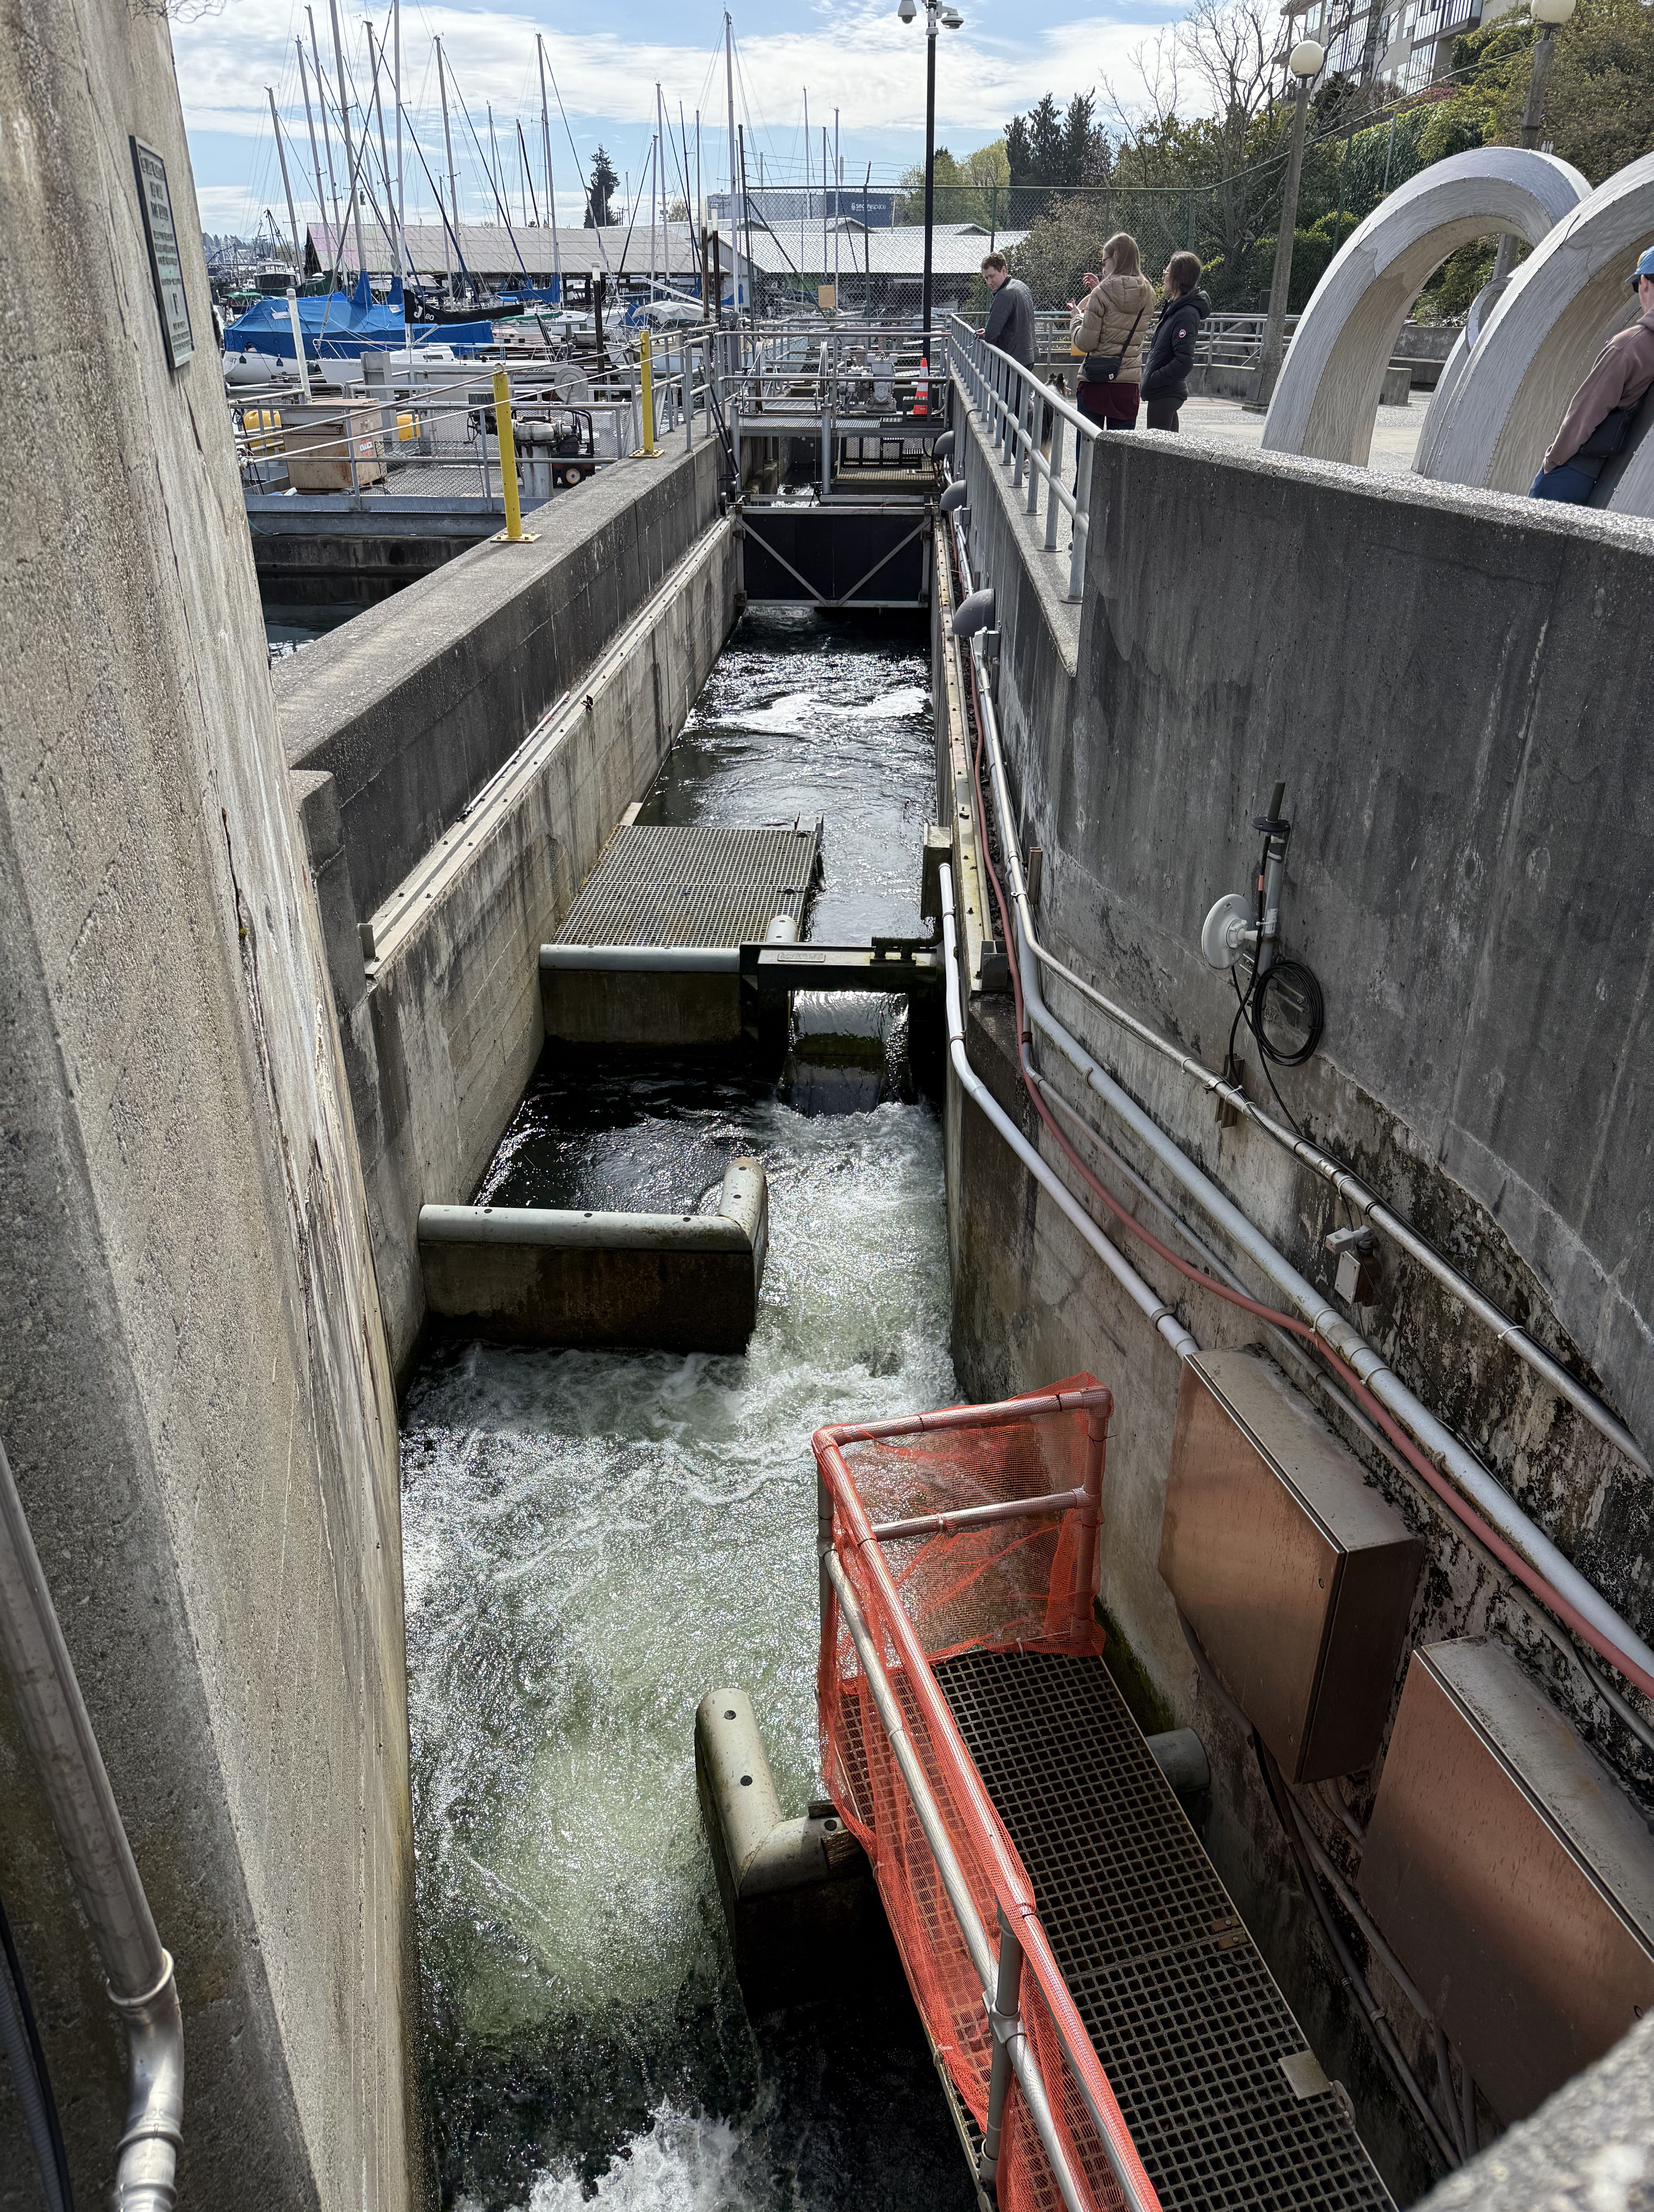
Salmon have historically swam into Lake Washington to spawn through the small river (Black River) that drained it before the ship canal was constructed. That outlet is apparently filled with sediment now and the area completely covered with development, including Boeing Aircraft’s main plant, where the Museum of Flight is located. The lock design includes a series of pools called a fish ladder that allows the salmon to get to their spawning areas. I guess they figured out the new route. There’s a viewing room to the right where the fish can be seen making their way up the ladder, but there were no fish on this day; and I forgot to take a picture.
The roof of the fish ladder observation room is decorated with this unlabeled artwork.
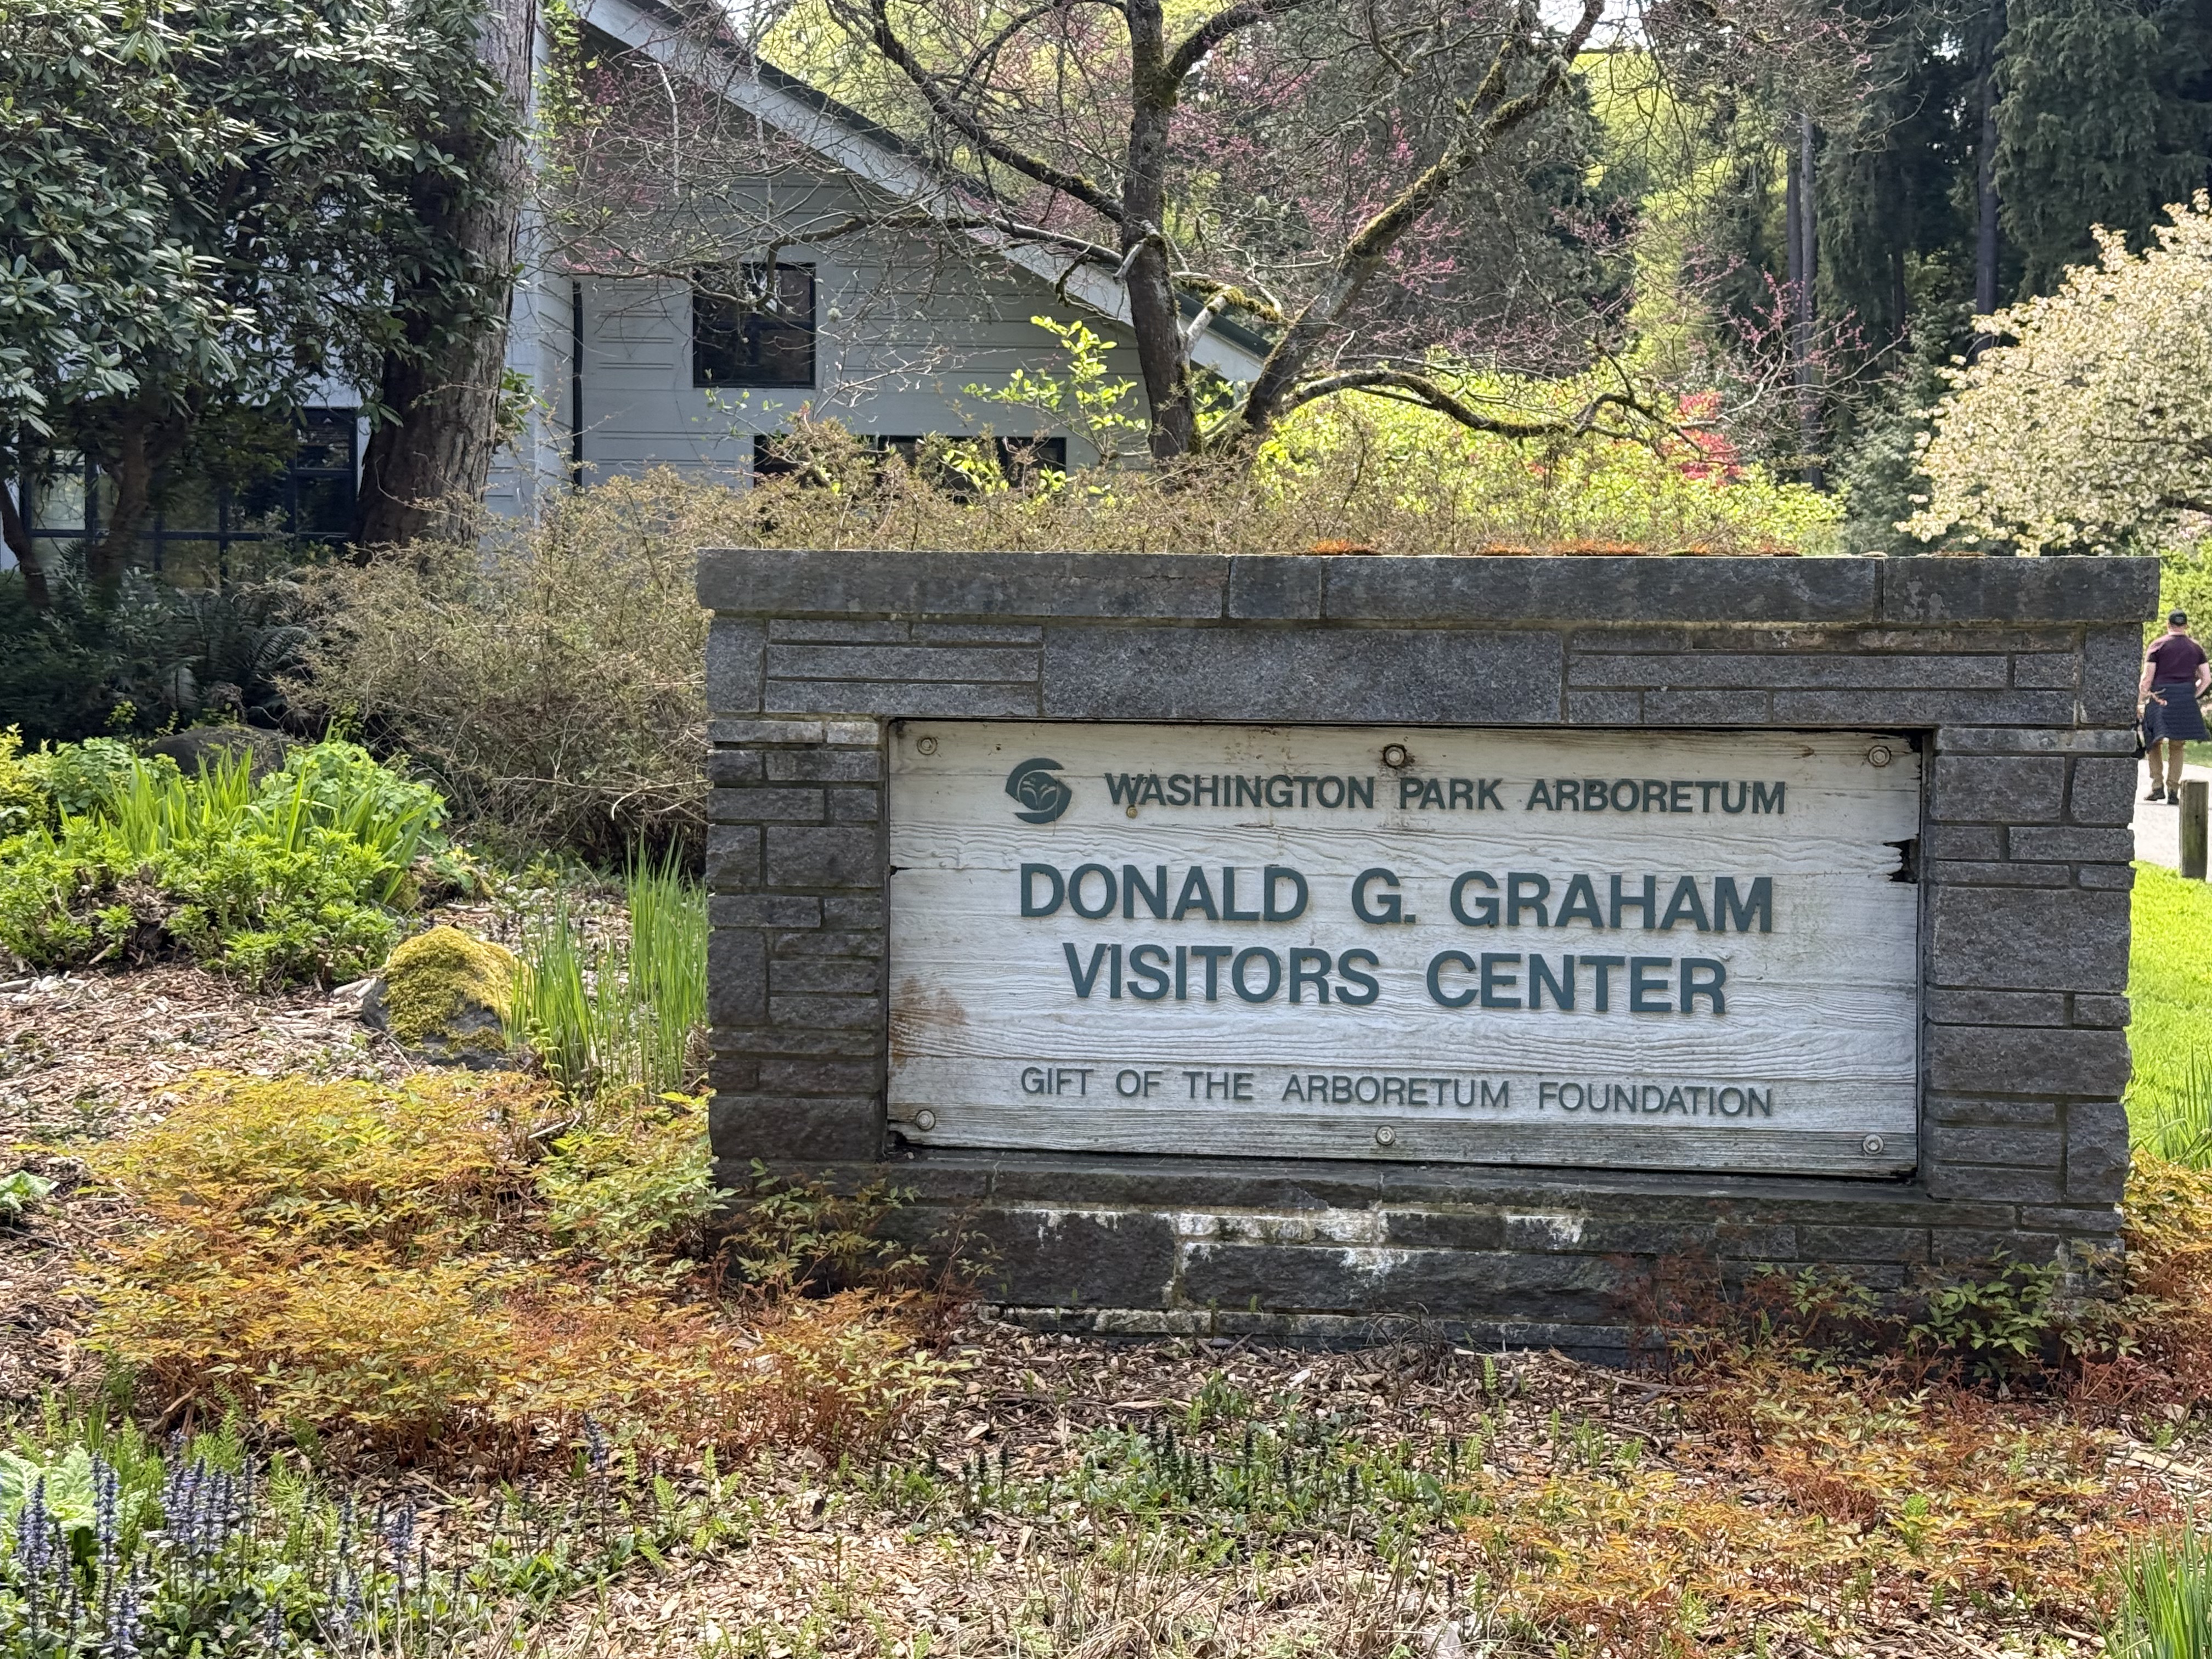
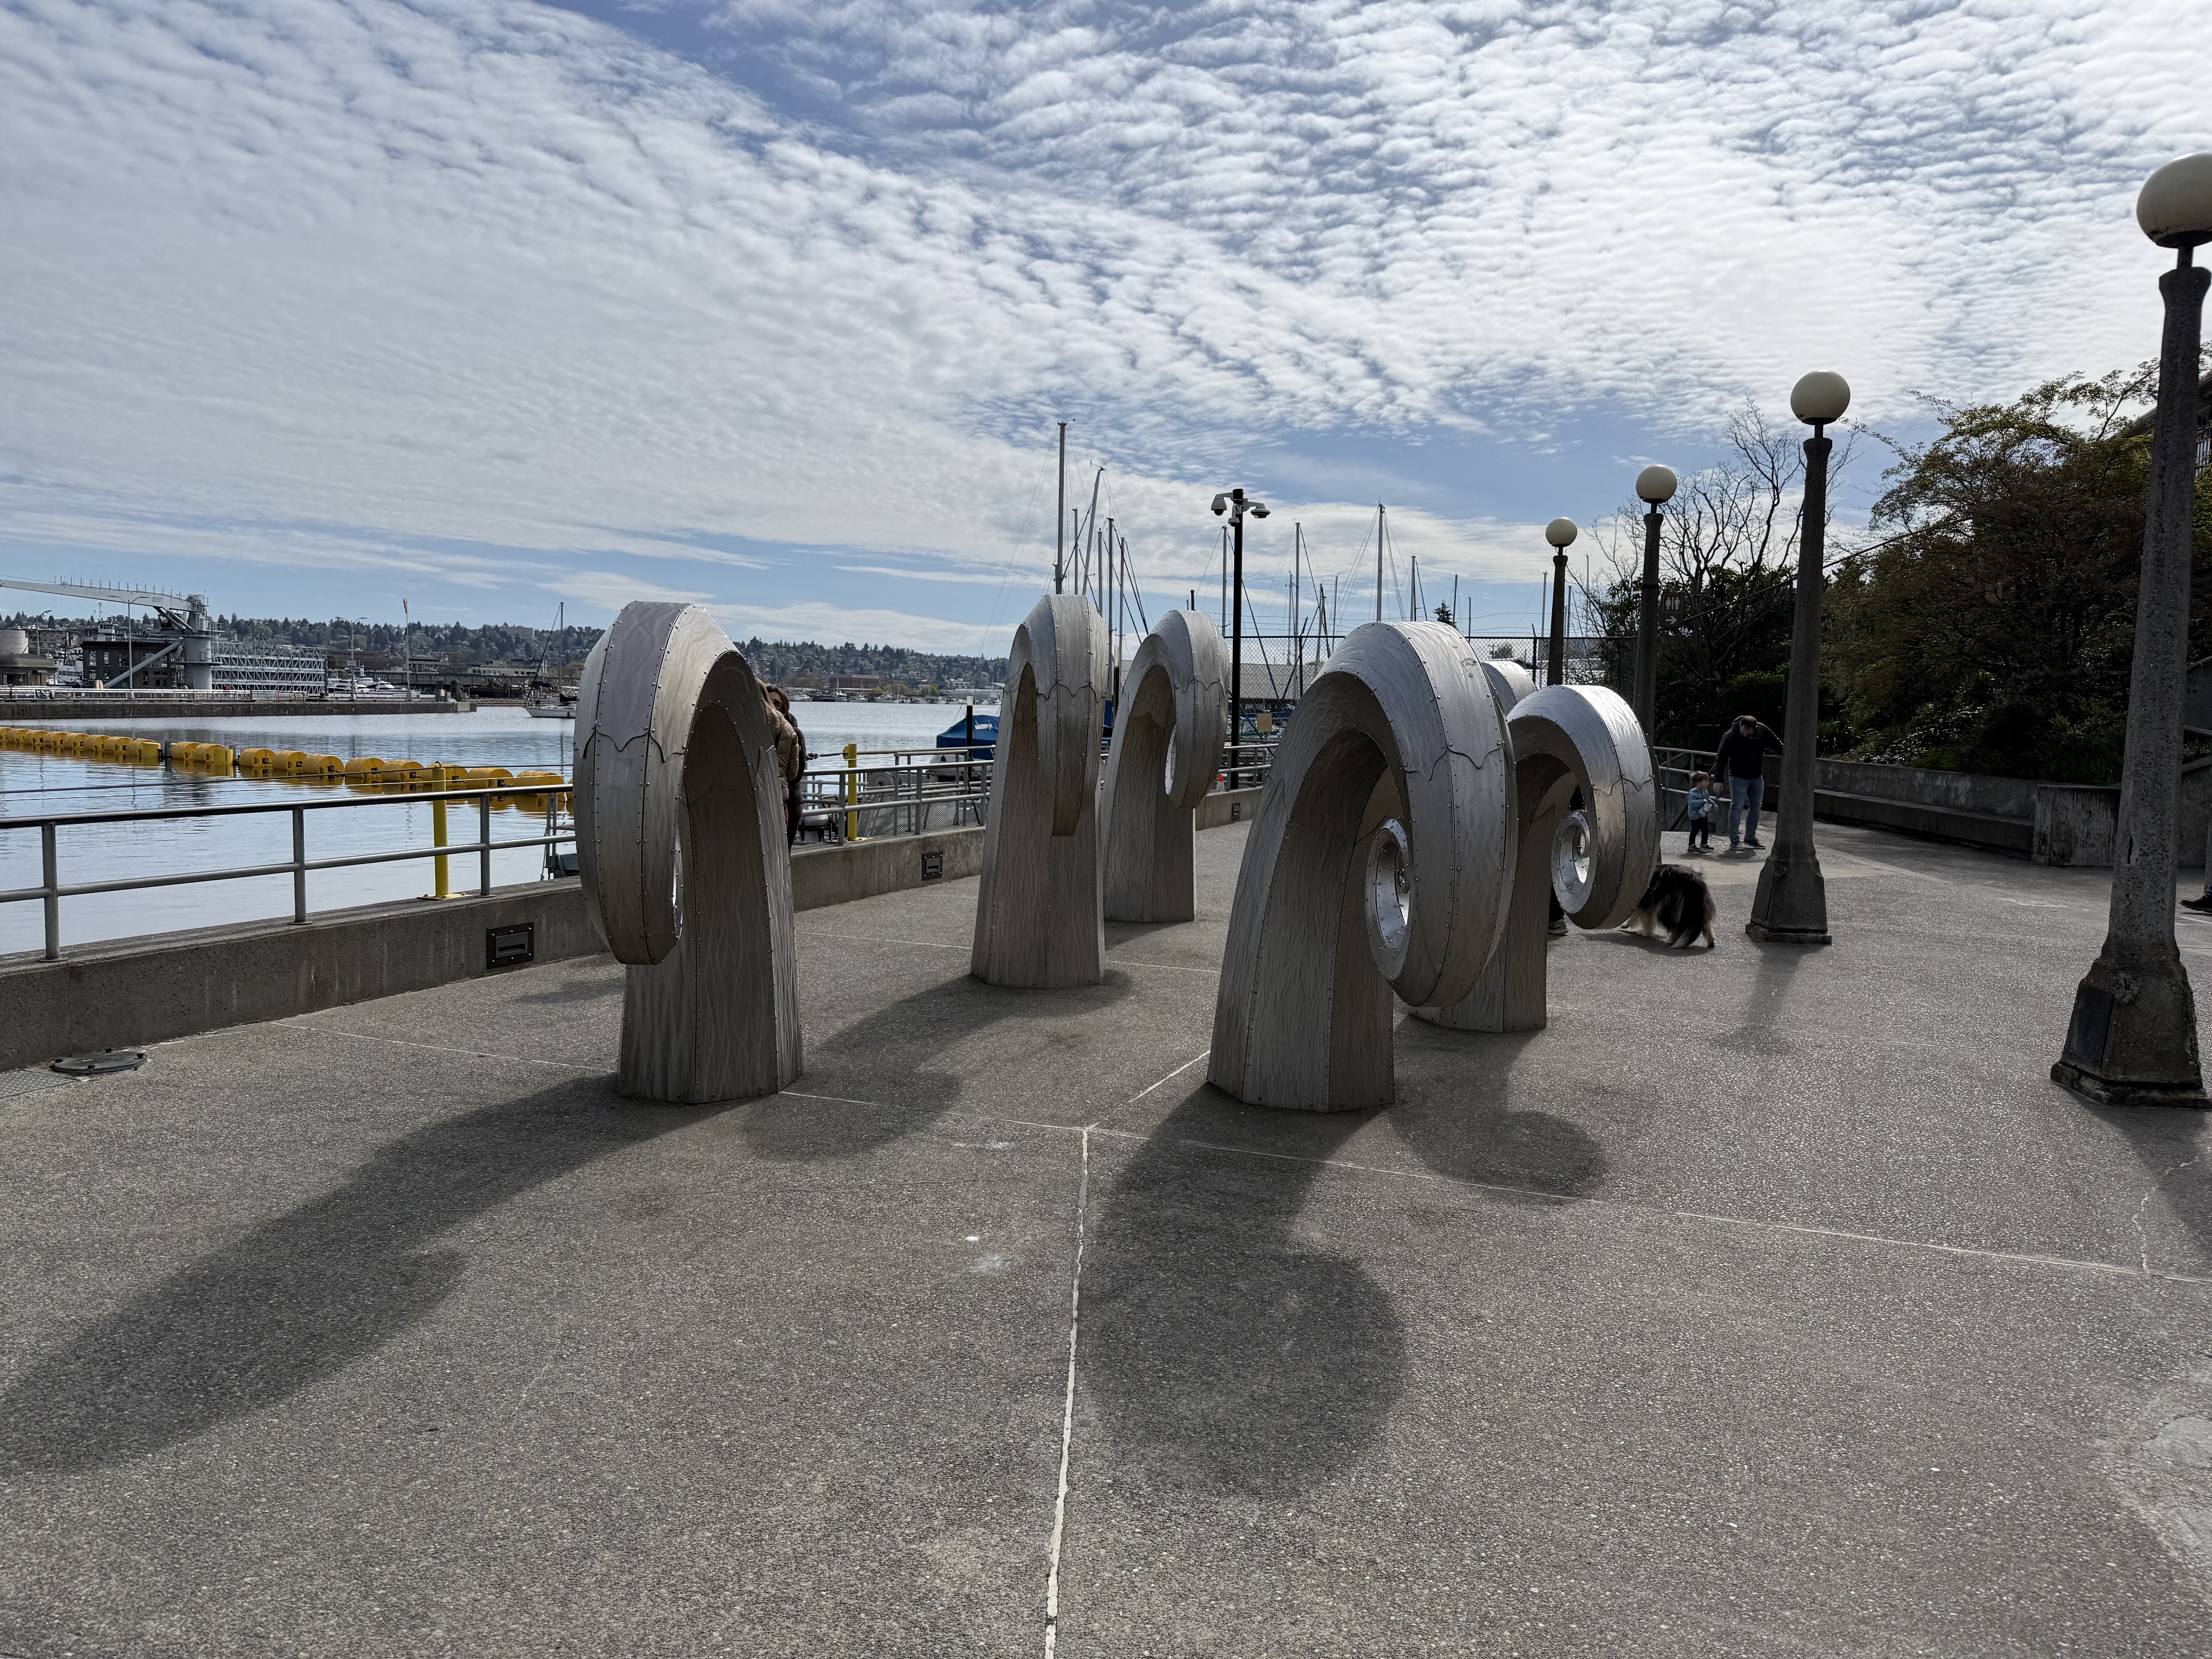
Just a short drive from Ballard Locks is Washington Park, which includes an arboretum and Japanese Garden. We took a long walk around the park but didn’t make it to the Garden, which has its own parking area.
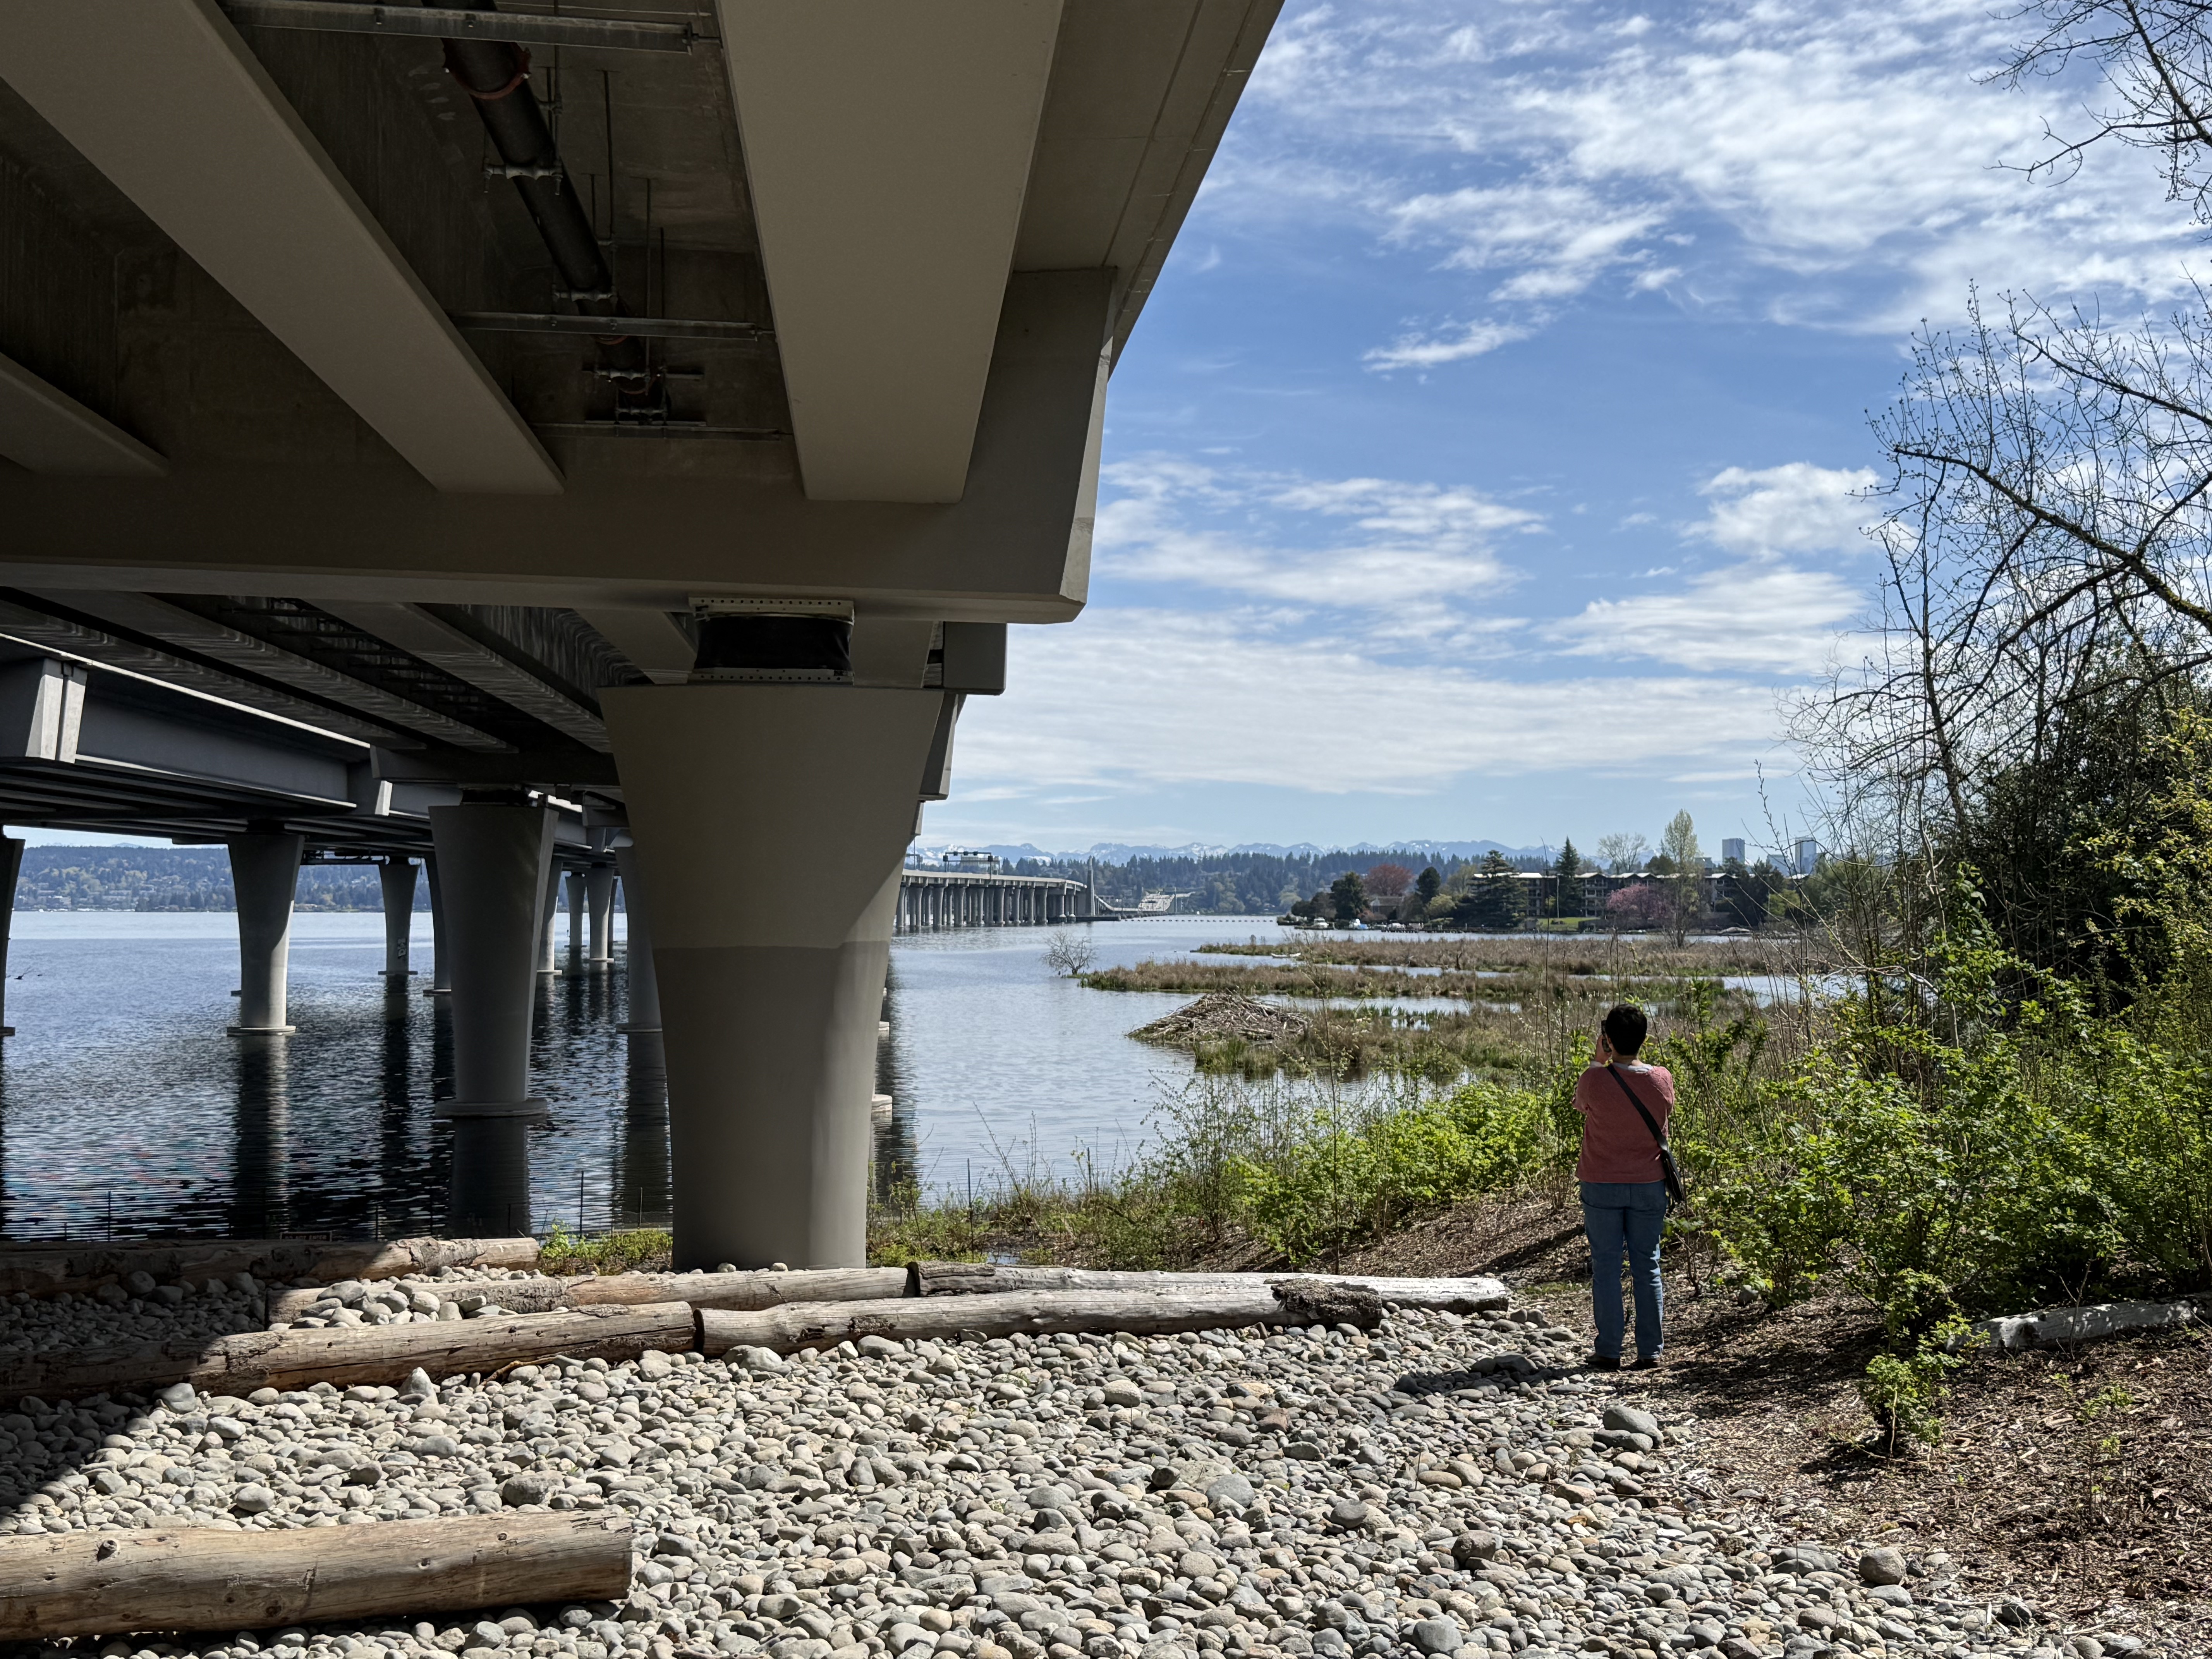
The walking paths go out to an island, where State Route 520 crosses Lake Washington, partly using a unique floating bridge construction. Traffic was pretty loud out there. I wouldn’t enjoy having lunch on one of the picnic tables.
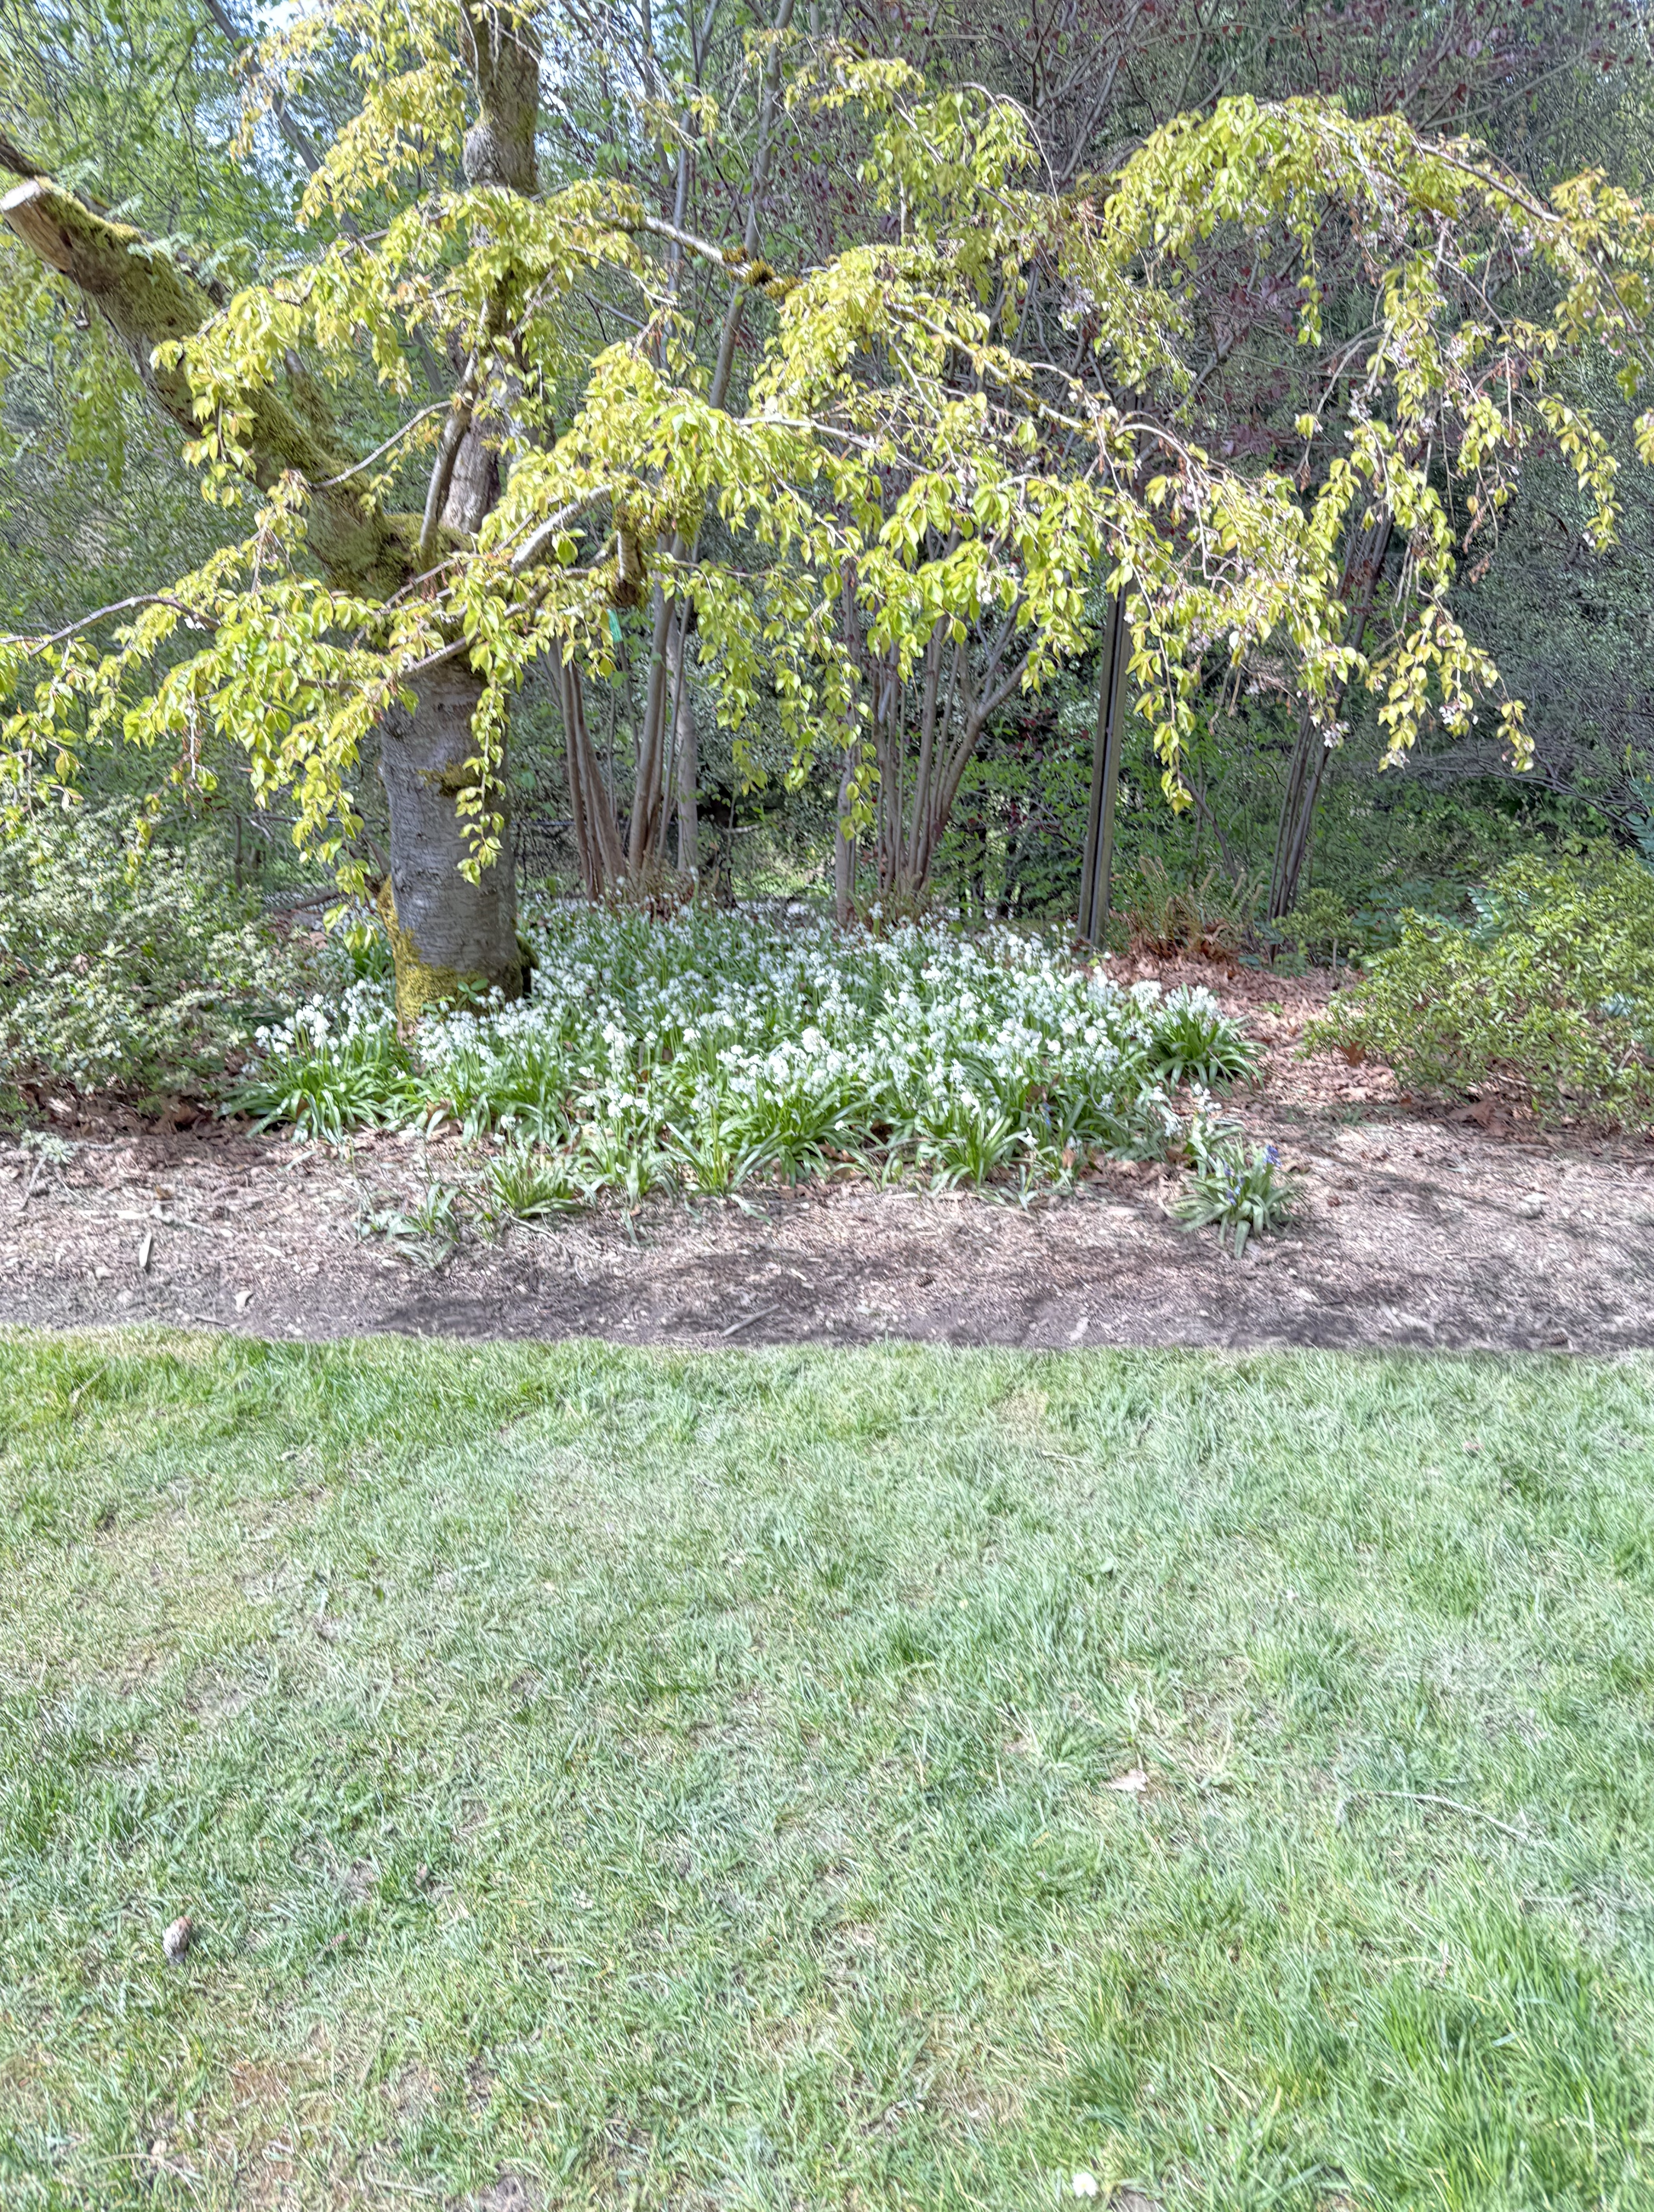
These are typical plantings along the paths in the arboretum. I don’t know anything about plants, so I asked CoPilot (giving it the location): the low, flowering shrub is probably Pieris japonica (aka Lily of the Valley shrub); and the tree may be Stewartia.

There were numerous masses of flowering shrubs like this, which is probably a dwarf Rhododendron (according to CoPilot). There were a lot of plants within a group, which didn’t look anything like each other; however, the signs explained that the arboretum had large collections of Rhododendrons and Magnolias, for example.
It was a beautiful spring day, and Lake Washington was the perfect place to spend it. I won’t post a photo of the excellent, home-made hamburger and cold beer I enjoyed at Skillet and Vine after a tiring morning of basking in a warm sun.
Cape Flattery: Conglomerates at the End of the World

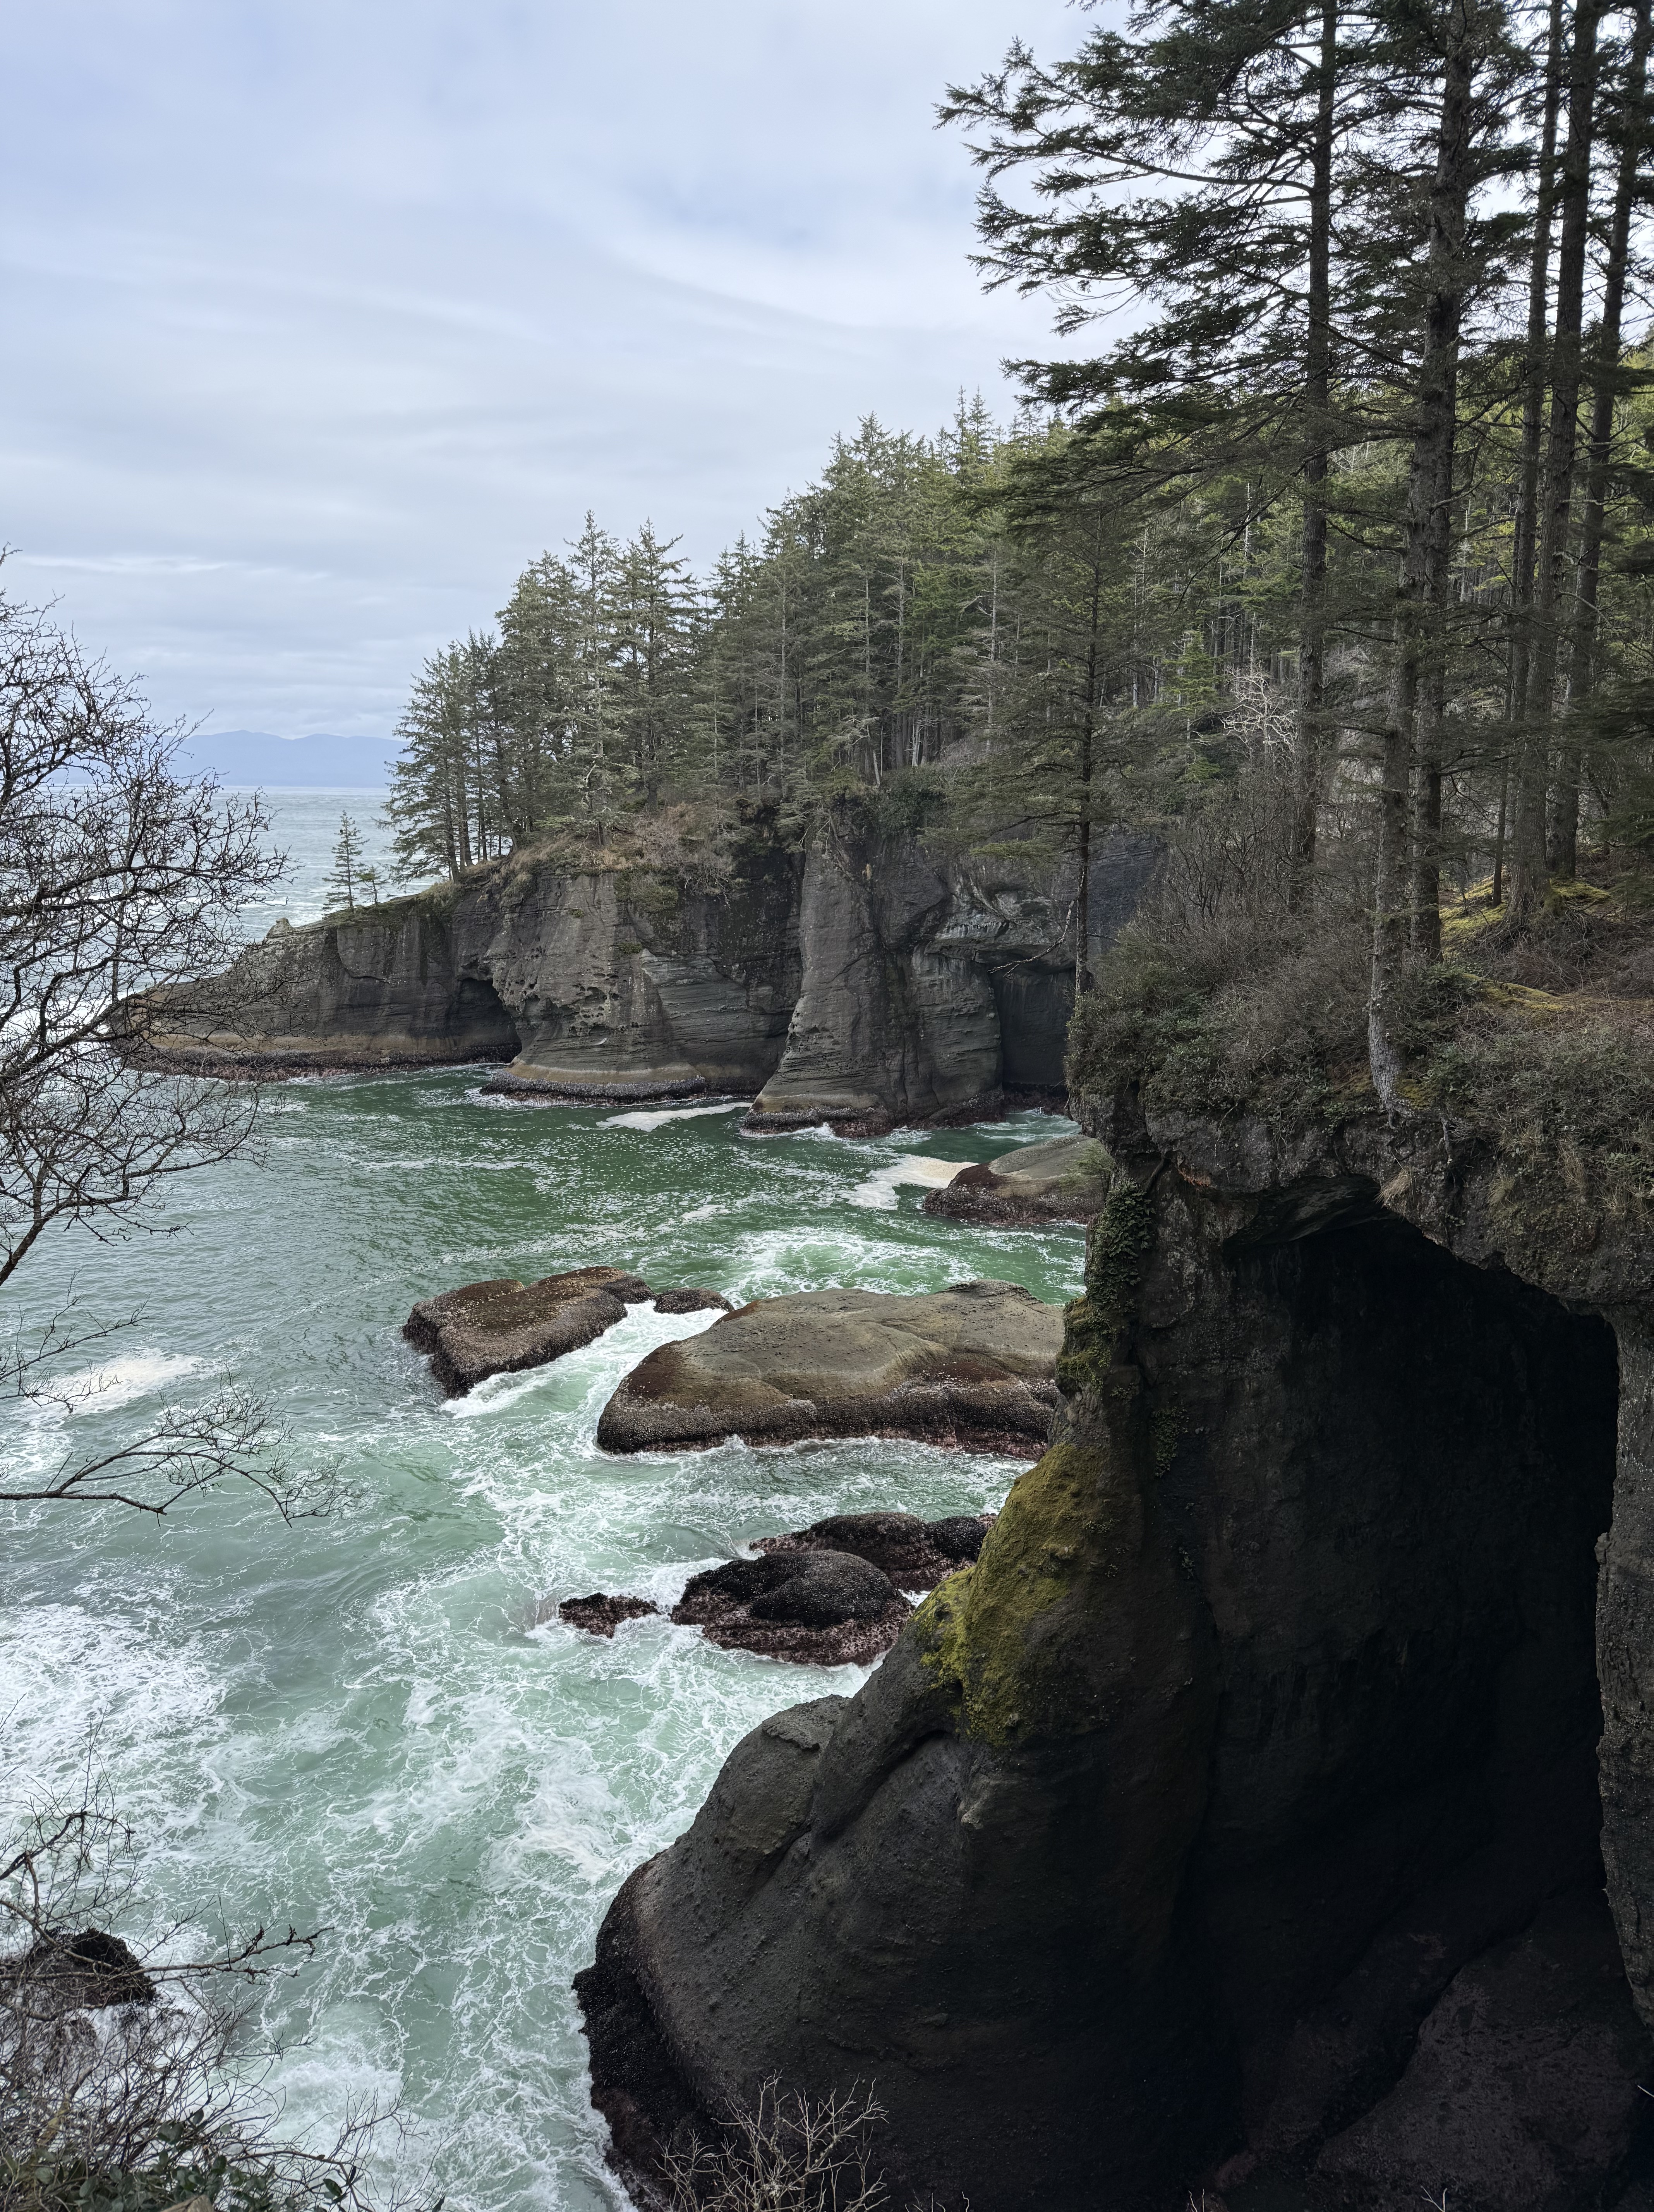
Figure 1. I ran out of road and land, ending up at Cape Flattery on the Makah Reservation. This is Location D in Fig. 2. A half-mile hike down a boardwalk took me to the end of the world, where the cliffs are about 80 feet above sea level. This photo is looking northward towards Vancouver Island, Canada, in the distance. Wave action has cut a wave terrace, a seen in the center of the image, and a series of sea caves.
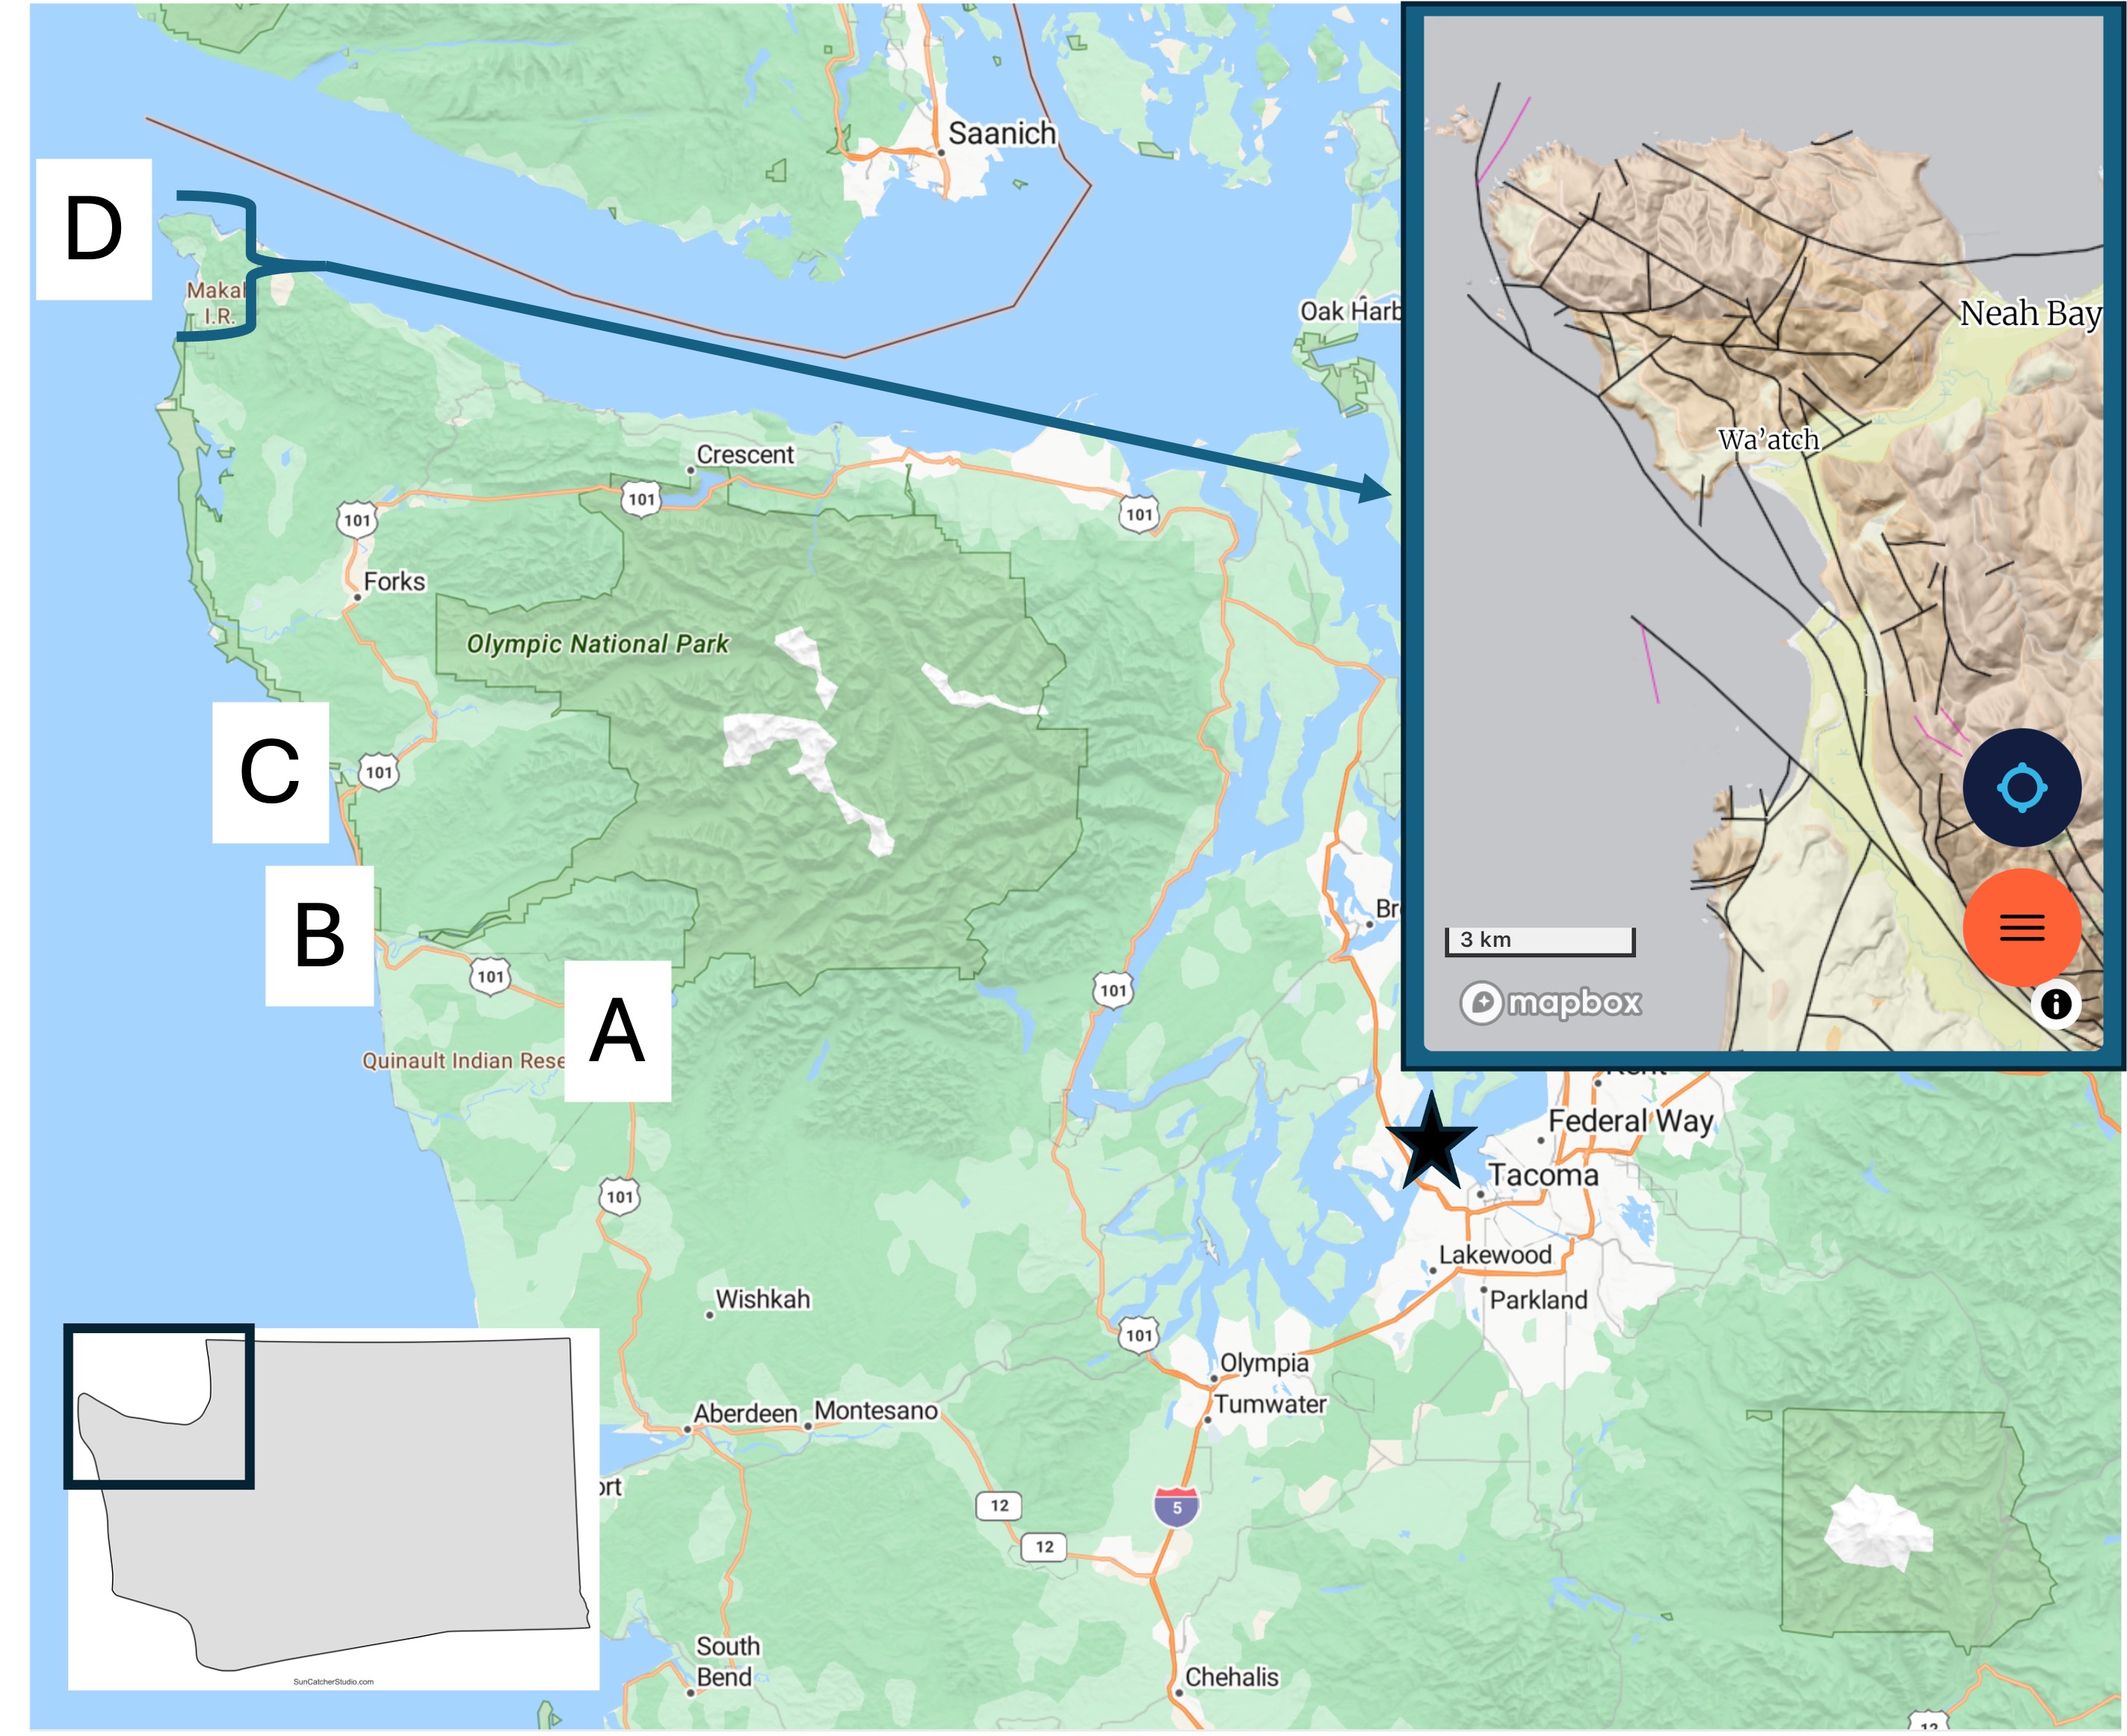
Figure 2. Today’s post takes us to Site D, which is shown in a geologic map from Rock D in the inset map. The rocks are a mixture of sandstone and conglomerate of Eocene age (56-34 Ma). This is the same time that the lower Cascades were being created east of Puget Sound. Note the large number of faults (thin lines) shown in the inset map. Many of these are strike-slip faults with motion of the opposing crustal block to the left, which would explain why the sedimentary layers in seen in Fig. 1 are almost horizontal, dipping slightly towards the sea.
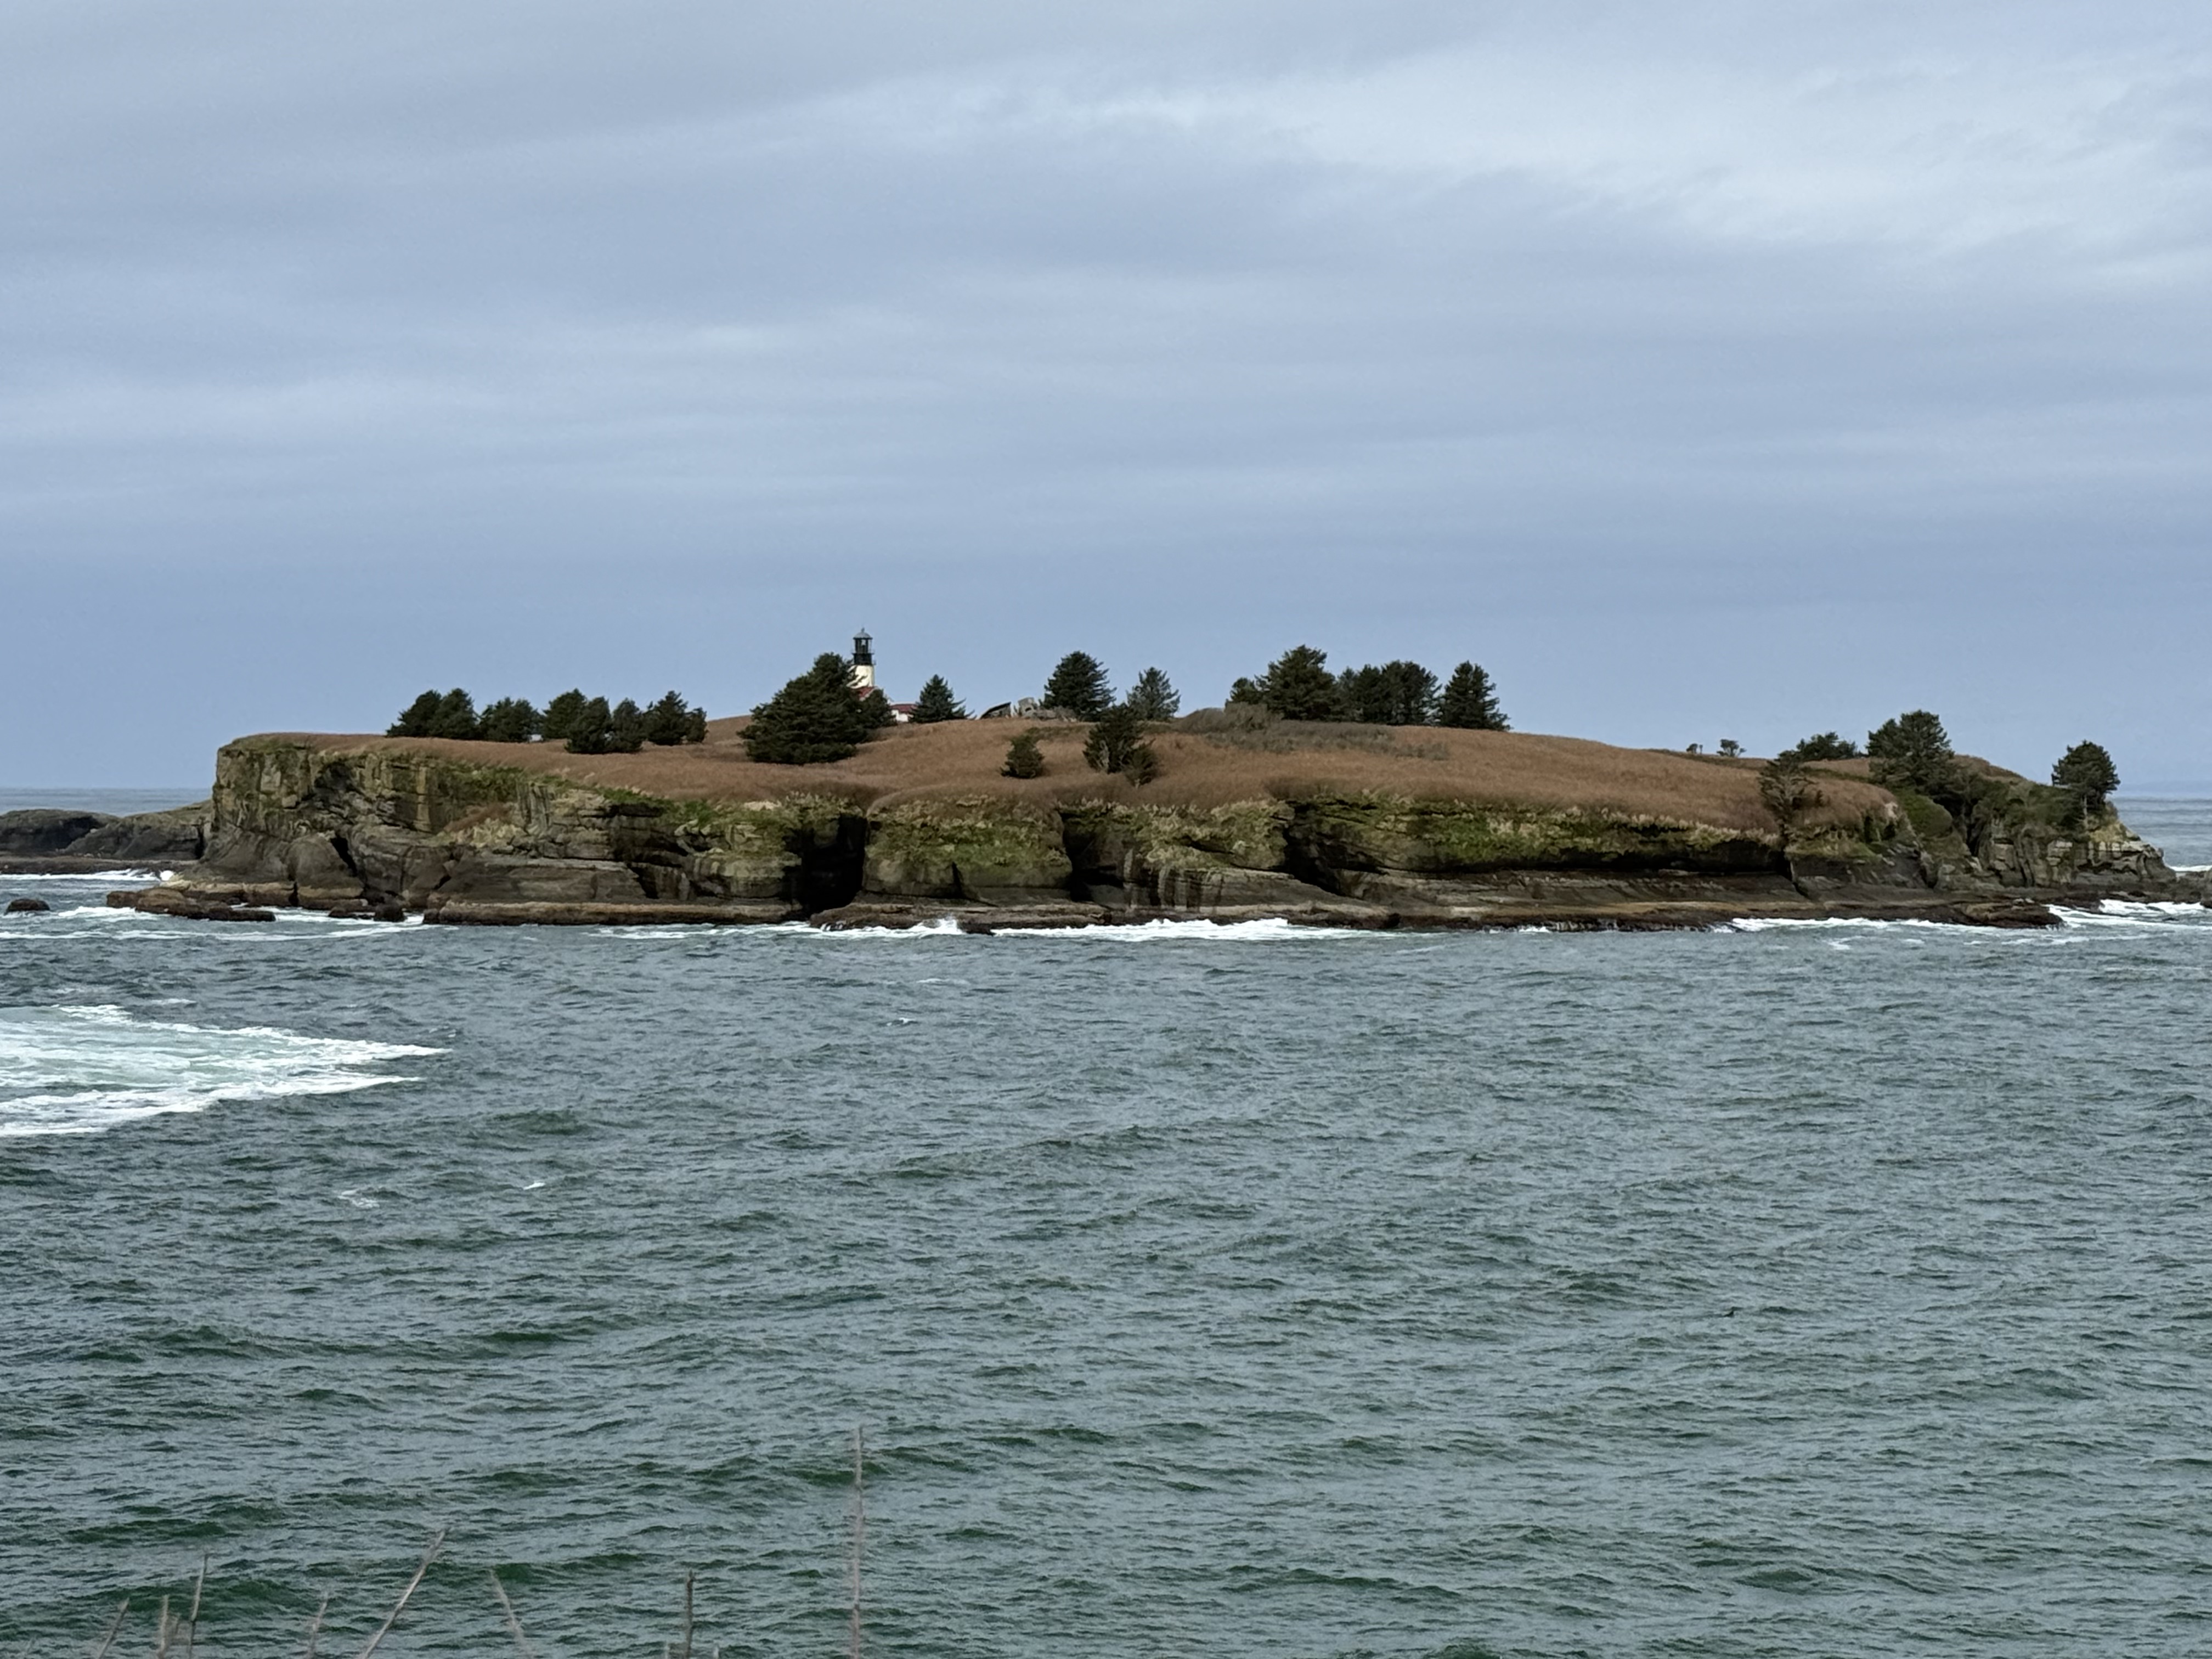
Figure 3. The sea stacks seen further south have been replaced with rocky islands like Tatoosh Island, which has a light house. Pacific Ocean seafloor (Juan de Fuca tectonic plate) is being actively subducted along the Washington-Oregon coast at about 2 inches/year, but the plate tectonic geometry is complex in this area. This could partly explain the large number of faults seen in Fig. 2 as well as the high elevation of bedrock. Maybe.
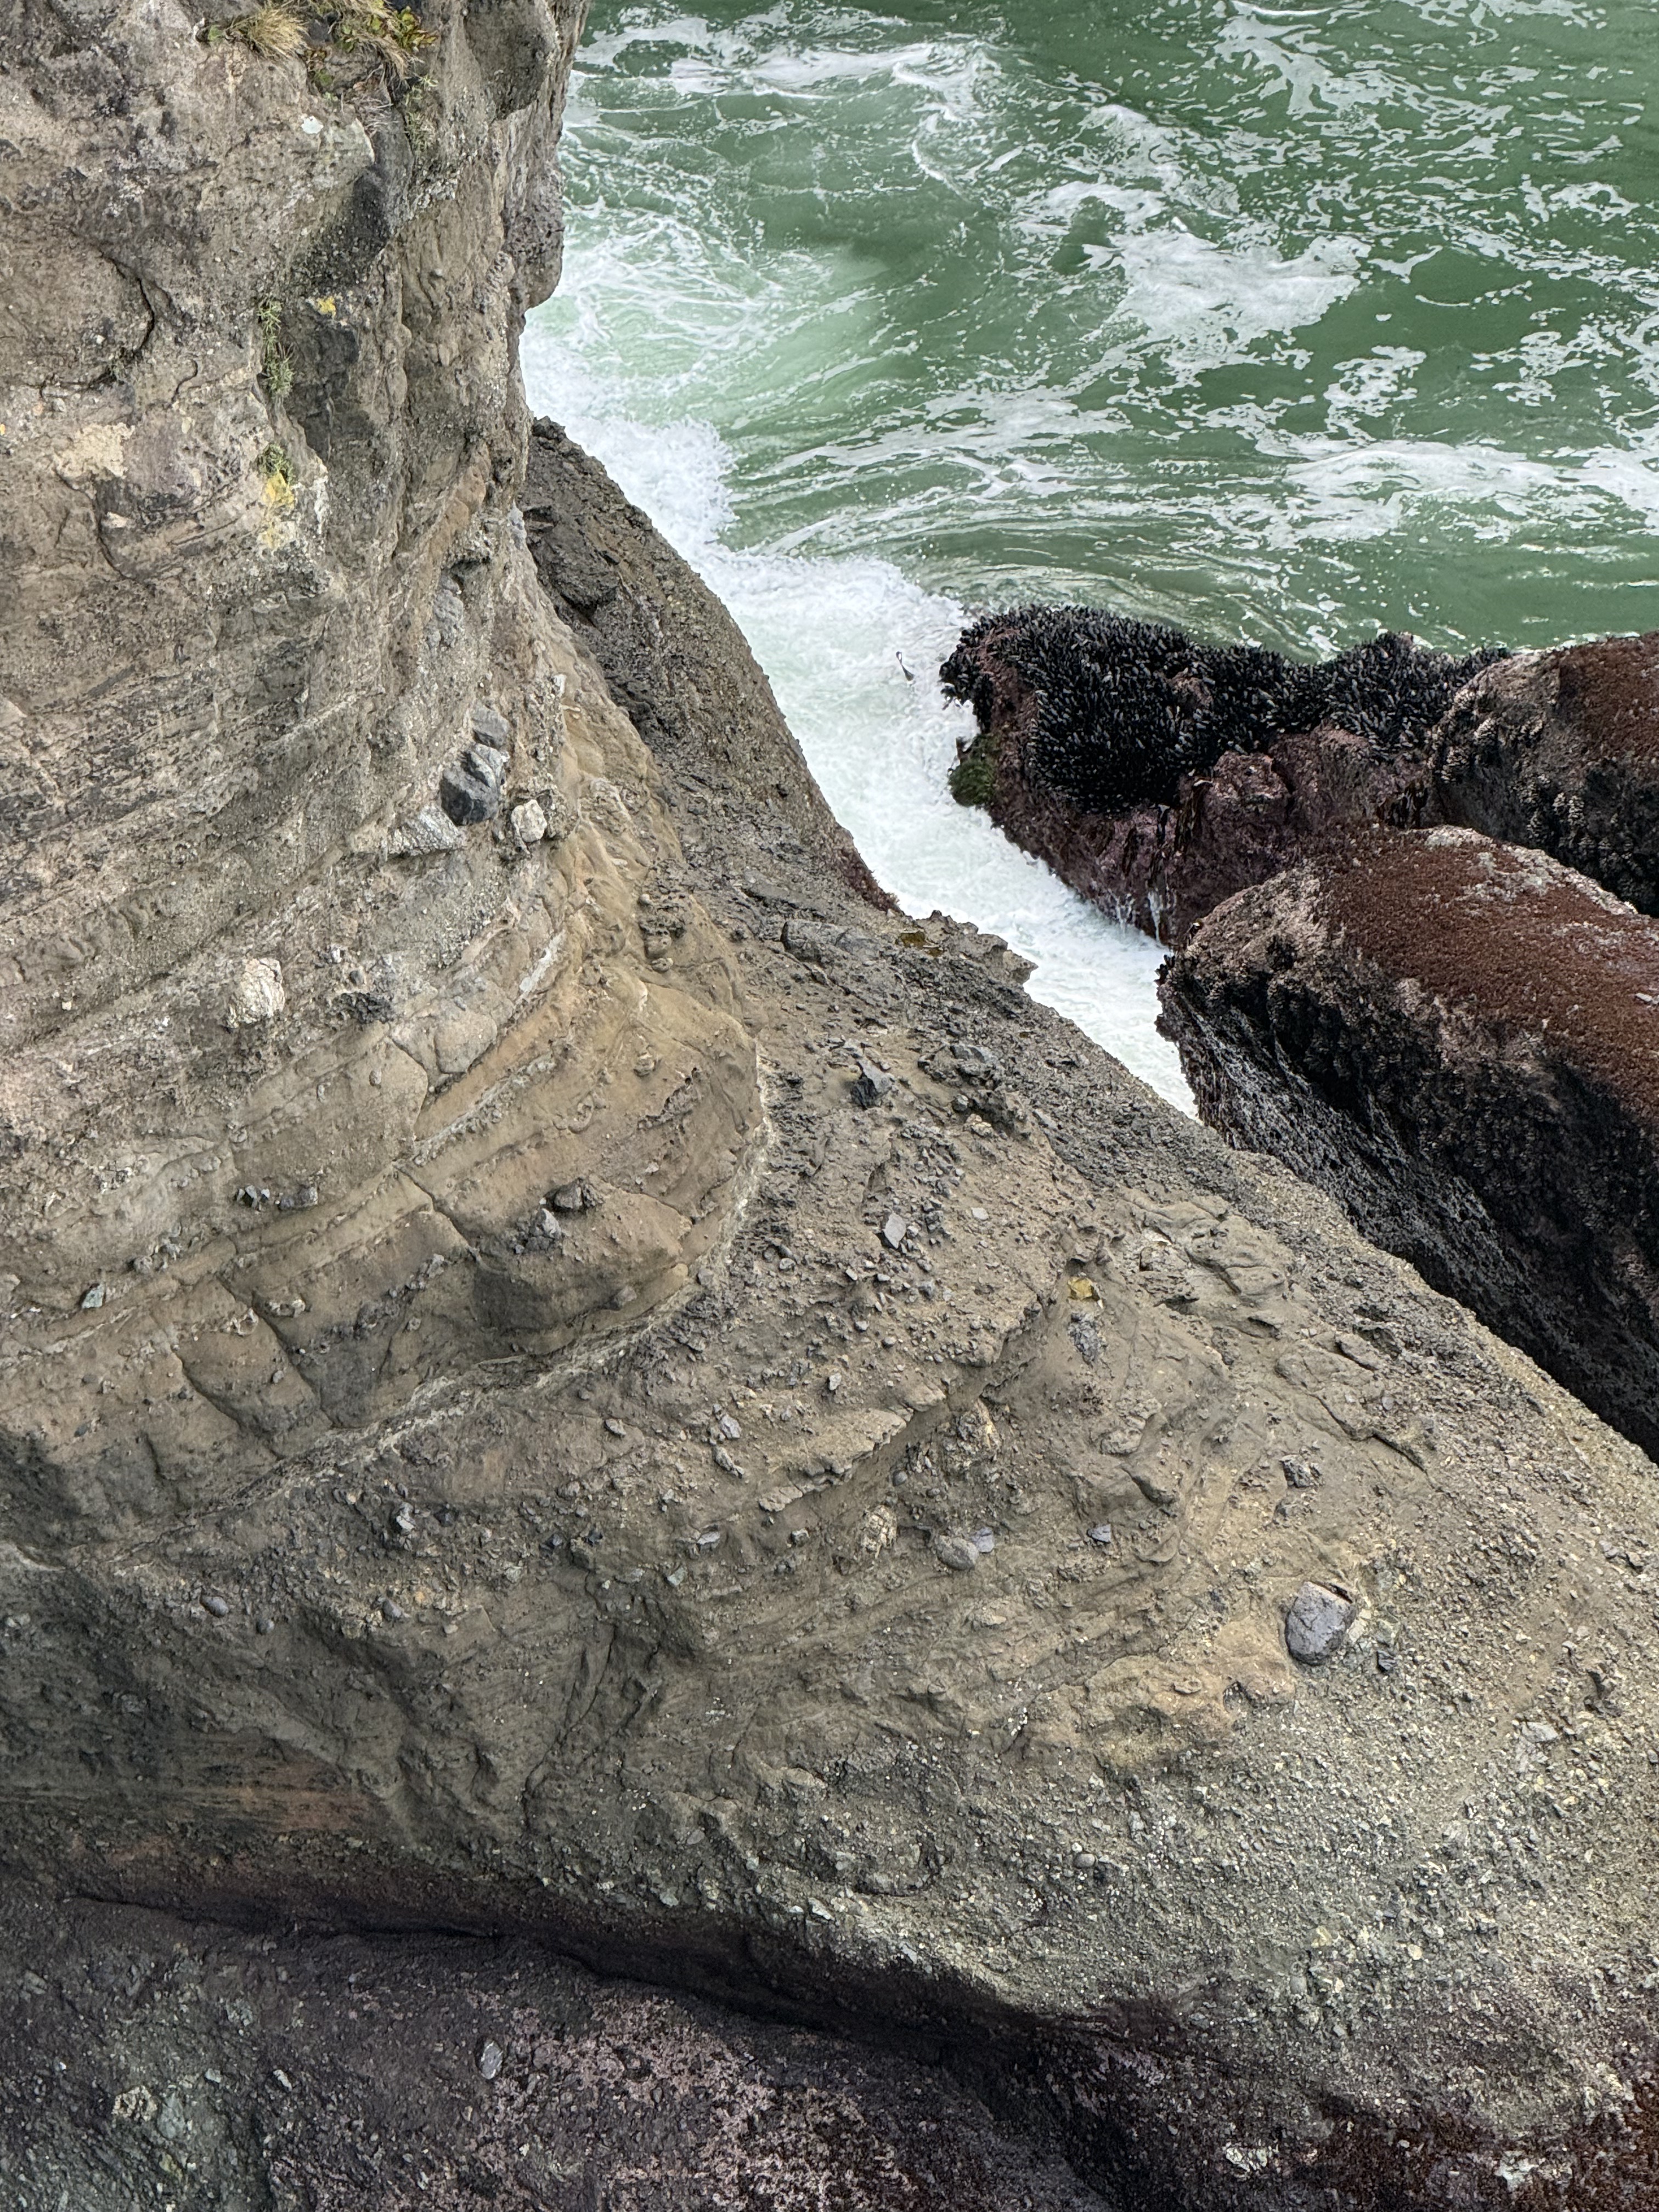
Figure 4. This photo was taken looking down towards the wave-terrace on the south side of the lookout point. For scale, the largest boulders are a couple of feet long, based on exposures at the surface of the trail. This is a textbook tectonic breccia. However, note that most of the rock fragments are rounded, so they have been transported some distance before reaching their final resting place. Some of the layers are relatively uniform with a few large boulders whereas others resemble the cobblestones we saw at Ruby Beach. Each bed might represent a single depositional event (like a landslide) or accumulation over years. These are marine rocks, deposited on a submarine fan, probably as turbidity flows. The process that created them is occurring now a few miles offshore, where the rocky outcrops we saw are eroding and supplying large and small fragments to a steep continental shelf.
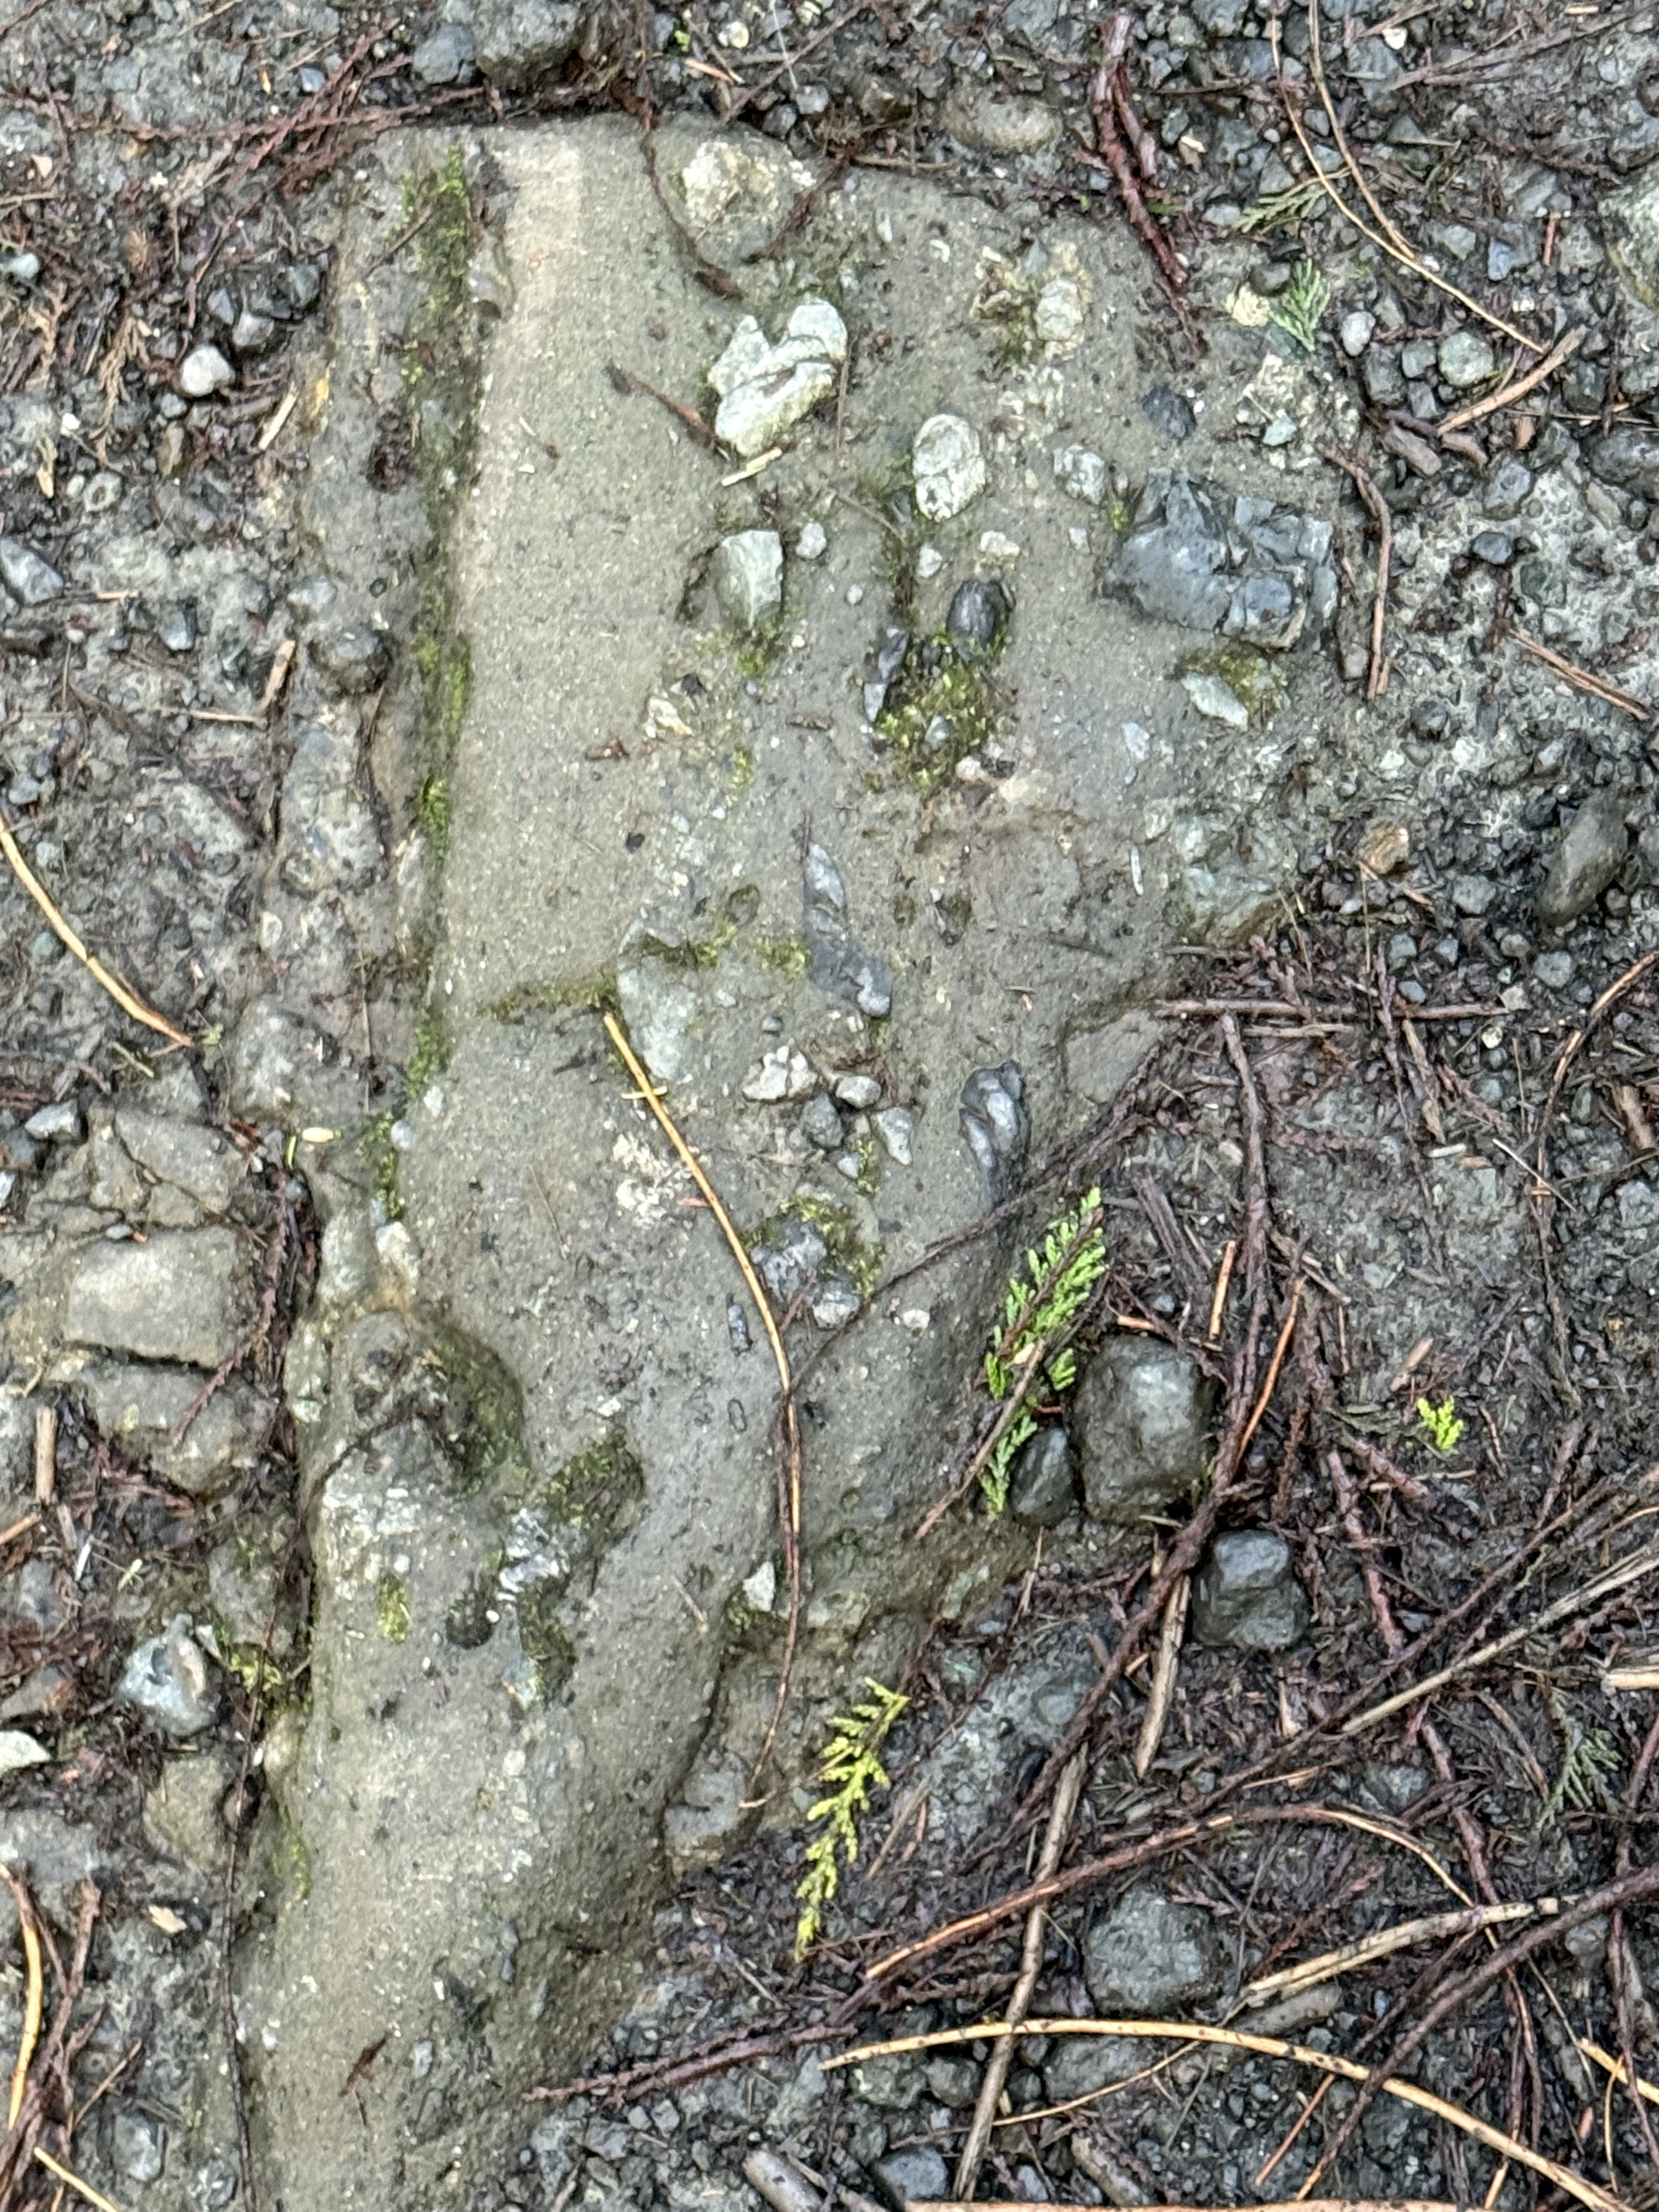
Figure 5. This image looks like run-of-the-mill gravel like you see on pathways and drives, but it is Eocene rock, and I mean solid rock (Note the large, gray piece protruding from the cliff in Fig. 4). This angular slab is about a foot in length. There is no Pleistocene glacial till in this area, even if the ground looks the same. This is a picture frozen in time, where an angular piece of what looks like sandstone, but could be andesite, slid downslope along with smaller fragments.
Summary.
This is the last of my geology posts from a weekend excursion along a hundred-mile stretch of the Washington coast. This is a high wave-energy coast with a tidal range of about 10 feet, the beaches covered with sand and cobbles. Sea stacks protrude from the beach, culminating in cliffs made of 50 Ma conglomerates. Beneath our feet, ocean crust was being subducted at several inches per year, feeding a system of magma chambers that are actively venting through volcanoes like Mt. Saint Helens, Rainier, and Mt. Baker. Rainfall drops along this coast at up to 12 feet per year, feeding streams that carry immense quantities of sediment into the trench created by the subducting ocean crust.
Geology doesn’t get any realer than this…
Tectonic Breccia at Ruby Beach
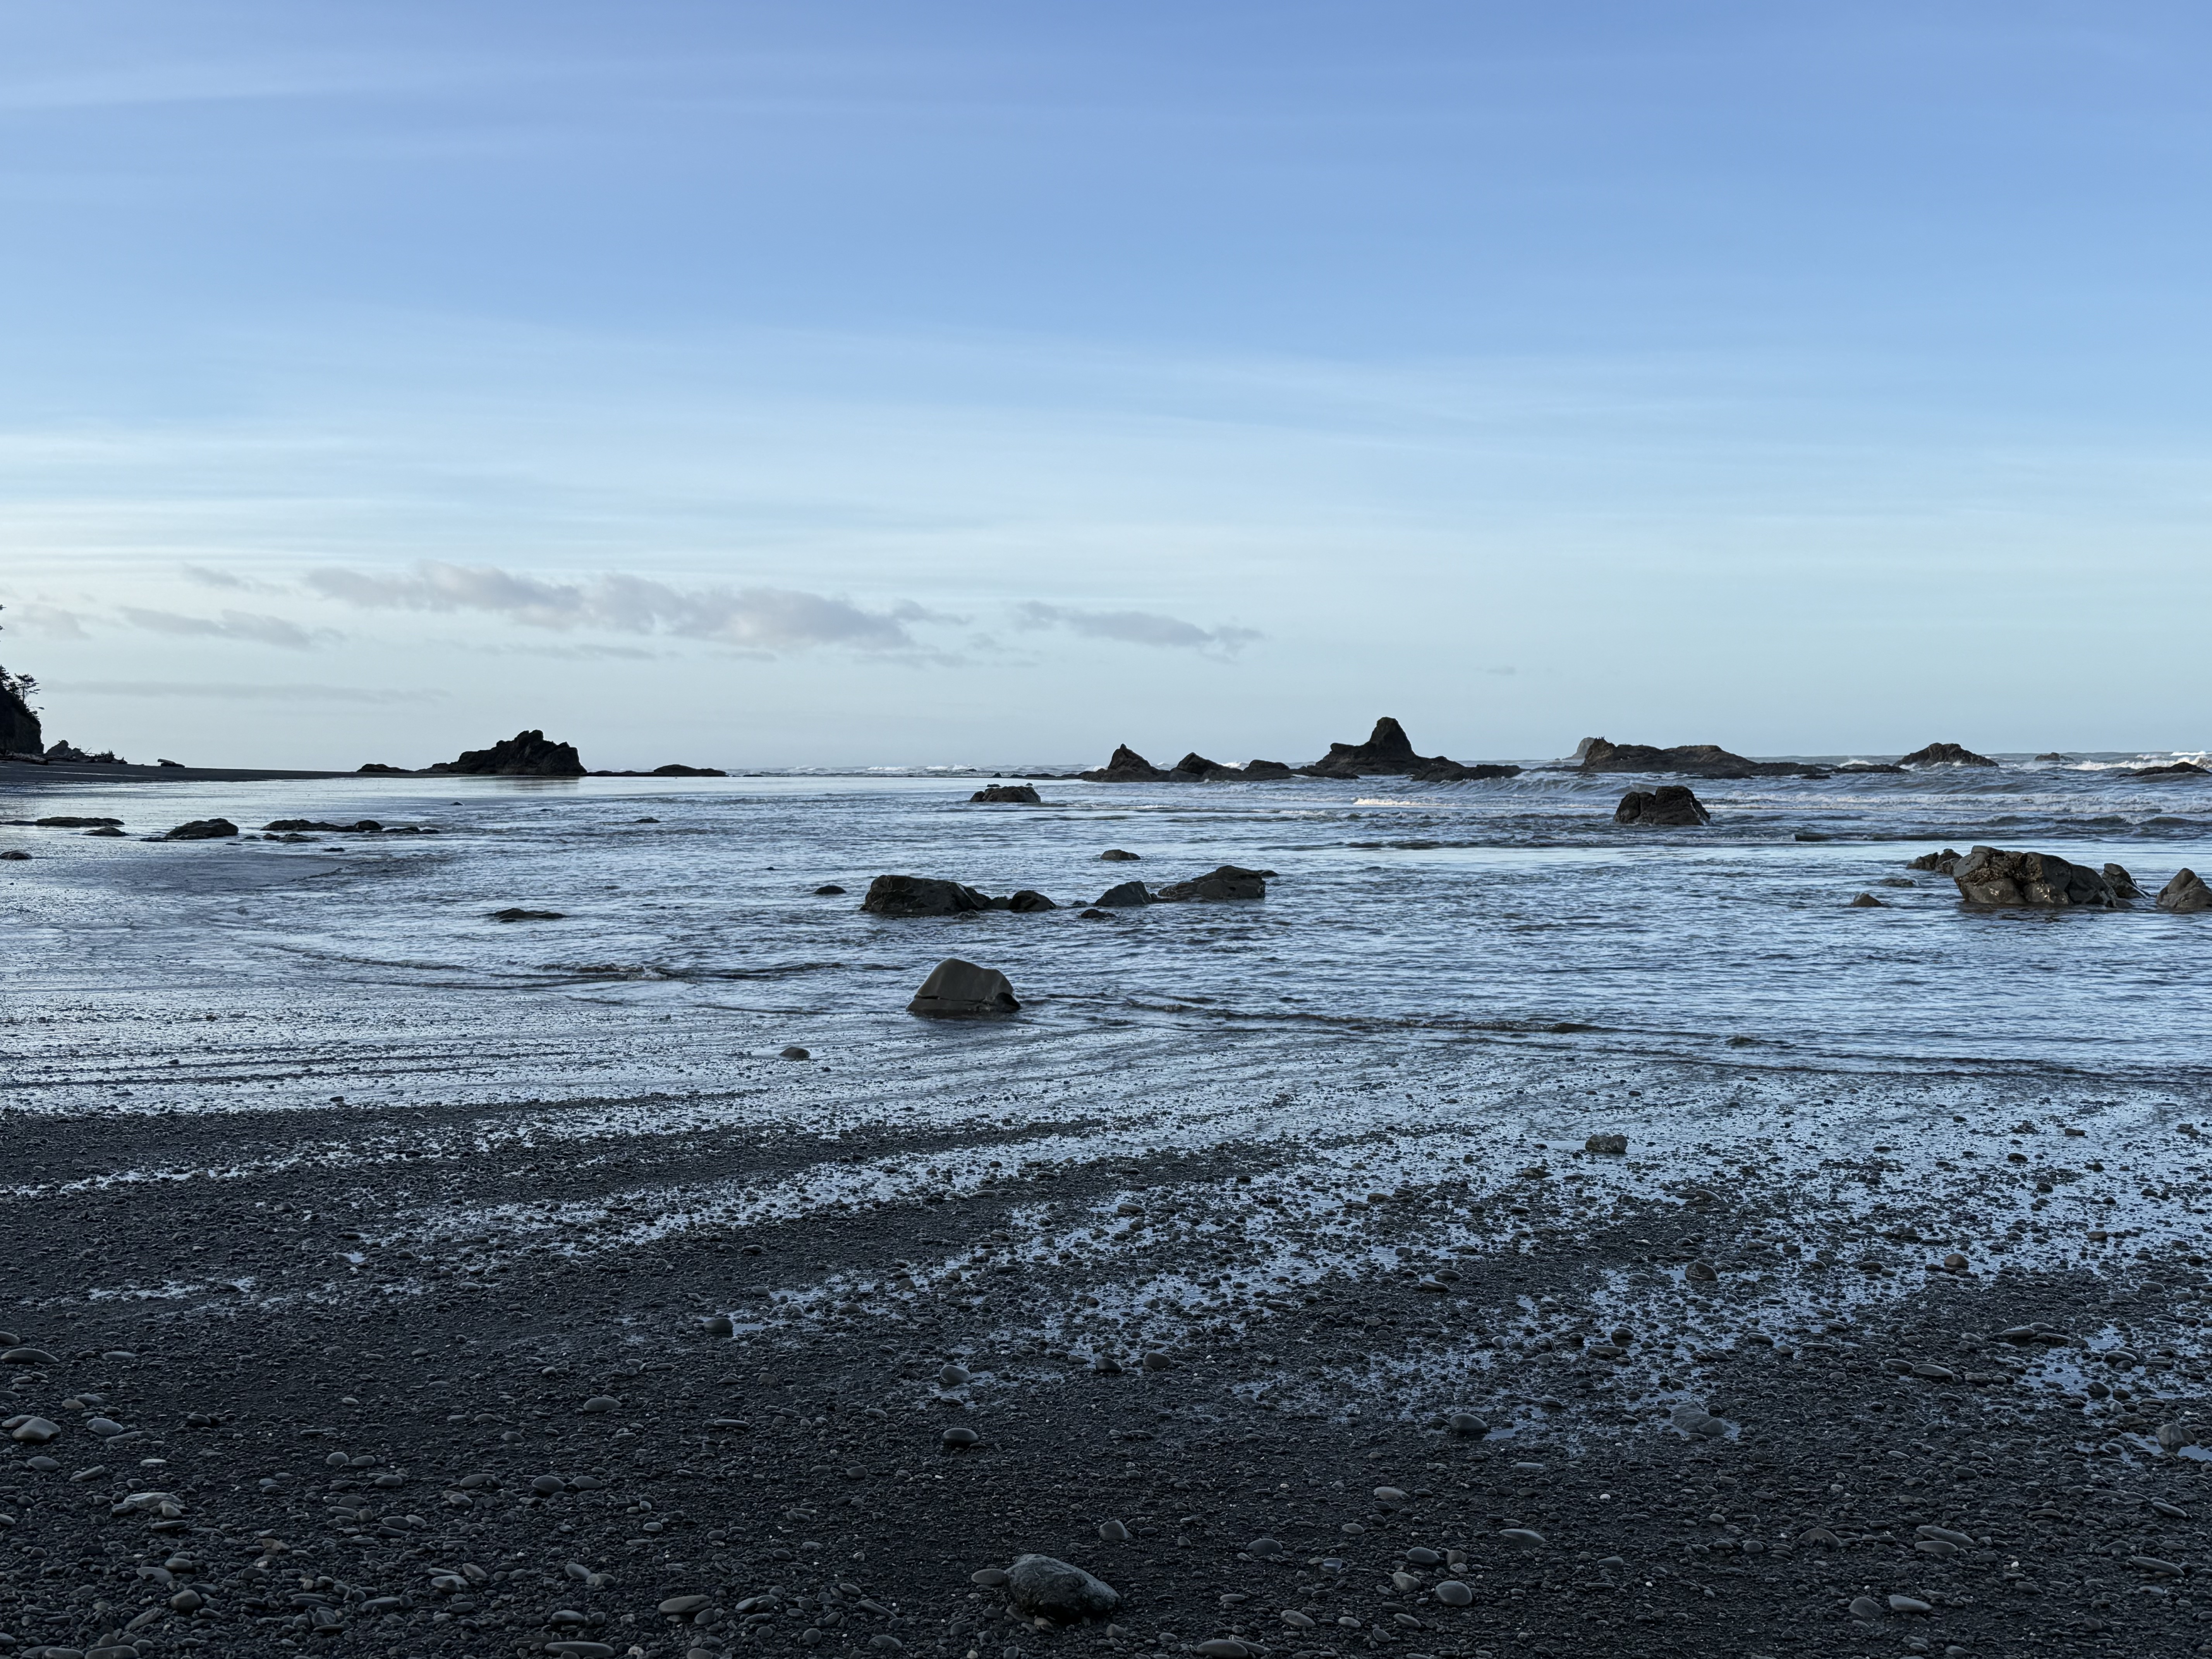
Figure 1. Ruby Beach is located about 10 miles north of Kalaloch Beach (Point C in Fig. 2), but the coastal morphology has changed substantially. This photo was taken at sunrise during low tide, exposing many outcrops of basement rock, which is the same unnamed sandy rock formation we saw before, but its composition has changed.
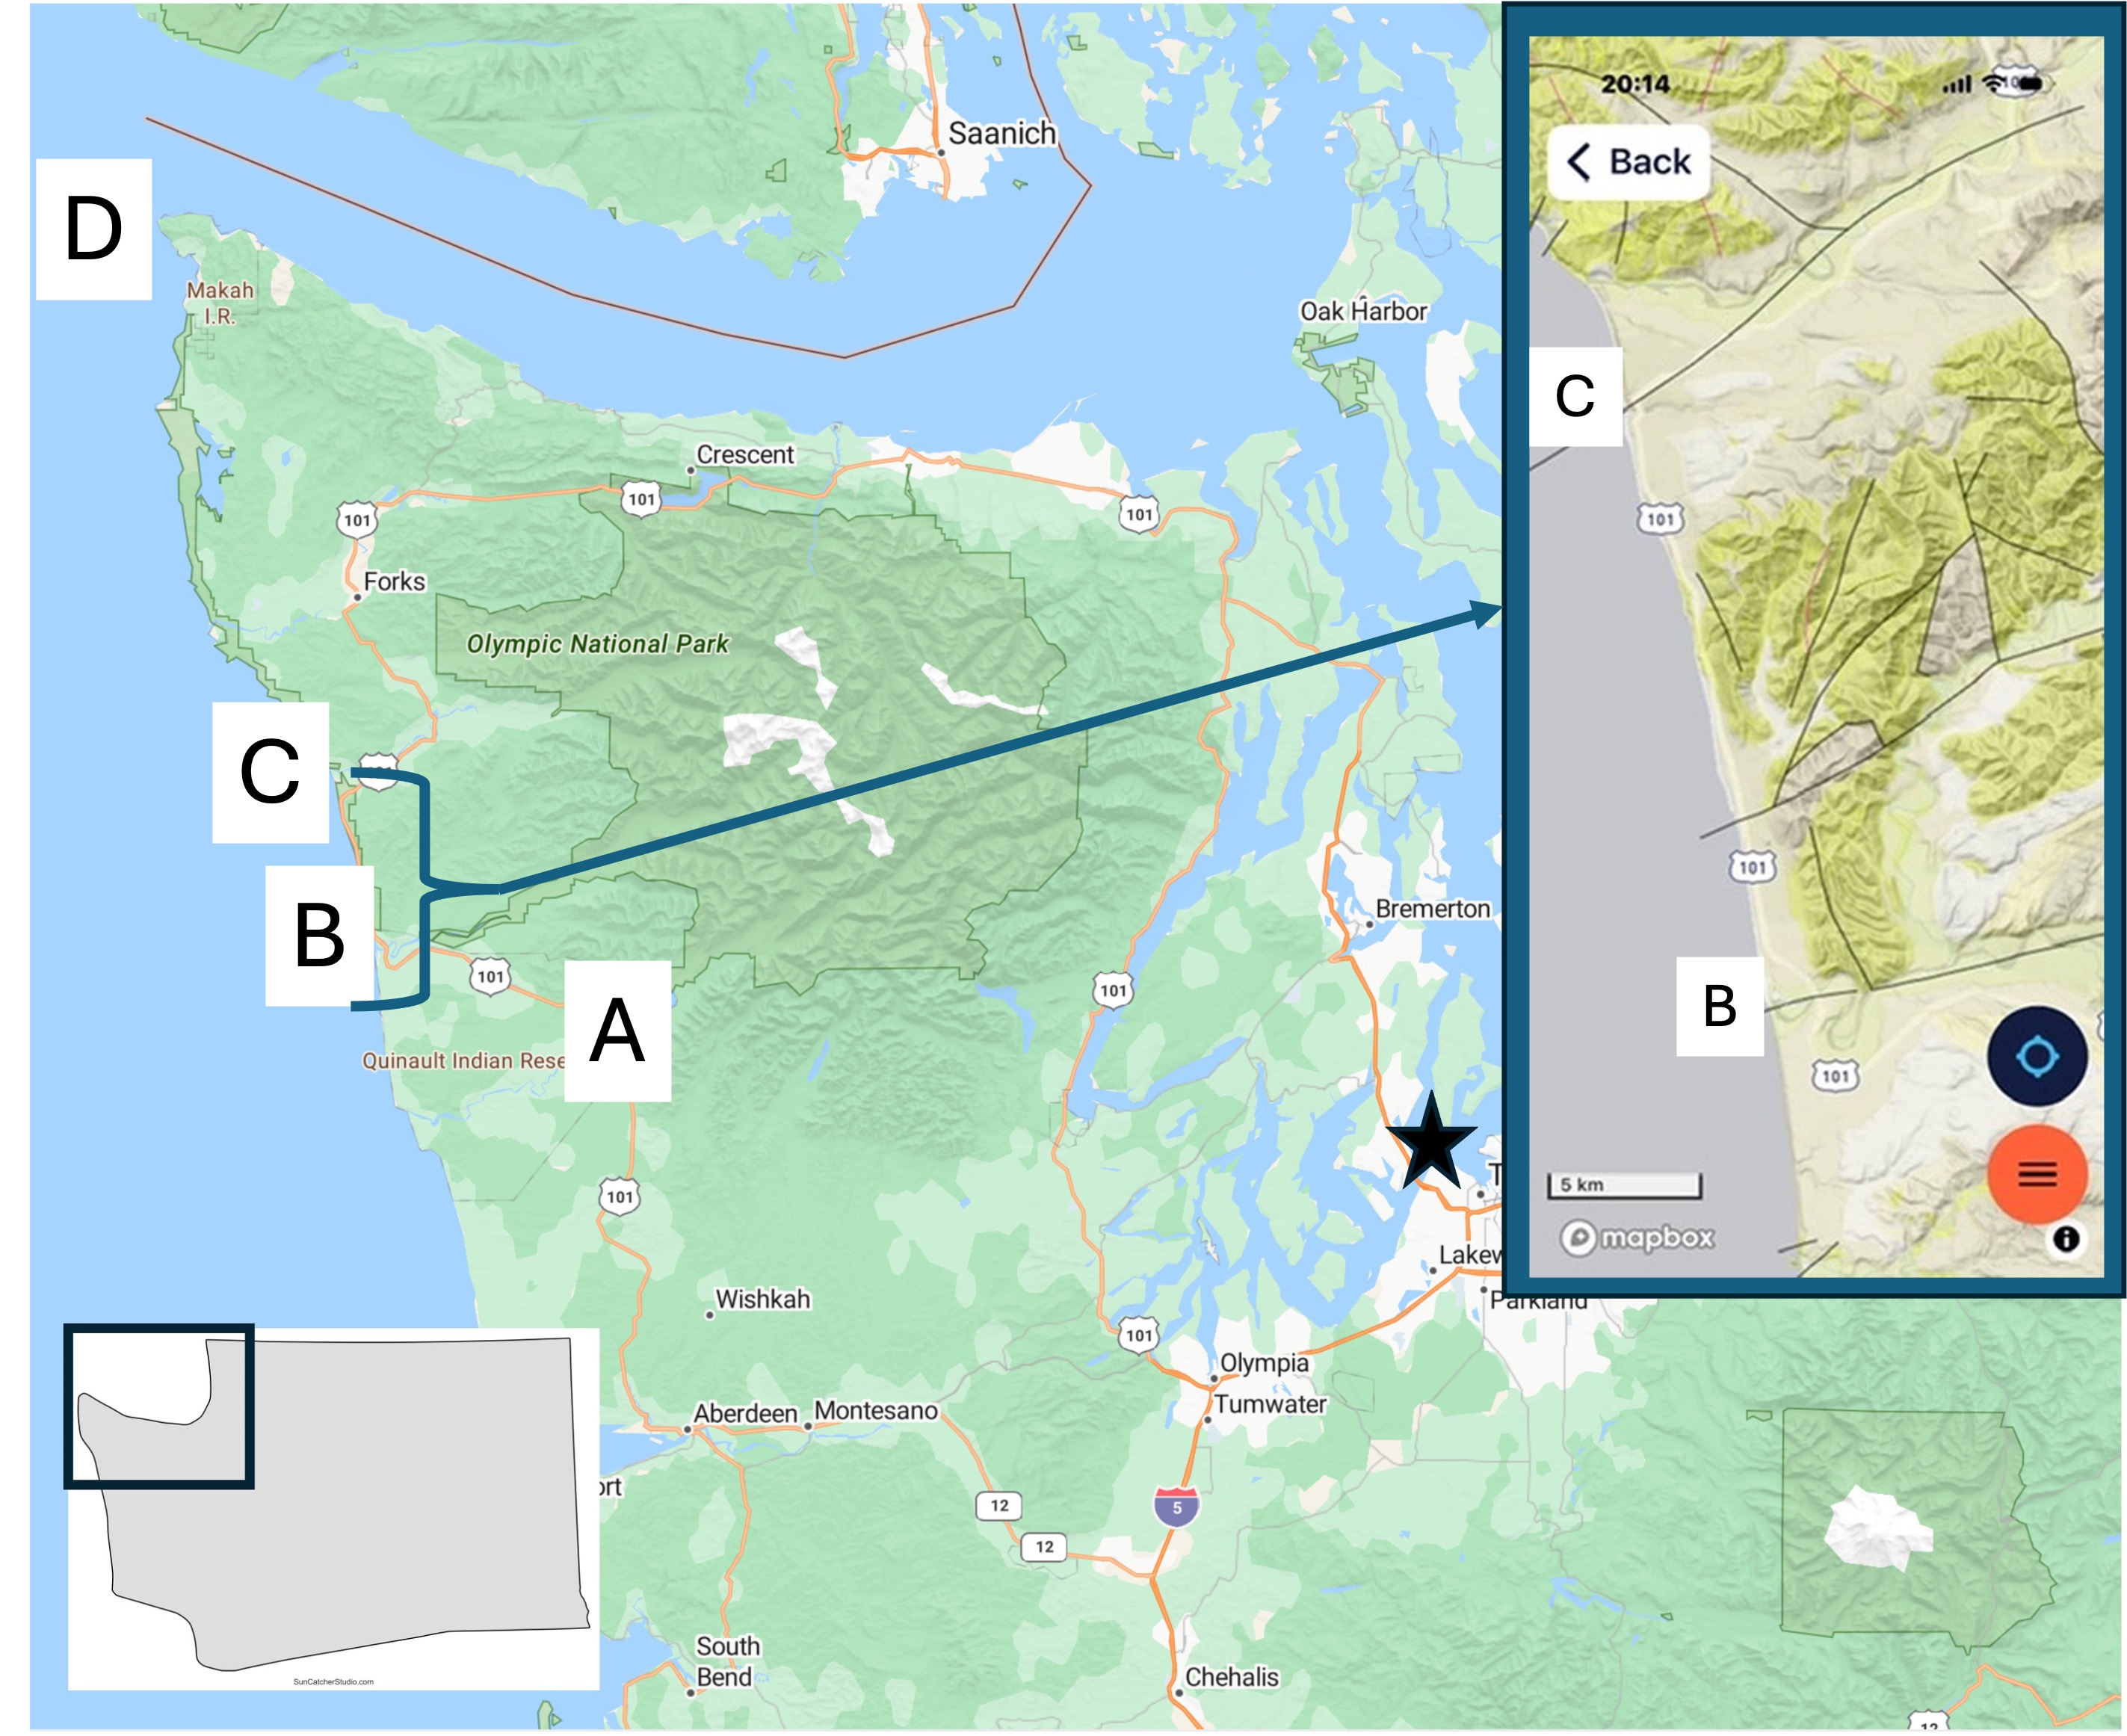
Figure 2. Today’s post describes the coastal geology at Site C. I’ve already discussed the Quinault Rainforest and Kalaloch Beach. I will focus on what is different from the previous post. The inset geologic map from Rock D will be referred to below.
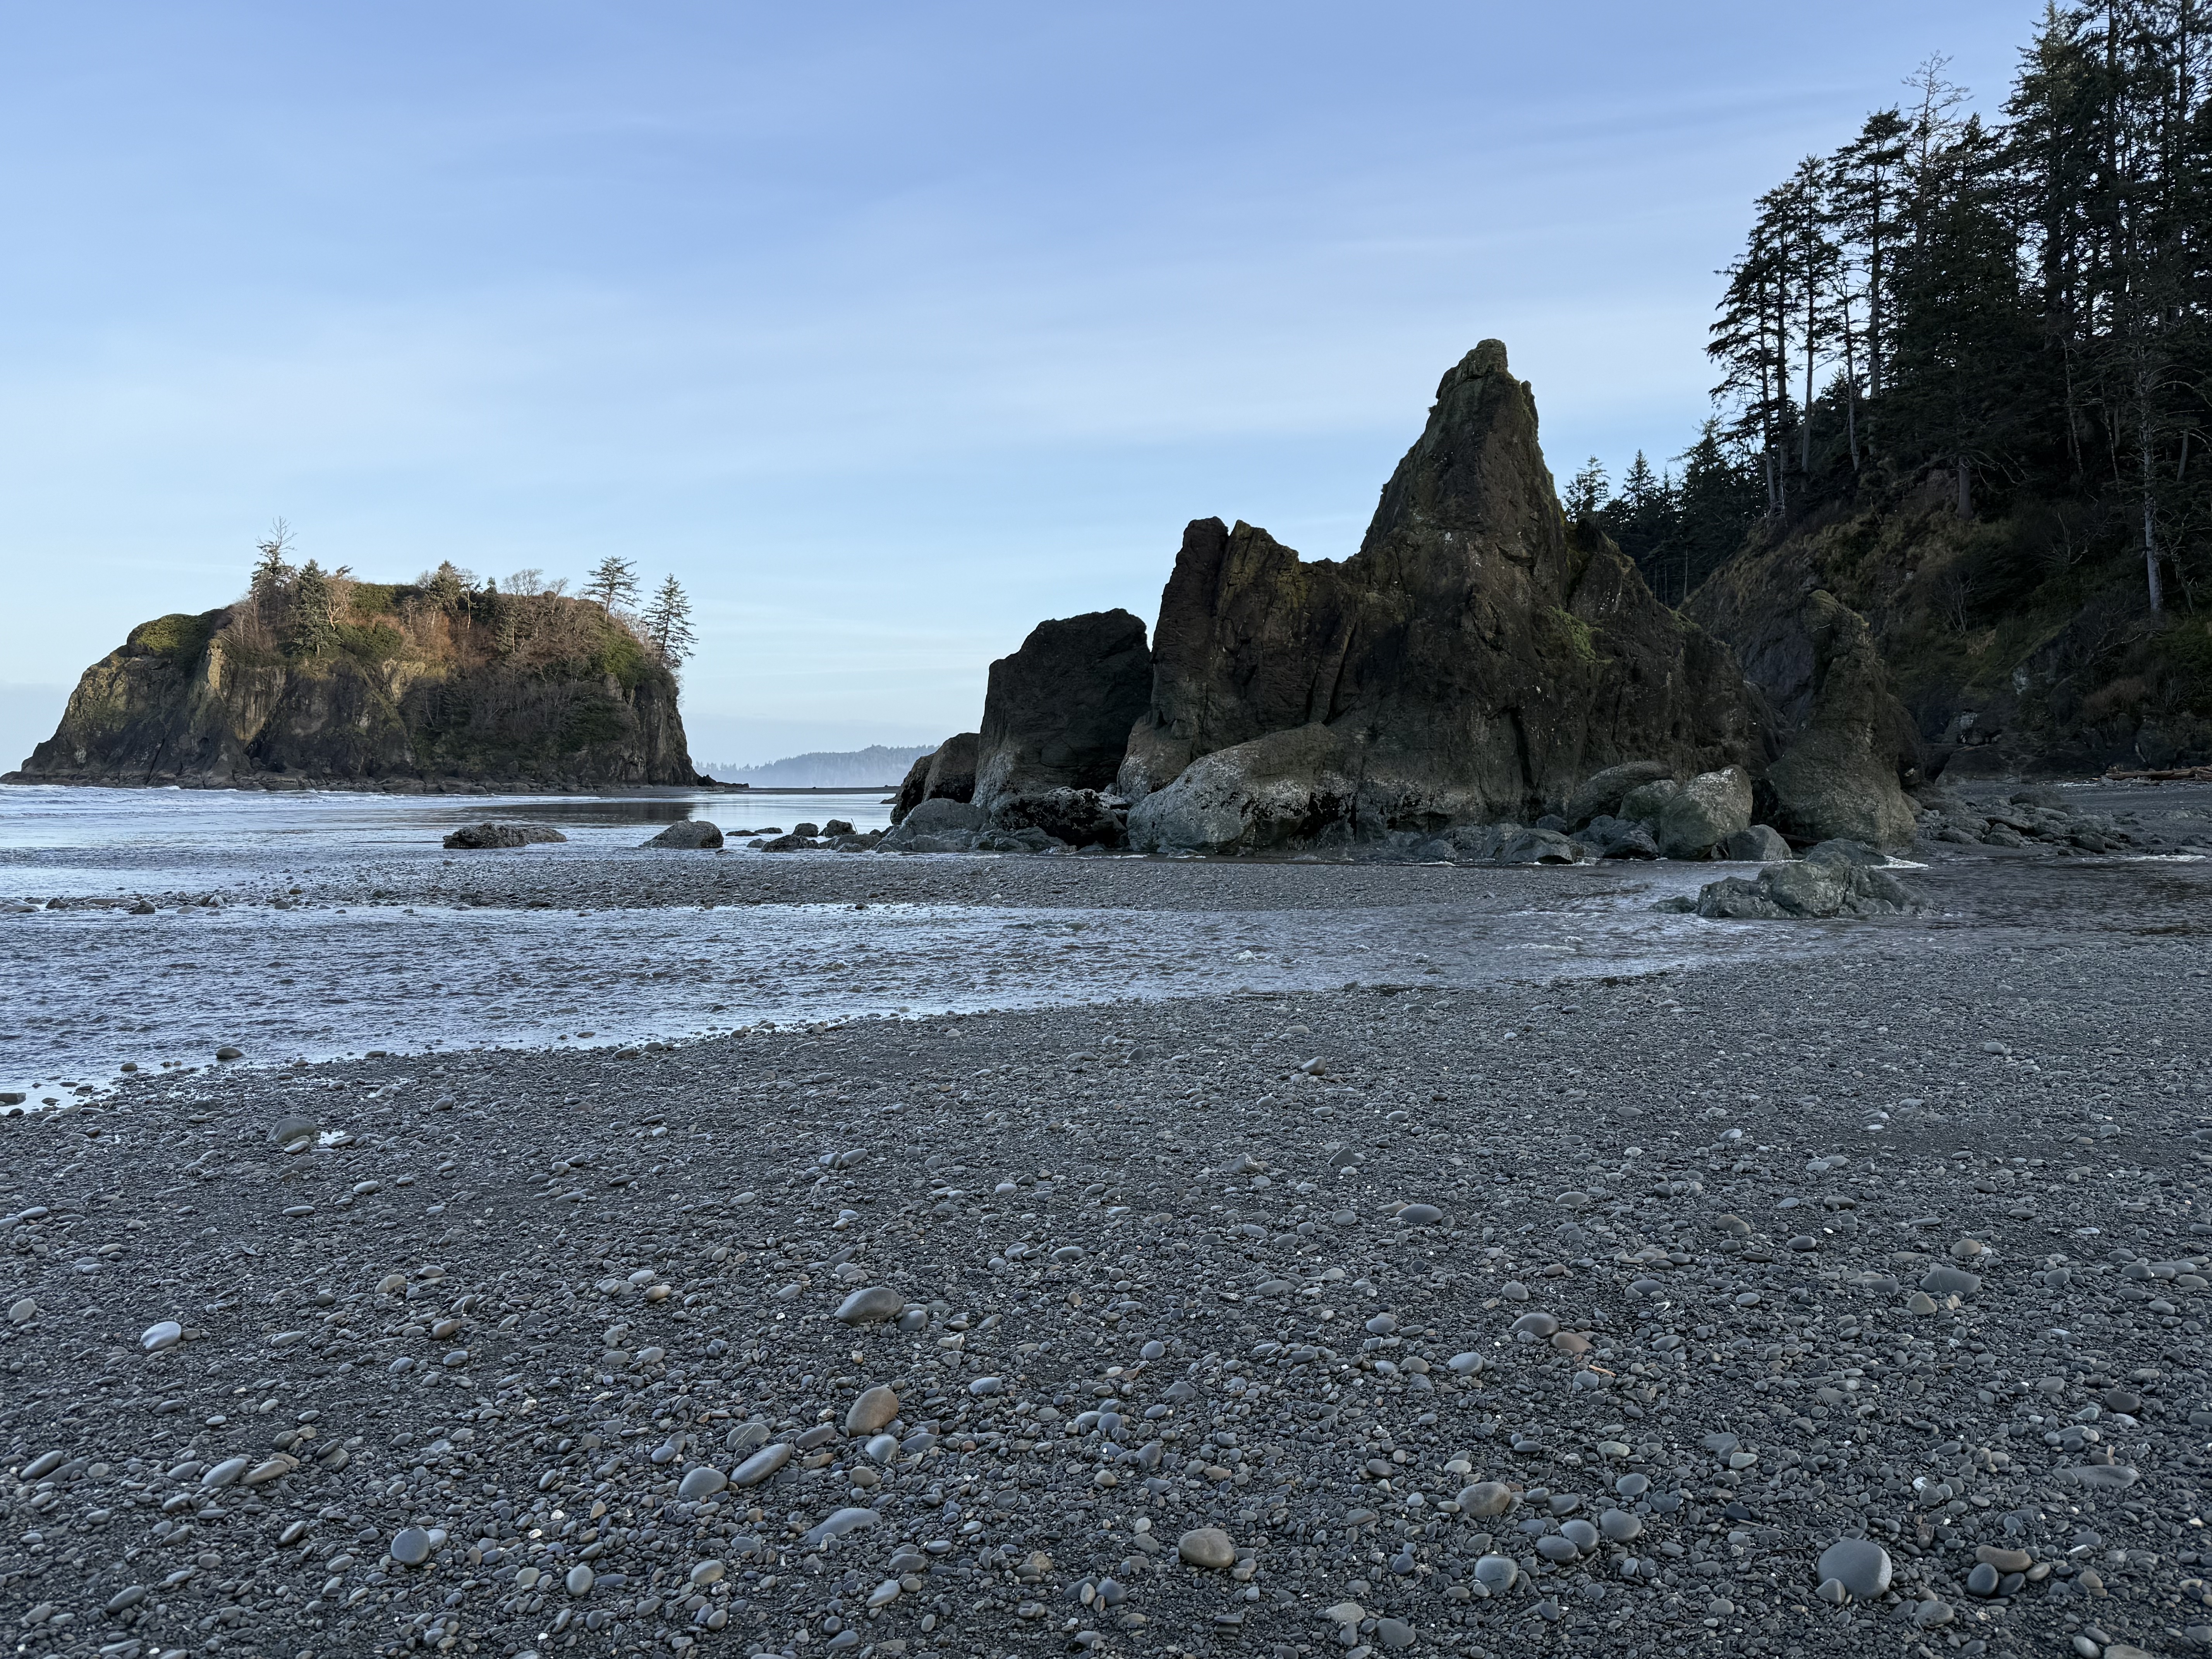
Figure 3. Basement rock of general Tertiary age (66.5-2.4 Ma) is more exposed here although it is overlain by Pleistocene glacial sediments. This photo shows a rocky island that can be reached at low tide, and a promontory. The beach is composed of rounded cobbles in a matrix of sand, silt, and some clay. The finer sediments are restricted to the lower swash zone (Fig. 1).
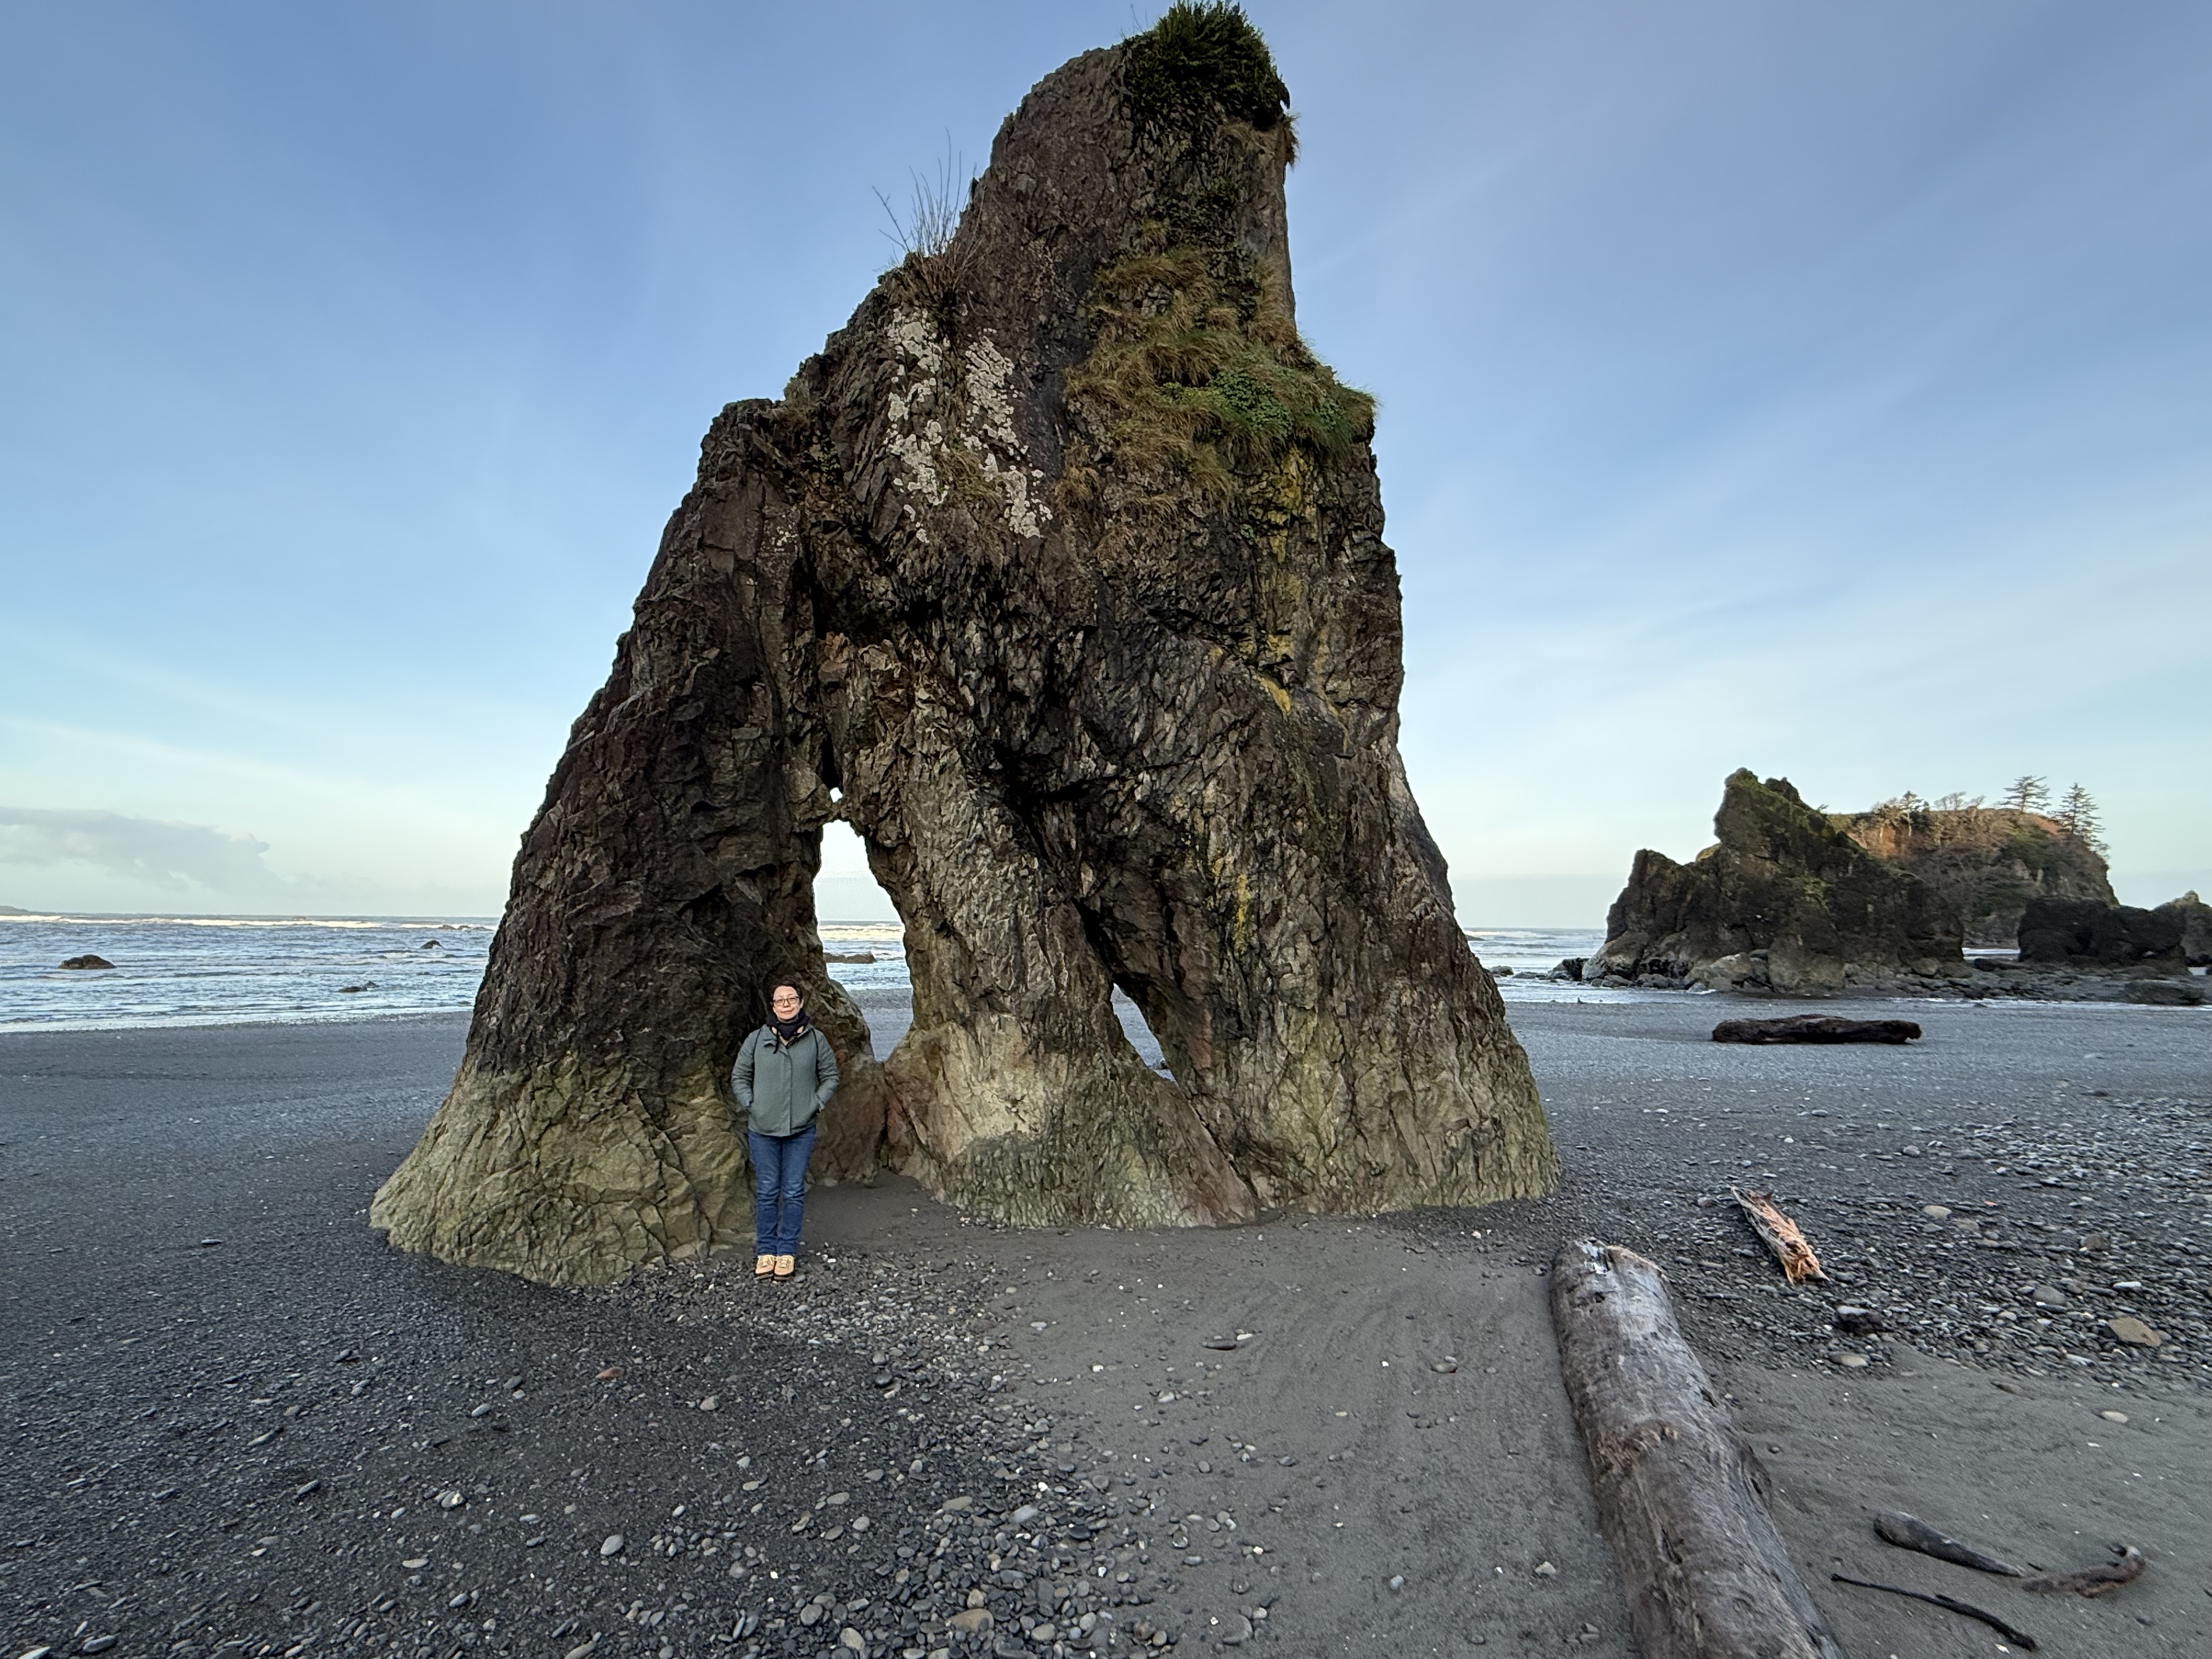
Figure 4. This is a sea stack, a standalone rock pillar. The beach is a thin veneer spread across a rocky basement that is more irregular than we saw at Kalaloch Beach, where the outcrops resembled a wave-cut platform more than we see here. The first thing that occurs to me is that this area hasn’t been exposed to the erosive power of waves for as long an interval. Maybe. Let’s take a look at the inset map of Fig. 2. The black lines represent geologic faults, where rocks have been displaced by tectonic activity. Note that the stretch of coast we’re concerned with is bounded by faults perpendicular to the coast. Furthermore, there is another fault separating Sites B and C. I should take a moment to point out the relationship between faults and river valleys: faults create weak zones within the crust, which are exploited by erosional forces like water and glaciers. Thus we see valleys at both B and C; however, the intervening fault is part of a complex fault system that appears to have led to less surface erosion. Faults cannot be directly dated, only indirectly by the age of the rocks they displace, and in this case those rocks are themselves difficult to date. Thus, it is possible that vertical movement, even a few hundred yards, could have made this beach more irregular than Kalaloch Beach only a few miles to the south–on the other side of a fault. Plausible, but don’t bet your retirement on my hypothesis.
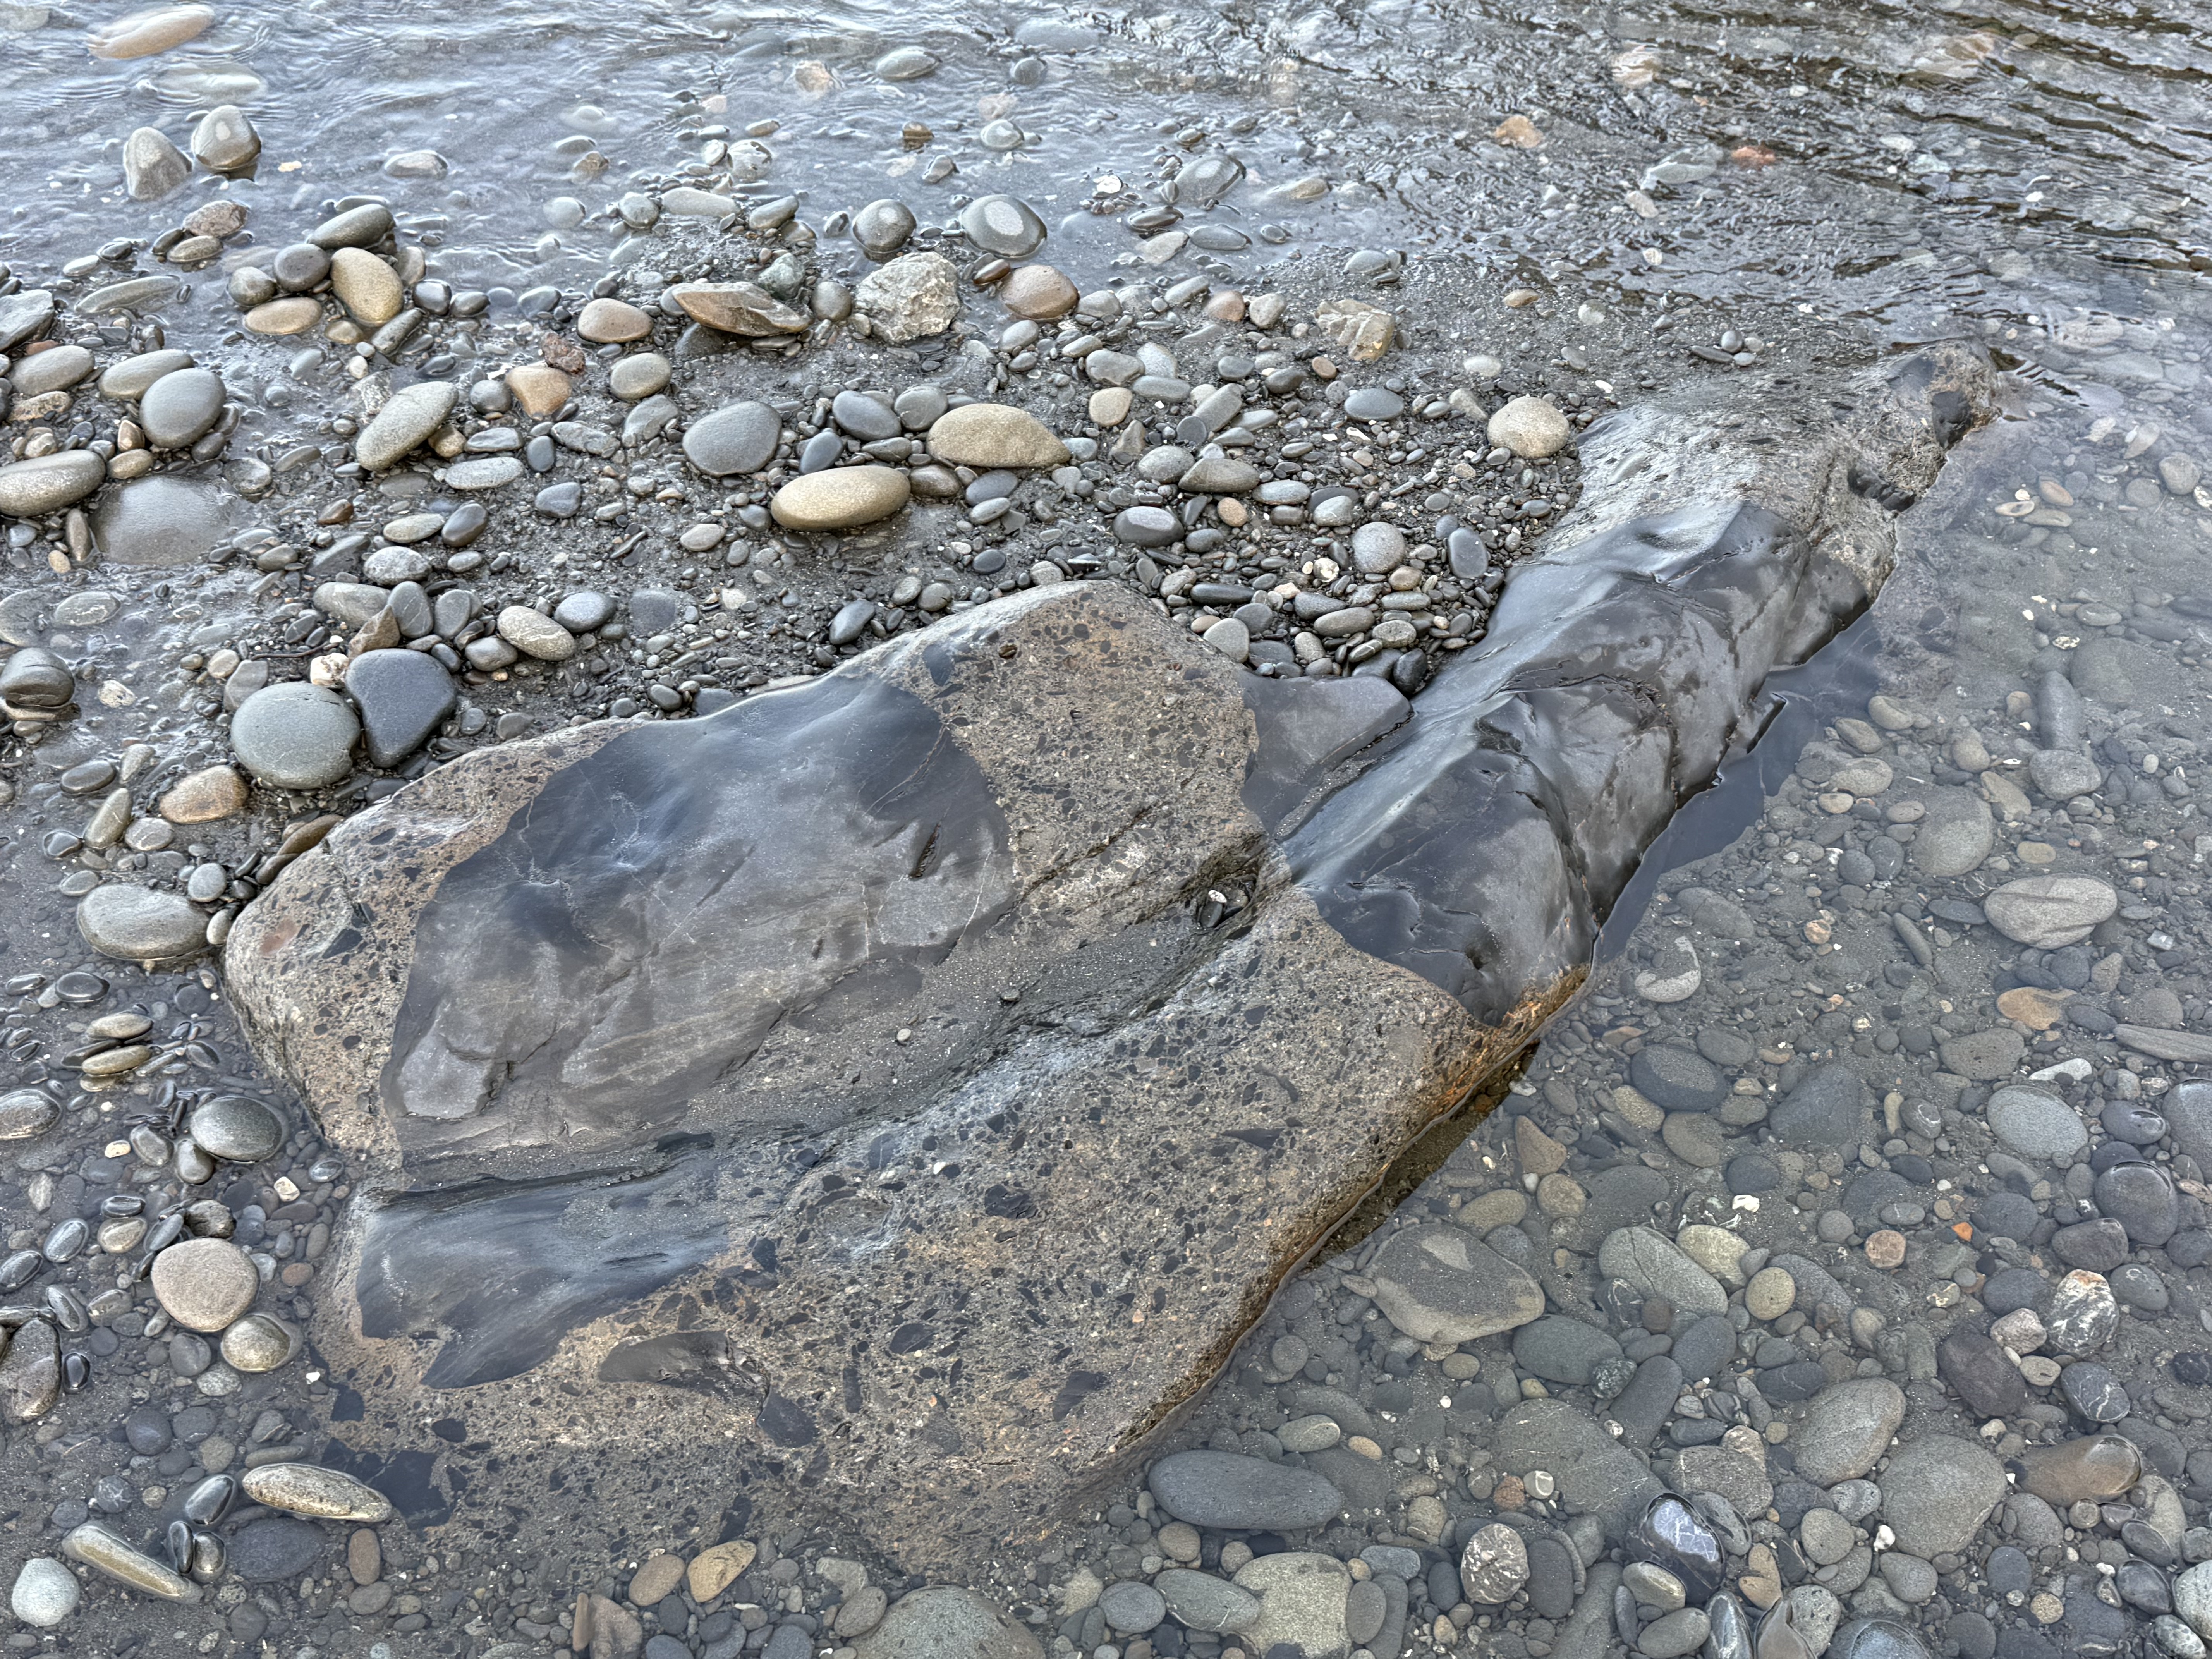
Figure 5. Back to the rocks. This photo puzzled me because I’m not an experienced field geologist, despite my regular posts; however, CoPilot came to the only plausible conclusion: the primary material here is a breccia/graywacke; the smoother material is calcite filling fractures that occurred during faulting (see Fig. 2 inset). We must ALWAYS remember that a sedimentary rock’s history isn’t confined to deposition; a lot happens during burial to many miles and subsequent exhumation and deformation.
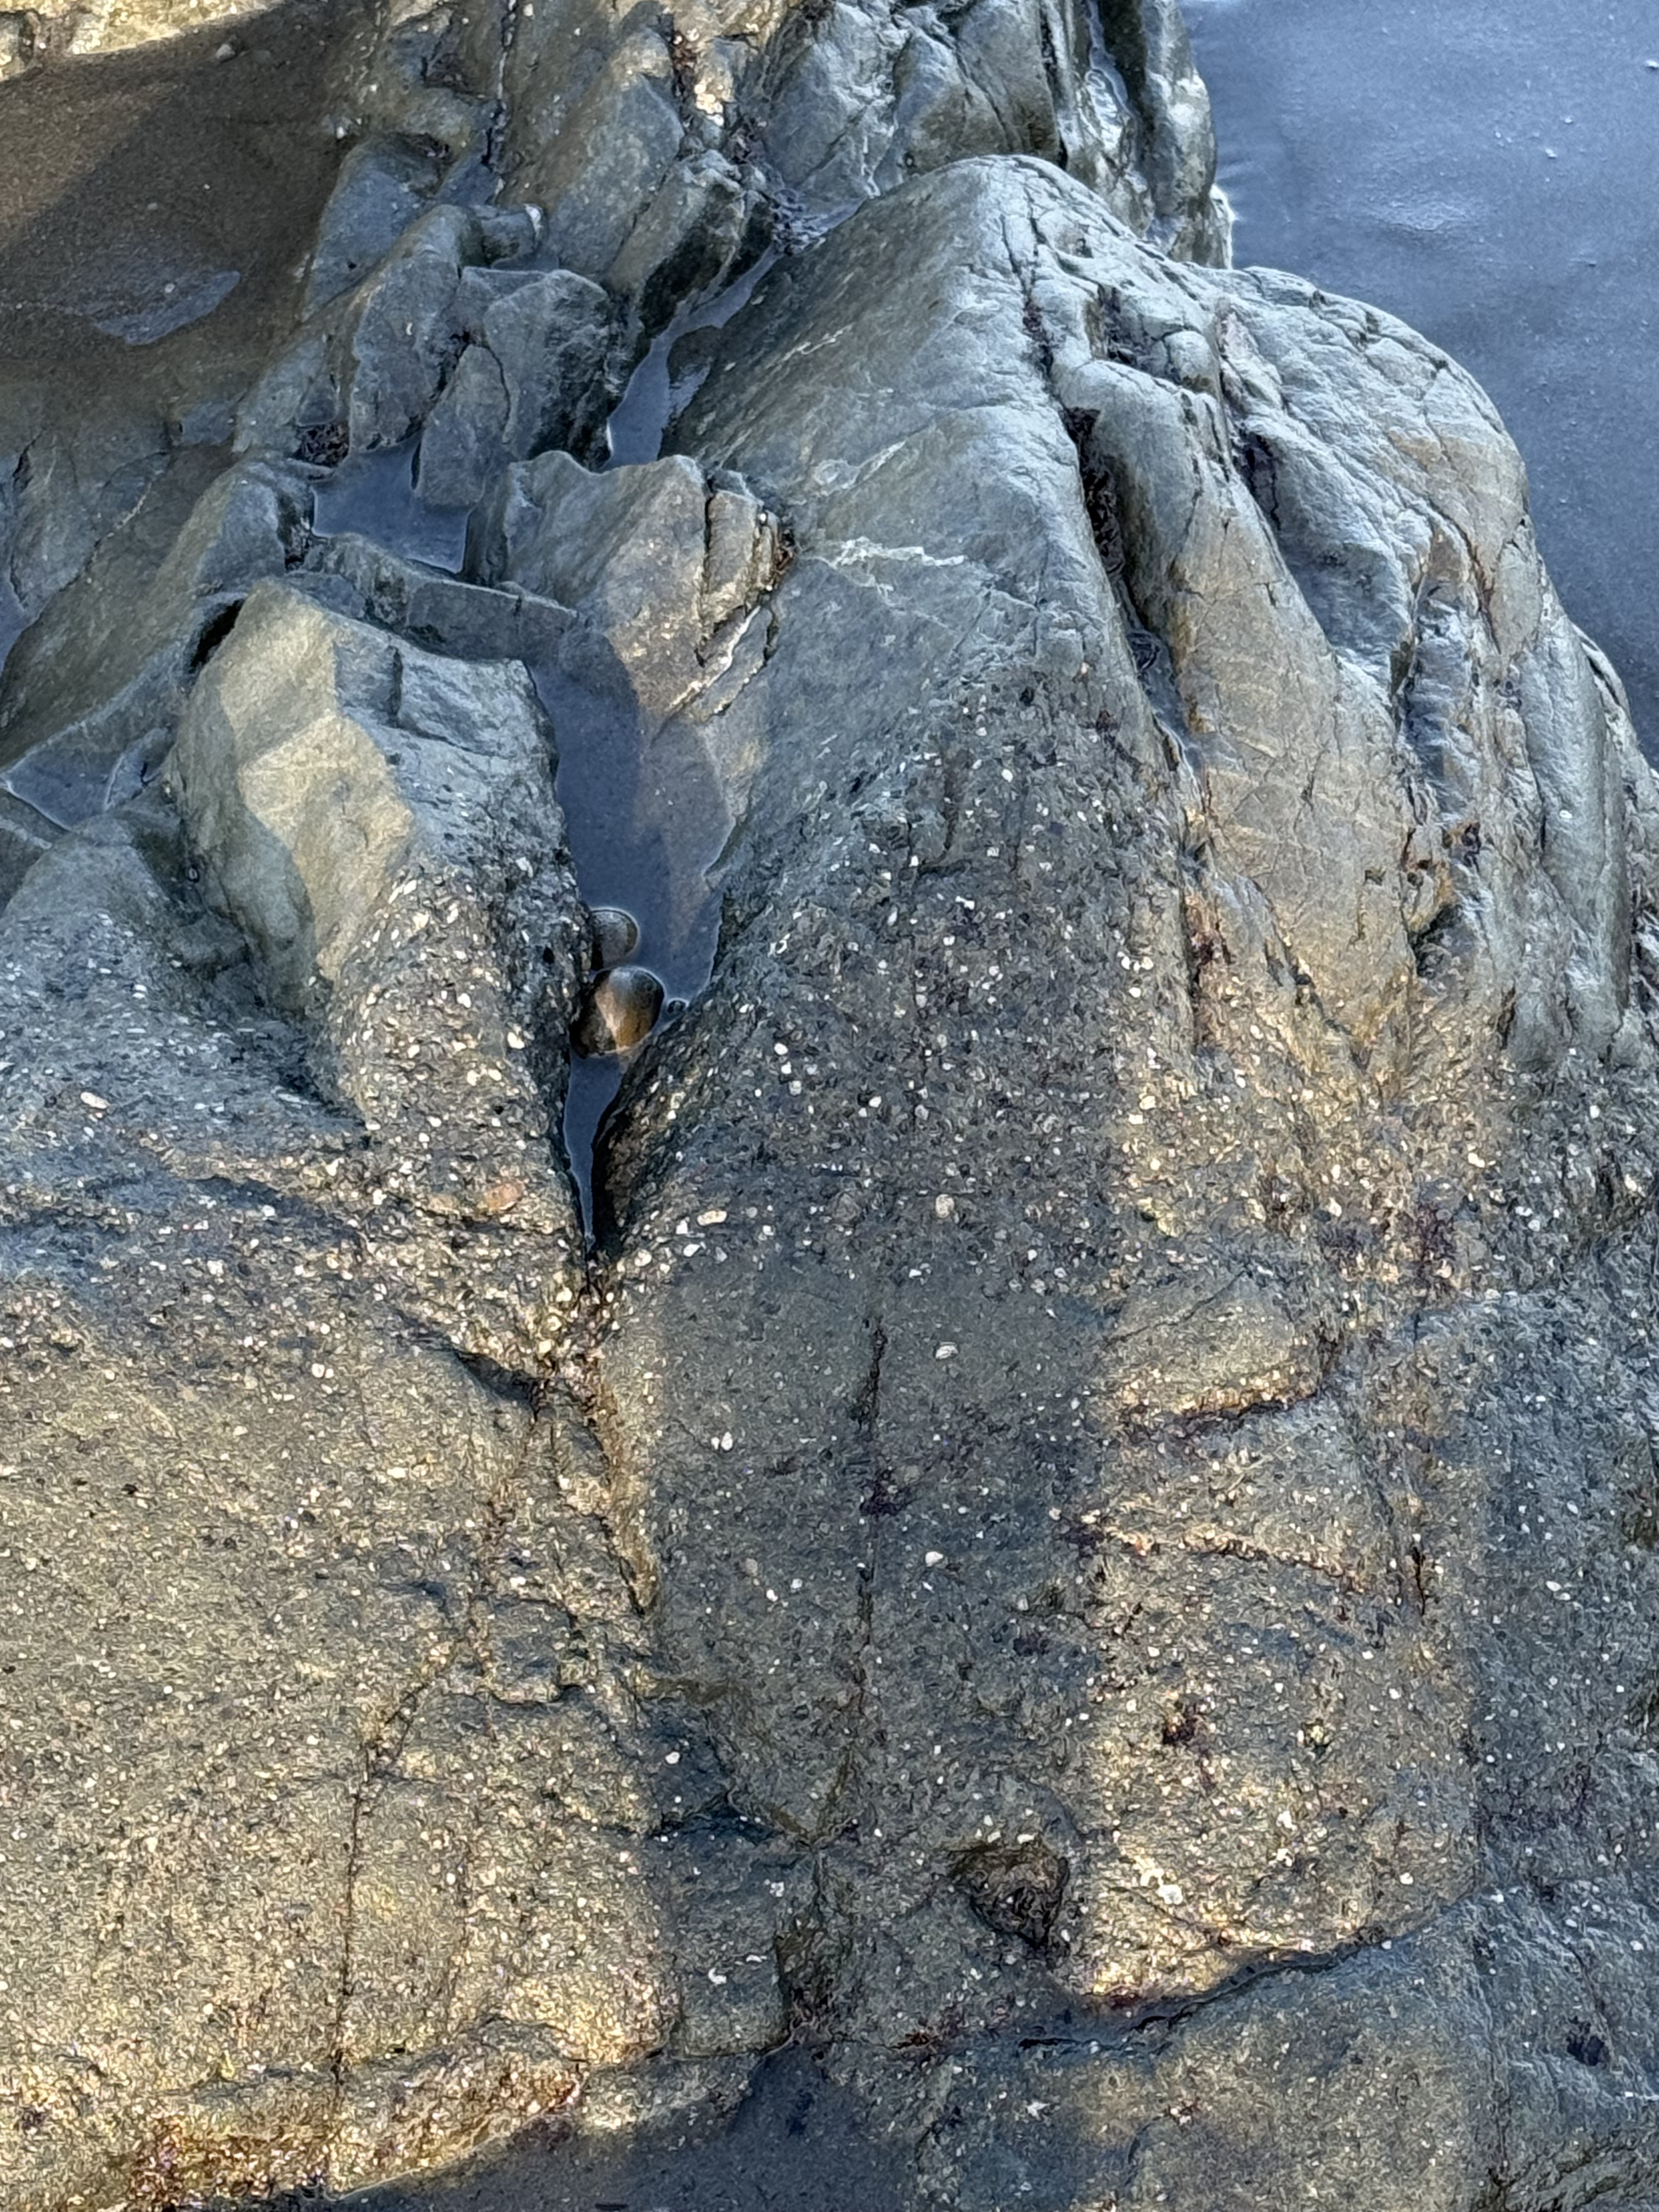
Figure 6. This photo shows a typical graywacke texture with layering, as you might expect with episodic deposition of event beds (e.g. turbidites on a submarine fan); but the upper part of the image is similar to Fig. 6. I asked CoPilot about the source of so much Calcium and I agree with its answer: Some of the Calcium came from marine invertebrates living in the area, but the bulk arrived later, when the sediments were buried deep (several miles) within the accretionary wedge where Calcium is released from minerals like feldspar. It’s really hot down there and the pressure is INTENSE.
Summary.
Not only was Ruby Beach a beautiful area on a cool winter/spring morning, it gave us more insight into the complex life of the earth’s crust. These rocks were probably deposited as poorly sorted graywacke on a steep continental margin overwhelmed by sediment eroded from the rising Cascades (more than likely the Eocene, 56-34 Ma). They were buried for a few million years, before being scraped off the subducting oceanic crust and filled with hot fluids that originated from deeper within the accretionary prism. They were never so humiliated that they became melanges but it was a pretty rough ride, even for a rock.
To put this all in perspective, dinosaurs had just gone extinct (~65 Ma) when all hell broke loose and the Cascades Subduction Zone became very active about ten-million years later; the earth became hot as hell, mammals and birds were beginning to get their legs and wings. While the ecosystem changed dramatically, these rocks were being ground up and spit out by the earth because they were stuck on the end of its tongue. We hominids didn’t come along until these rocks were exposed to the vagaries of the weather and had eroded for a VERY long time.
Try not to laugh at the punch line: Our entire history is contained in the Pleistocene glacial sediments overlying these fairly young sediments.
It boggles the mind…
The Olympic Peninsula: Quinault Rainforest to Cape Flattery
This is the first in what I hope will become a regular series of blogs from my travels around the Pacific Northwest (PNW) as well as trips throughout the world. This series accompanies my main blog, Rocks and (no) Roads, which reports on the geology of various places to which I travel. You could see I’m expanding my horizons; in addition to posting about general sights in this post, I will also be including environmental and ecological observations that are of interest to me. My background is in geology, but I’ve become aware of a lot more since moving to the PNW. So this is a learning experience, thanks in large part to the availability of expert assistance from CoPilot, Microsoft’s version of ChatGPT. I’ll be turning to it to identify plants and evidence of animal activity in future posts.
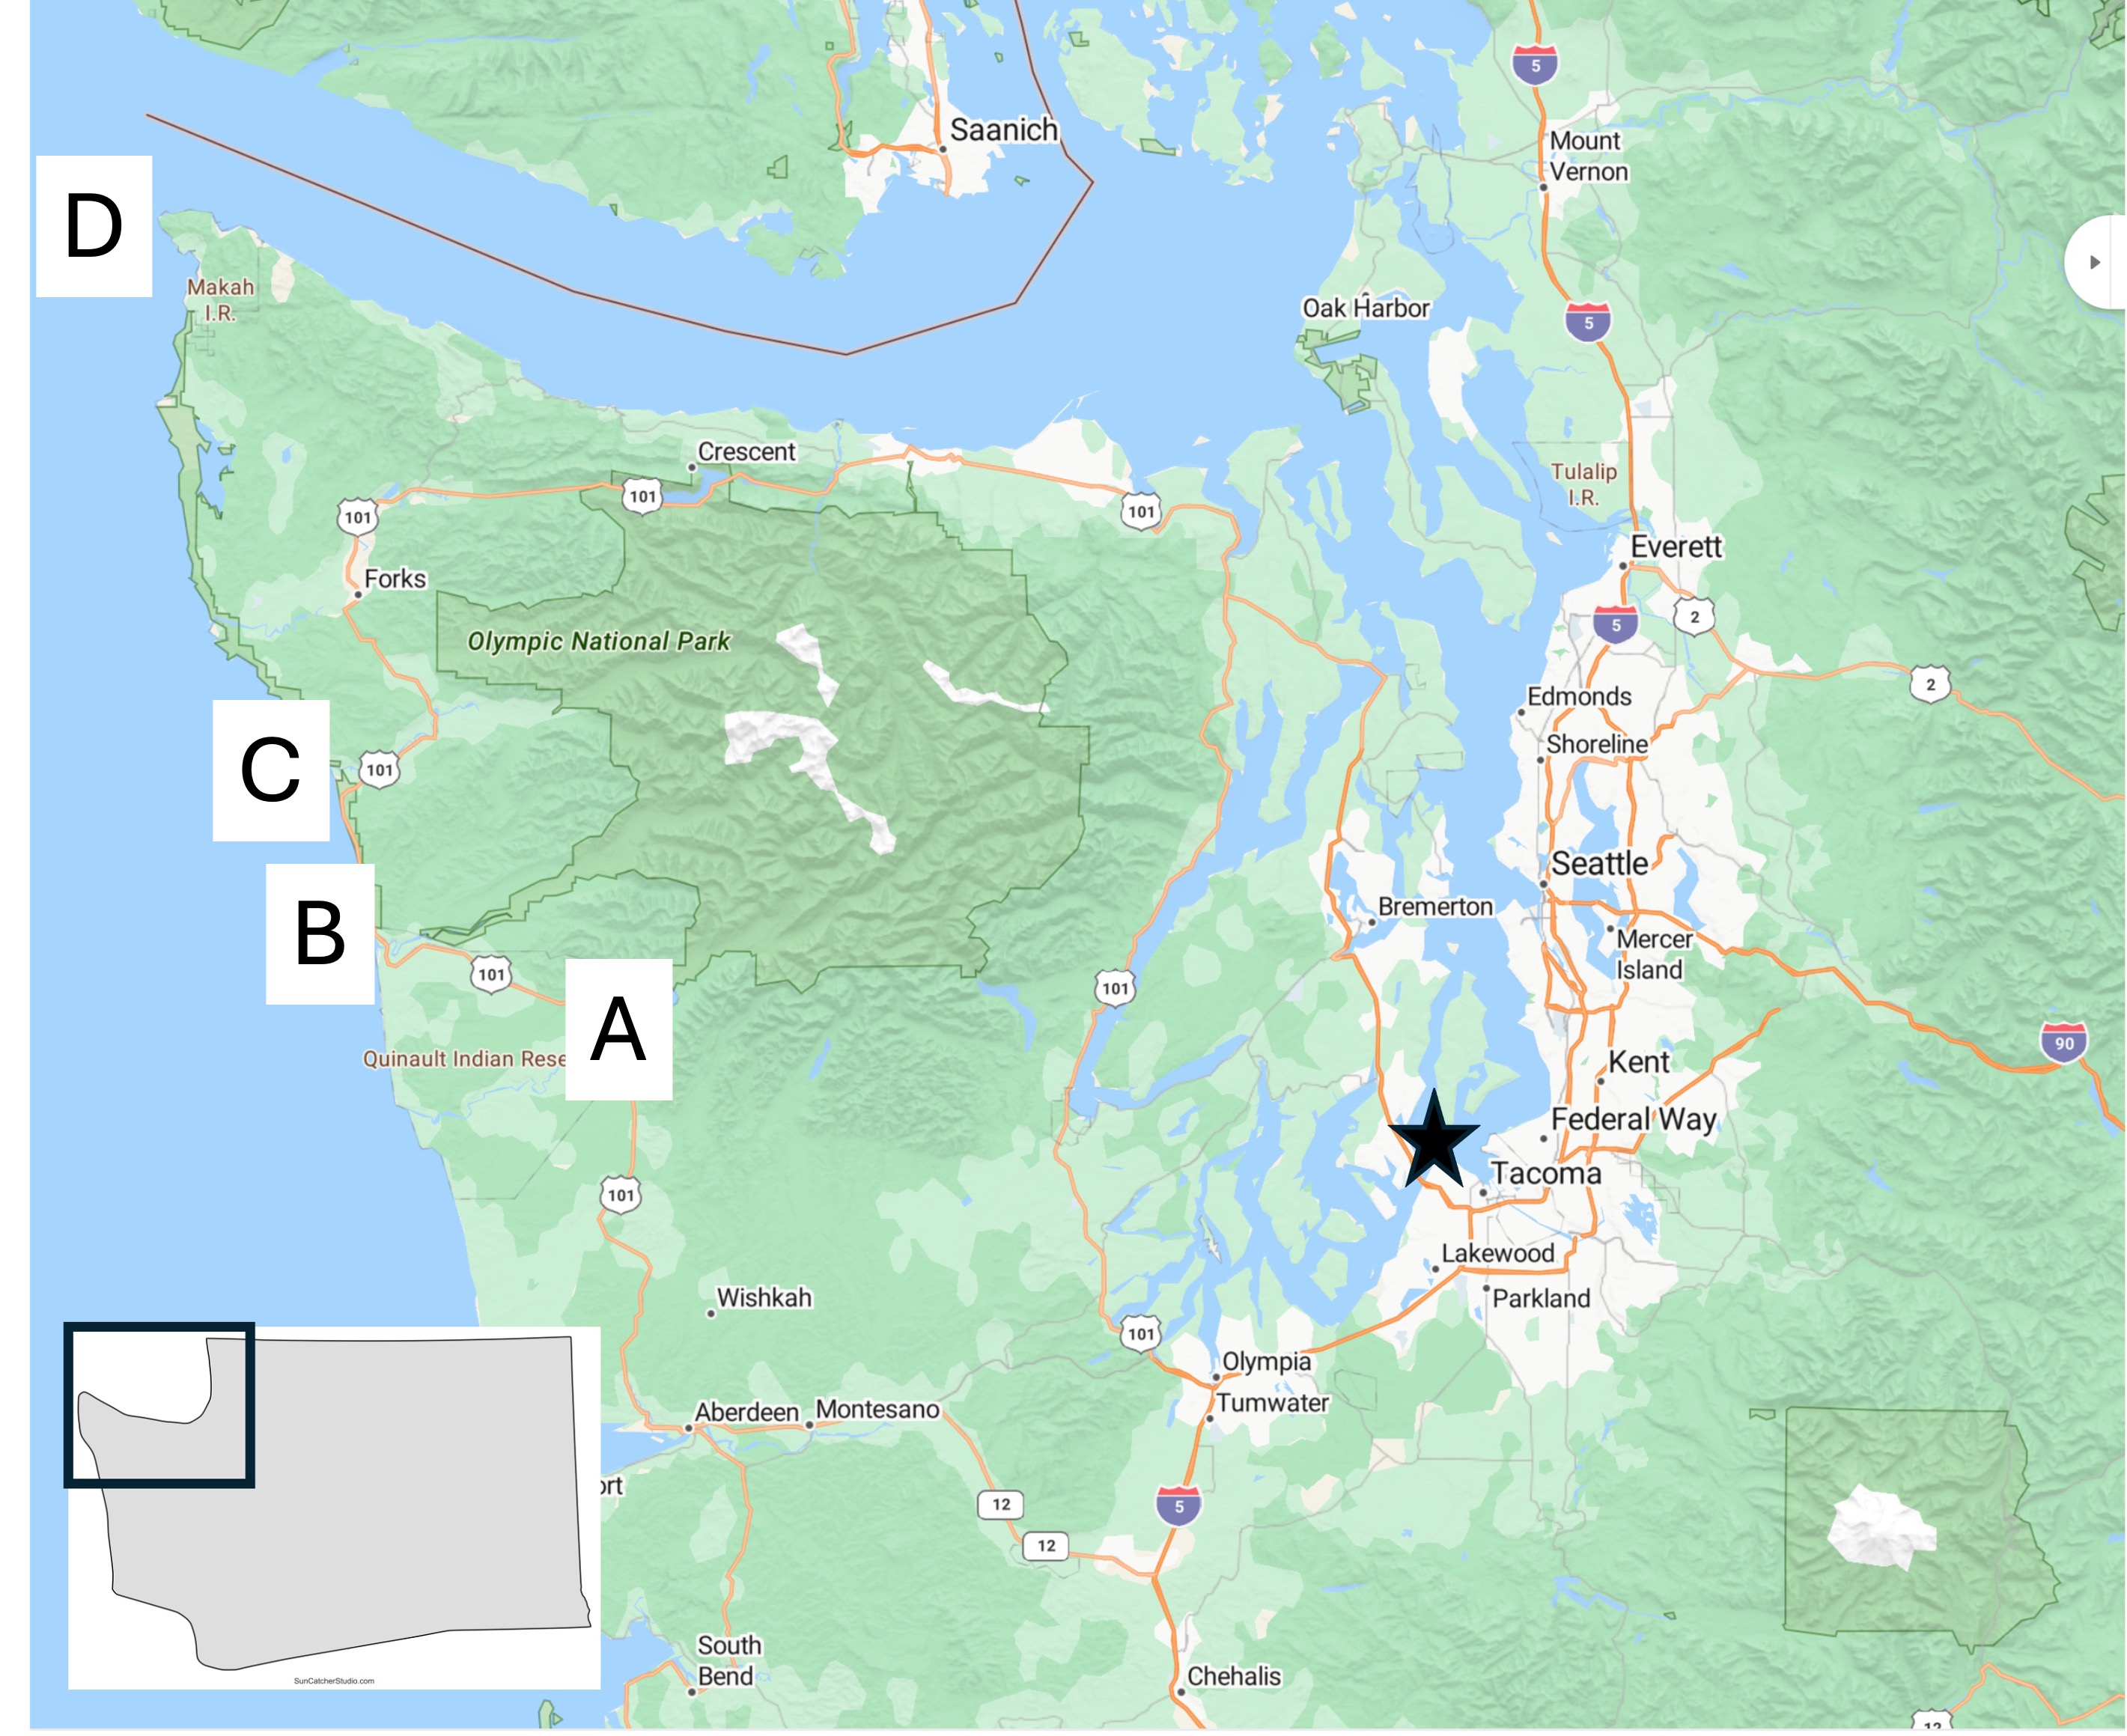
This is the base map I’ll be using in many of my posts from the PNW. The star indicates my base in Tacoma. Today’s post describes a two-day trip to circumnavigate the Olympic Peninsula. Although this area is the wettest in the contiguous United States, with annual rainfall up to twelve-feet, it was clear for the duration of my visit. The labeled areas indicate where the photos described below were taken.
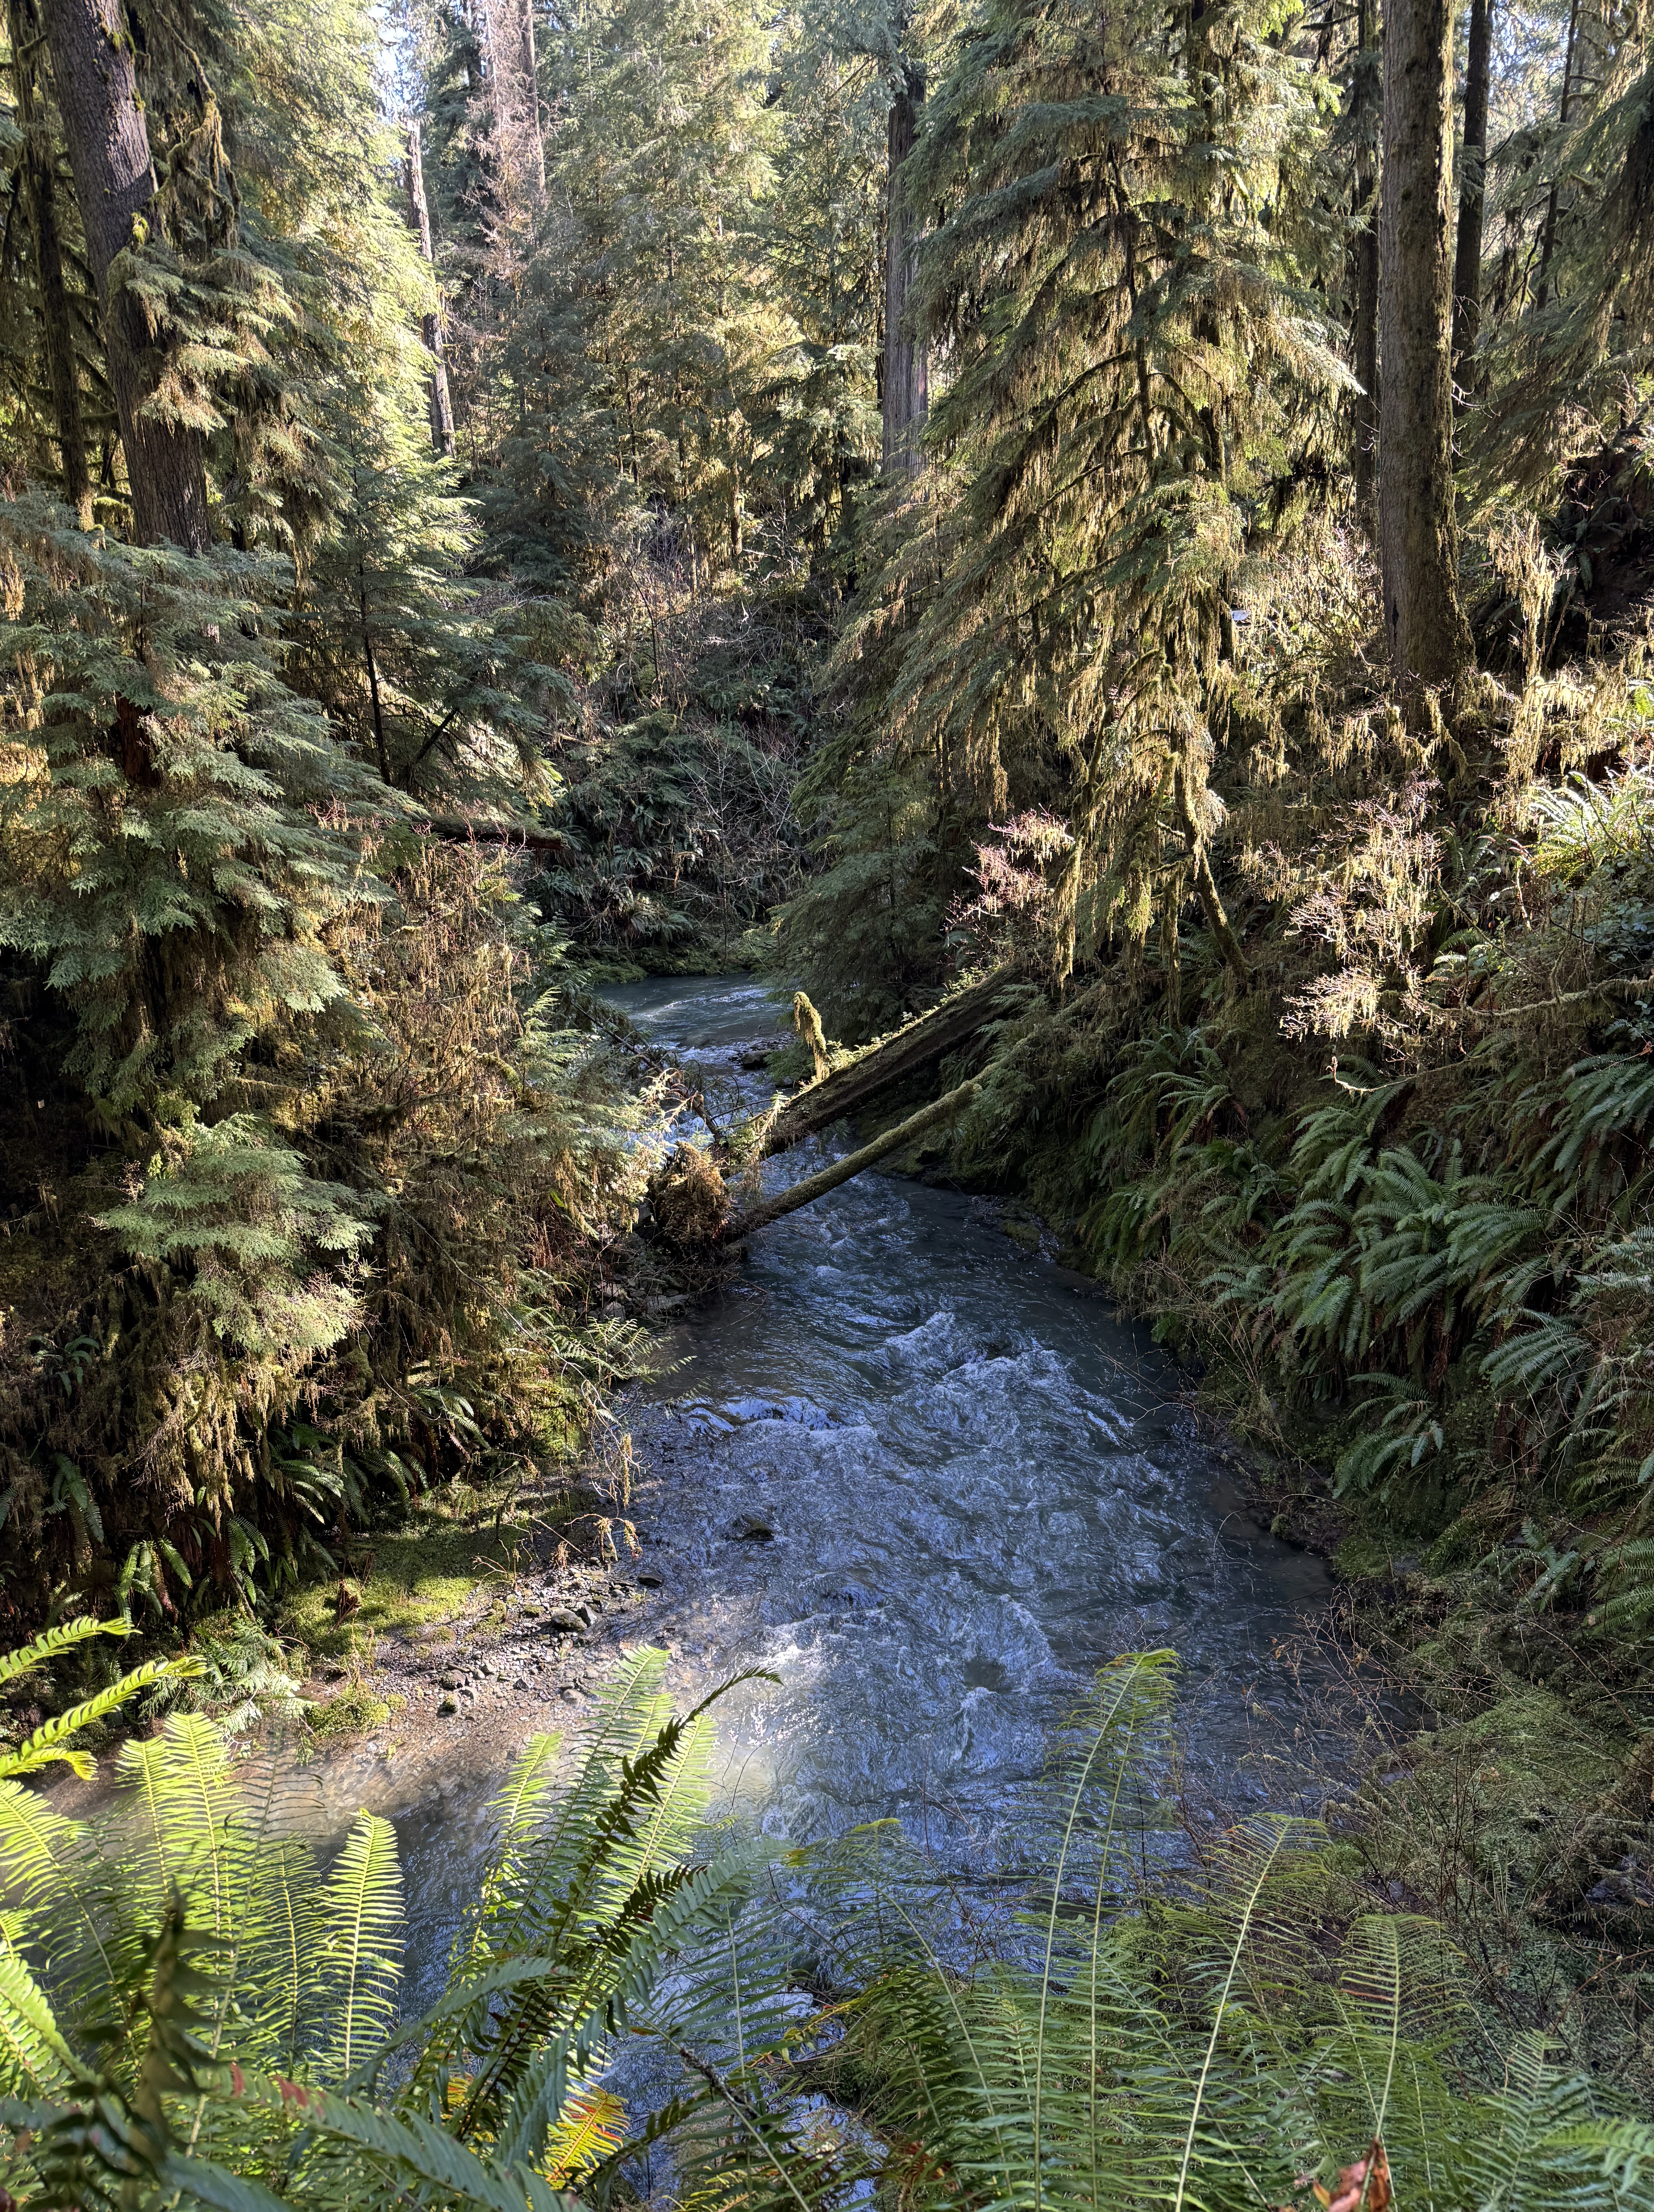
Location A: Quinault Rainforest. Photographs can’t do justice to the experience of being surrounded by a temperate rainforest. There are many trails of different lengths, but I followed a shorter one (about one mile) that followed Willaby Creek for a while before turning into the depths of the forest. This image shows the creek rushing by about 50 feet below the trail as it races to the south shore of Lake Quinault.
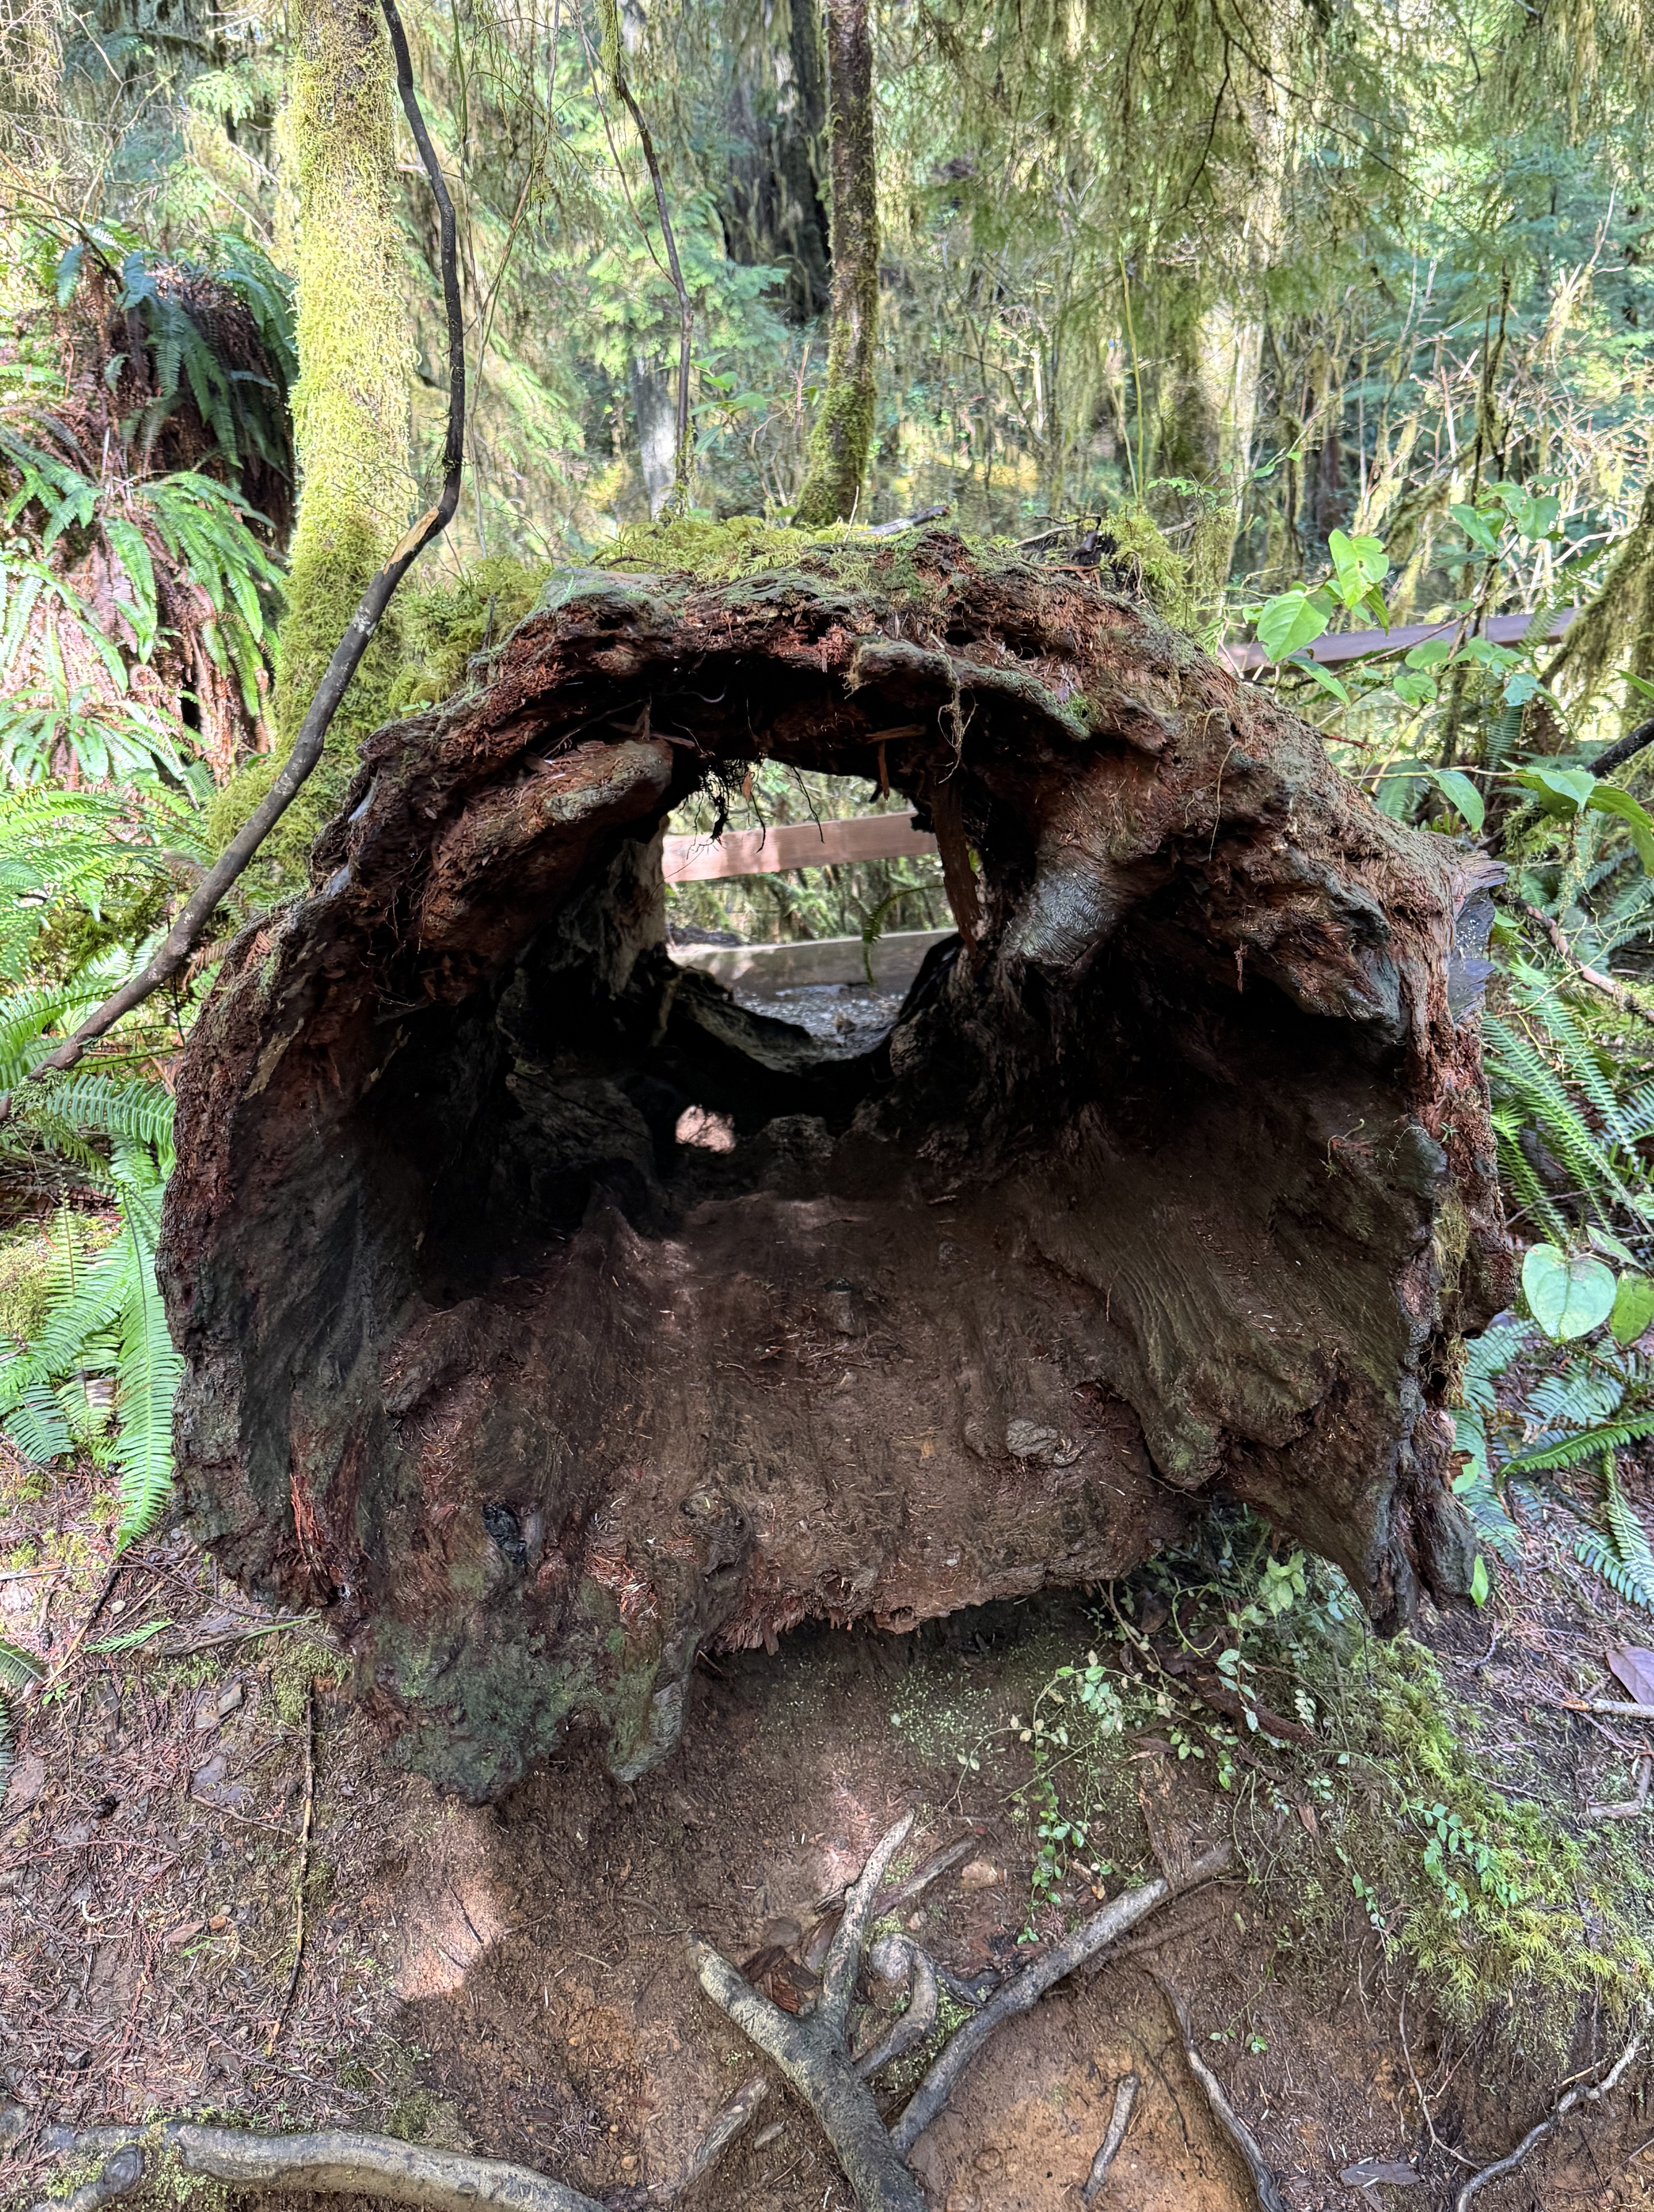
Location A: Quinault Rainforest. This rotted log is about six-feet in diameter. It is representative of the ongoing decay and rebirth of the forest. I’ll talk more about that in another post. Note the ferns growing out of the decaying wood.
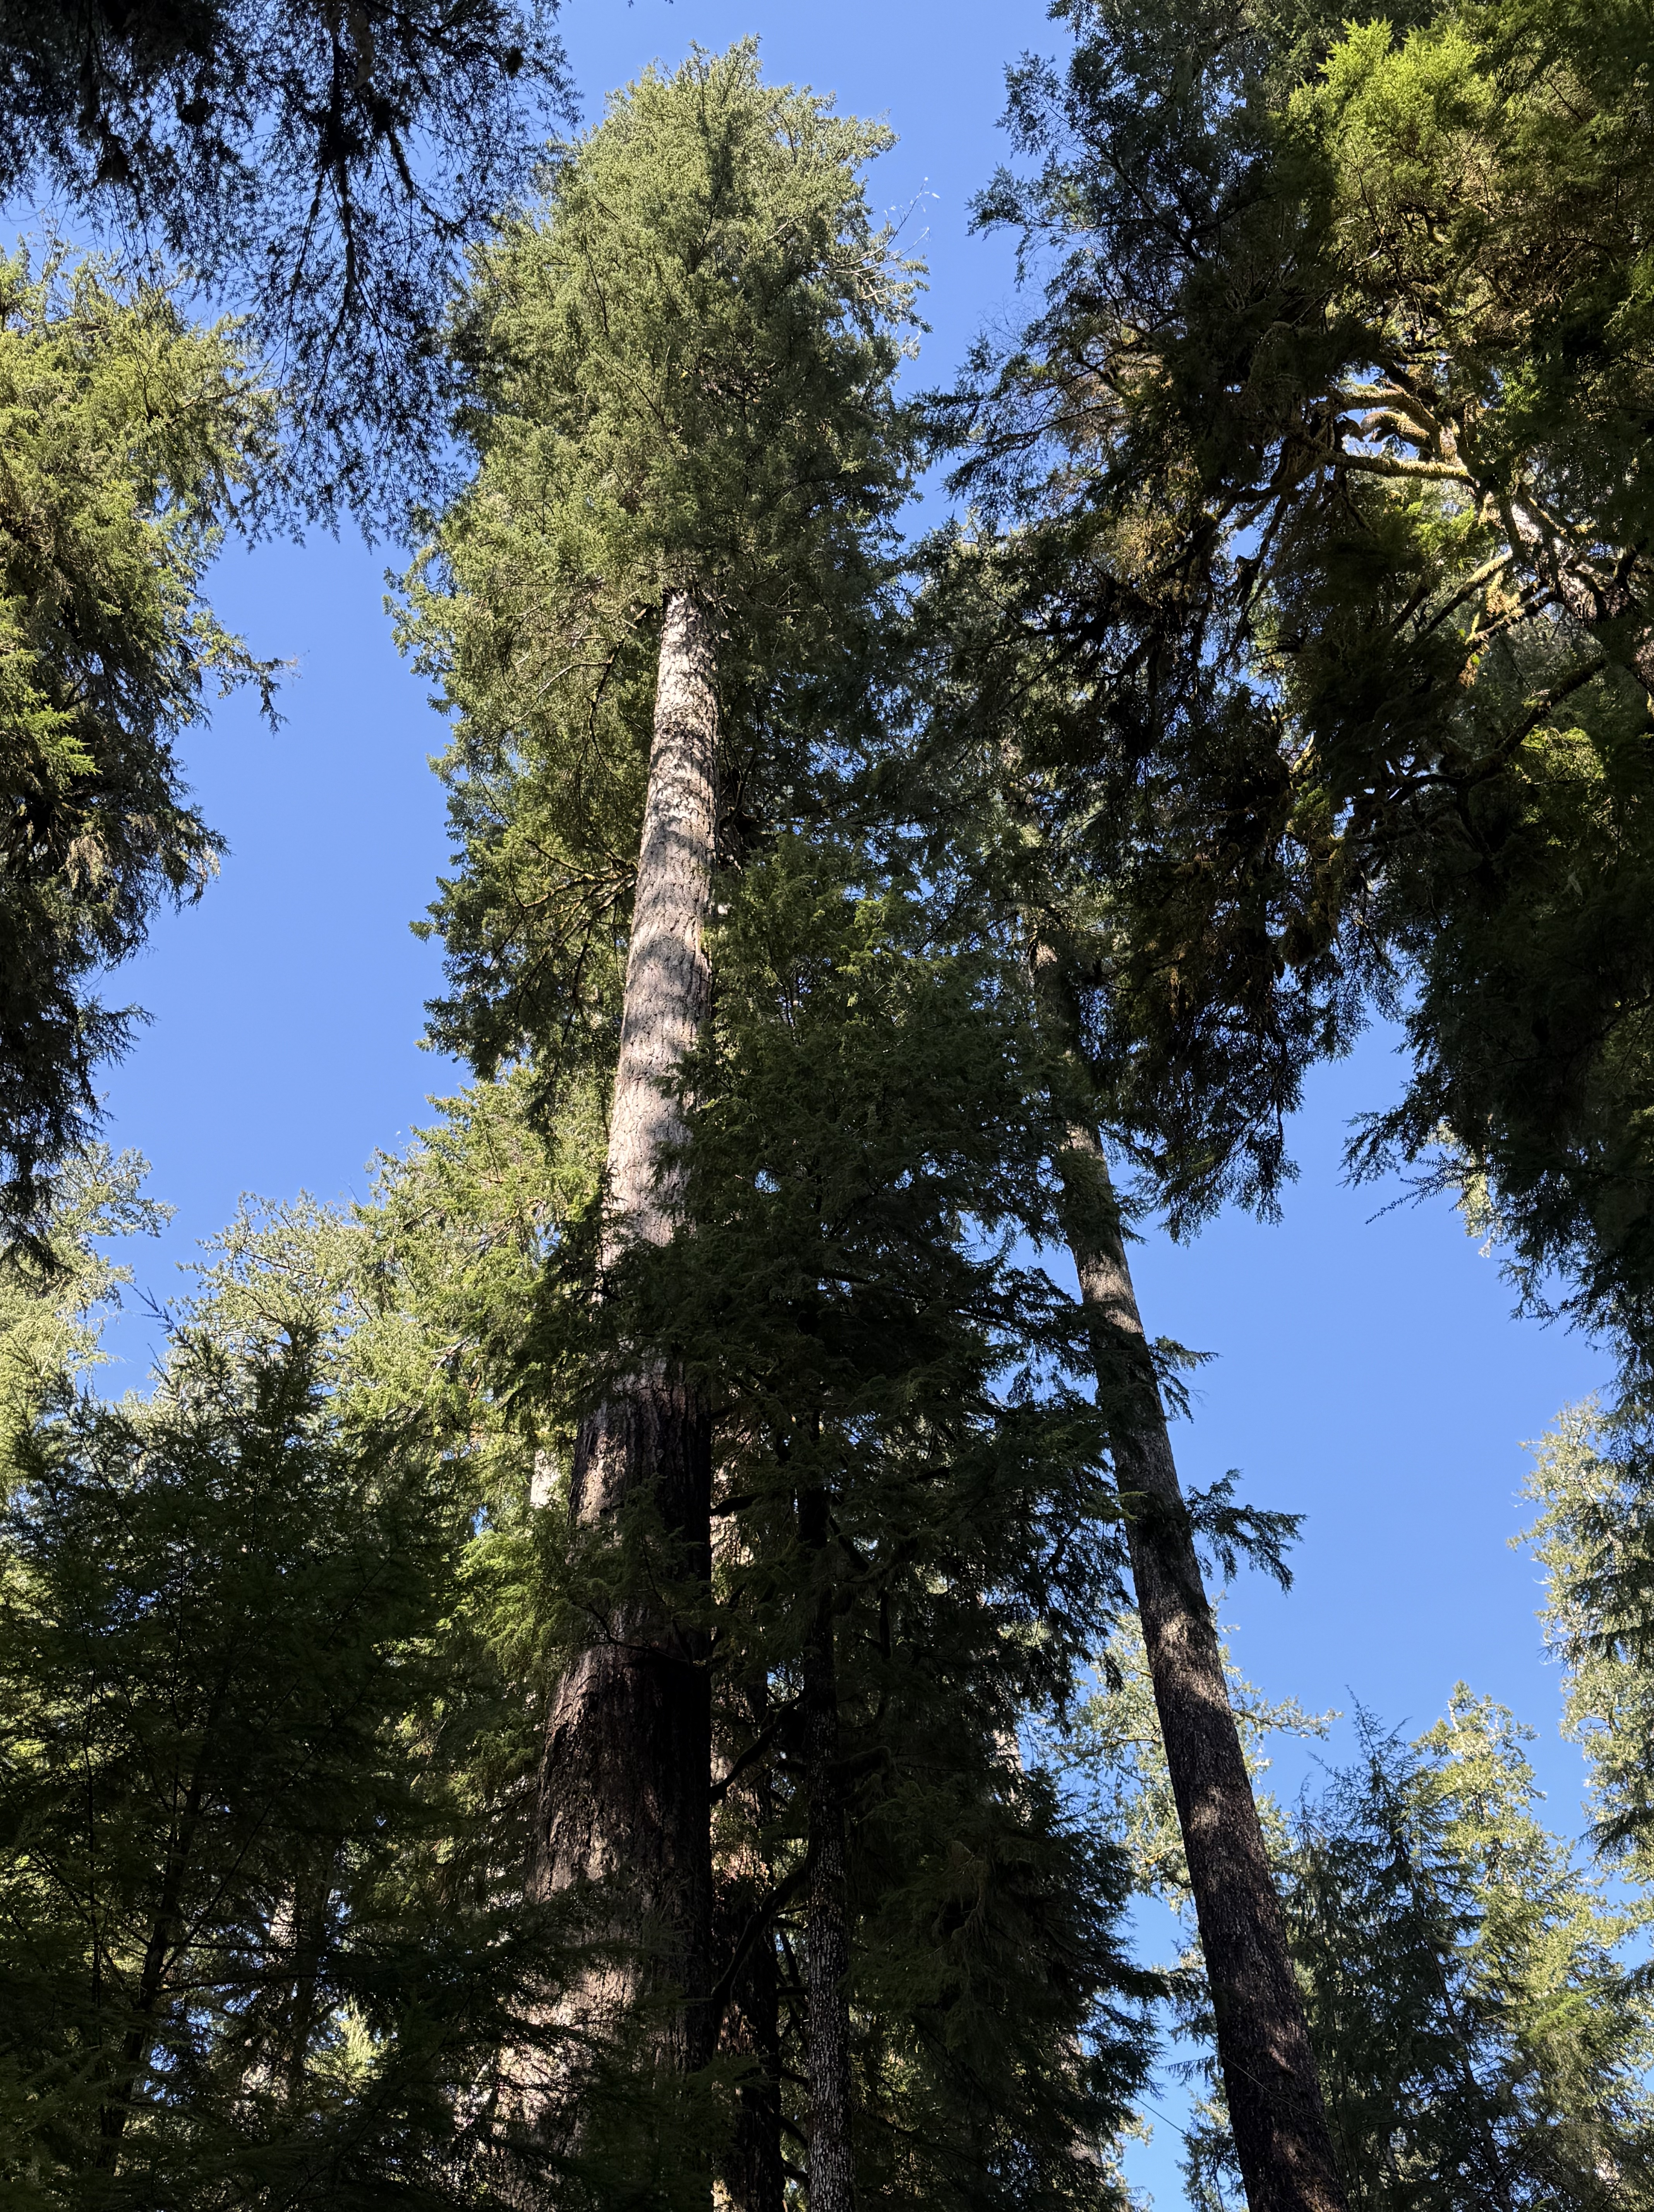
Location A: Quinault Rainforest. There are at least half-a-dozen species of giant evergreen trees in the rainforest, and I can’t identify any of them; but CoPilot suggests it might be a Coast Redwood, part of a local population found in this area. This example is typical in an area known for its “Champion Trees”. We’ll get to that in the next photo.
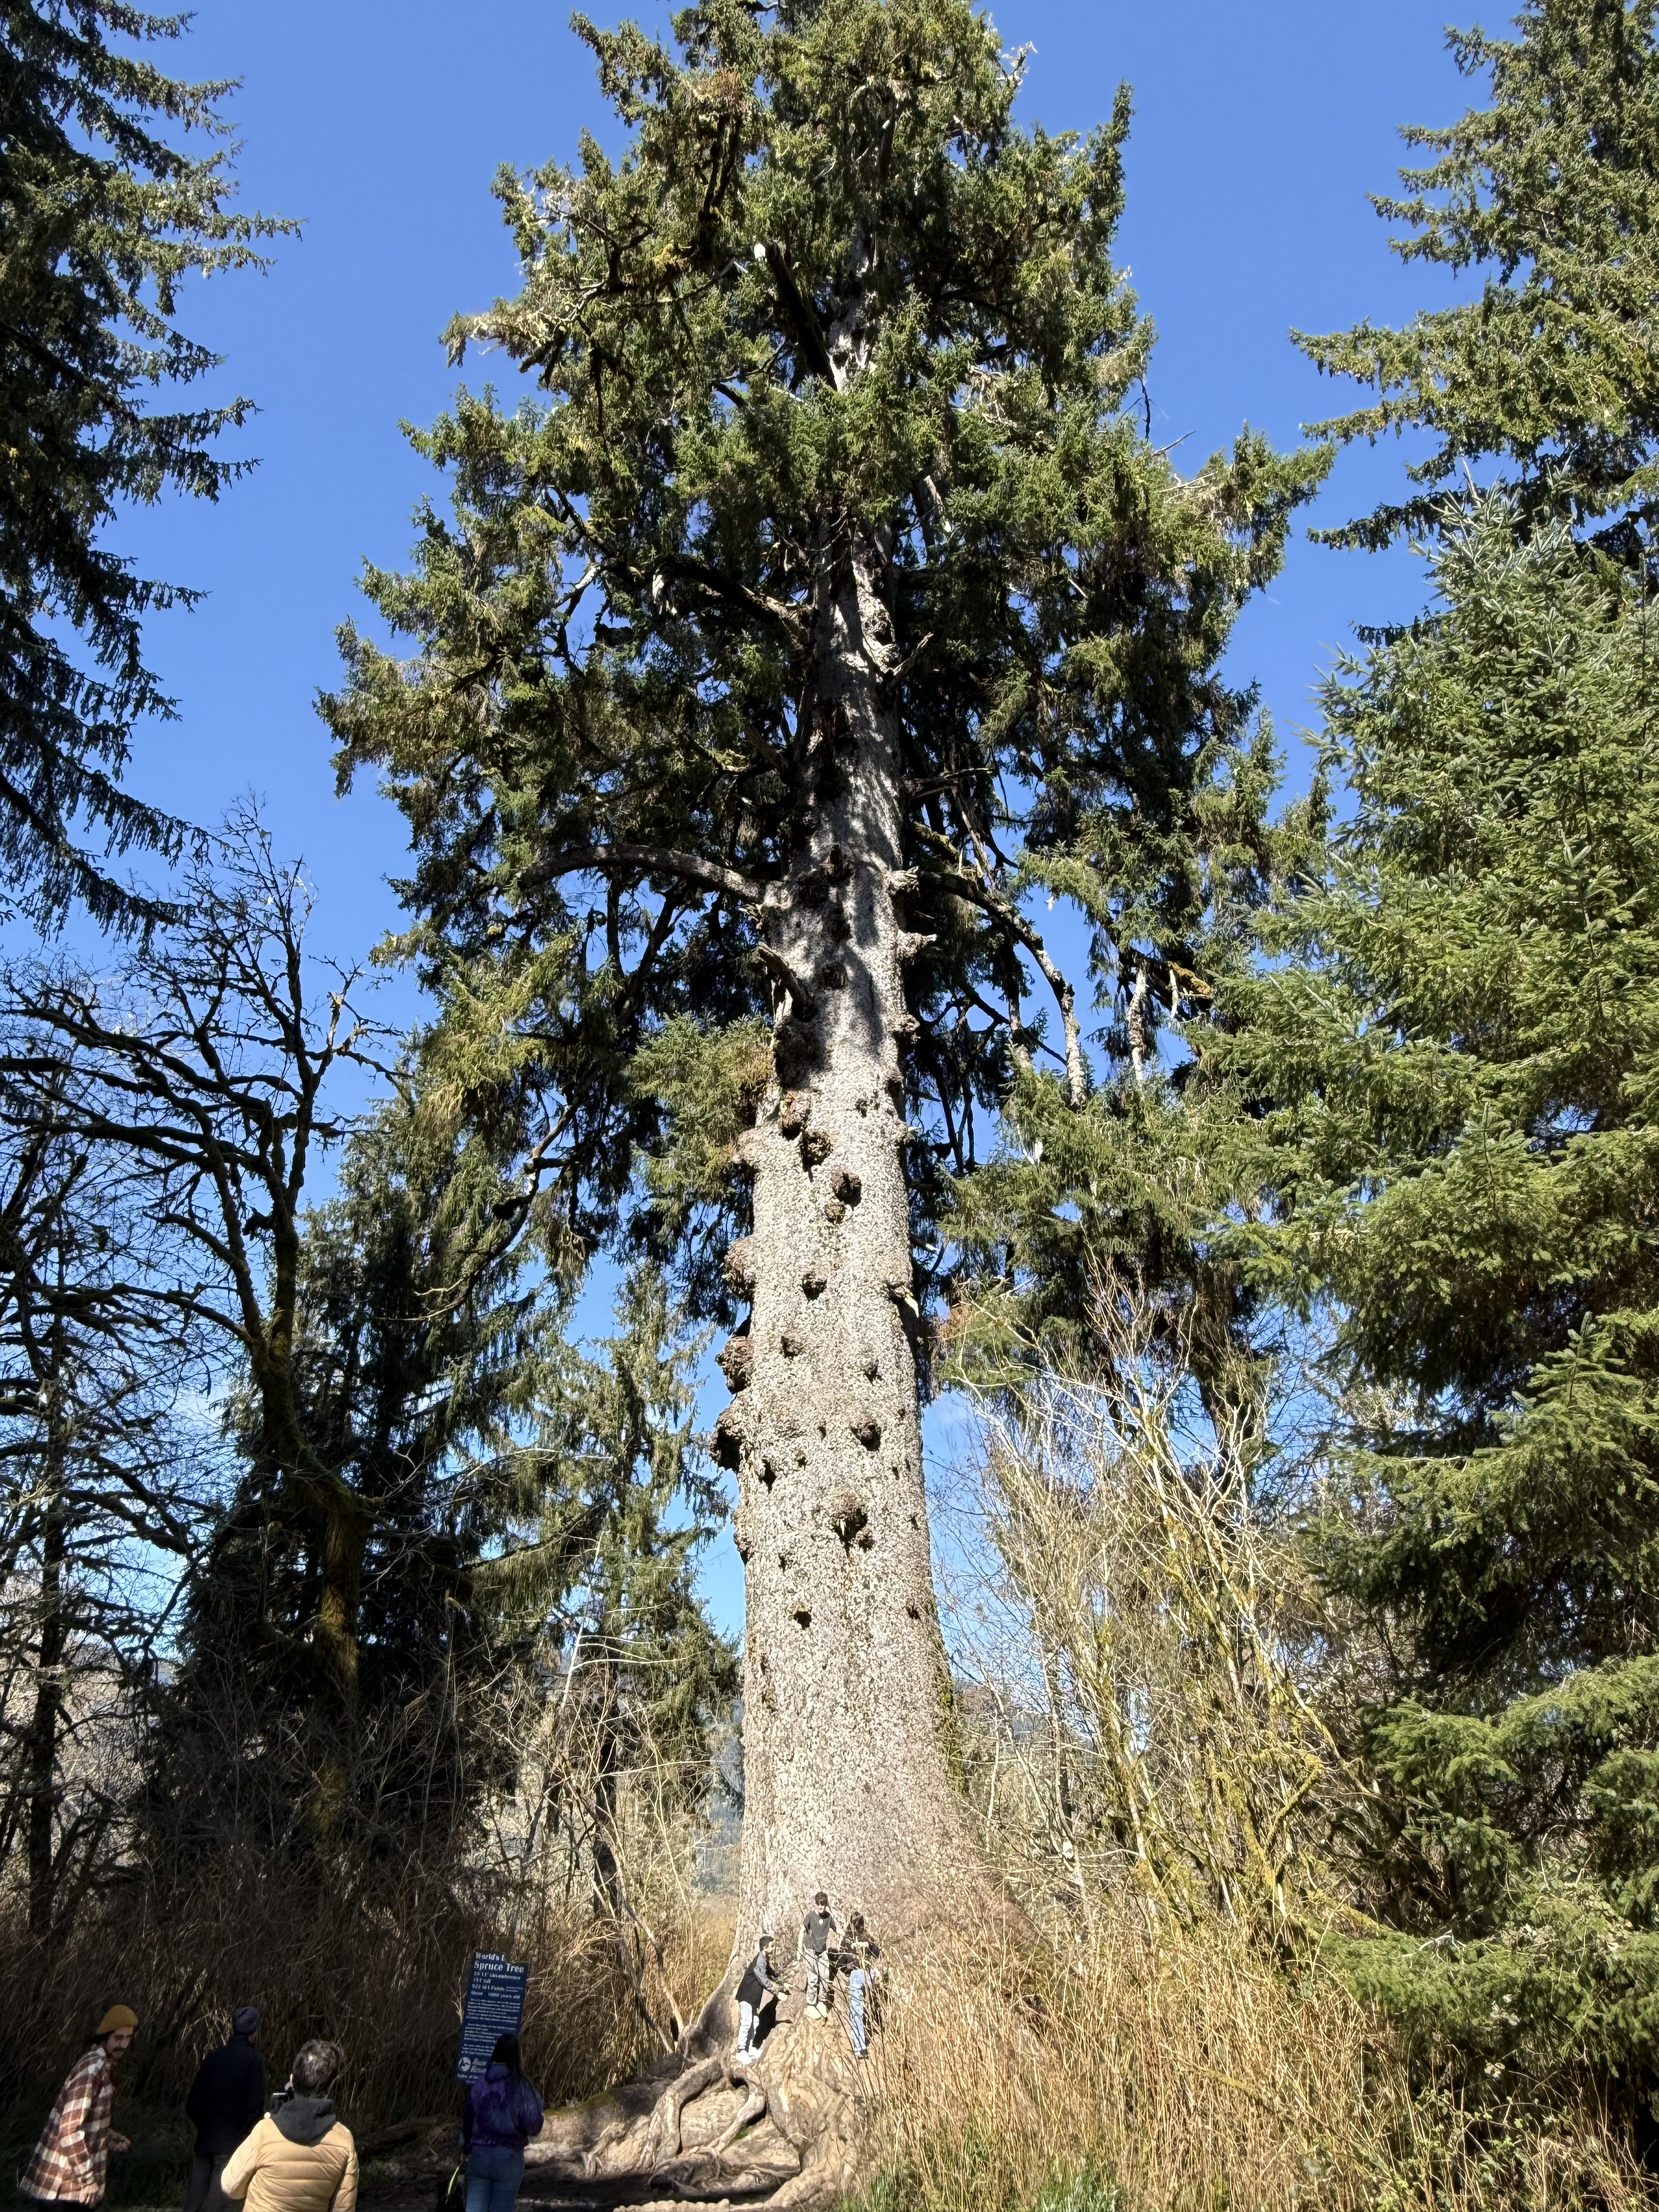
Location A. Quinault Rainforest. This is the world’s largest Spruce tree. It is 191 feet tall and about 1000 years old. It is one of the six champion trees located in Quinault Valley. The other champion trees are: the world’s largest Western Red Cedar, Douglas Fir, and Mountain Hemlock; and the largest Yellow Cedar and Western Hemlock in the U.S. This tree is growing in a wetland area at the NE end of Lake Quinault.
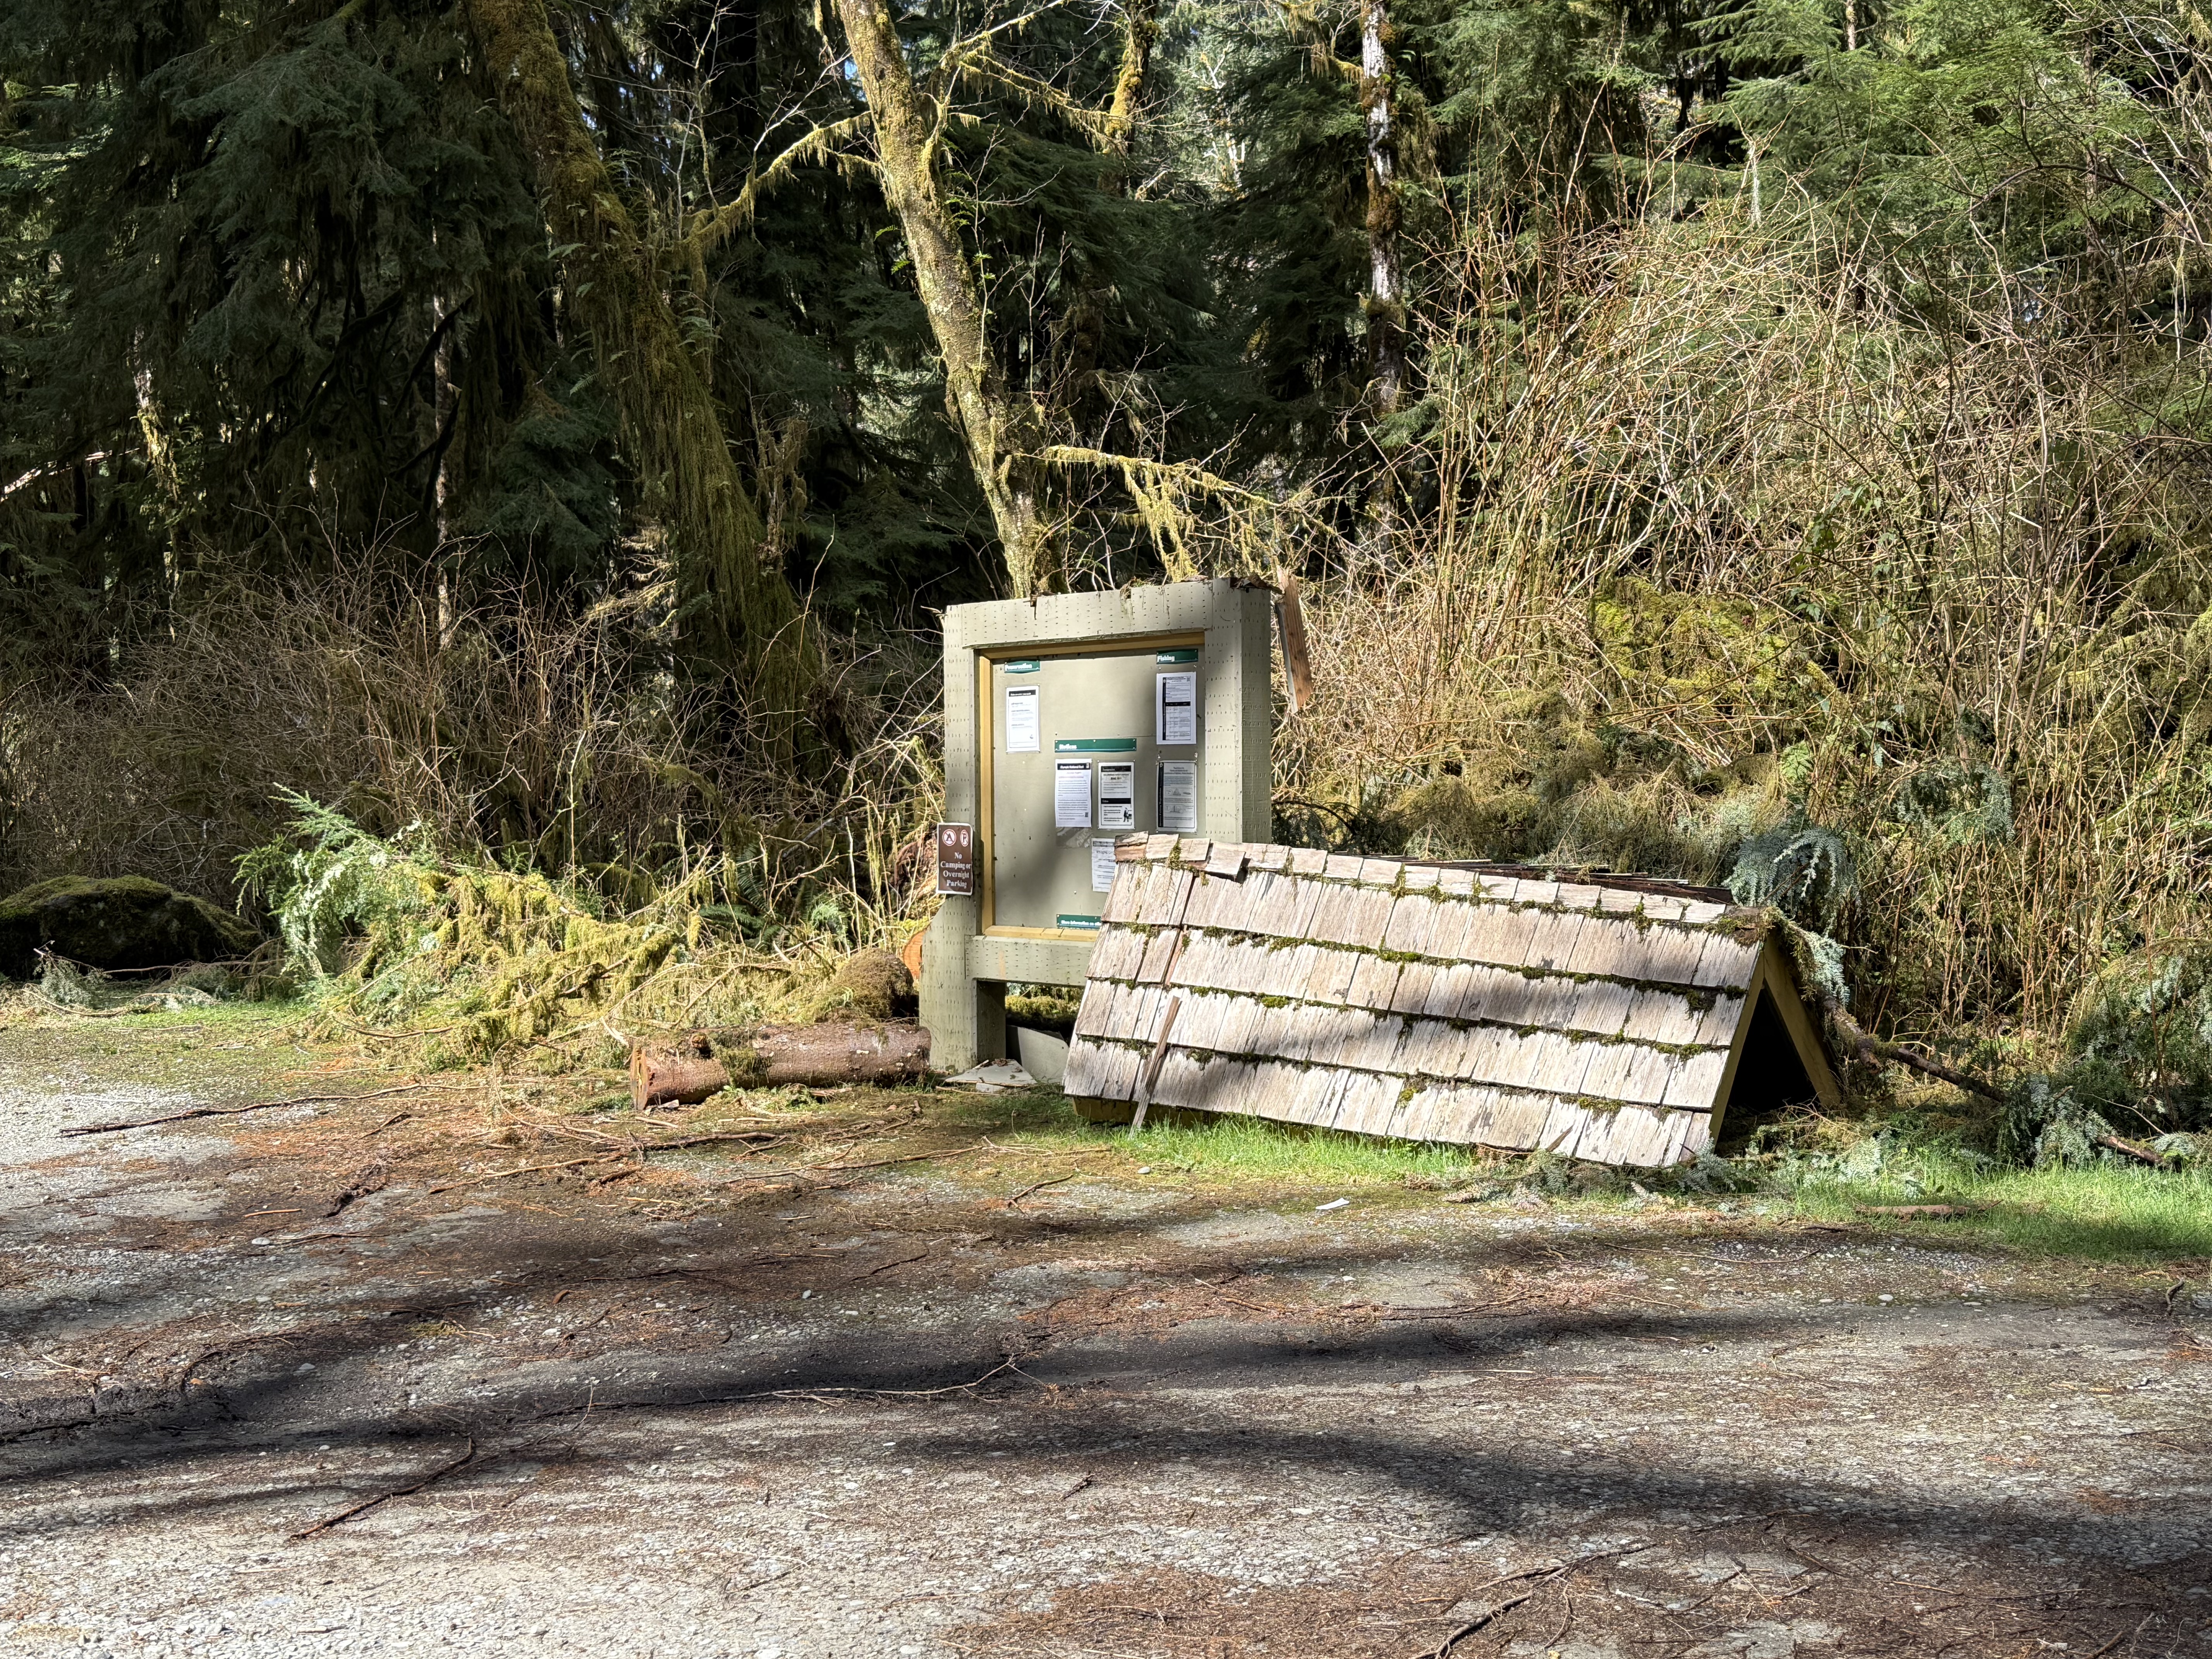
Halfway between Sites A and B. During my day-trips around the area, I’ve noticed a what appears to be a regional interest in post-industrial art, including but not limited to large concrete facilities that have been left to decay in place, as well as small sculptures and other curiosities scattered throughout the cities and forests. I don’t know if this is intentional or not: the roof of the information board collapsed (no doubt because of 12 feet of rain per year) and was set aside, possibly as a monument to nature?–or evidence of the poor funding and mismanagement of the National Park Service.
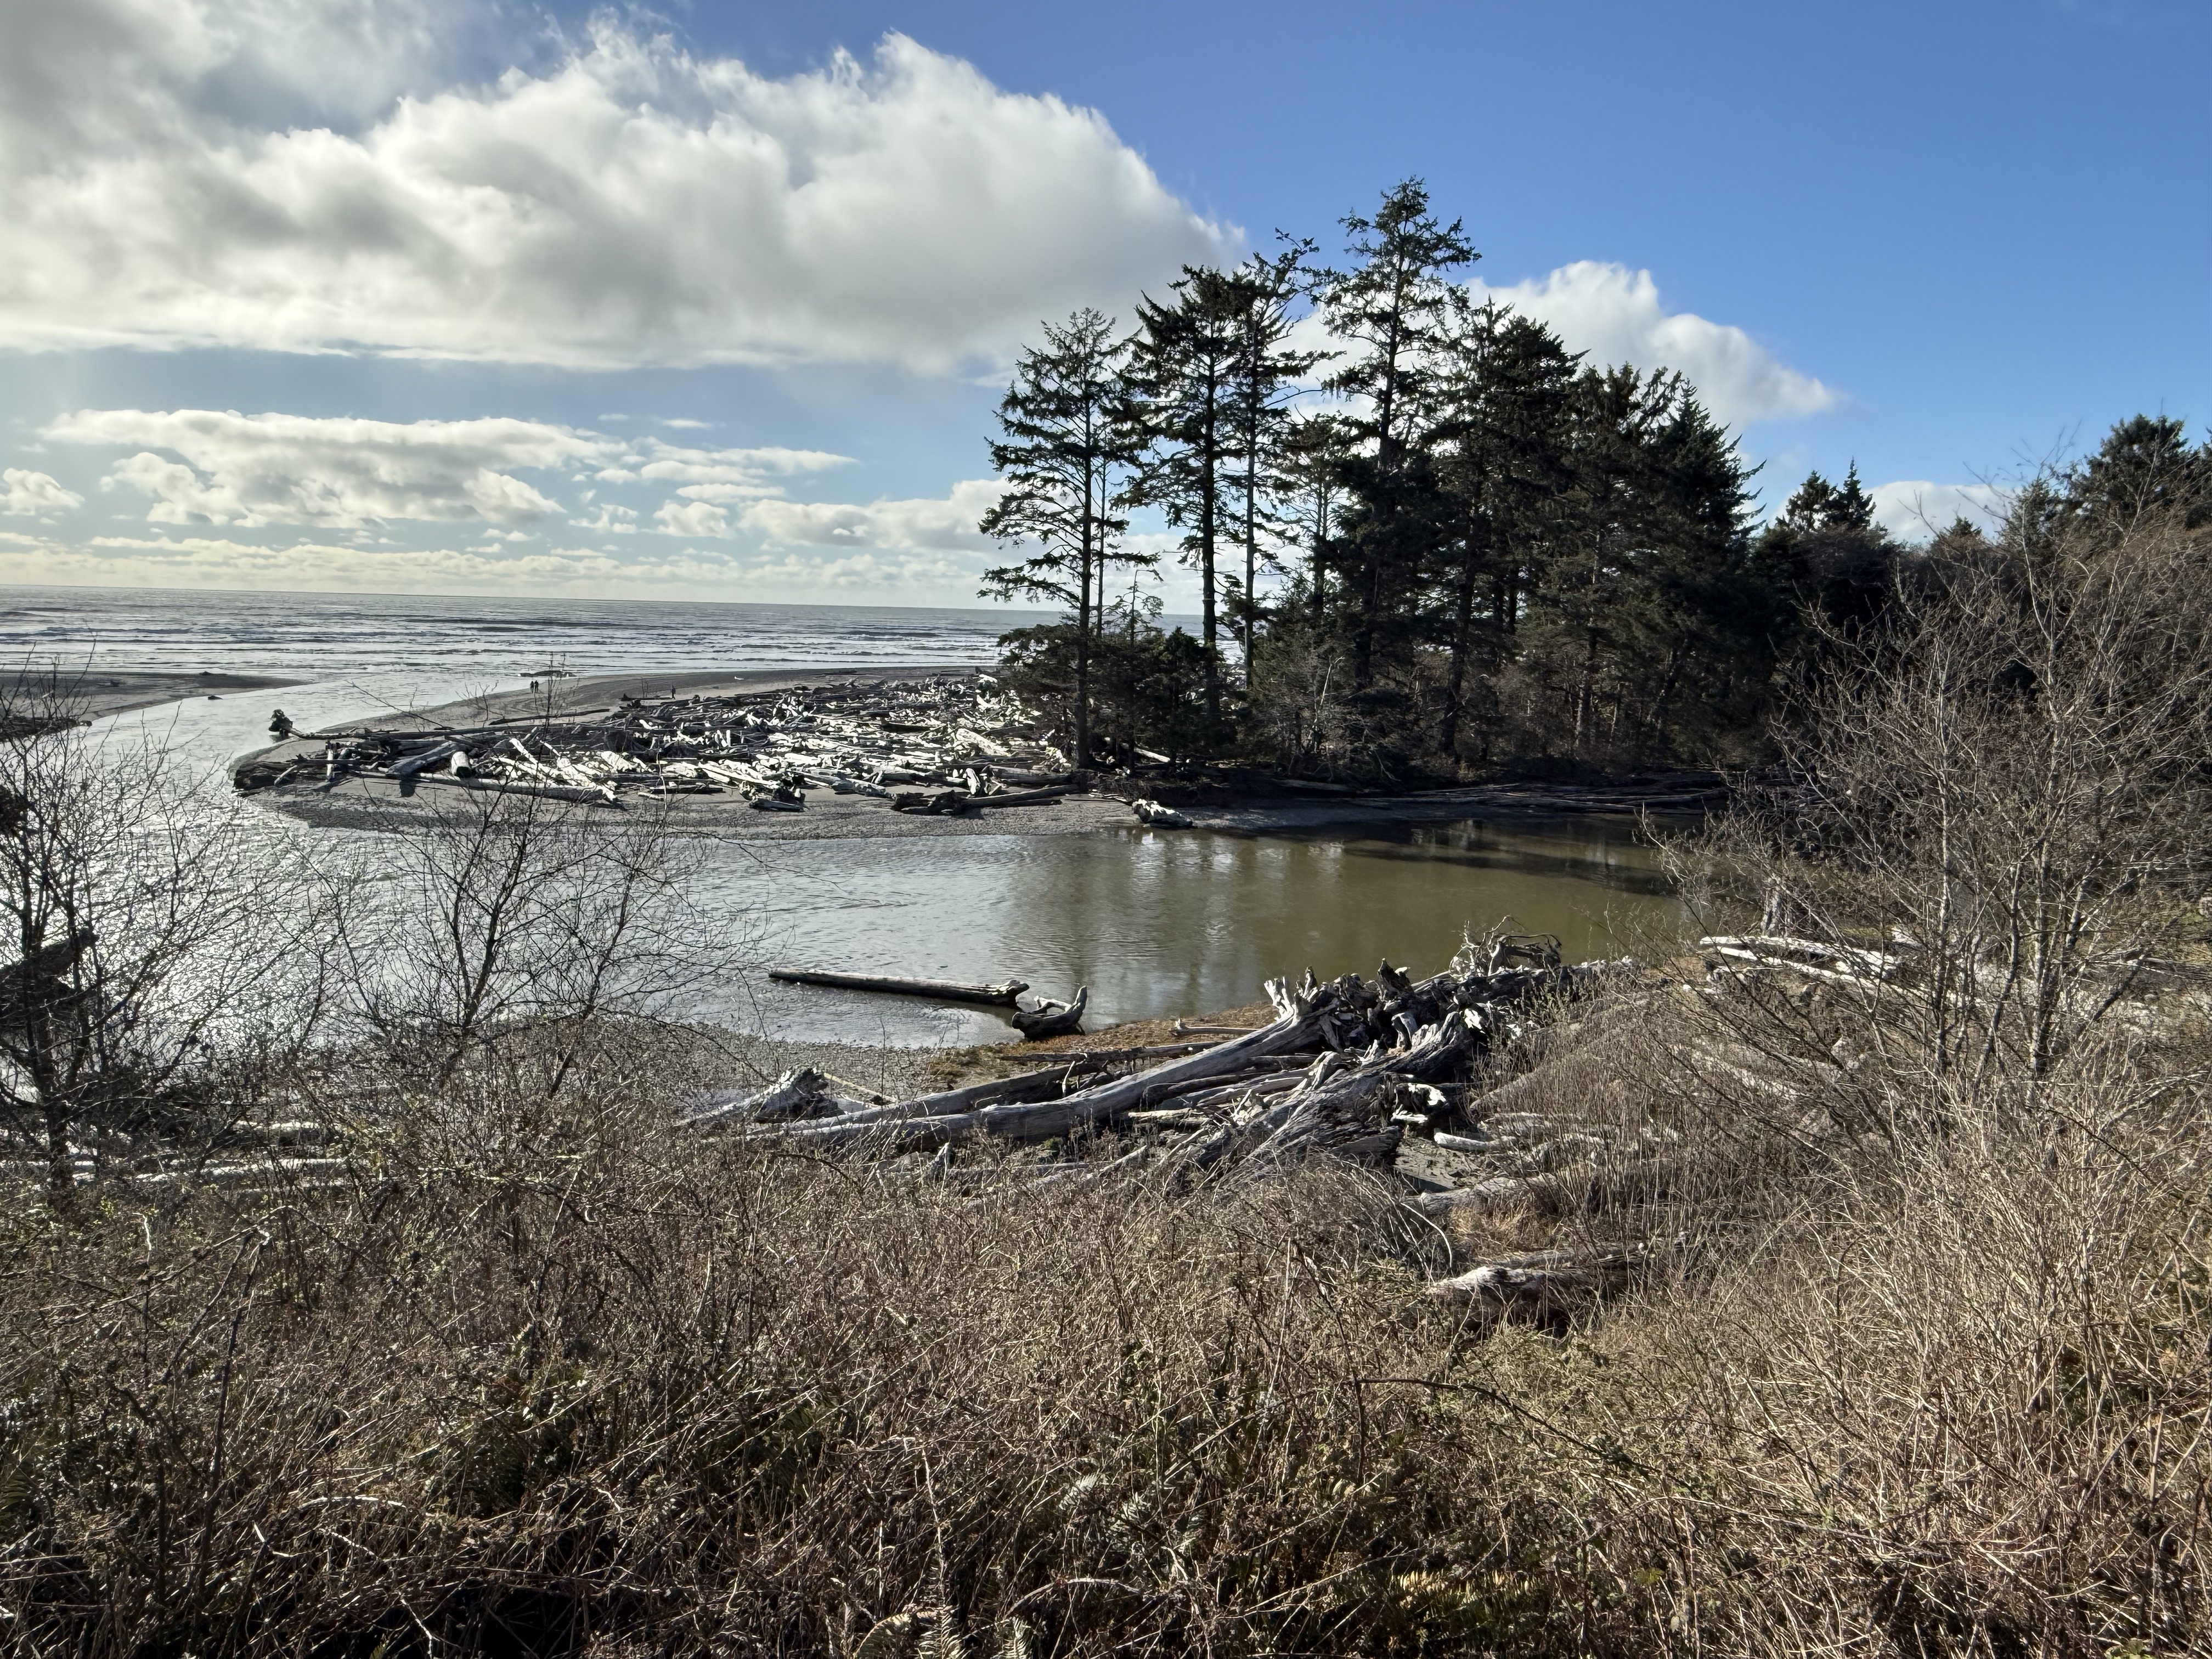
Location B: Kalaloch Lodge. This is the view from the deck of the lodge where I spent the night. Kalaloch Creek meanders as it approaches the coast and enters the Pacific Ocean here. An impenetrable pile of driftwood (actually logs and entire trees) has collected on a sand spit deposited on bedrock.
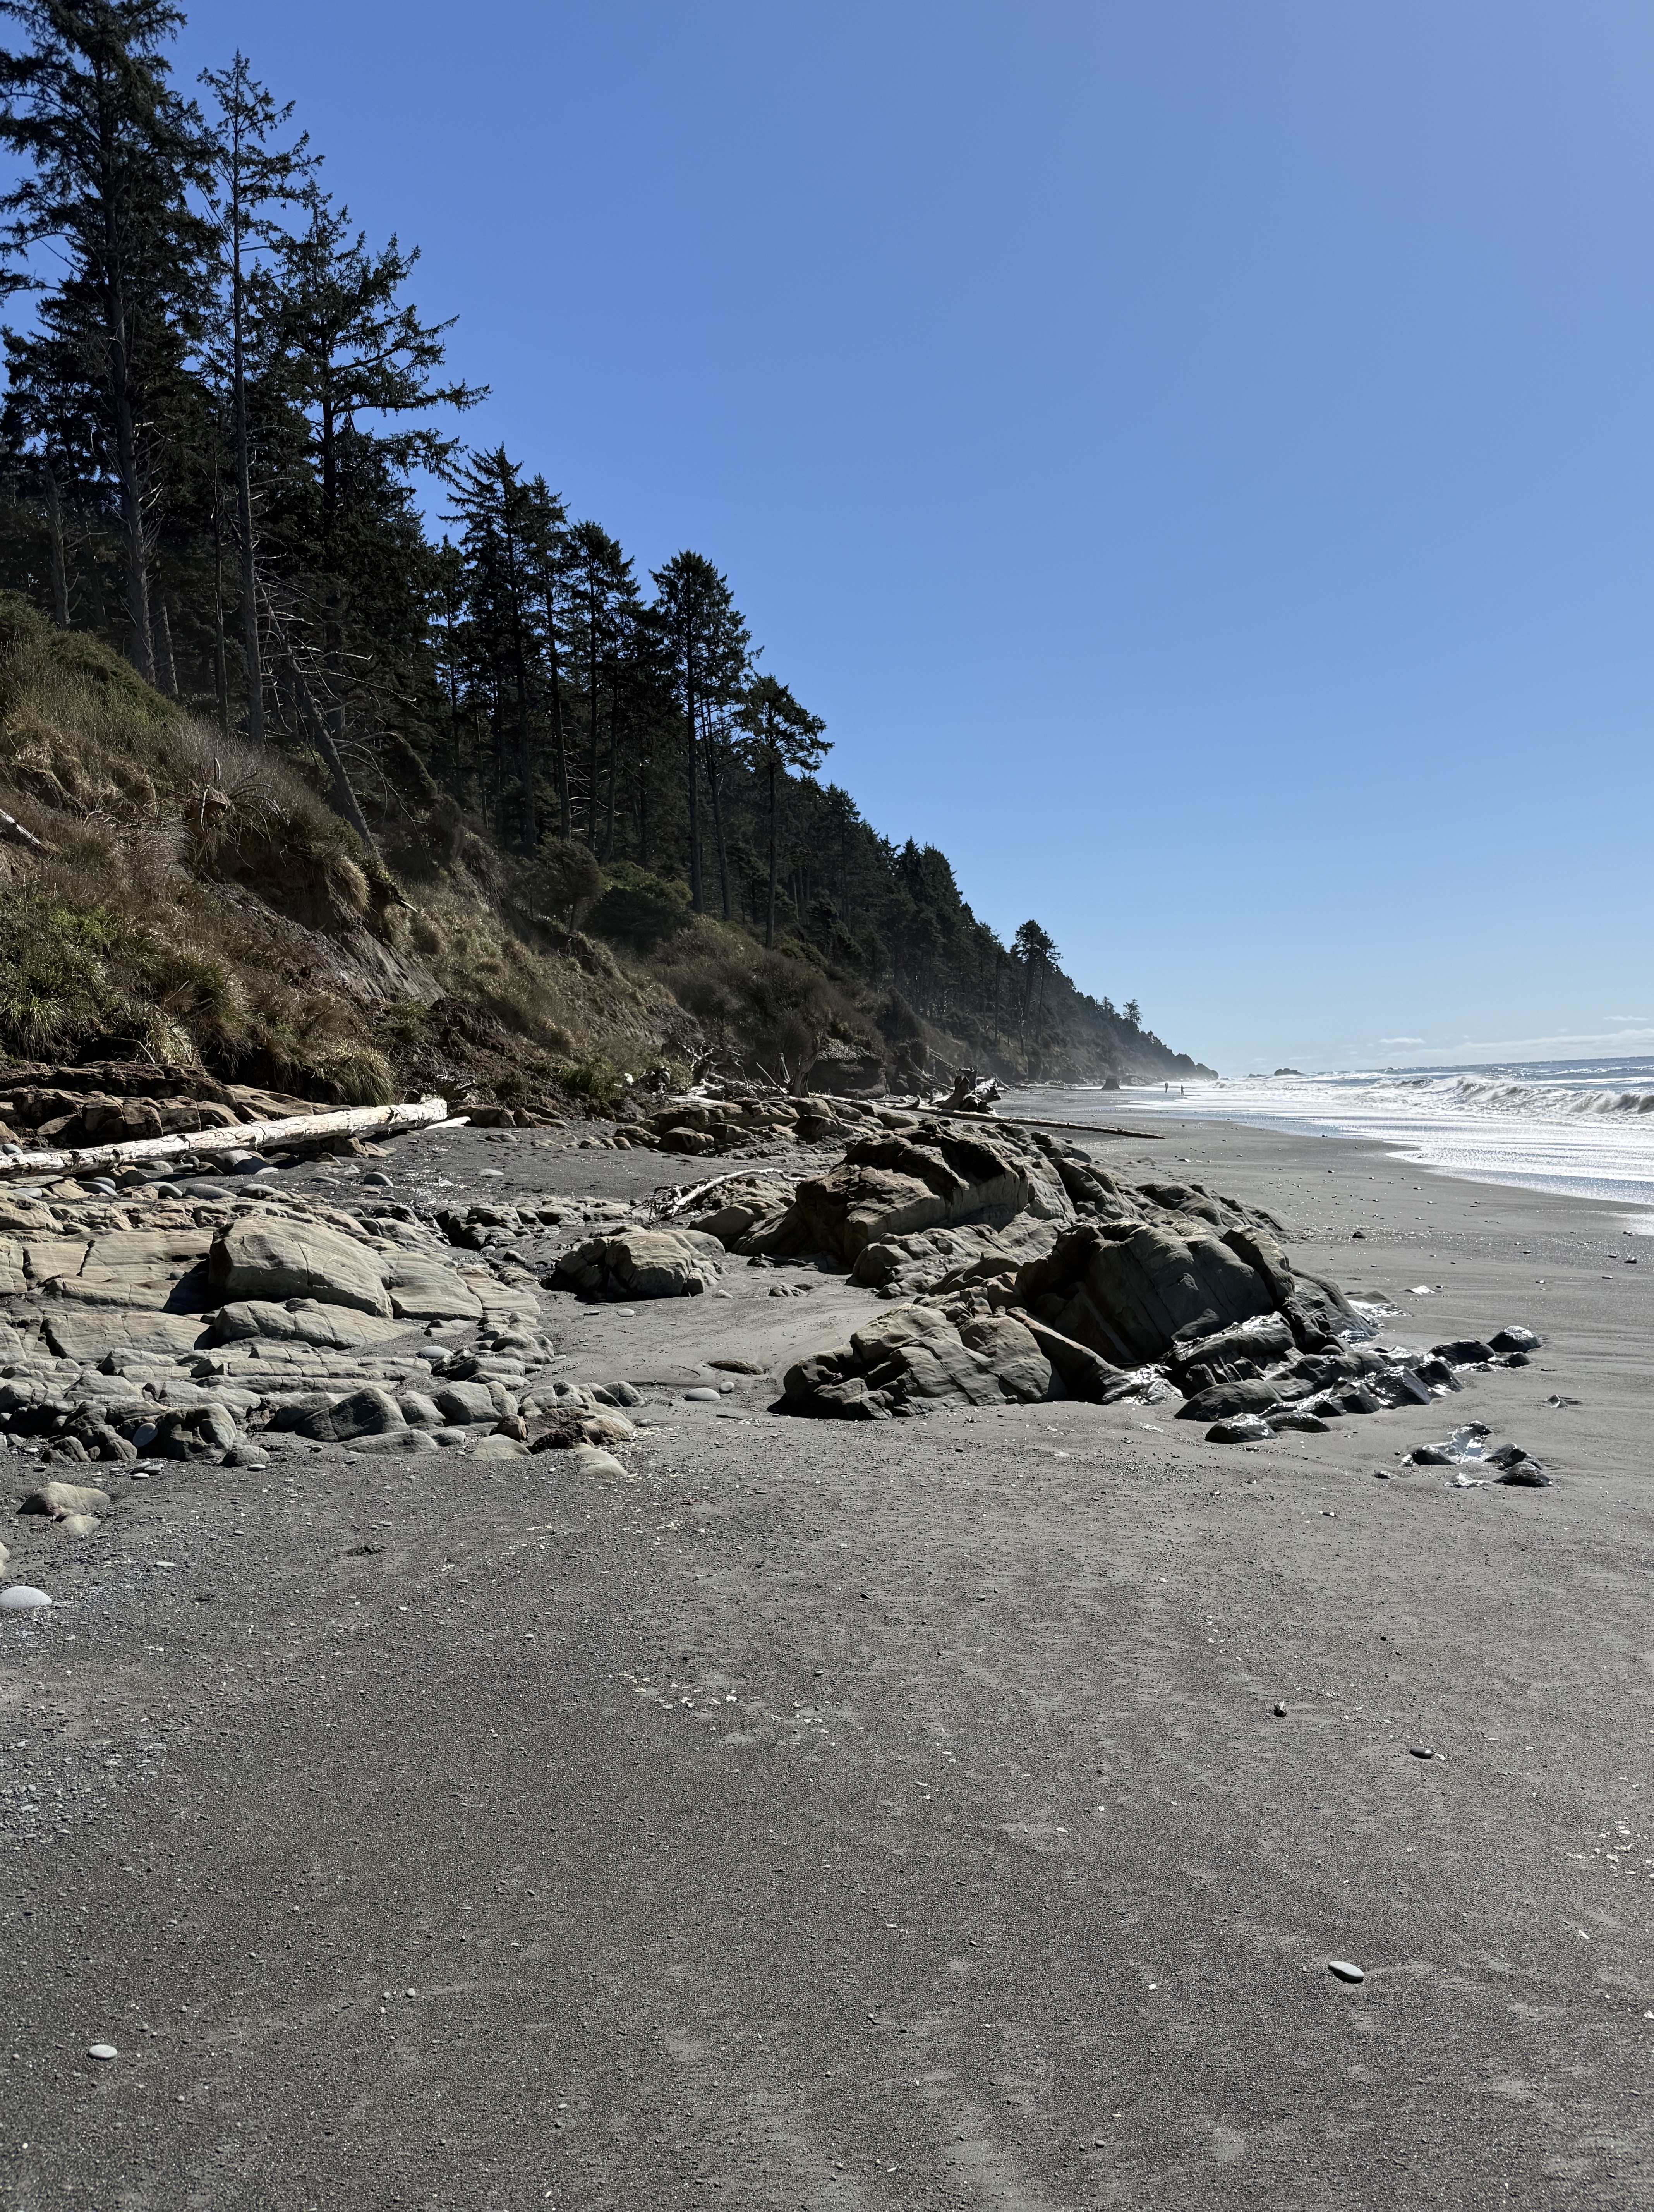
Location B: Beach 4 at Kalaloch. Steep bluffs of glacial till front a wide beach with many exposures of rock, which I’ll discuss in my next post.
Location C: Ruby Beach. This was the last beach before US 101 turned inland for ten miles. I took a video because a series of photos can’t possibly convey the beauty of this location as the sun was rising. Note all the rocks protruding from the water at low tide. The rocks are rising from the earth as we make our way north.

Location C. This selfie demonstrates how chilly it was, with the temperature below 40F. Rock formations like this are called stacks; they are erosional outliers as the coast recedes over millions of years, pounded day and night by rocks carried by waves; and tides that exceed nine feet–twice a day! You have to time your visit accordingly or all you’ll see is water.
Location D: Point Flattery. This is the extreme tip of the contiguous United States. The bedrock we saw further south, at Ruby Beach, now forms wave-cut cliffs that tower 40-80 feet above the waves. The top of the bluffs is 330 feet above sea level. The view from the catwalks is breathtaking. Vancouver Island, BC, is visible in the background, with peaks around 6000 feet.

More PNW Humor. All of the toilets we saw along the coast were constructed over septic tanks, with warnings about what to put in them. Someone with a sense of humor modified just one word of the official message…
If you get the chance, I strongly recommend visiting Olympic National Park, but you’re going to want to spend a week unless you live nearby in the PNW.

Recent Comments