Cape Flattery: Conglomerates at the End of the World
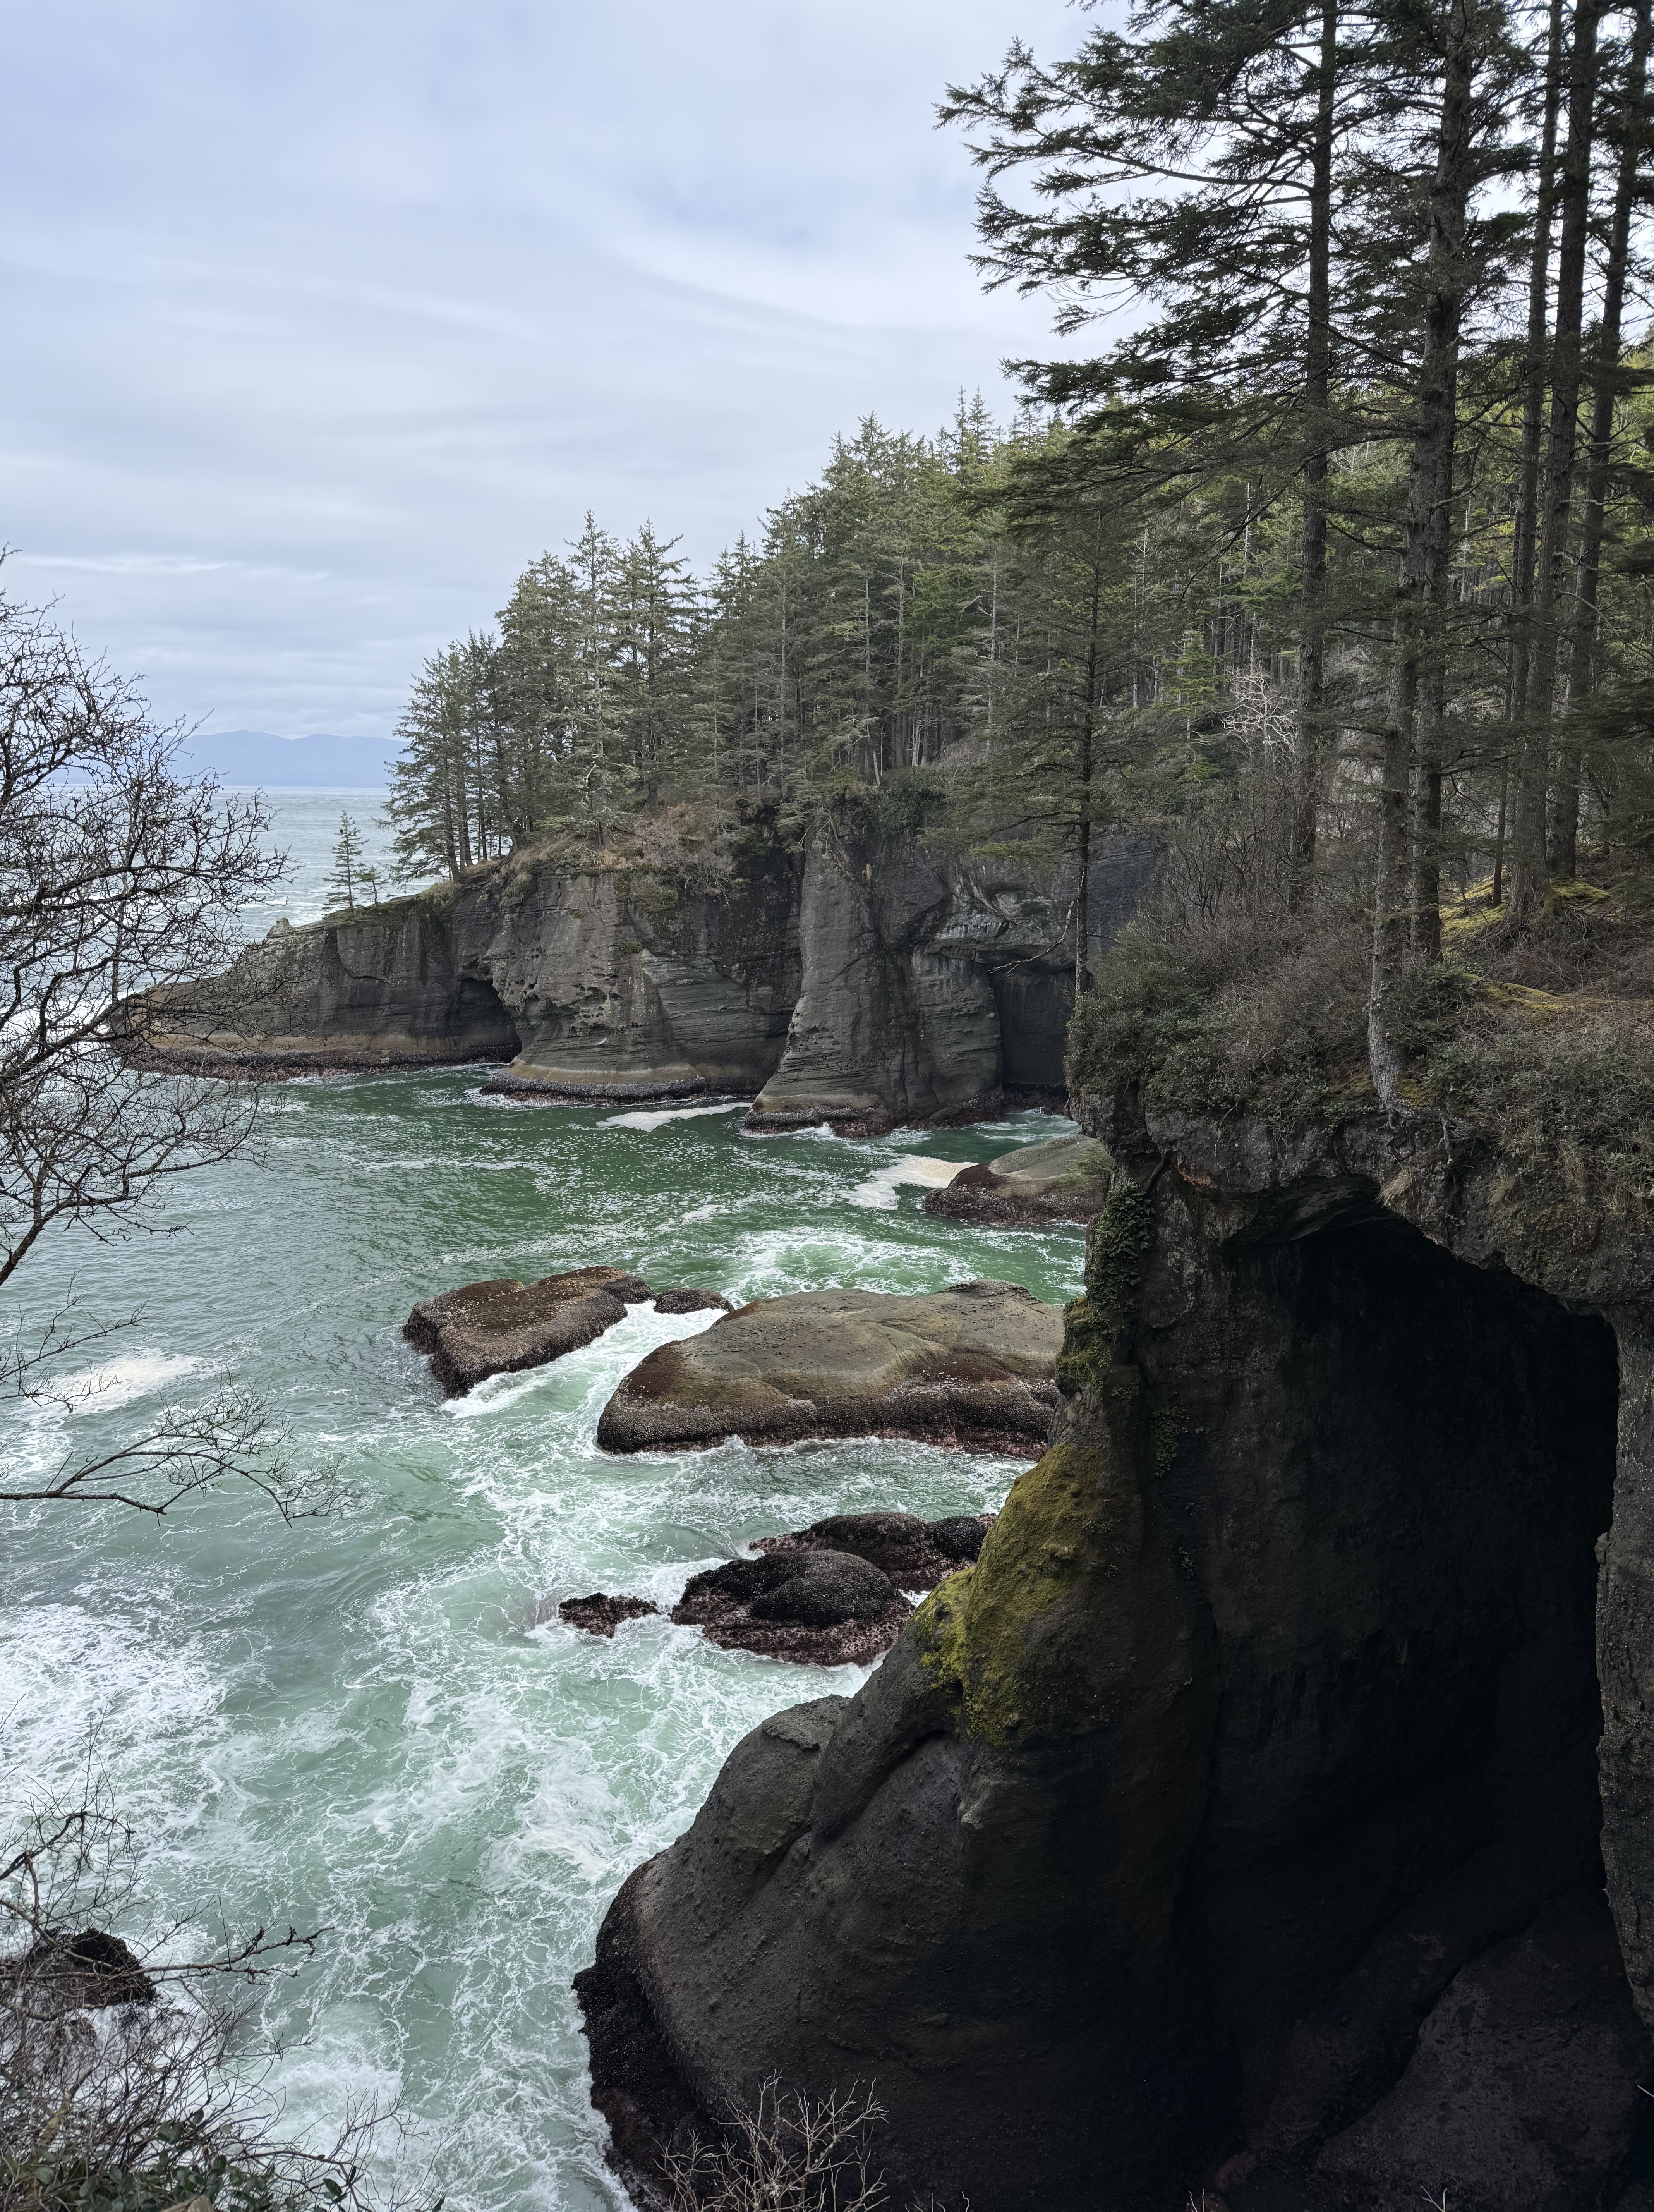
Figure 1. I ran out of road and land, ending up at Cape Flattery on the Makah Reservation. This is Location D in Fig. 2. A half-mile hike down a boardwalk took me to the end of the world, where the cliffs are about 80 feet above sea level. This photo is looking northward towards Vancouver Island, Canada, in the distance. Wave action has cut a wave terrace, a seen in the center of the image, and a series of sea caves.
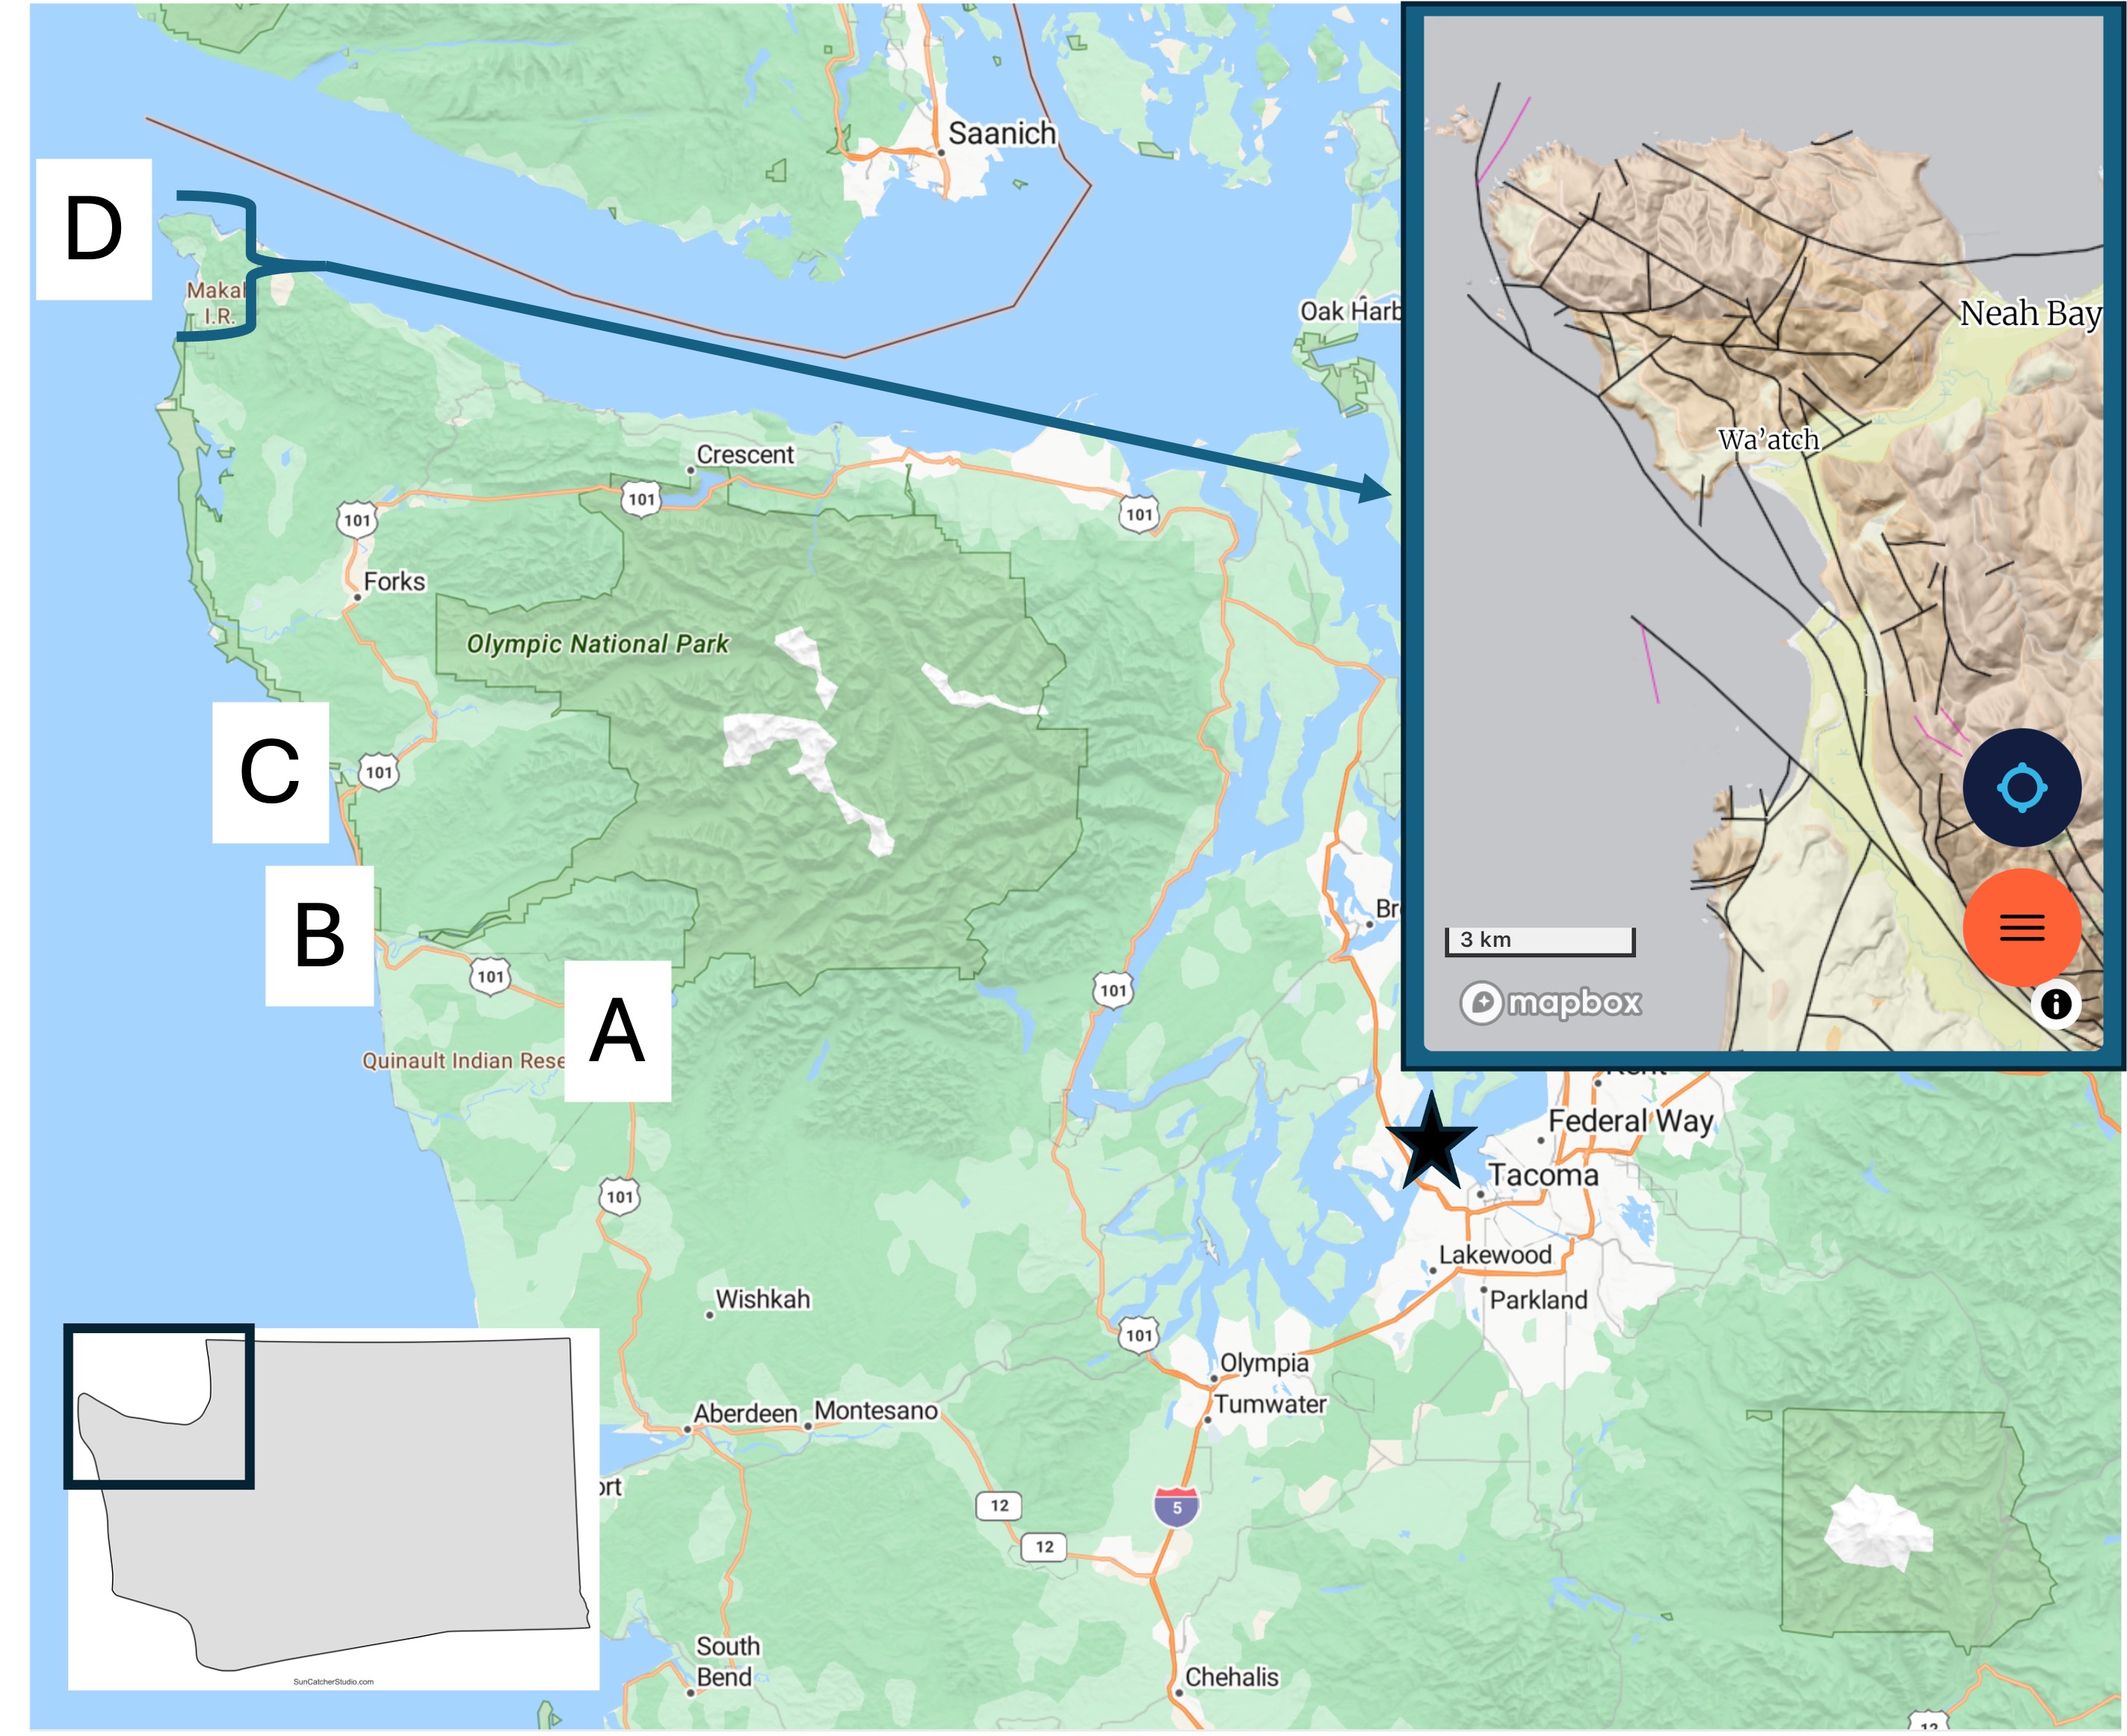
Figure 2. Today’s post takes us to Site D, which is shown in a geologic map from Rock D in the inset map. The rocks are a mixture of sandstone and conglomerate of Eocene age (56-34 Ma). This is the same time that the lower Cascades were being created east of Puget Sound. Note the large number of faults (thin lines) shown in the inset map. Many of these are strike-slip faults with motion of the opposing crustal block to the left, which would explain why the sedimentary layers in seen in Fig. 1 are almost horizontal, dipping slightly towards the sea.
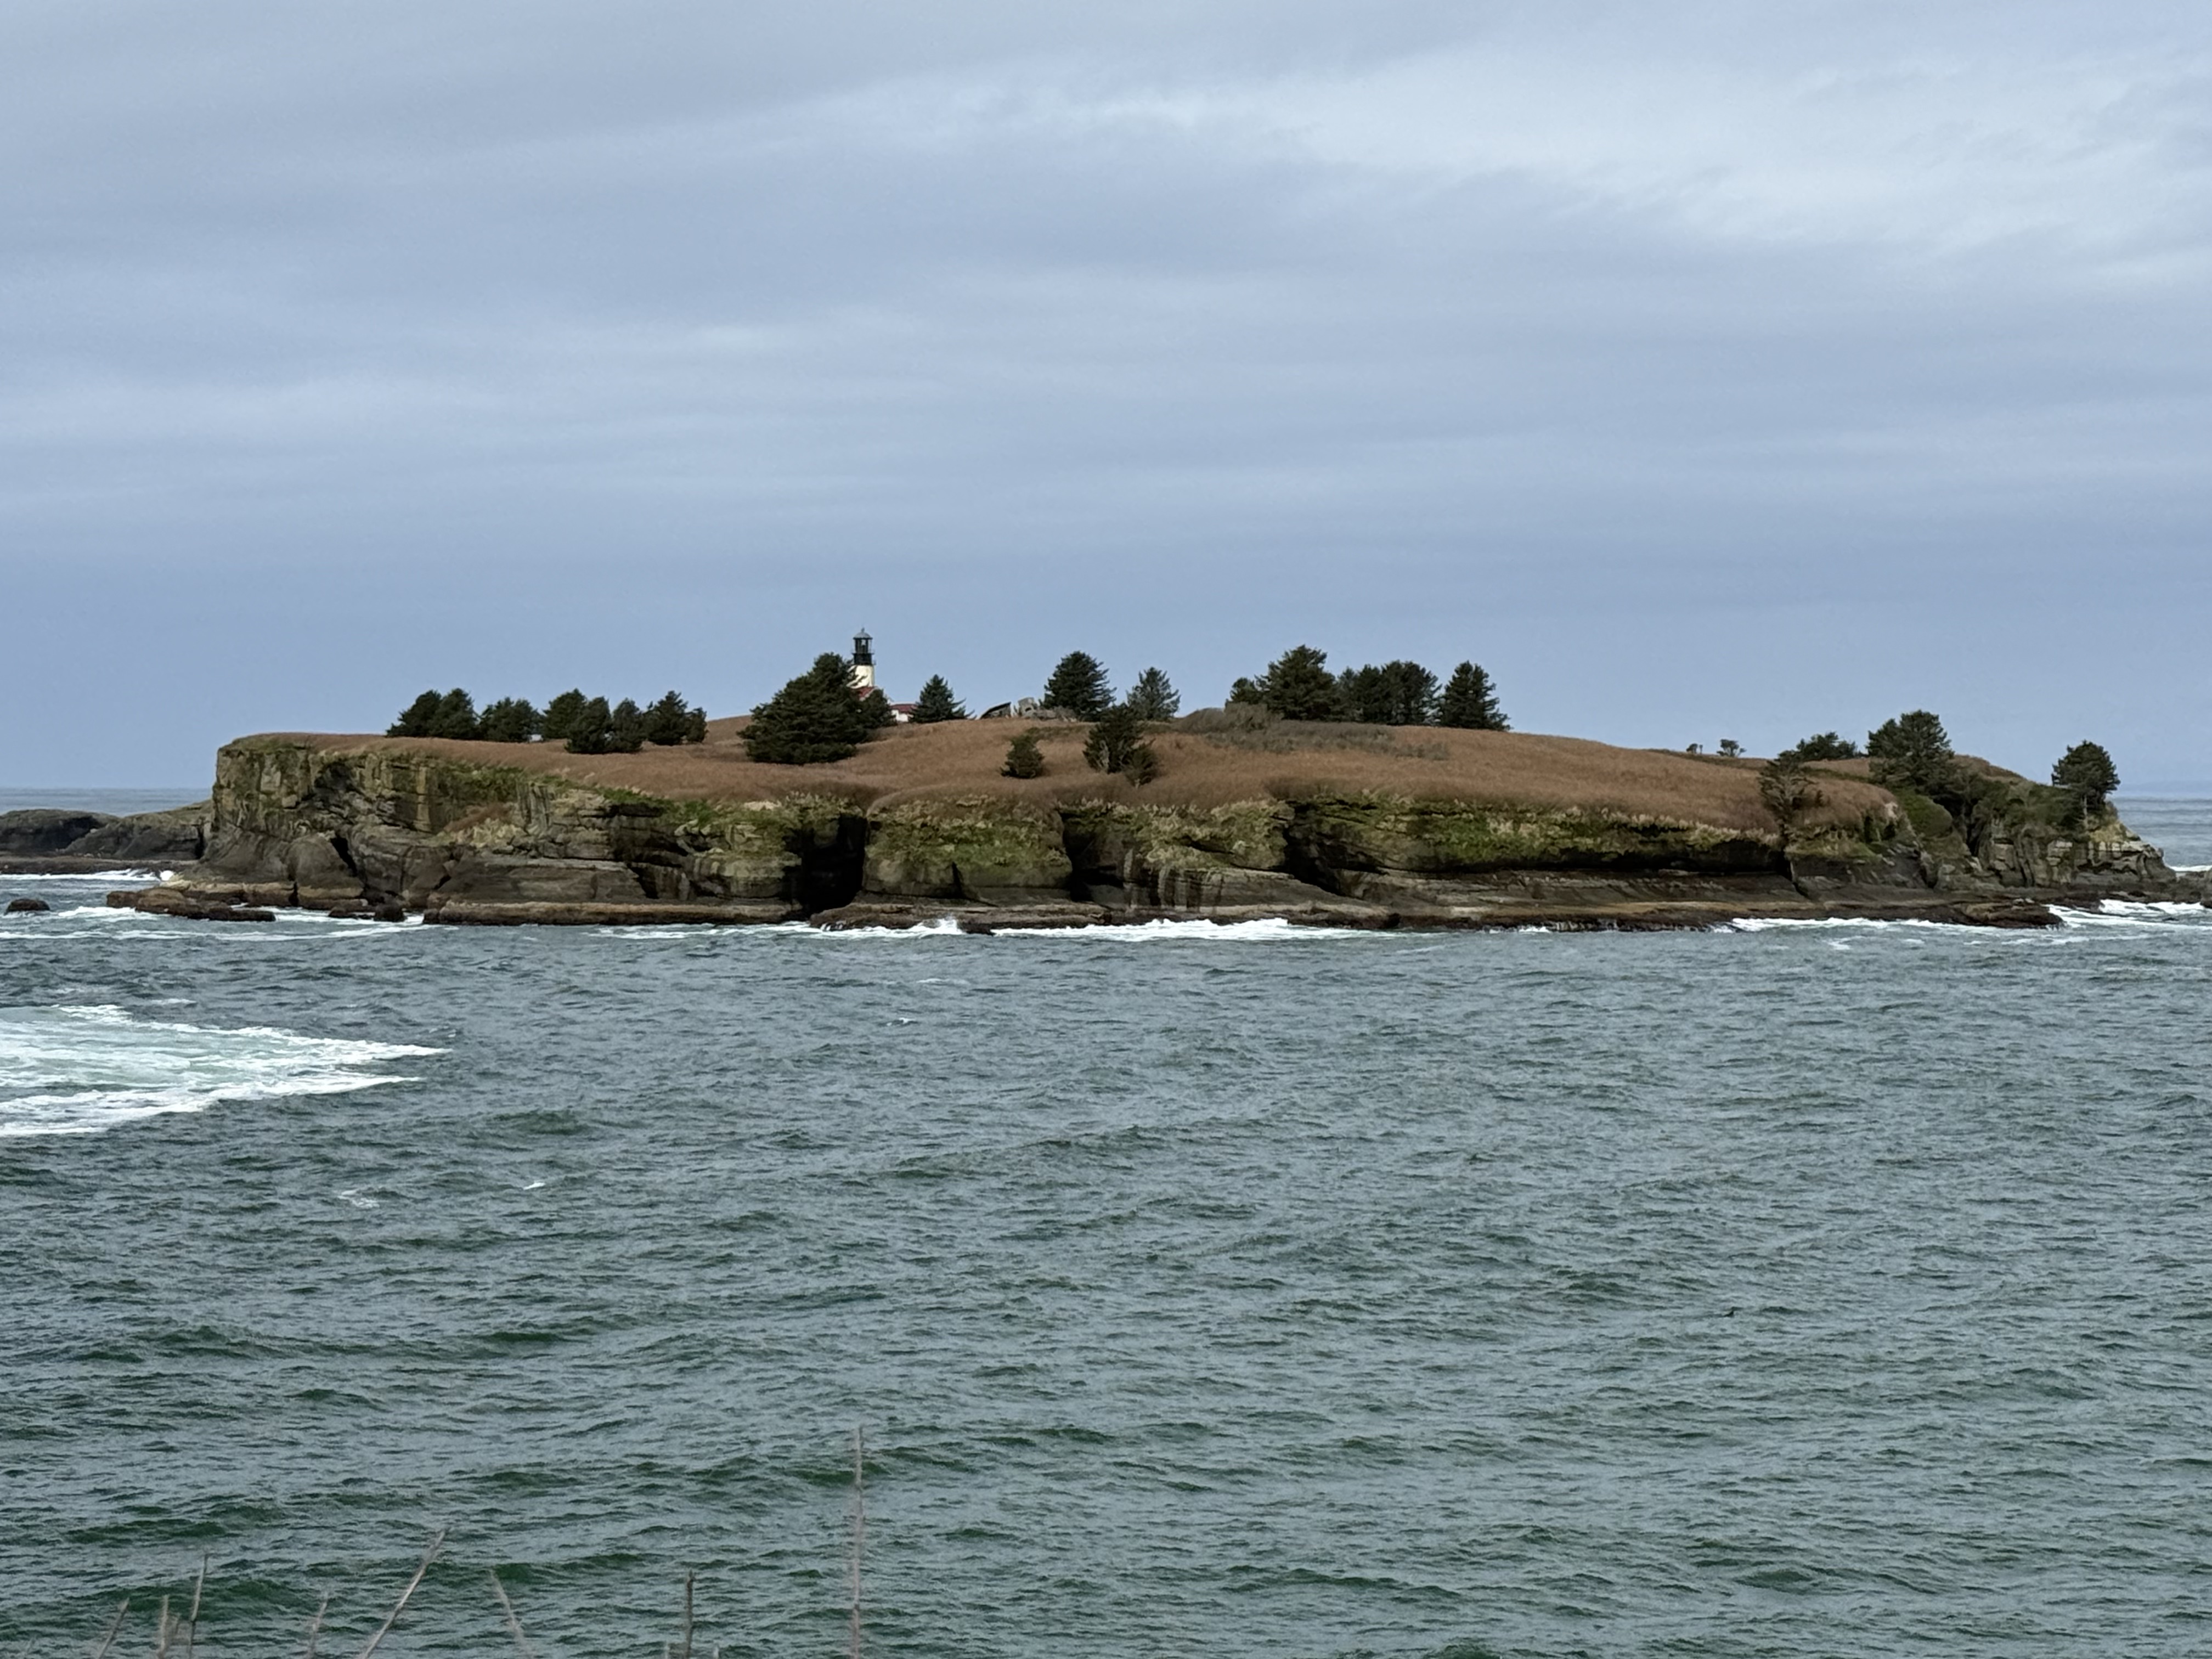
Figure 3. The sea stacks seen further south have been replaced with rocky islands like Tatoosh Island, which has a light house. Pacific Ocean seafloor (Juan de Fuca tectonic plate) is being actively subducted along the Washington-Oregon coast at about 2 inches/year, but the plate tectonic geometry is complex in this area. This could partly explain the large number of faults seen in Fig. 2 as well as the high elevation of bedrock. Maybe.
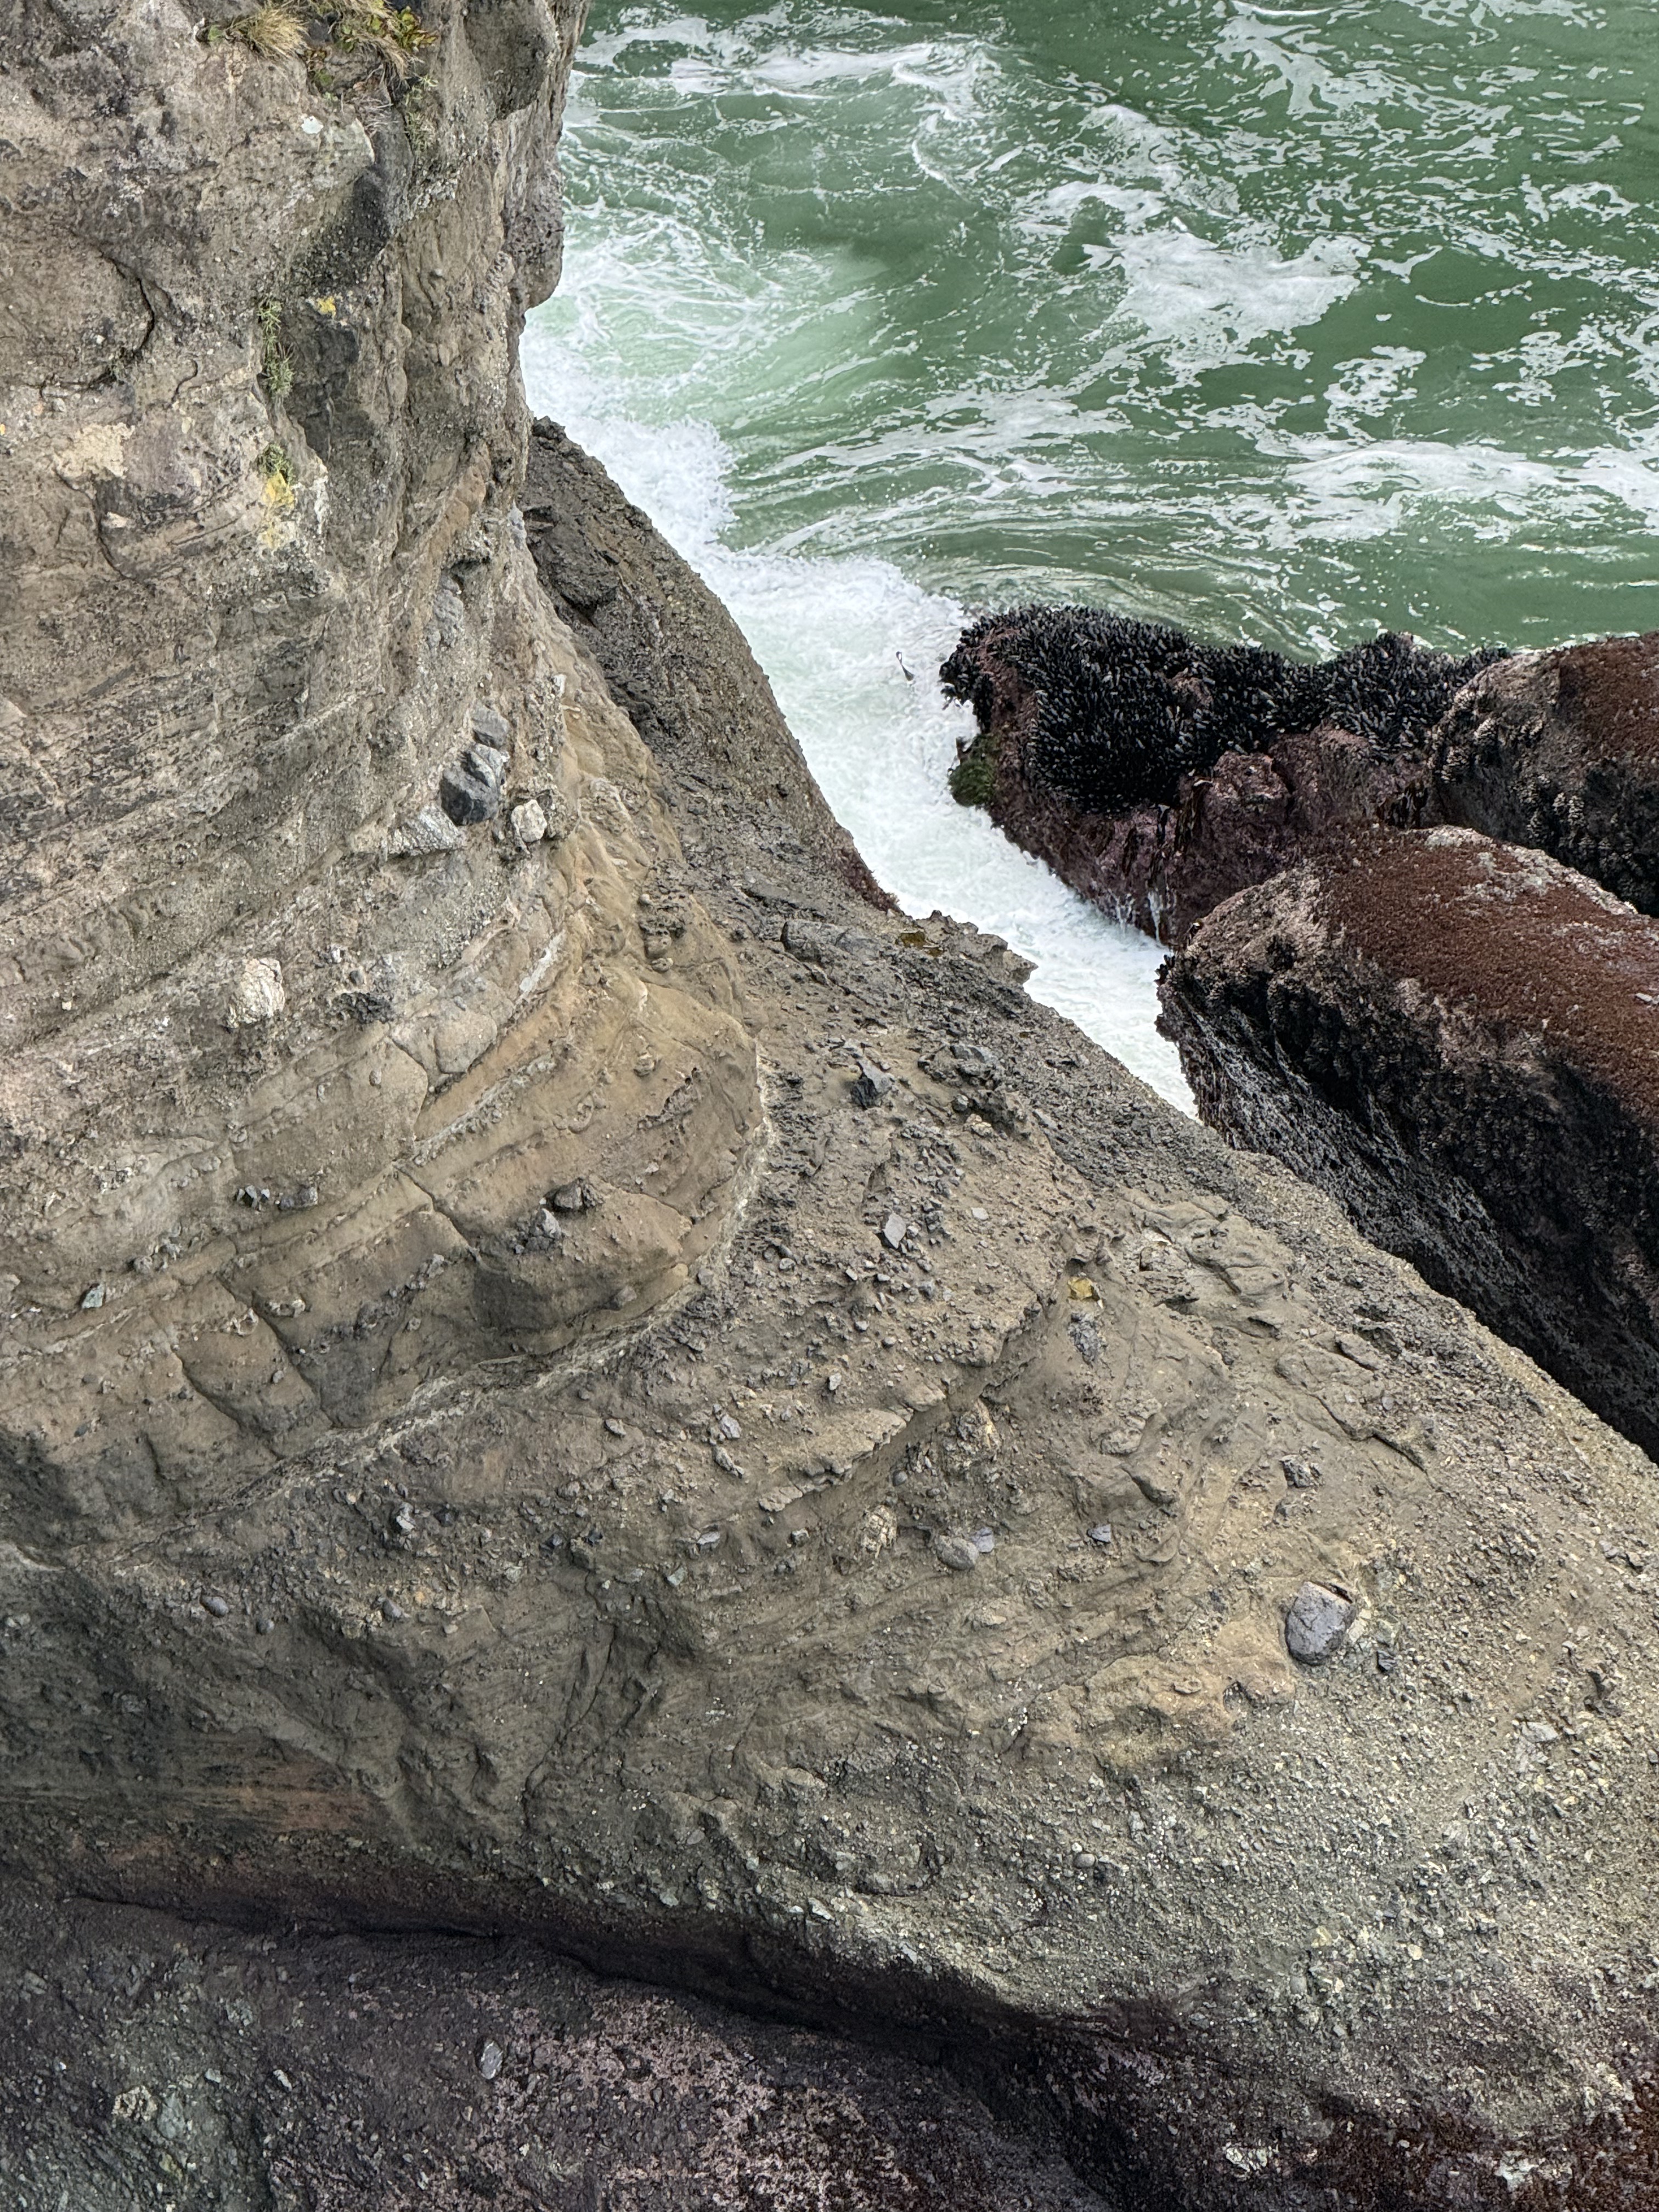
Figure 4. This photo was taken looking down towards the wave-terrace on the south side of the lookout point. For scale, the largest boulders are a couple of feet long, based on exposures at the surface of the trail. This is a textbook tectonic breccia. However, note that most of the rock fragments are rounded, so they have been transported some distance before reaching their final resting place. Some of the layers are relatively uniform with a few large boulders whereas others resemble the cobblestones we saw at Ruby Beach. Each bed might represent a single depositional event (like a landslide) or accumulation over years. These are marine rocks, deposited on a submarine fan, probably as turbidity flows. The process that created them is occurring now a few miles offshore, where the rocky outcrops we saw are eroding and supplying large and small fragments to a steep continental shelf.
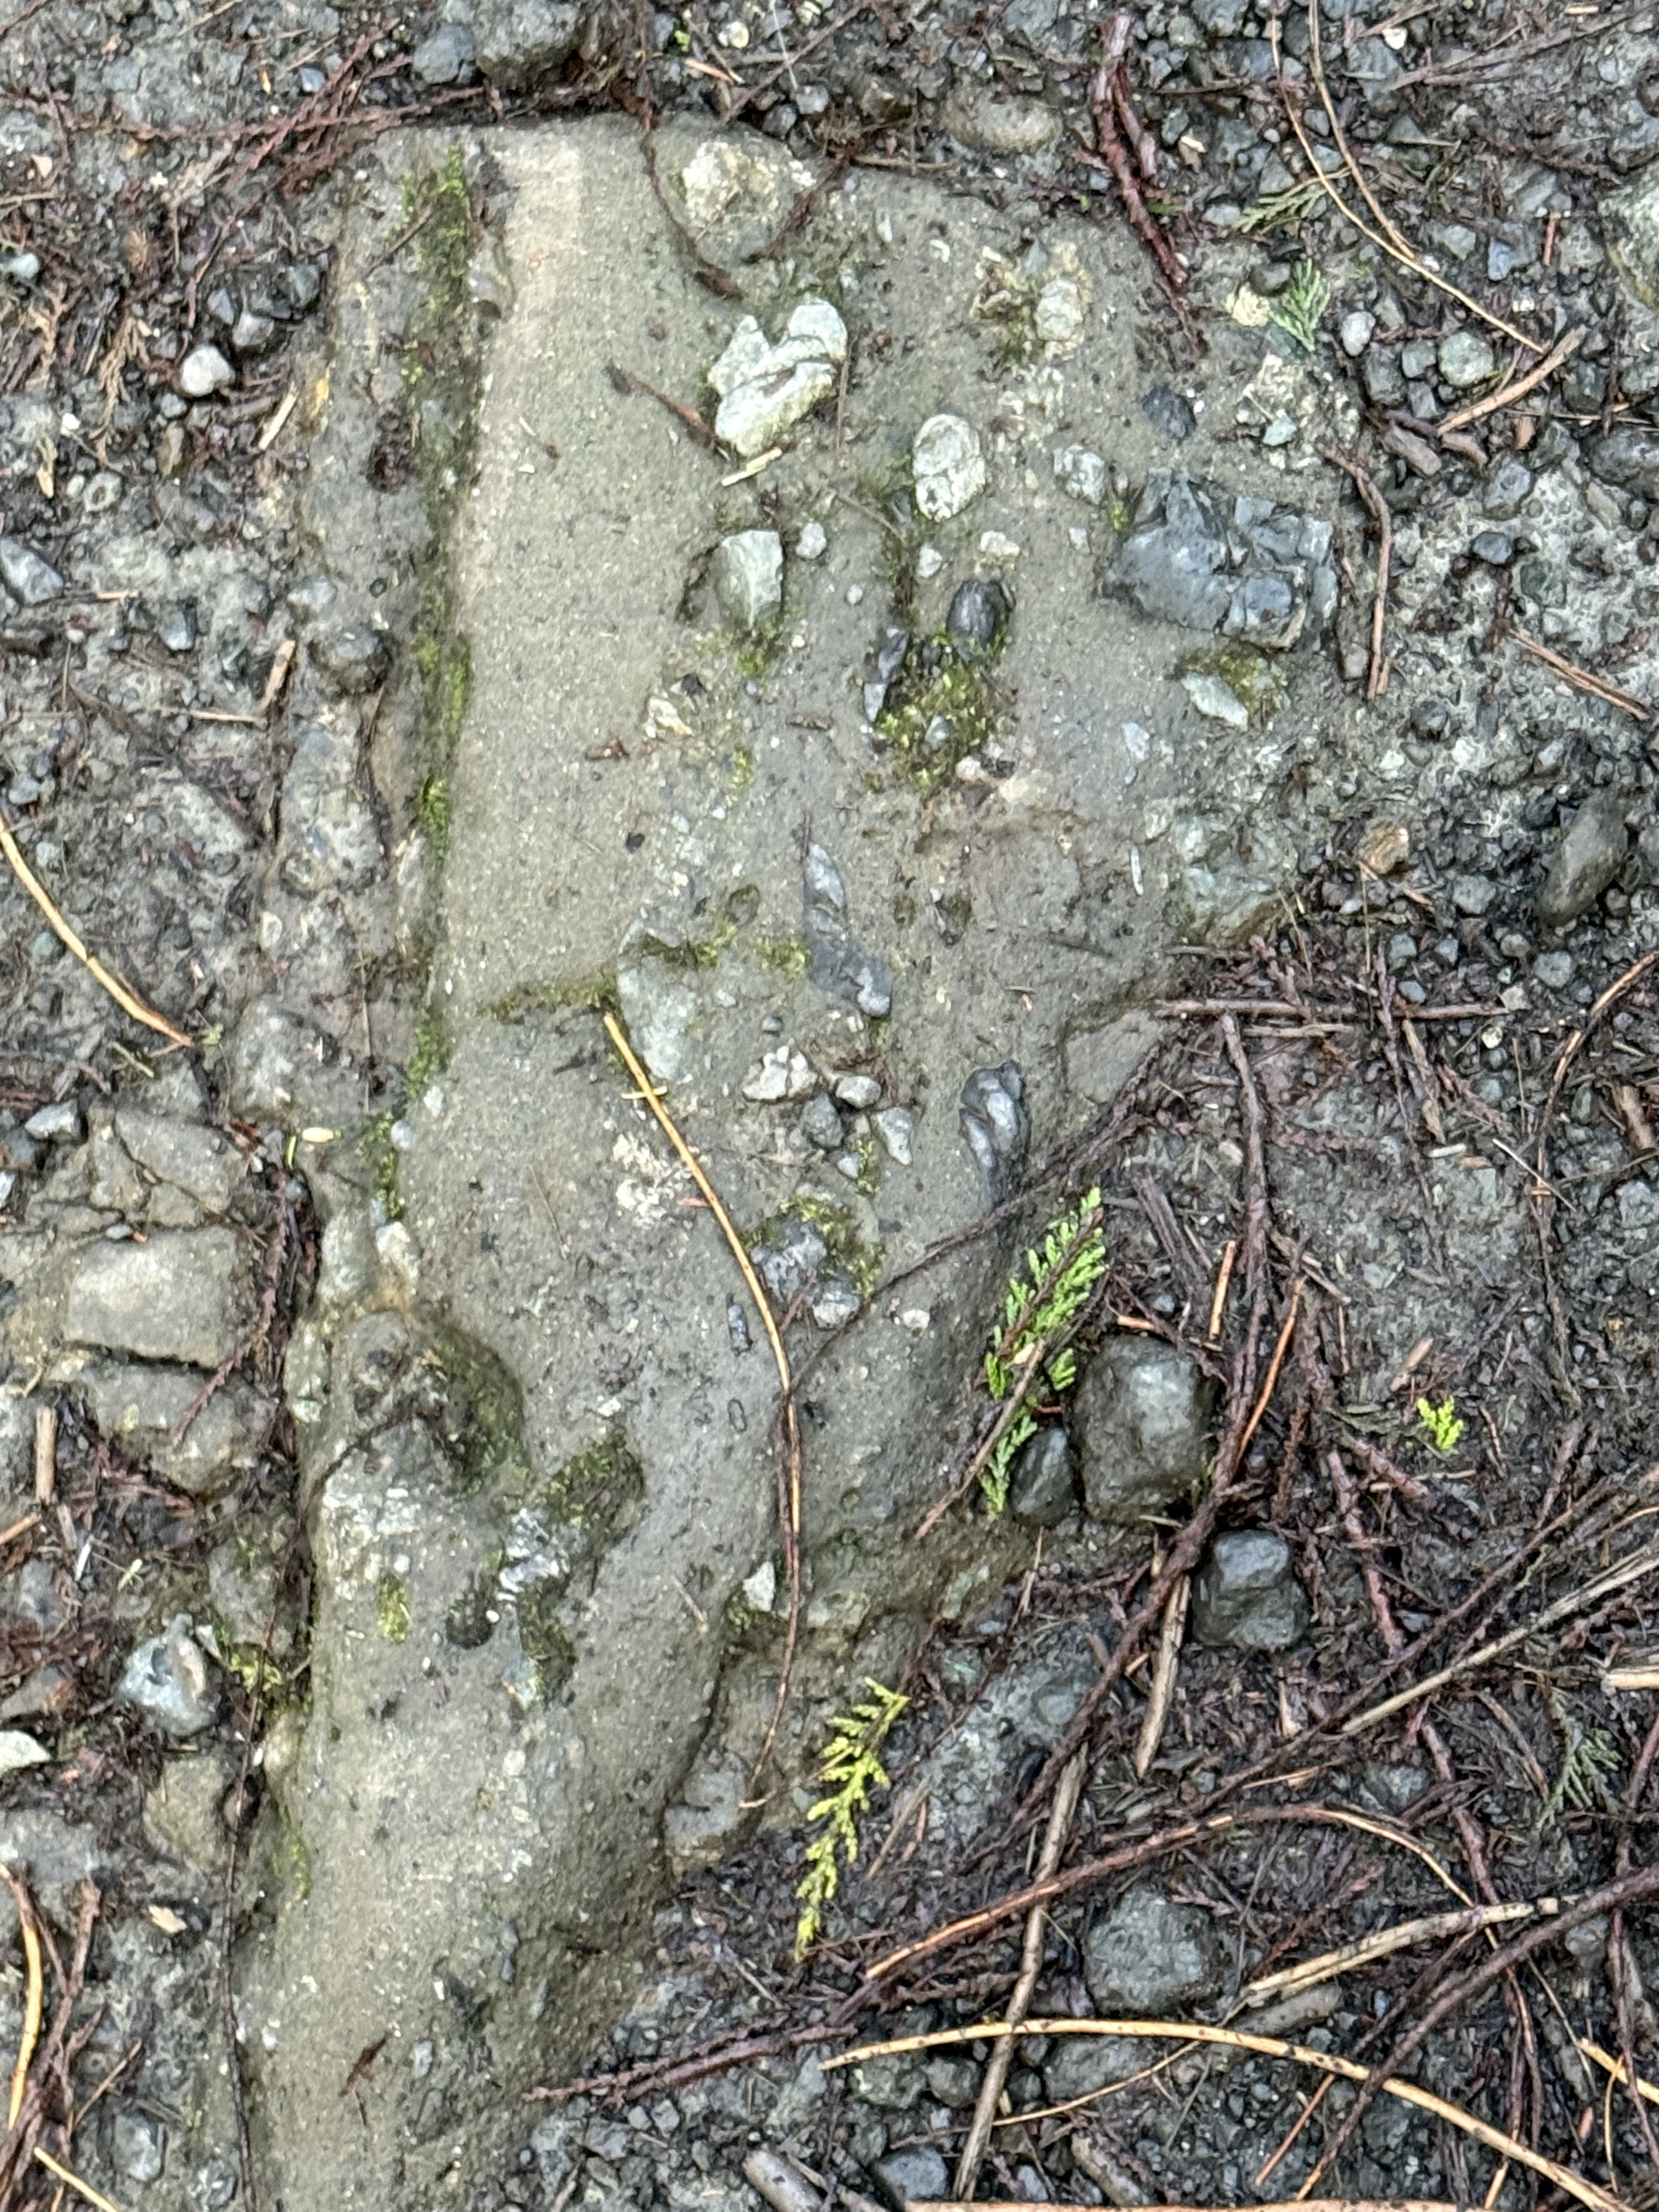
Figure 5. This image looks like run-of-the-mill gravel like you see on pathways and drives, but it is Eocene rock, and I mean solid rock (Note the large, gray piece protruding from the cliff in Fig. 4). This angular slab is about a foot in length. There is no Pleistocene glacial till in this area, even if the ground looks the same. This is a picture frozen in time, where an angular piece of what looks like sandstone, but could be andesite, slid downslope along with smaller fragments.
Summary.
This is the last of my geology posts from a weekend excursion along a hundred-mile stretch of the Washington coast. This is a high wave-energy coast with a tidal range of about 10 feet, the beaches covered with sand and cobbles. Sea stacks protrude from the beach, culminating in cliffs made of 50 Ma conglomerates. Beneath our feet, ocean crust was being subducted at several inches per year, feeding a system of magma chambers that are actively venting through volcanoes like Mt. Saint Helens, Rainier, and Mt. Baker. Rainfall drops along this coast at up to 12 feet per year, feeding streams that carry immense quantities of sediment into the trench created by the subducting ocean crust.
Geology doesn’t get any realer than this…
Tectonic Breccia at Ruby Beach
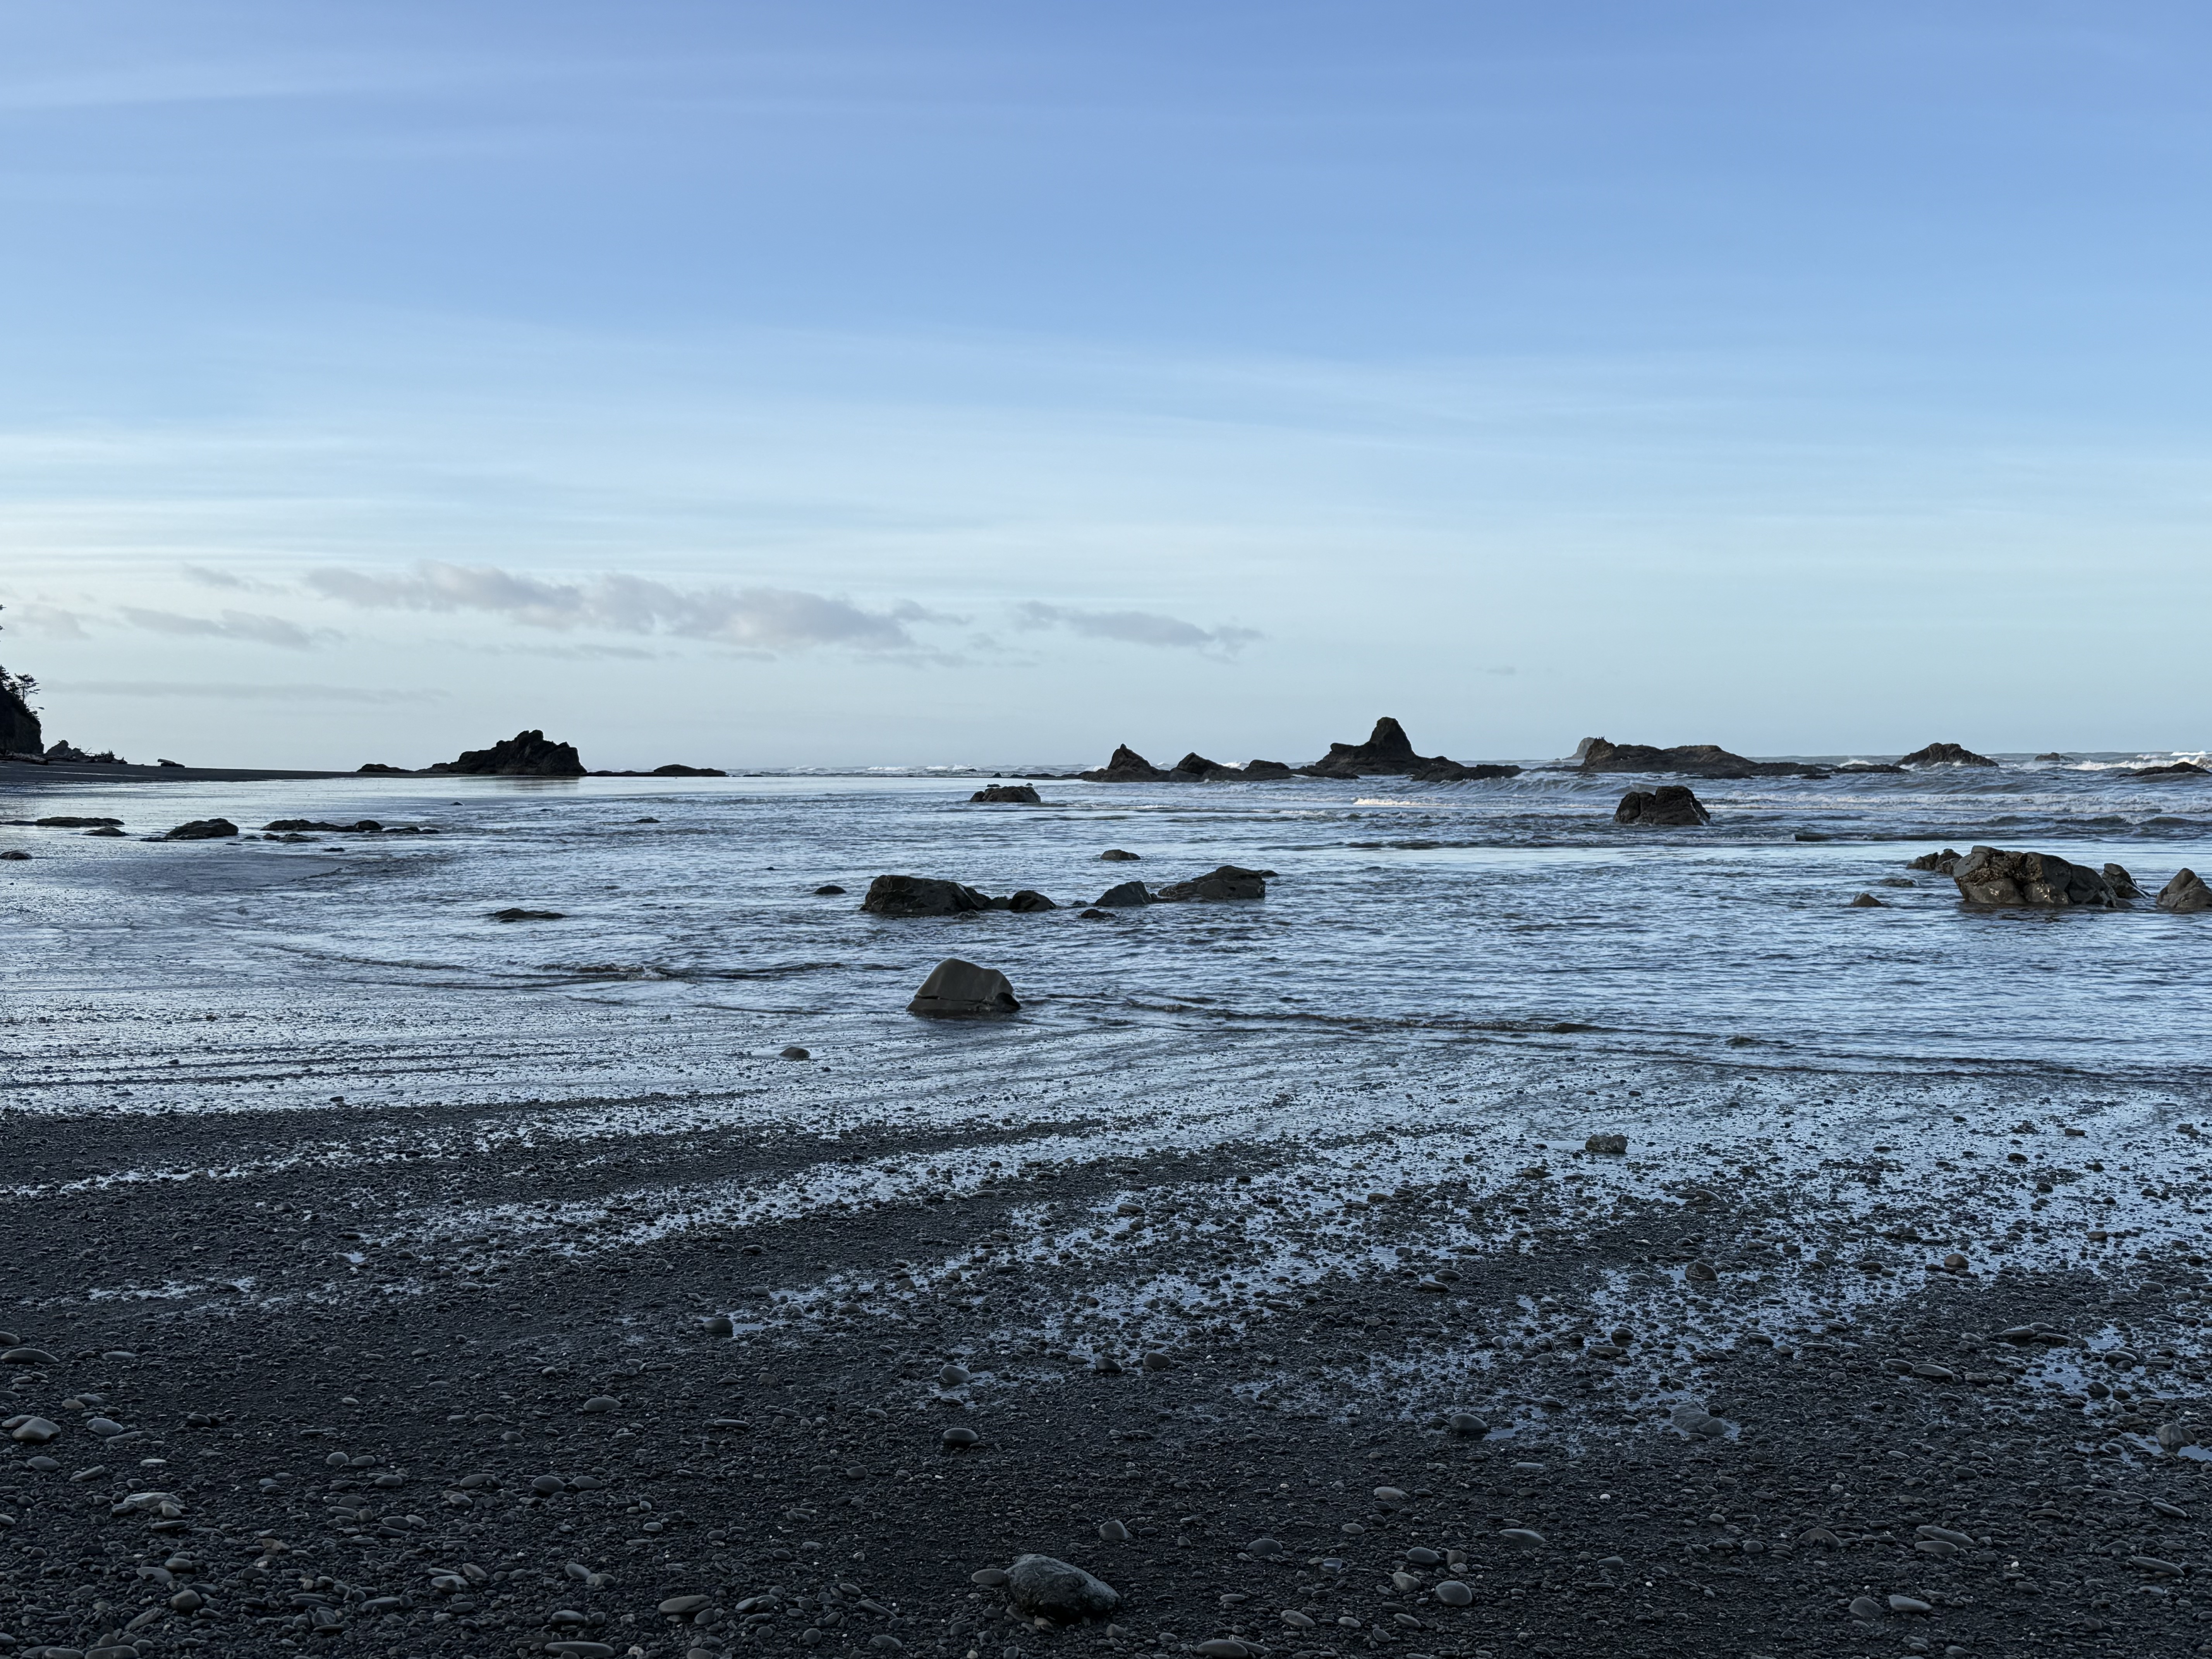
Figure 1. Ruby Beach is located about 10 miles north of Kalaloch Beach (Point C in Fig. 2), but the coastal morphology has changed substantially. This photo was taken at sunrise during low tide, exposing many outcrops of basement rock, which is the same unnamed sandy rock formation we saw before, but its composition has changed.
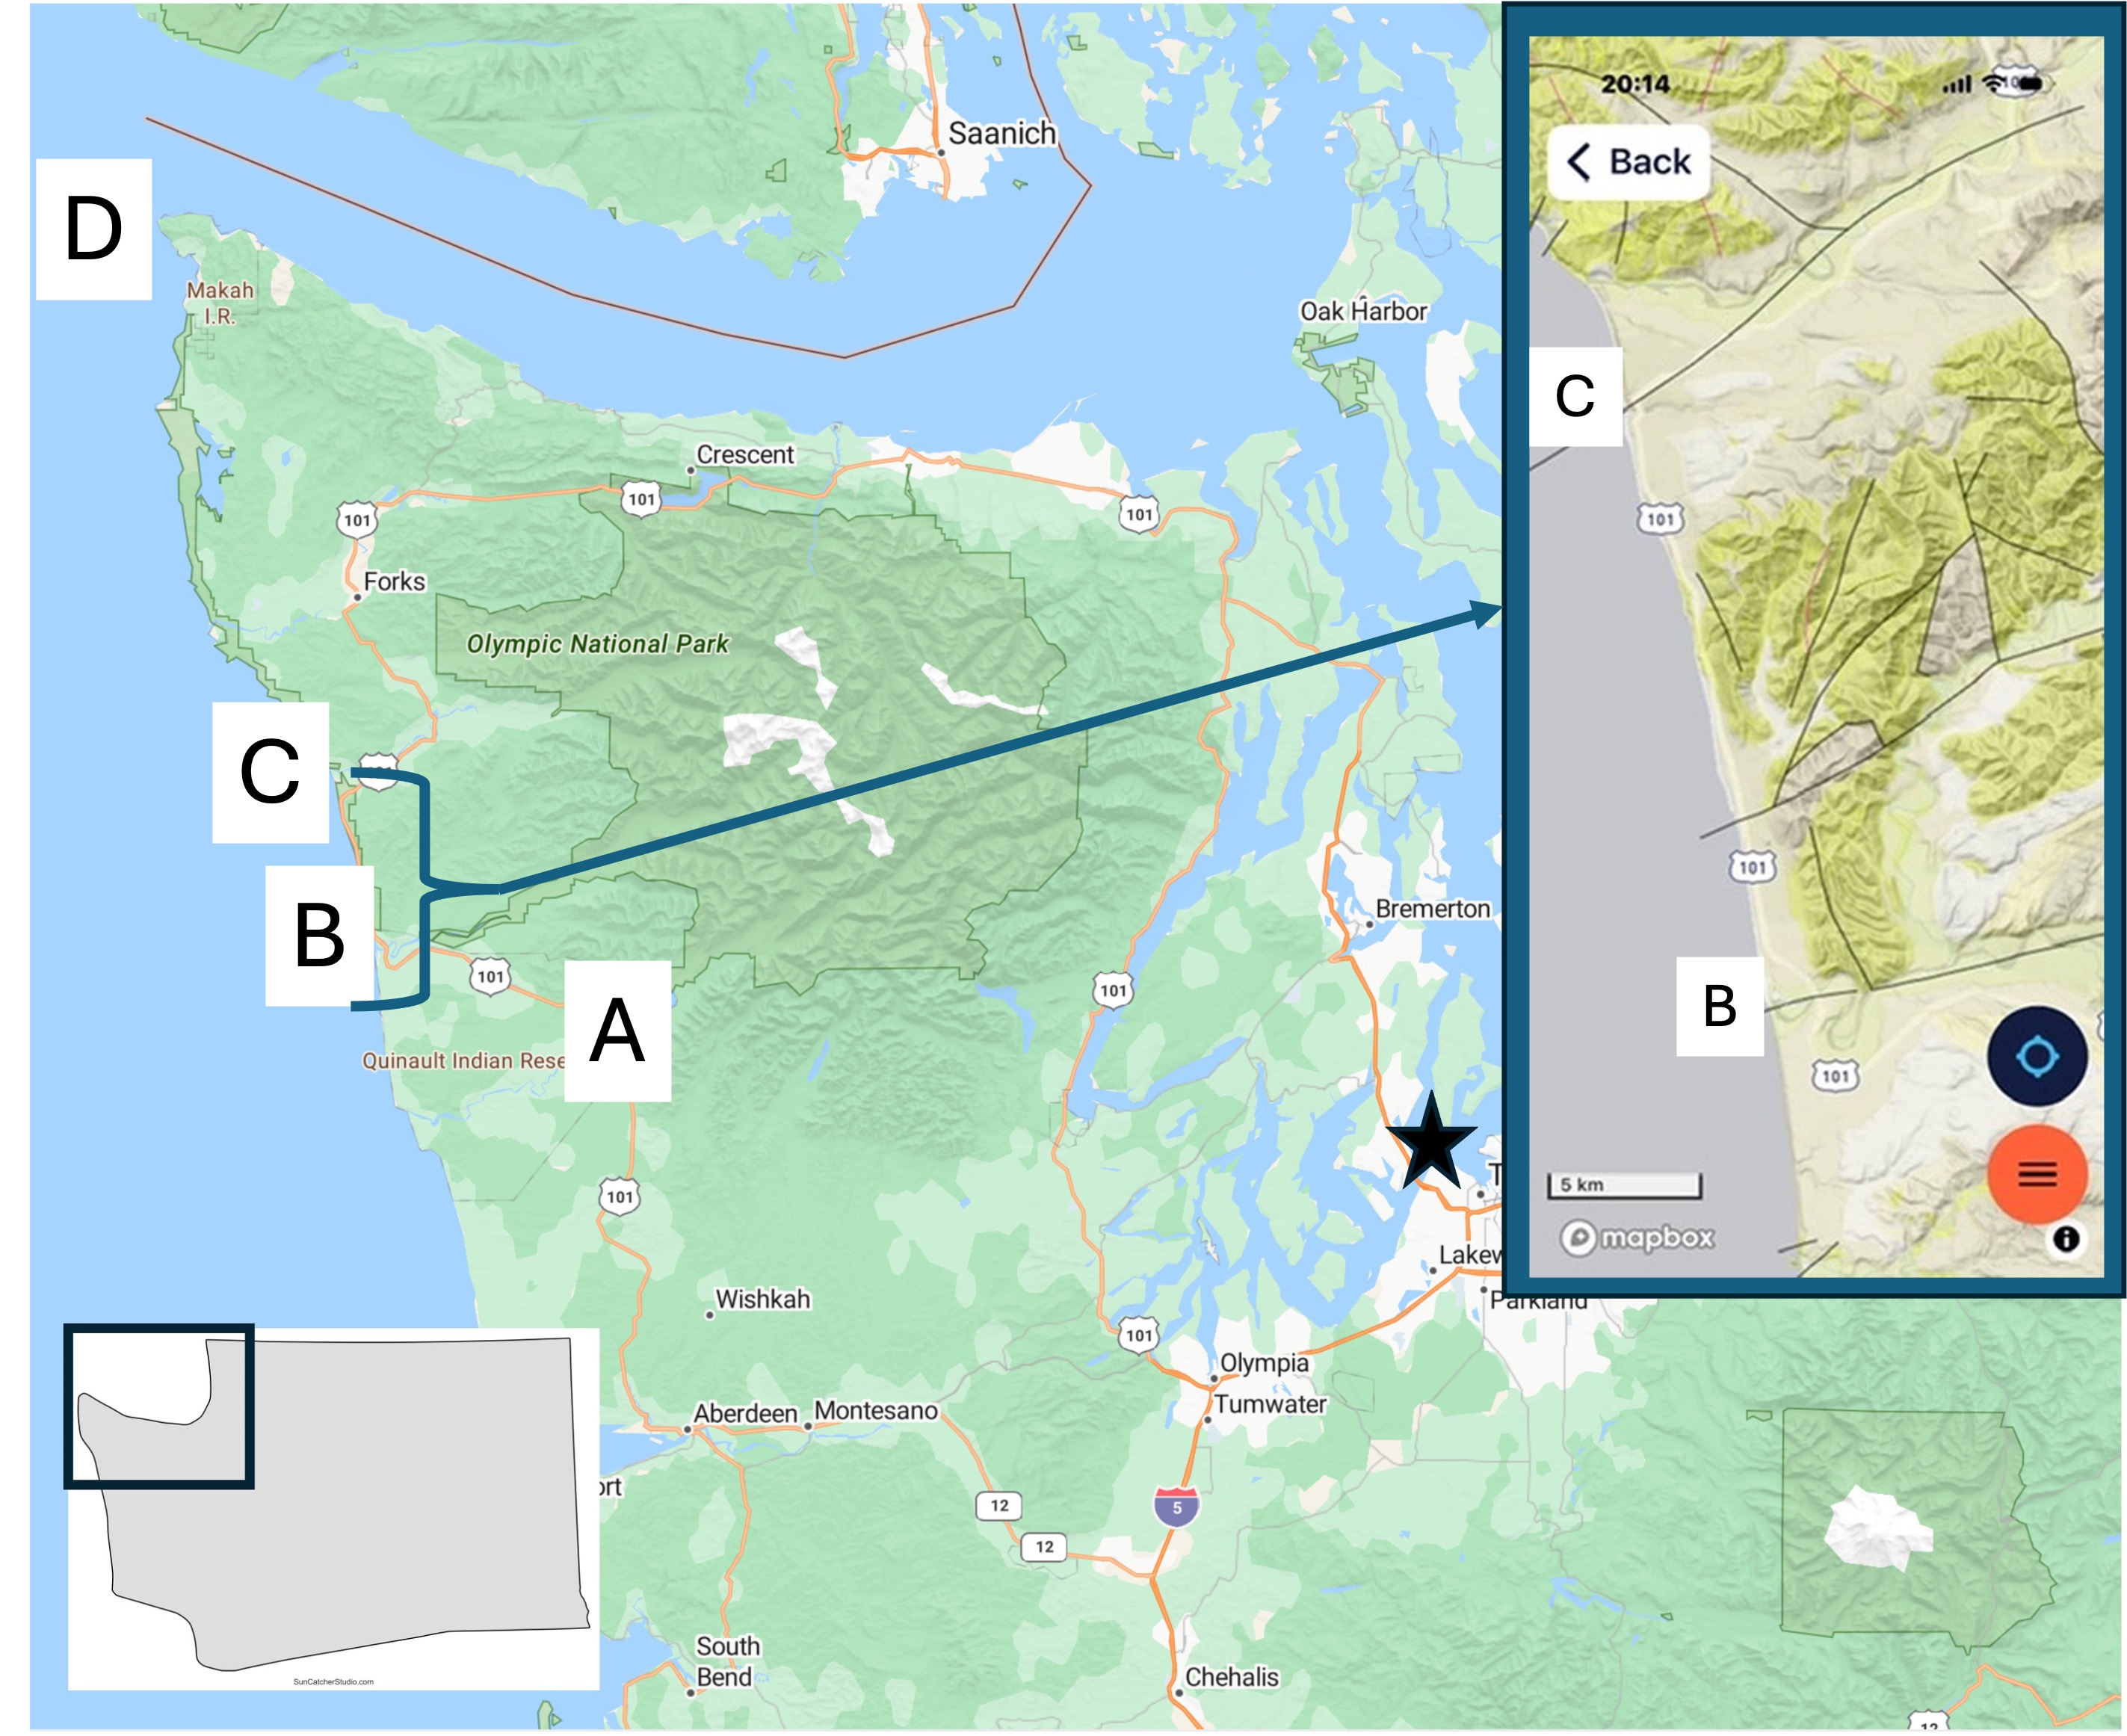
Figure 2. Today’s post describes the coastal geology at Site C. I’ve already discussed the Quinault Rainforest and Kalaloch Beach. I will focus on what is different from the previous post. The inset geologic map from Rock D will be referred to below.
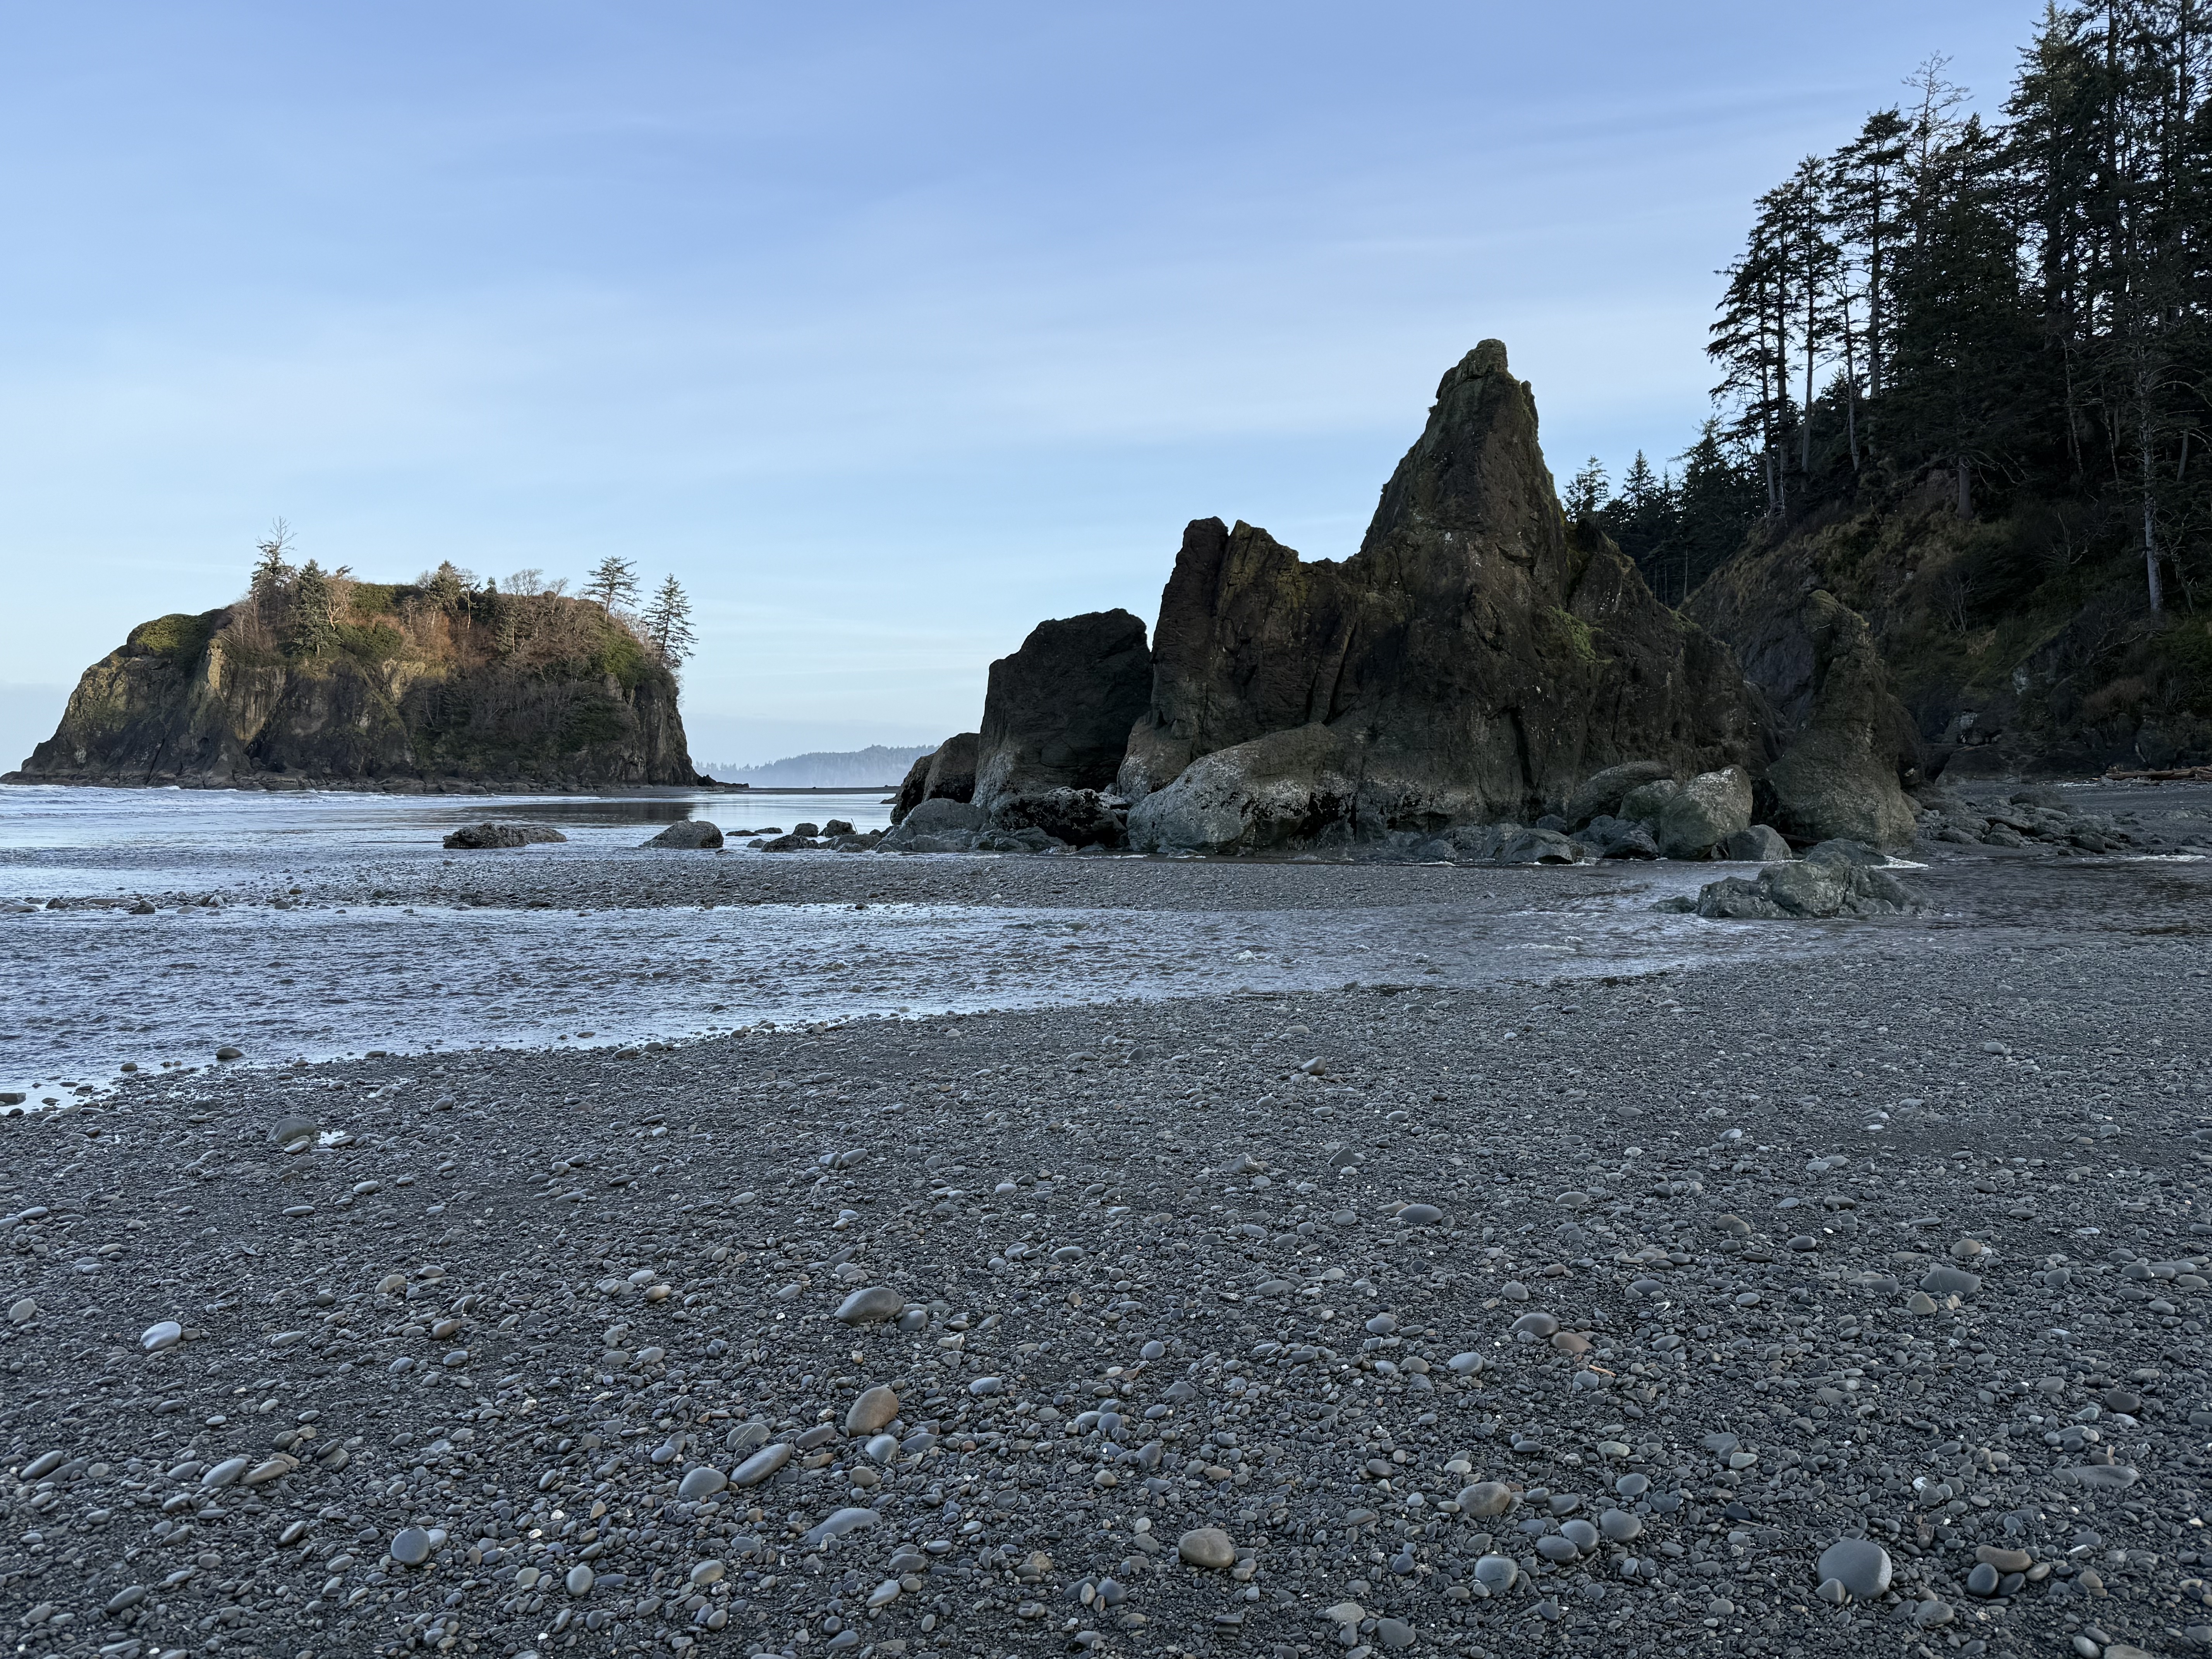
Figure 3. Basement rock of general Tertiary age (66.5-2.4 Ma) is more exposed here although it is overlain by Pleistocene glacial sediments. This photo shows a rocky island that can be reached at low tide, and a promontory. The beach is composed of rounded cobbles in a matrix of sand, silt, and some clay. The finer sediments are restricted to the lower swash zone (Fig. 1).
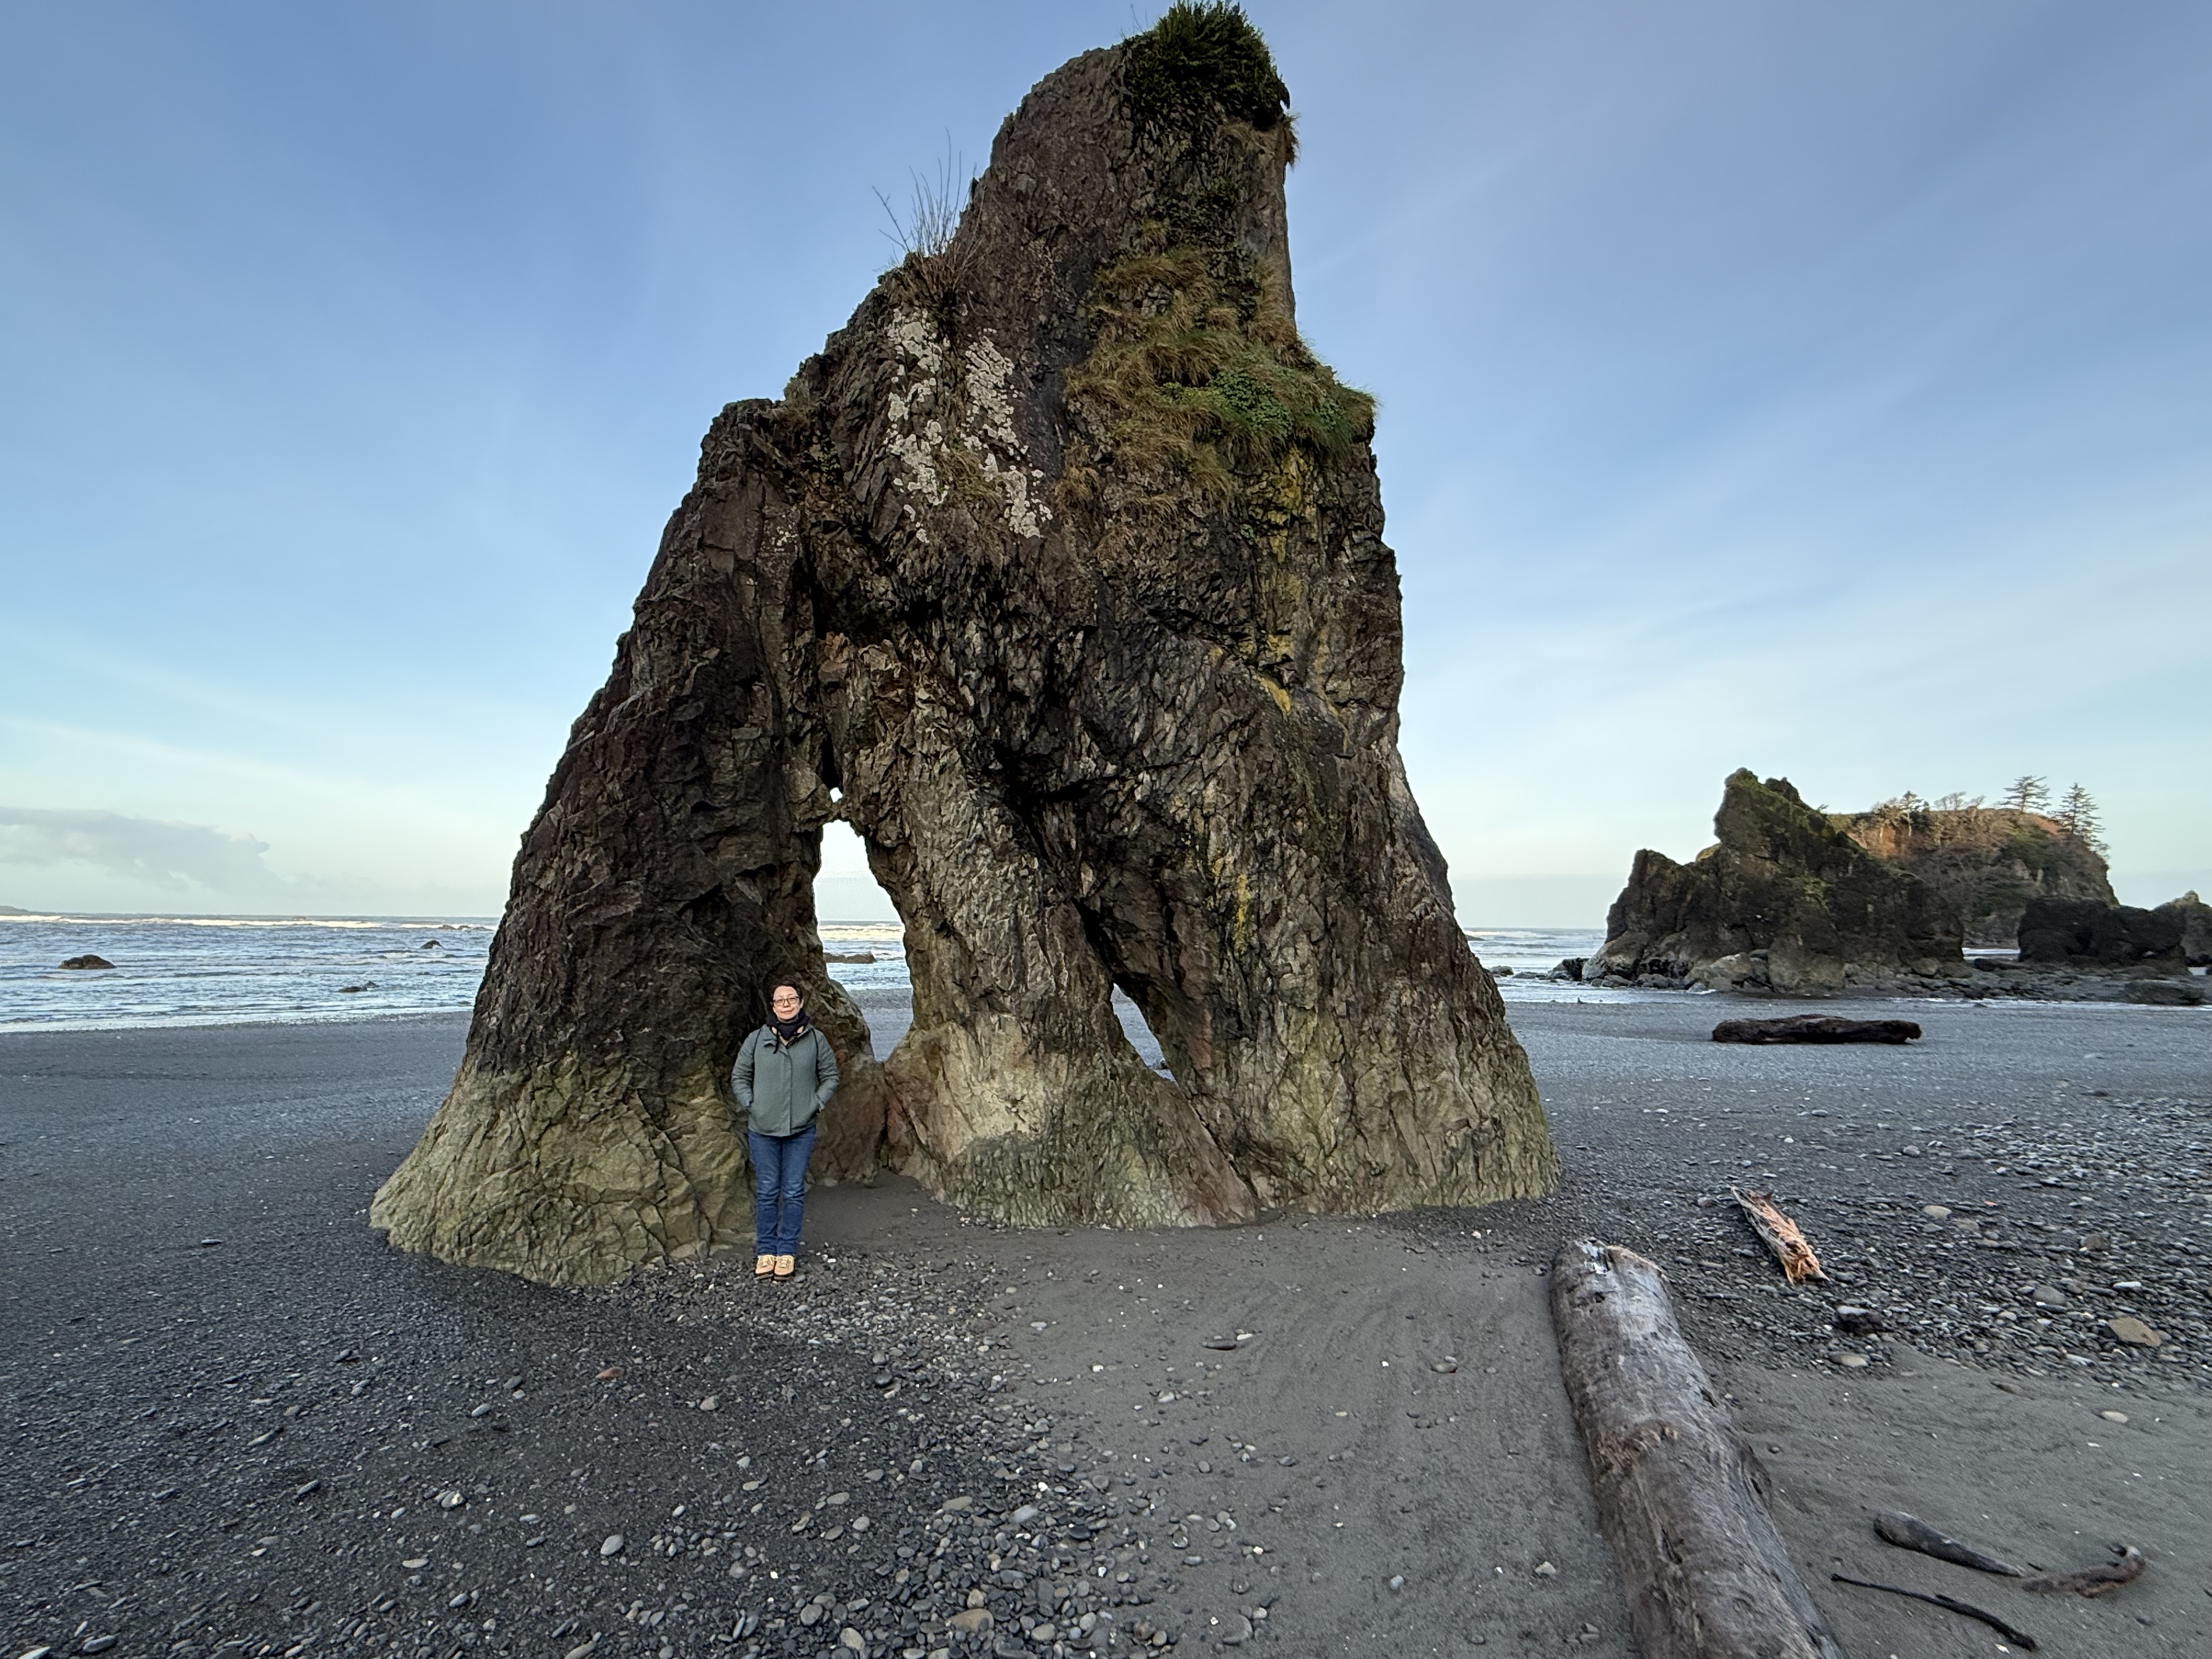
Figure 4. This is a sea stack, a standalone rock pillar. The beach is a thin veneer spread across a rocky basement that is more irregular than we saw at Kalaloch Beach, where the outcrops resembled a wave-cut platform more than we see here. The first thing that occurs to me is that this area hasn’t been exposed to the erosive power of waves for as long an interval. Maybe. Let’s take a look at the inset map of Fig. 2. The black lines represent geologic faults, where rocks have been displaced by tectonic activity. Note that the stretch of coast we’re concerned with is bounded by faults perpendicular to the coast. Furthermore, there is another fault separating Sites B and C. I should take a moment to point out the relationship between faults and river valleys: faults create weak zones within the crust, which are exploited by erosional forces like water and glaciers. Thus we see valleys at both B and C; however, the intervening fault is part of a complex fault system that appears to have led to less surface erosion. Faults cannot be directly dated, only indirectly by the age of the rocks they displace, and in this case those rocks are themselves difficult to date. Thus, it is possible that vertical movement, even a few hundred yards, could have made this beach more irregular than Kalaloch Beach only a few miles to the south–on the other side of a fault. Plausible, but don’t bet your retirement on my hypothesis.
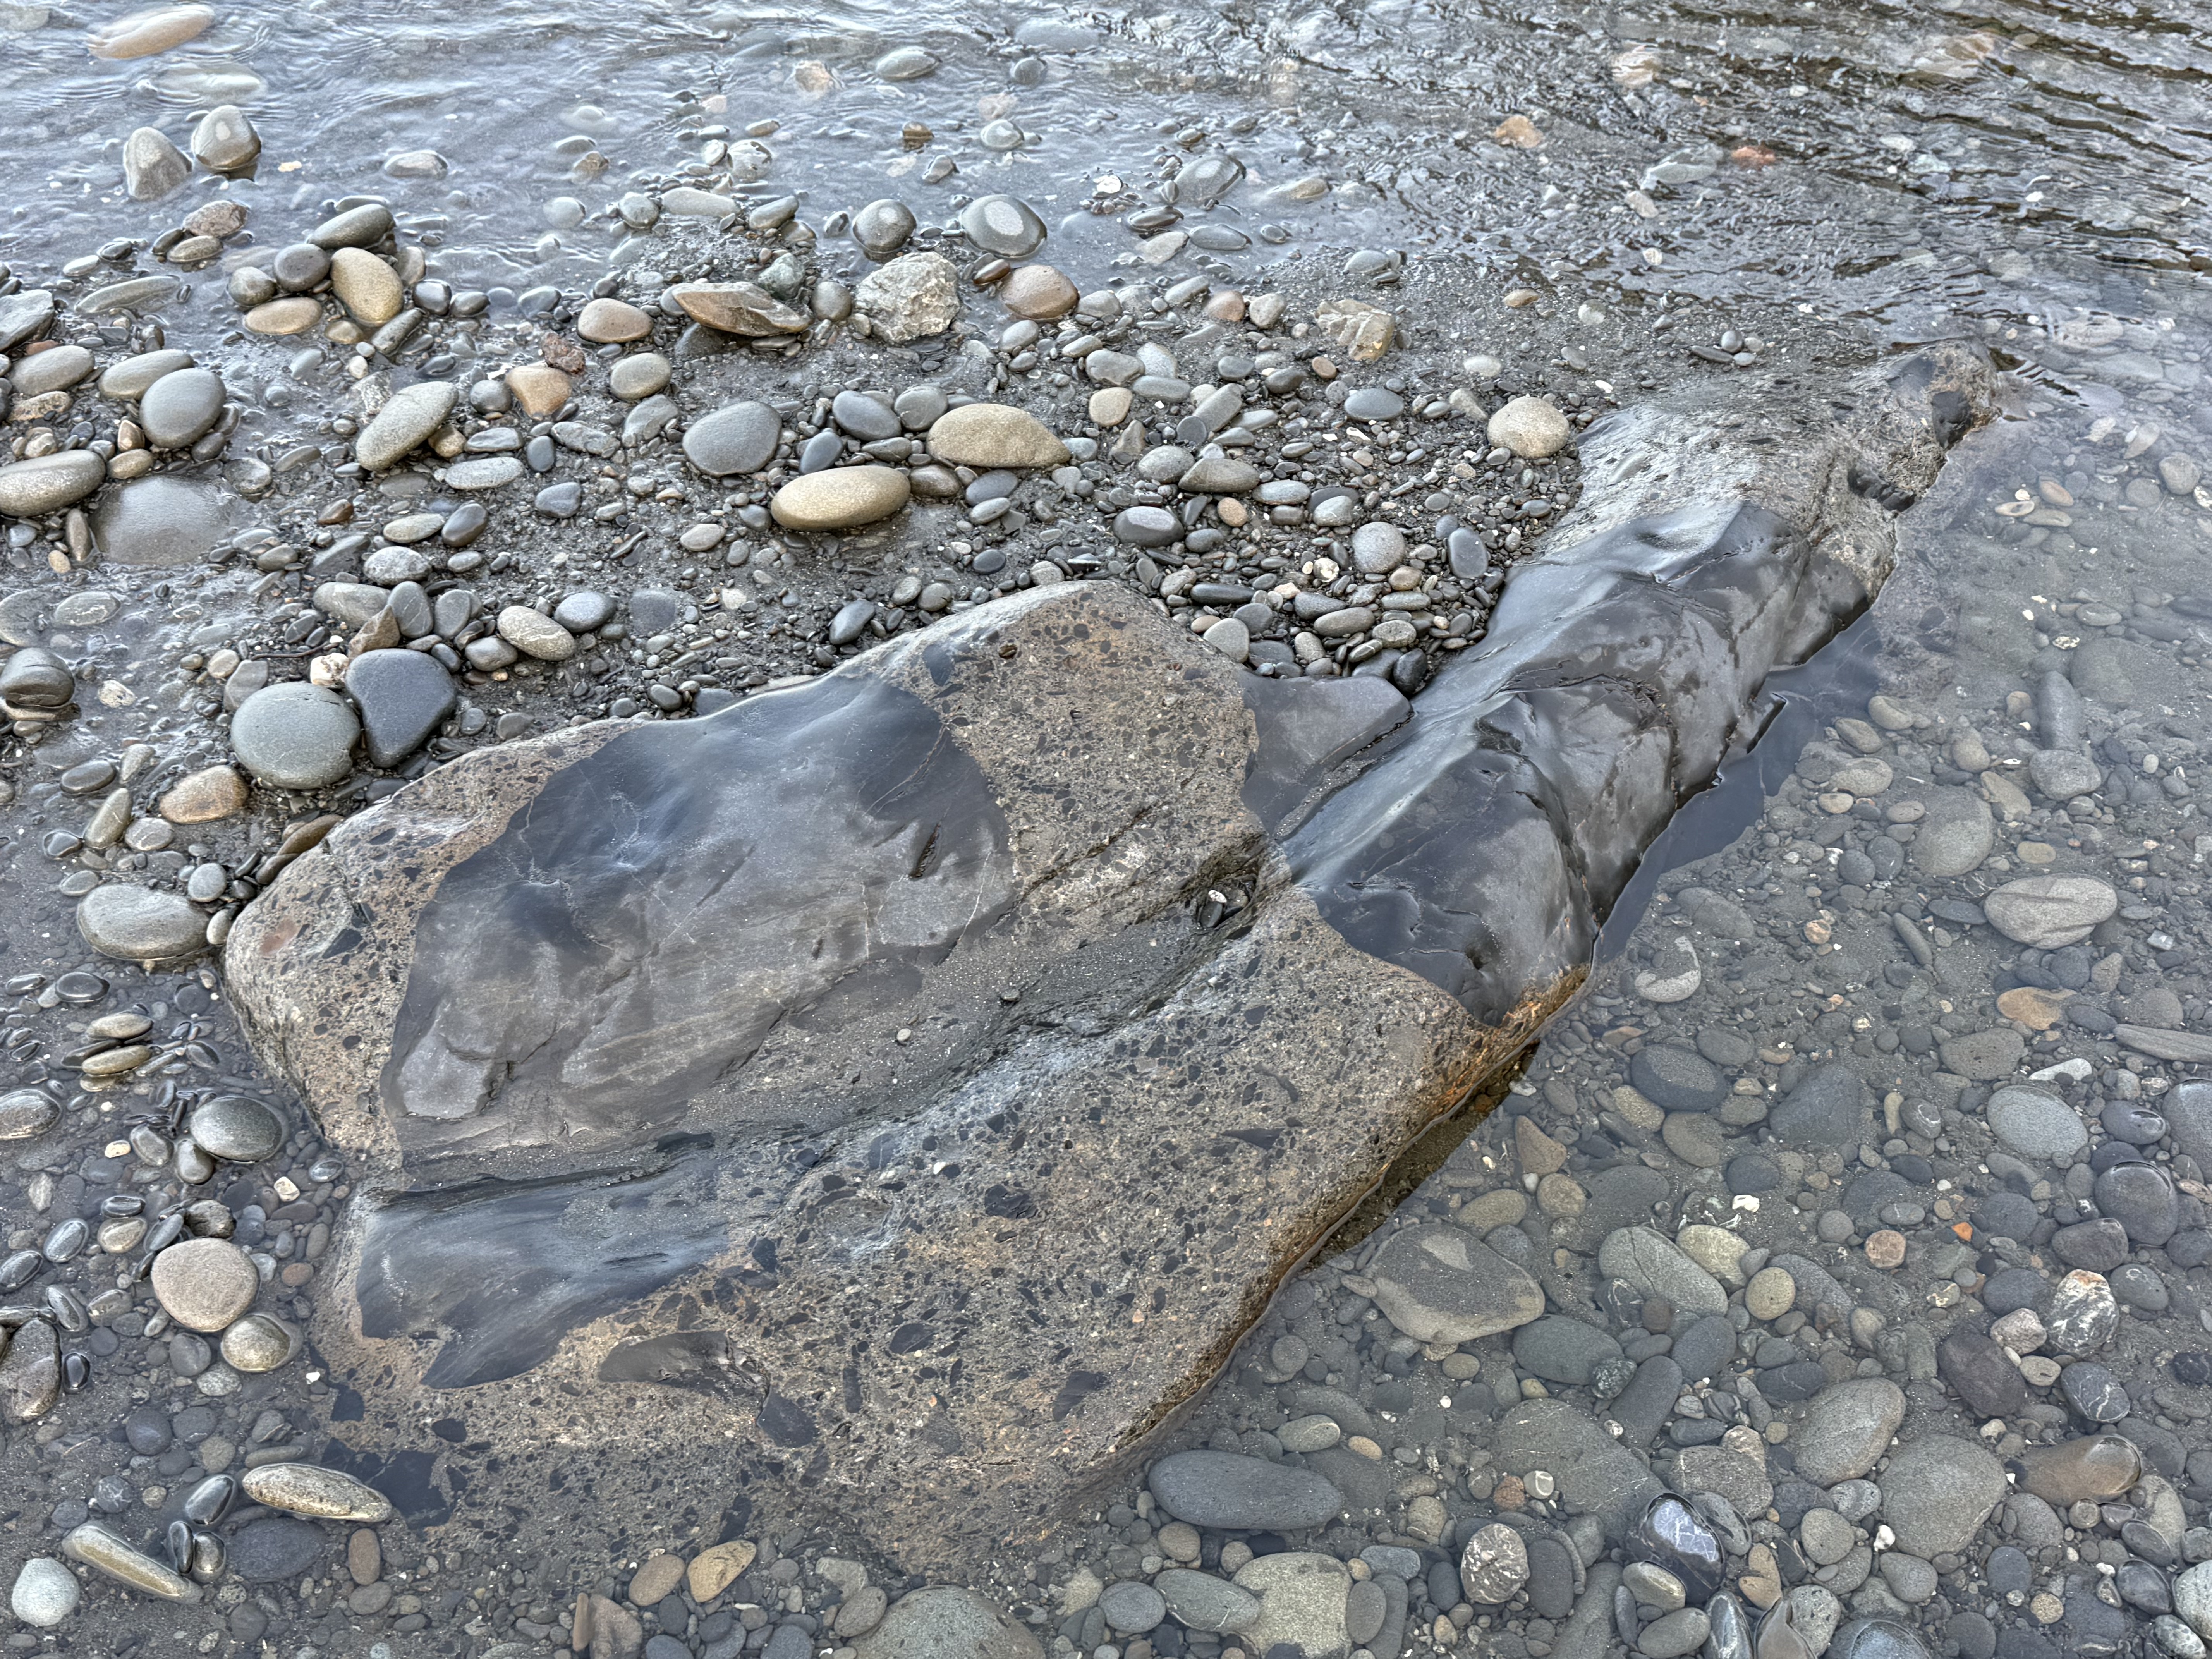
Figure 5. Back to the rocks. This photo puzzled me because I’m not an experienced field geologist, despite my regular posts; however, CoPilot came to the only plausible conclusion: the primary material here is a breccia/graywacke; the smoother material is calcite filling fractures that occurred during faulting (see Fig. 2 inset). We must ALWAYS remember that a sedimentary rock’s history isn’t confined to deposition; a lot happens during burial to many miles and subsequent exhumation and deformation.
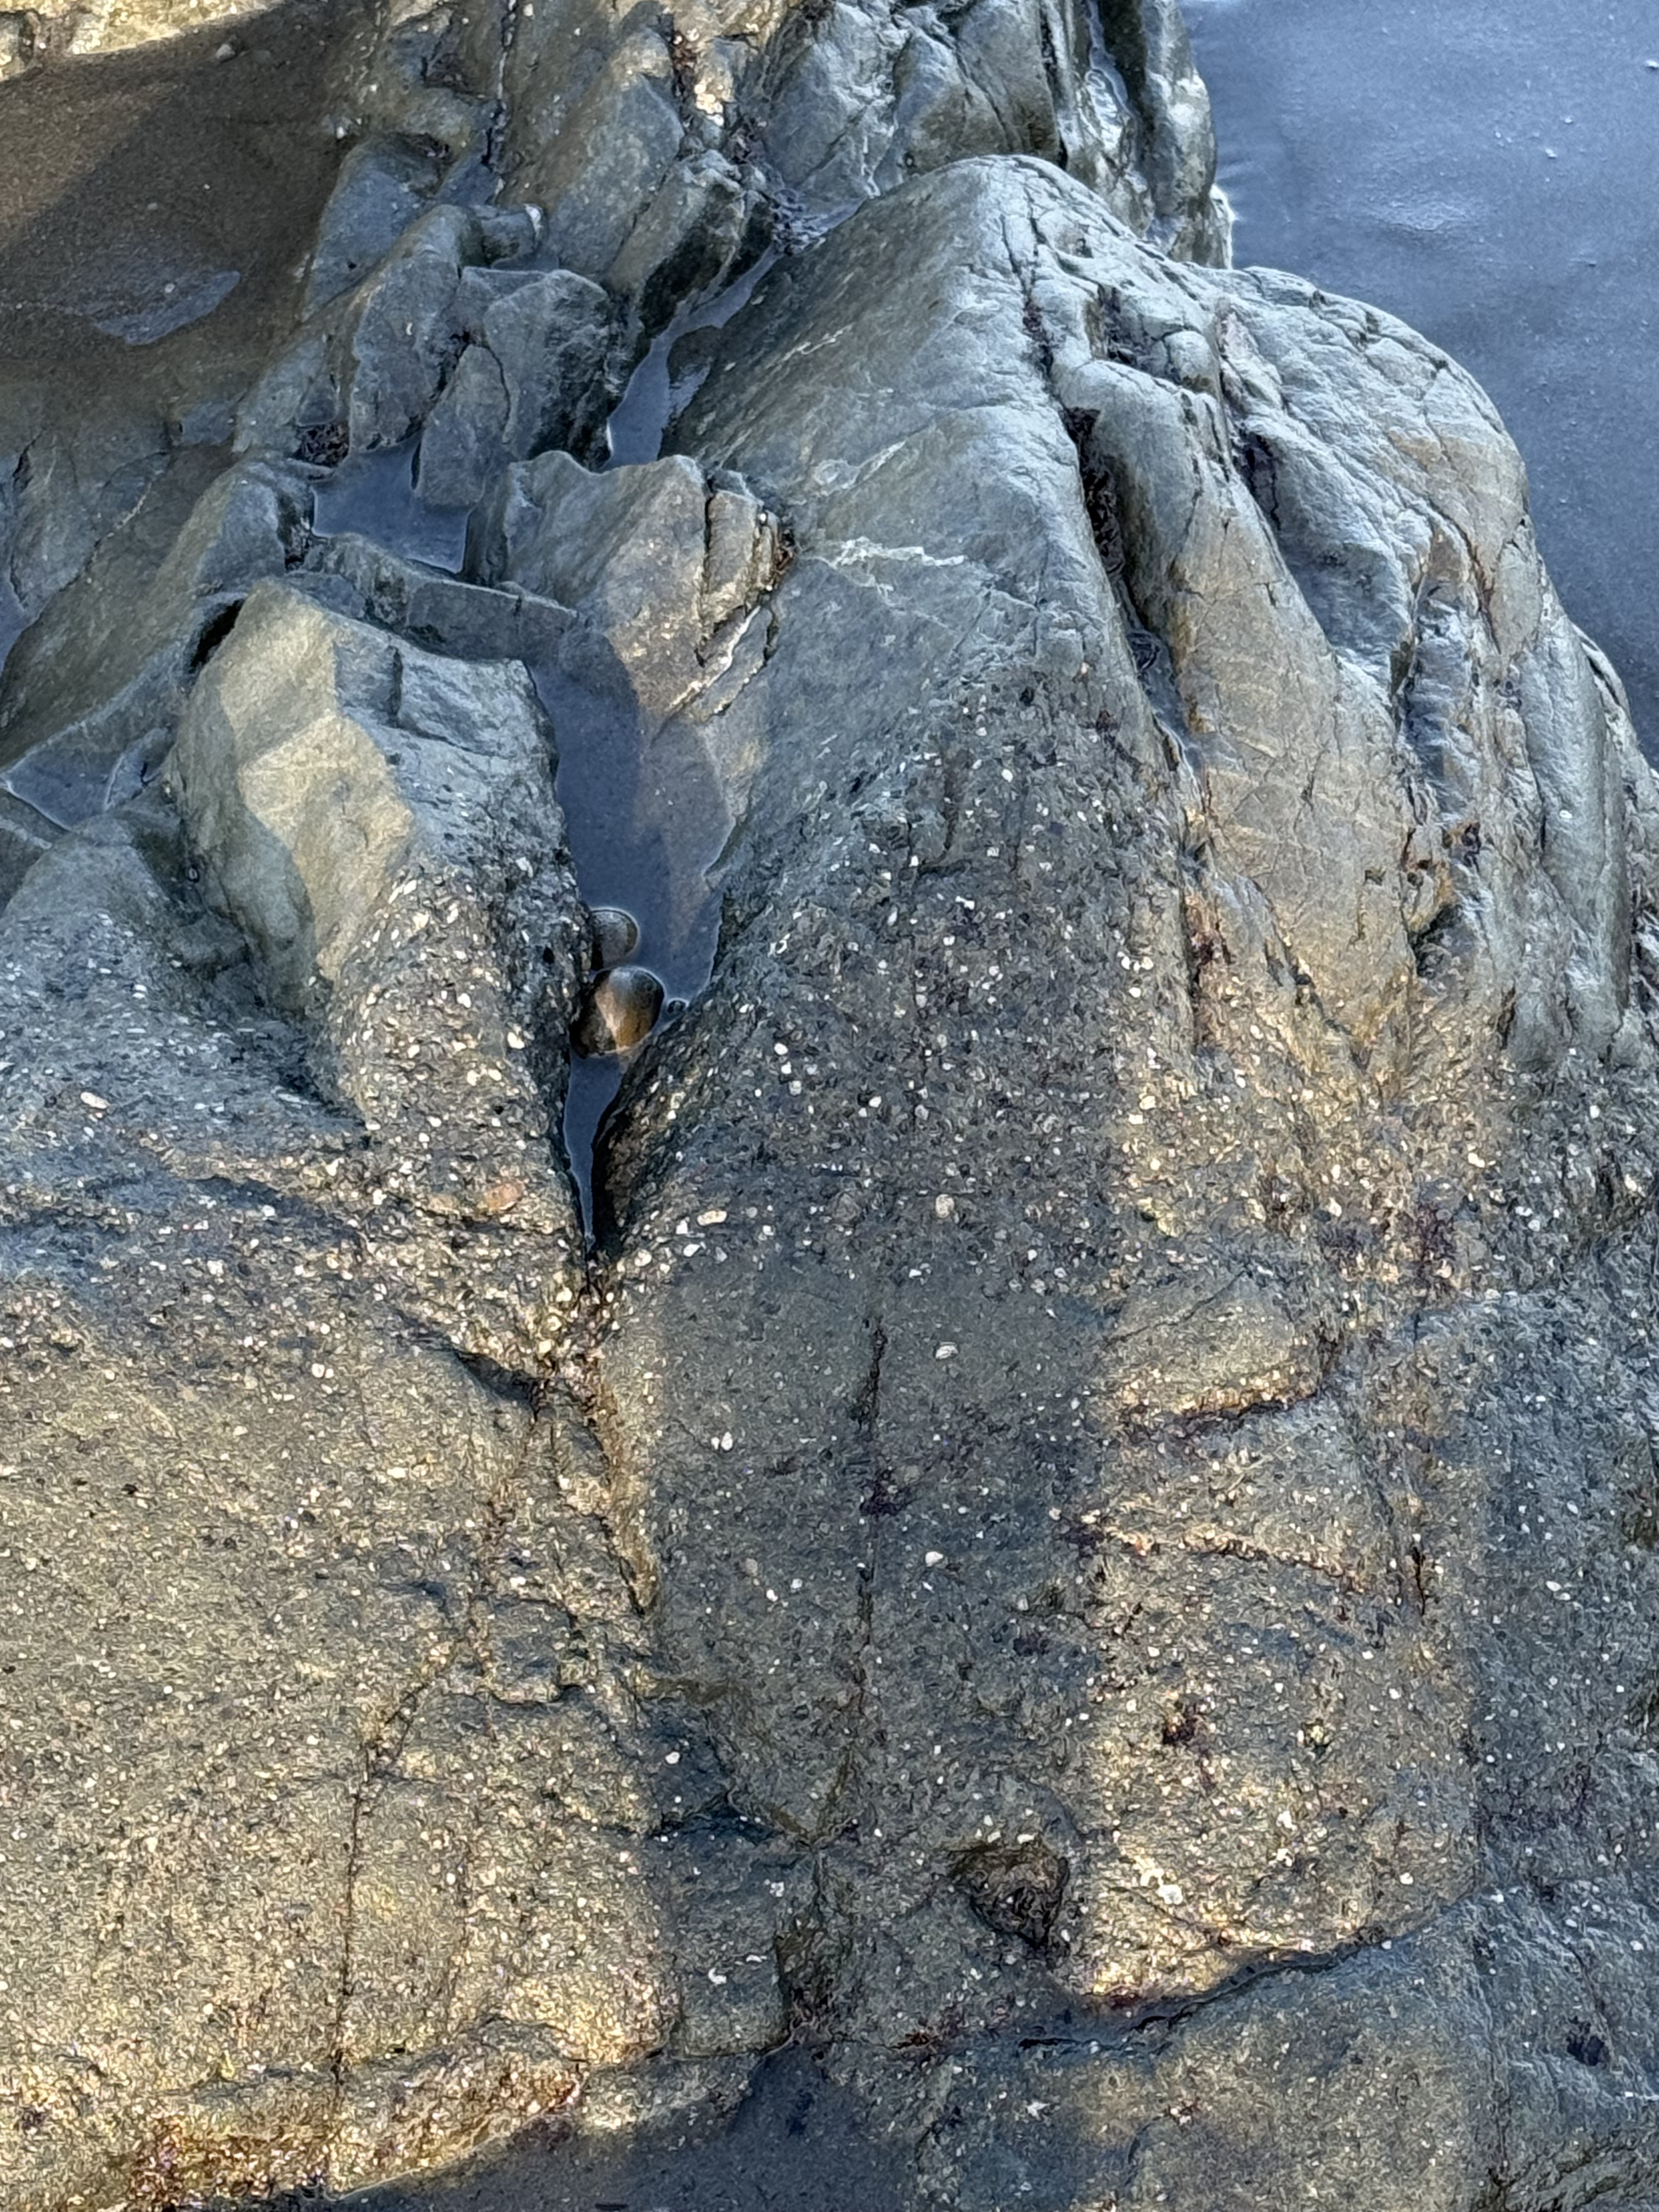
Figure 6. This photo shows a typical graywacke texture with layering, as you might expect with episodic deposition of event beds (e.g. turbidites on a submarine fan); but the upper part of the image is similar to Fig. 6. I asked CoPilot about the source of so much Calcium and I agree with its answer: Some of the Calcium came from marine invertebrates living in the area, but the bulk arrived later, when the sediments were buried deep (several miles) within the accretionary wedge where Calcium is released from minerals like feldspar. It’s really hot down there and the pressure is INTENSE.
Summary.
Not only was Ruby Beach a beautiful area on a cool winter/spring morning, it gave us more insight into the complex life of the earth’s crust. These rocks were probably deposited as poorly sorted graywacke on a steep continental margin overwhelmed by sediment eroded from the rising Cascades (more than likely the Eocene, 56-34 Ma). They were buried for a few million years, before being scraped off the subducting oceanic crust and filled with hot fluids that originated from deeper within the accretionary prism. They were never so humiliated that they became melanges but it was a pretty rough ride, even for a rock.
To put this all in perspective, dinosaurs had just gone extinct (~65 Ma) when all hell broke loose and the Cascades Subduction Zone became very active about ten-million years later; the earth became hot as hell, mammals and birds were beginning to get their legs and wings. While the ecosystem changed dramatically, these rocks were being ground up and spit out by the earth because they were stuck on the end of its tongue. We hominids didn’t come along until these rocks were exposed to the vagaries of the weather and had eroded for a VERY long time.
Try not to laugh at the punch line: Our entire history is contained in the Pleistocene glacial sediments overlying these fairly young sediments.
It boggles the mind…
Coastal Geology of Kalaloch Beach
This report is the geology supplement to my general post about the Olympic Peninsula. It focuses on the geology of the beaches because, to be honest, Quinault Rainforest was impenetrable, physically and geologically, without massive logistical planning and support. What I found was more than I expected.
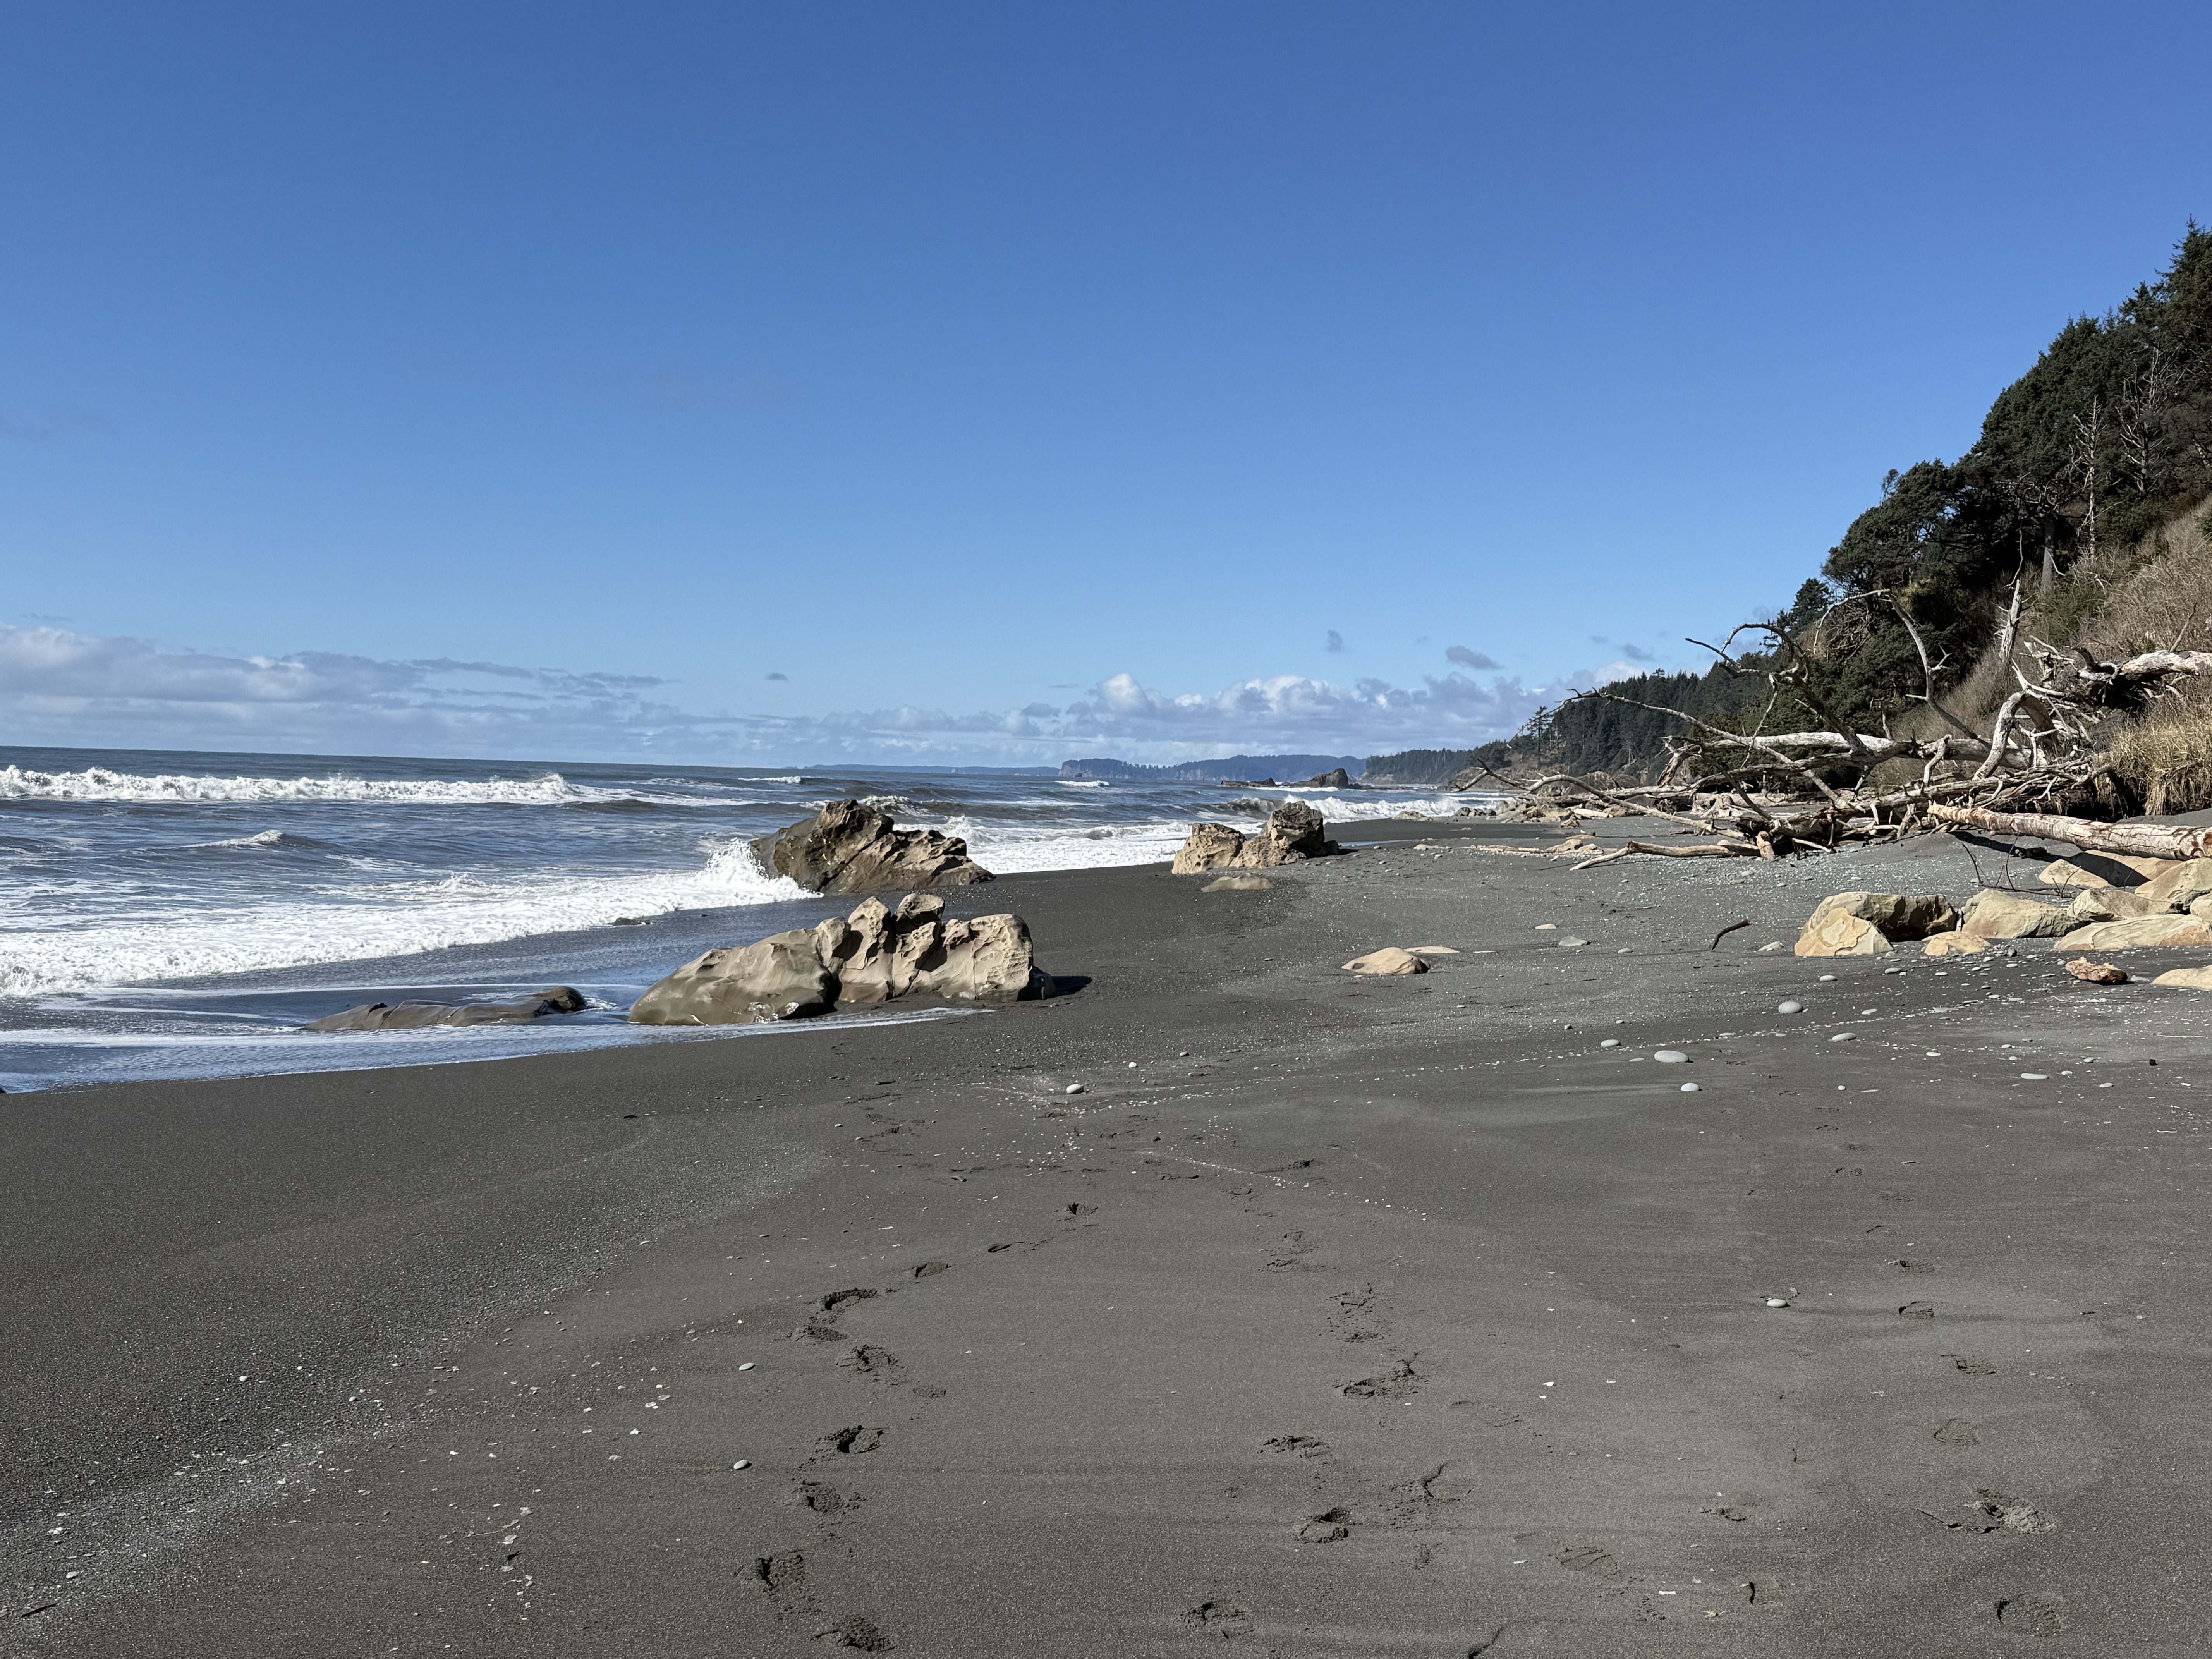
Figure 1. Photo looking north along Beach 4 at Site B in Fig. 2. The tidal range is about 10 feet here and the primary sediment consists of sand with a substantial mud component. The rocks seen in this image are bedrock that protrudes above the veneer of beach sediment. The cliffs to the right comprise glacial till that is less than 2.4 my old (Ma hereafter) deposited by glaciers during the Quaternary geological period. This photo was taken near low tide. The dark color of the beach surface is caused by the relatively large clay component (i.e. mud).
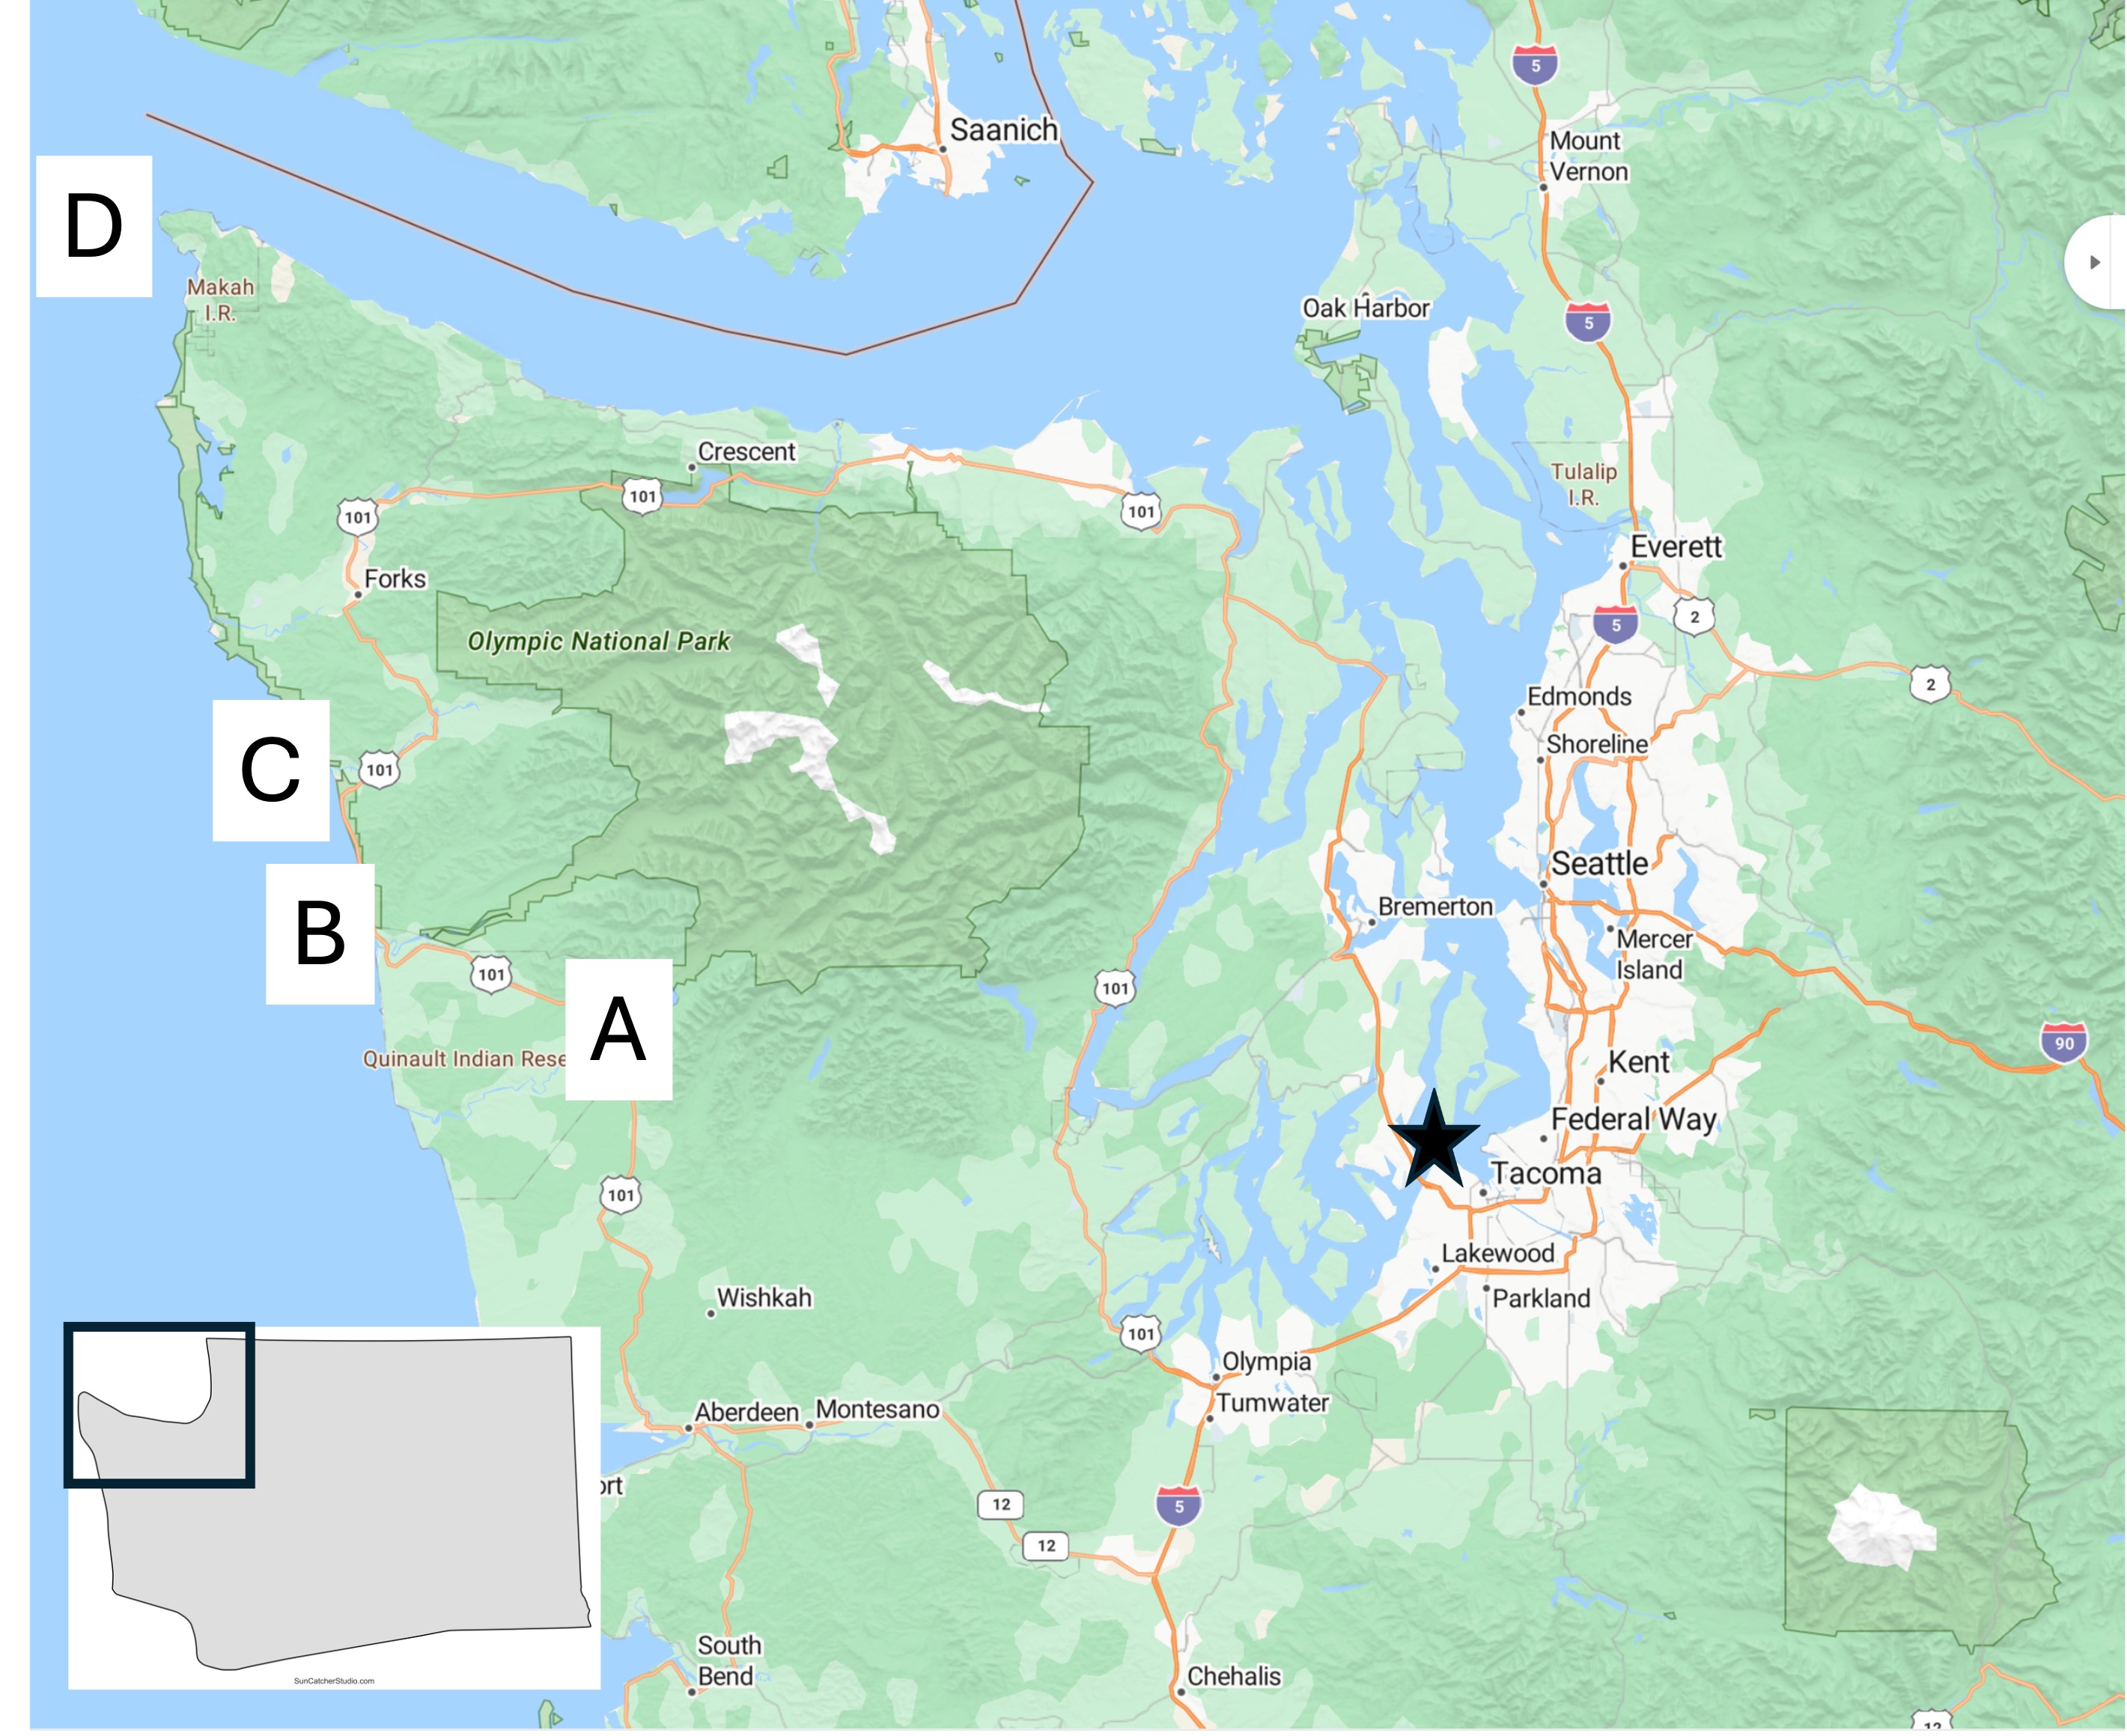
Figure 2. Location map of today’s field area, which will focus on Site B.
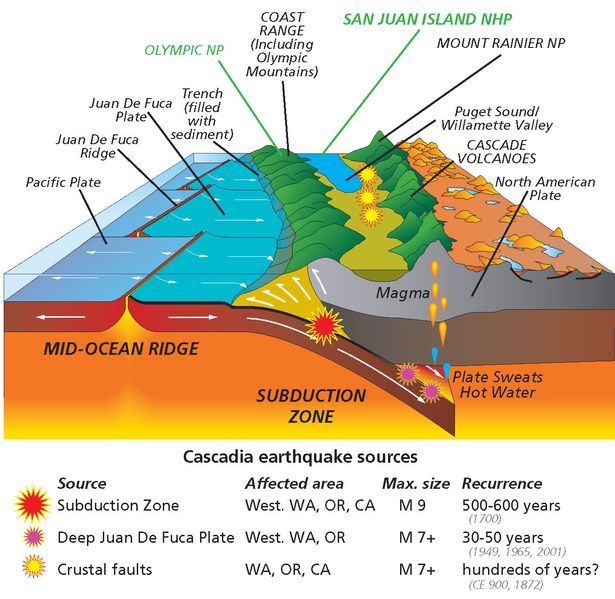
Figure 3. Schematic of the Cascadia Subduction Zone as it appears today. The Coast Range, which includes the Olympic Mountains, consists of sediments and volcanics that have been scraped off the subducting ocean crust. The white arrows at the front of the image don’t reflect the actual geometry of these sedimentary rocks. We’ll get to that in a minute. Today’s post will focus on these sediments and discuss their original depositional environment during the Tertiary period (~65.5-2.4 Ma), as well as evidence for structural deformation.
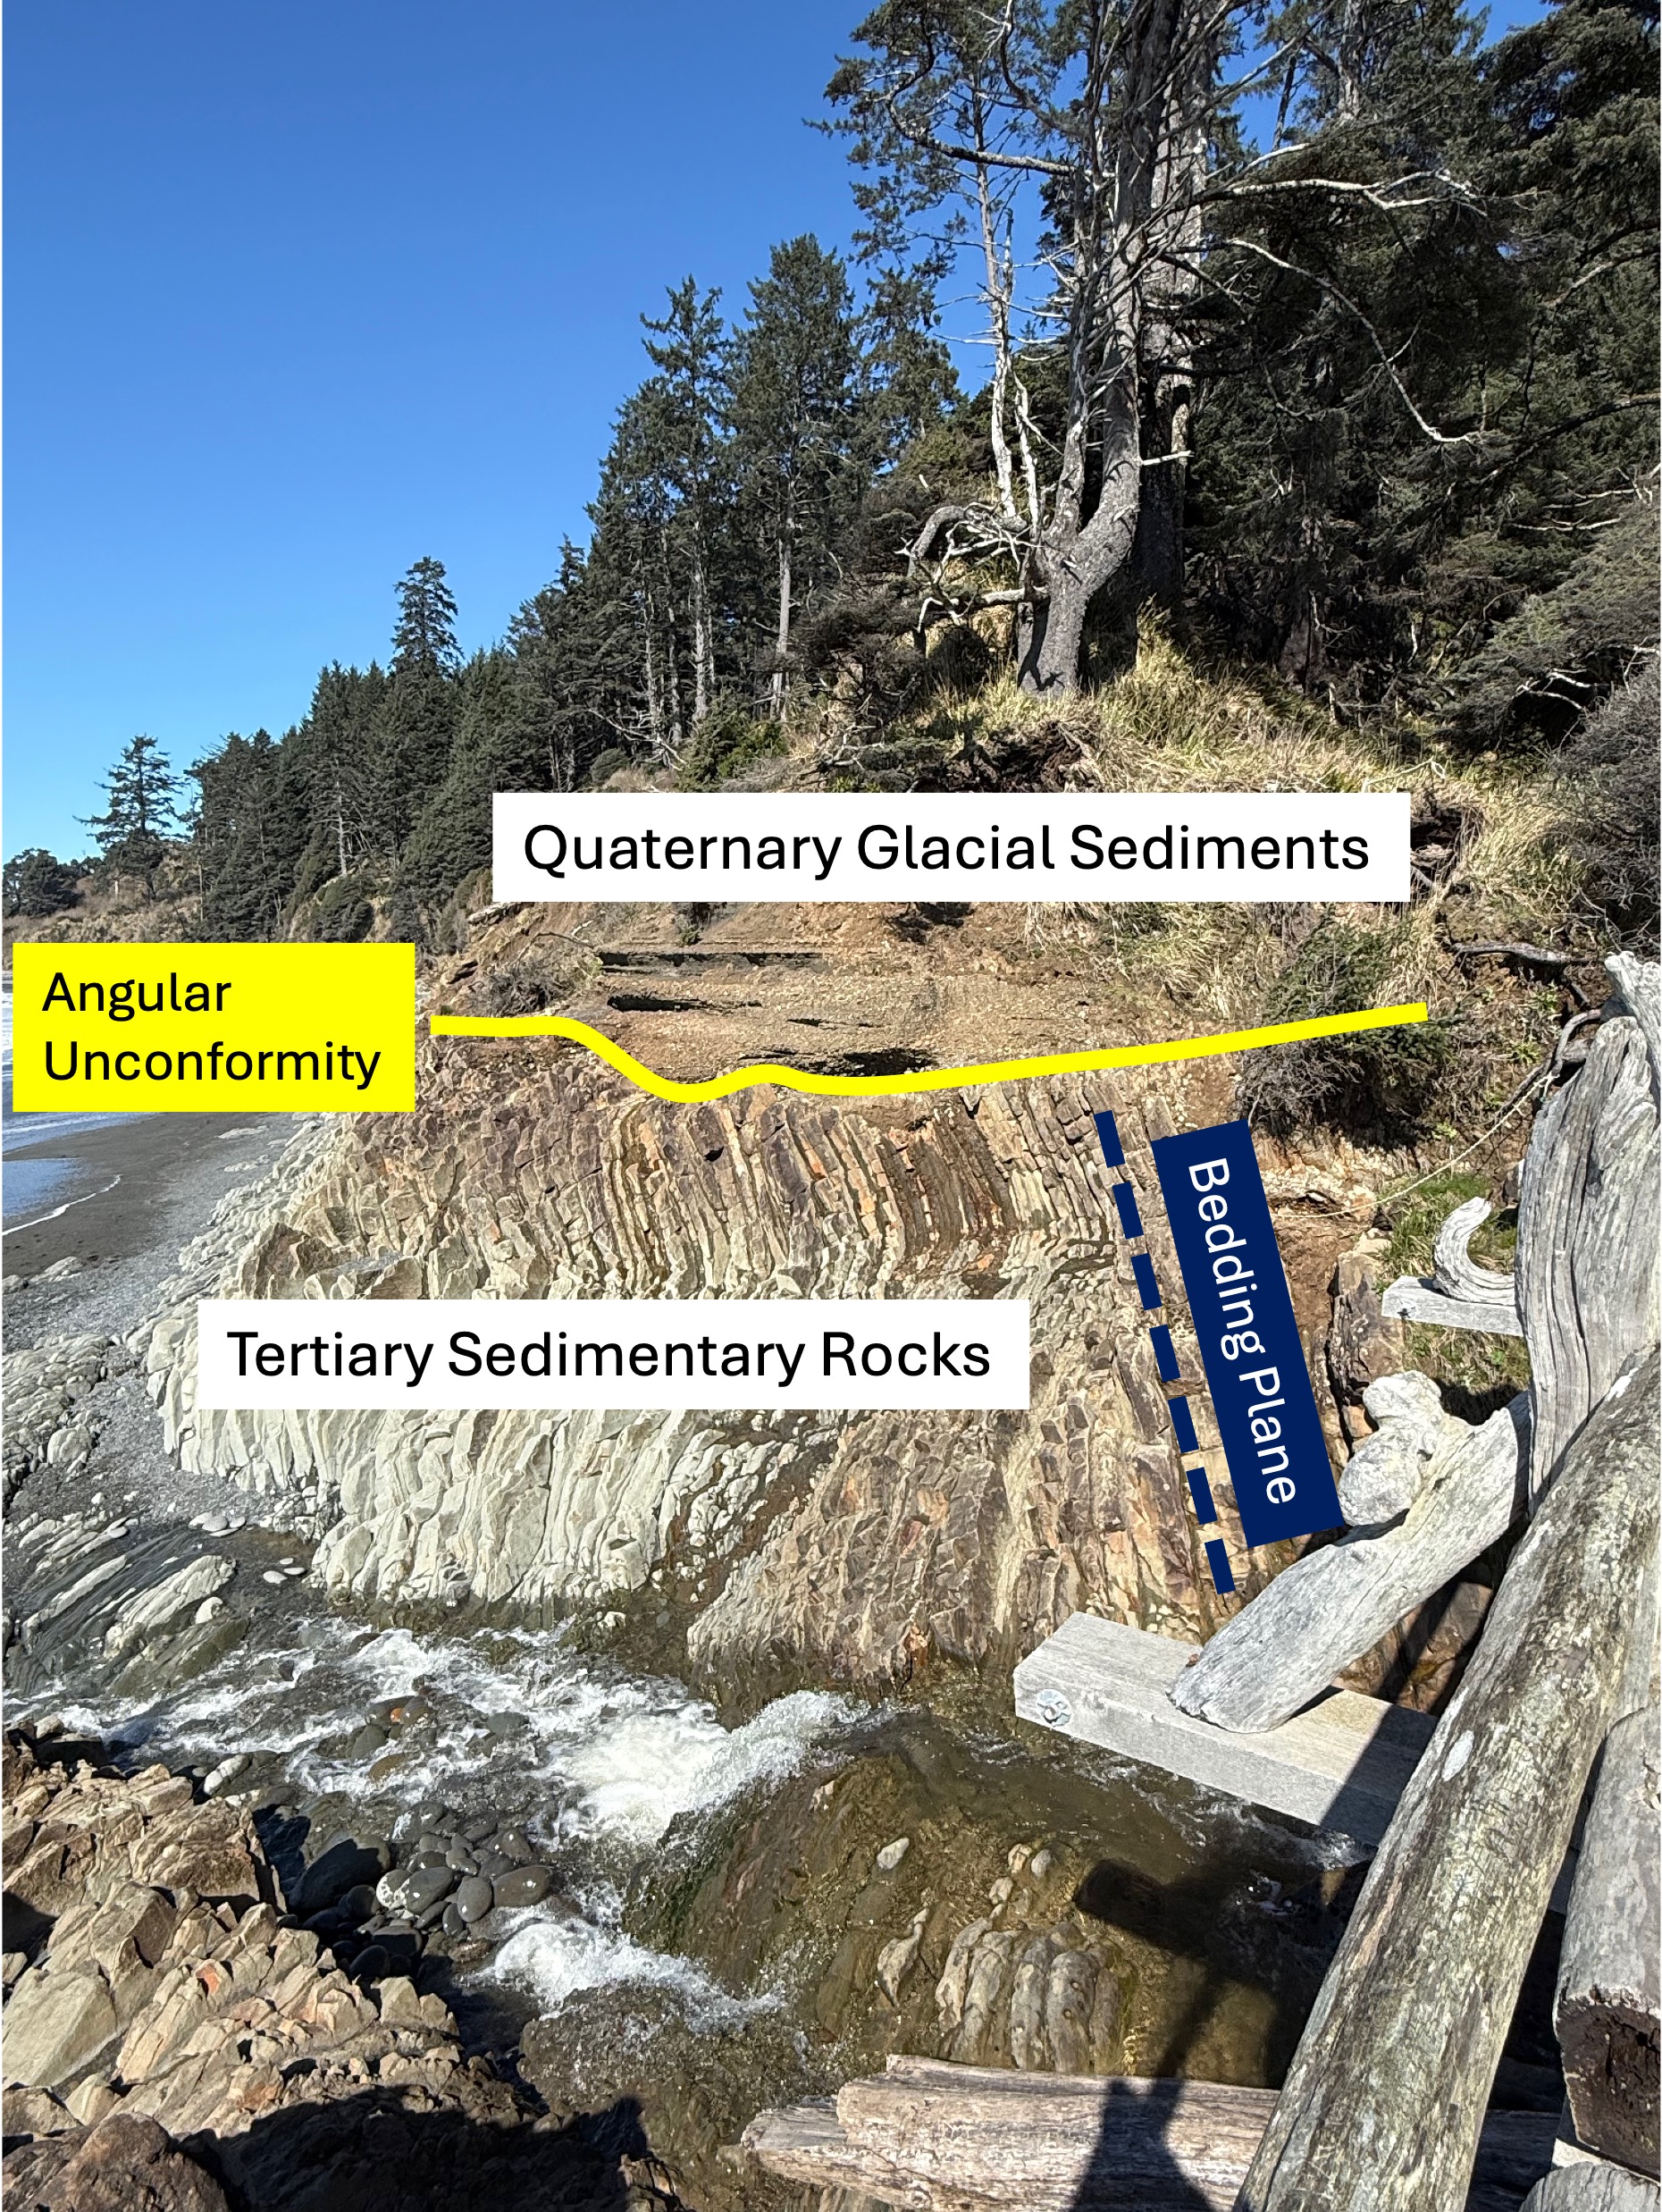
Figure 4. This photo has been marked-up to highlight what might not be obvious to a non-geologist. First, older sedimentary rocks have been tilted to a high angle (dark blue bedding plane line) by faulting, as suggested in Fig. 3, and exposed to erosion at the surface. This erosional surface is shown by the yellow line. These Tertiary sediments were buried several miles beneath the ocean surface where the grains were cemented by heat and pressure. We don’t know exactly when this occurred or how long this process took, but they were later overlain by younger glacial sediments during the Pleistocene epoch (2.4 Ma to present). The age of sedimentary rocks can’t be pinned down unless they contain material datable by radiometric methods or, more qualitatively, by the fossils they contain. Sandy sediments don’t contain fossils very often and I didn’t find any radiometric ages in either Rock D or the USGS geologic map, so I guess the Tertiary date is the best we can do for now.
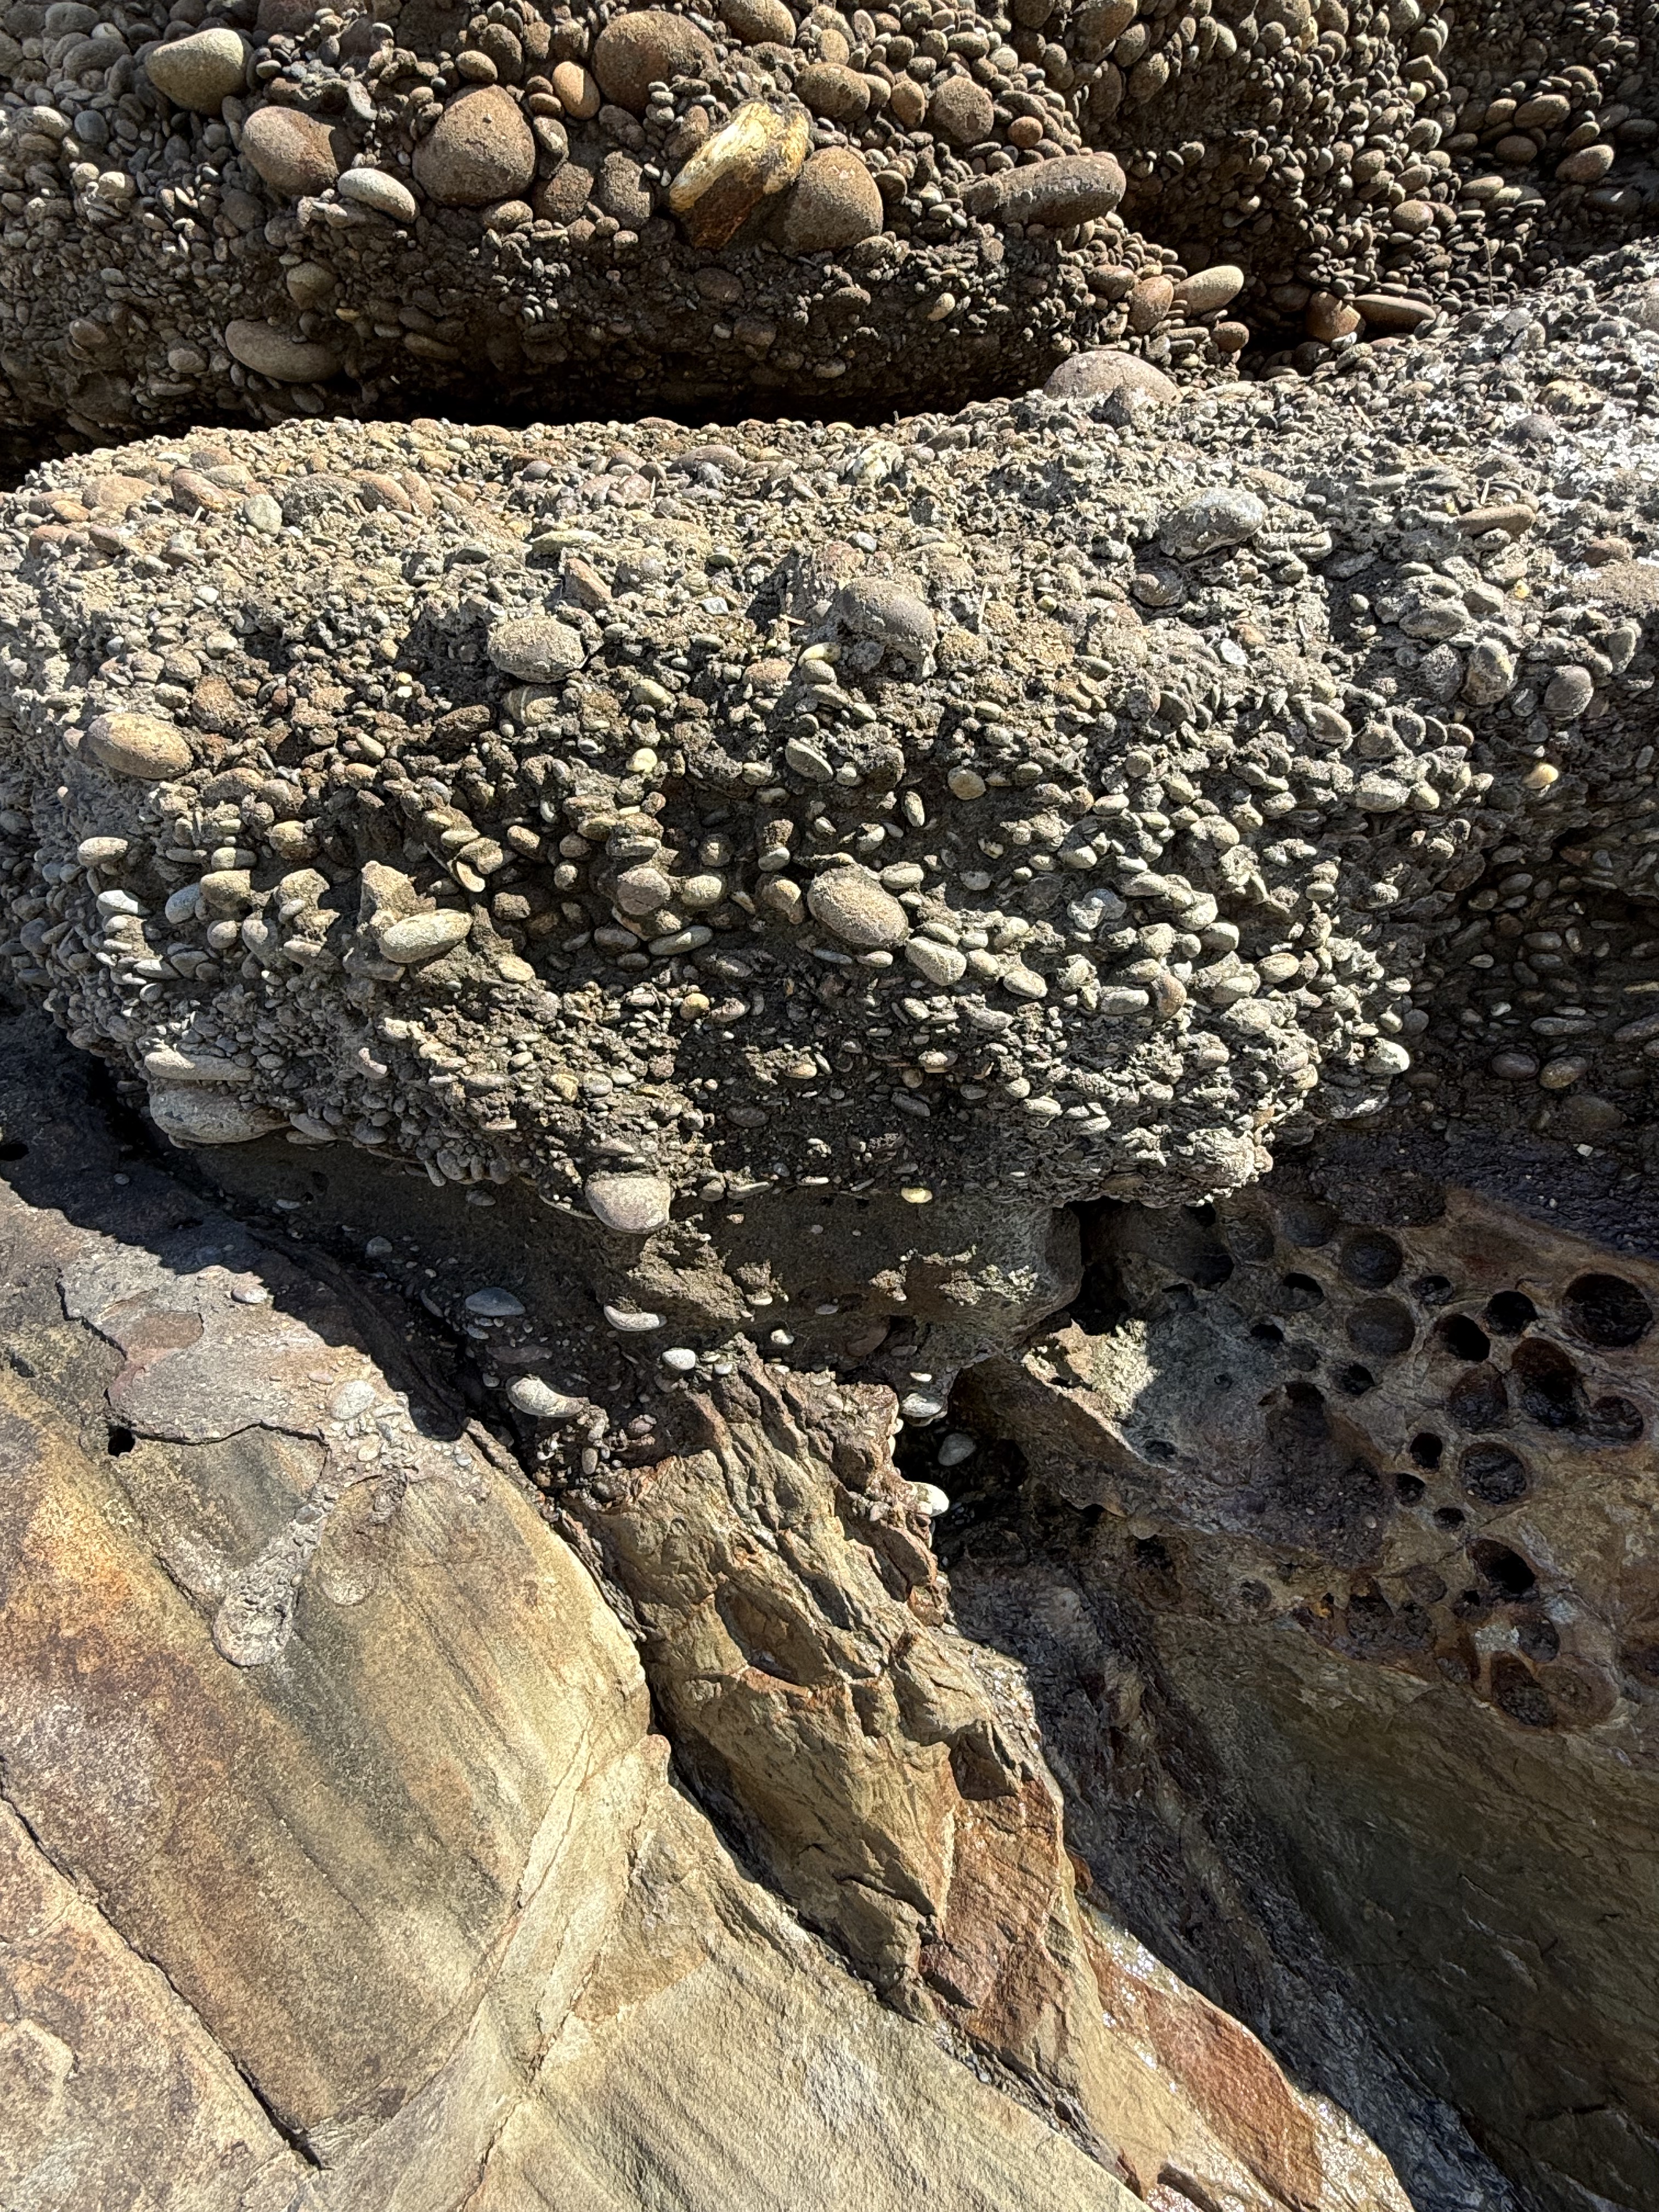
Figure 5. Close-up photo of the contact between the Tertiary rocks and the glacial till. Note that the cobbles aren’t falling out of the fine matrix sand and clay; this is because these young (>2.4 Ma) conglomerates have been partially cemented and, in fact, they were stuck to the older rocks below. This photo tells us a lot: 1) the older rocks were tilted at depth (maybe a mile or more) and then pushed upward as suggested in Fig. 3 until they were exposed to the atmosphere; 2) in a very short time they were covered by cobbles (~2 inches or less) that had already been rounded in a river, which takes several miles of transport; 3) the type of sediment varied rapidly, from coarse sand to cobbles, probably within decades if not years, due in part to periodic changes in surface drainage (e.g. the advance and retreat of glaciers); 4) this is a good example of the principle of Uniformitarianism–the present is the key to the past: we see similar processes occurring today along the many streams and rivers draining the Olympic Mountains. But what about those pesky Tertiary sandstones?
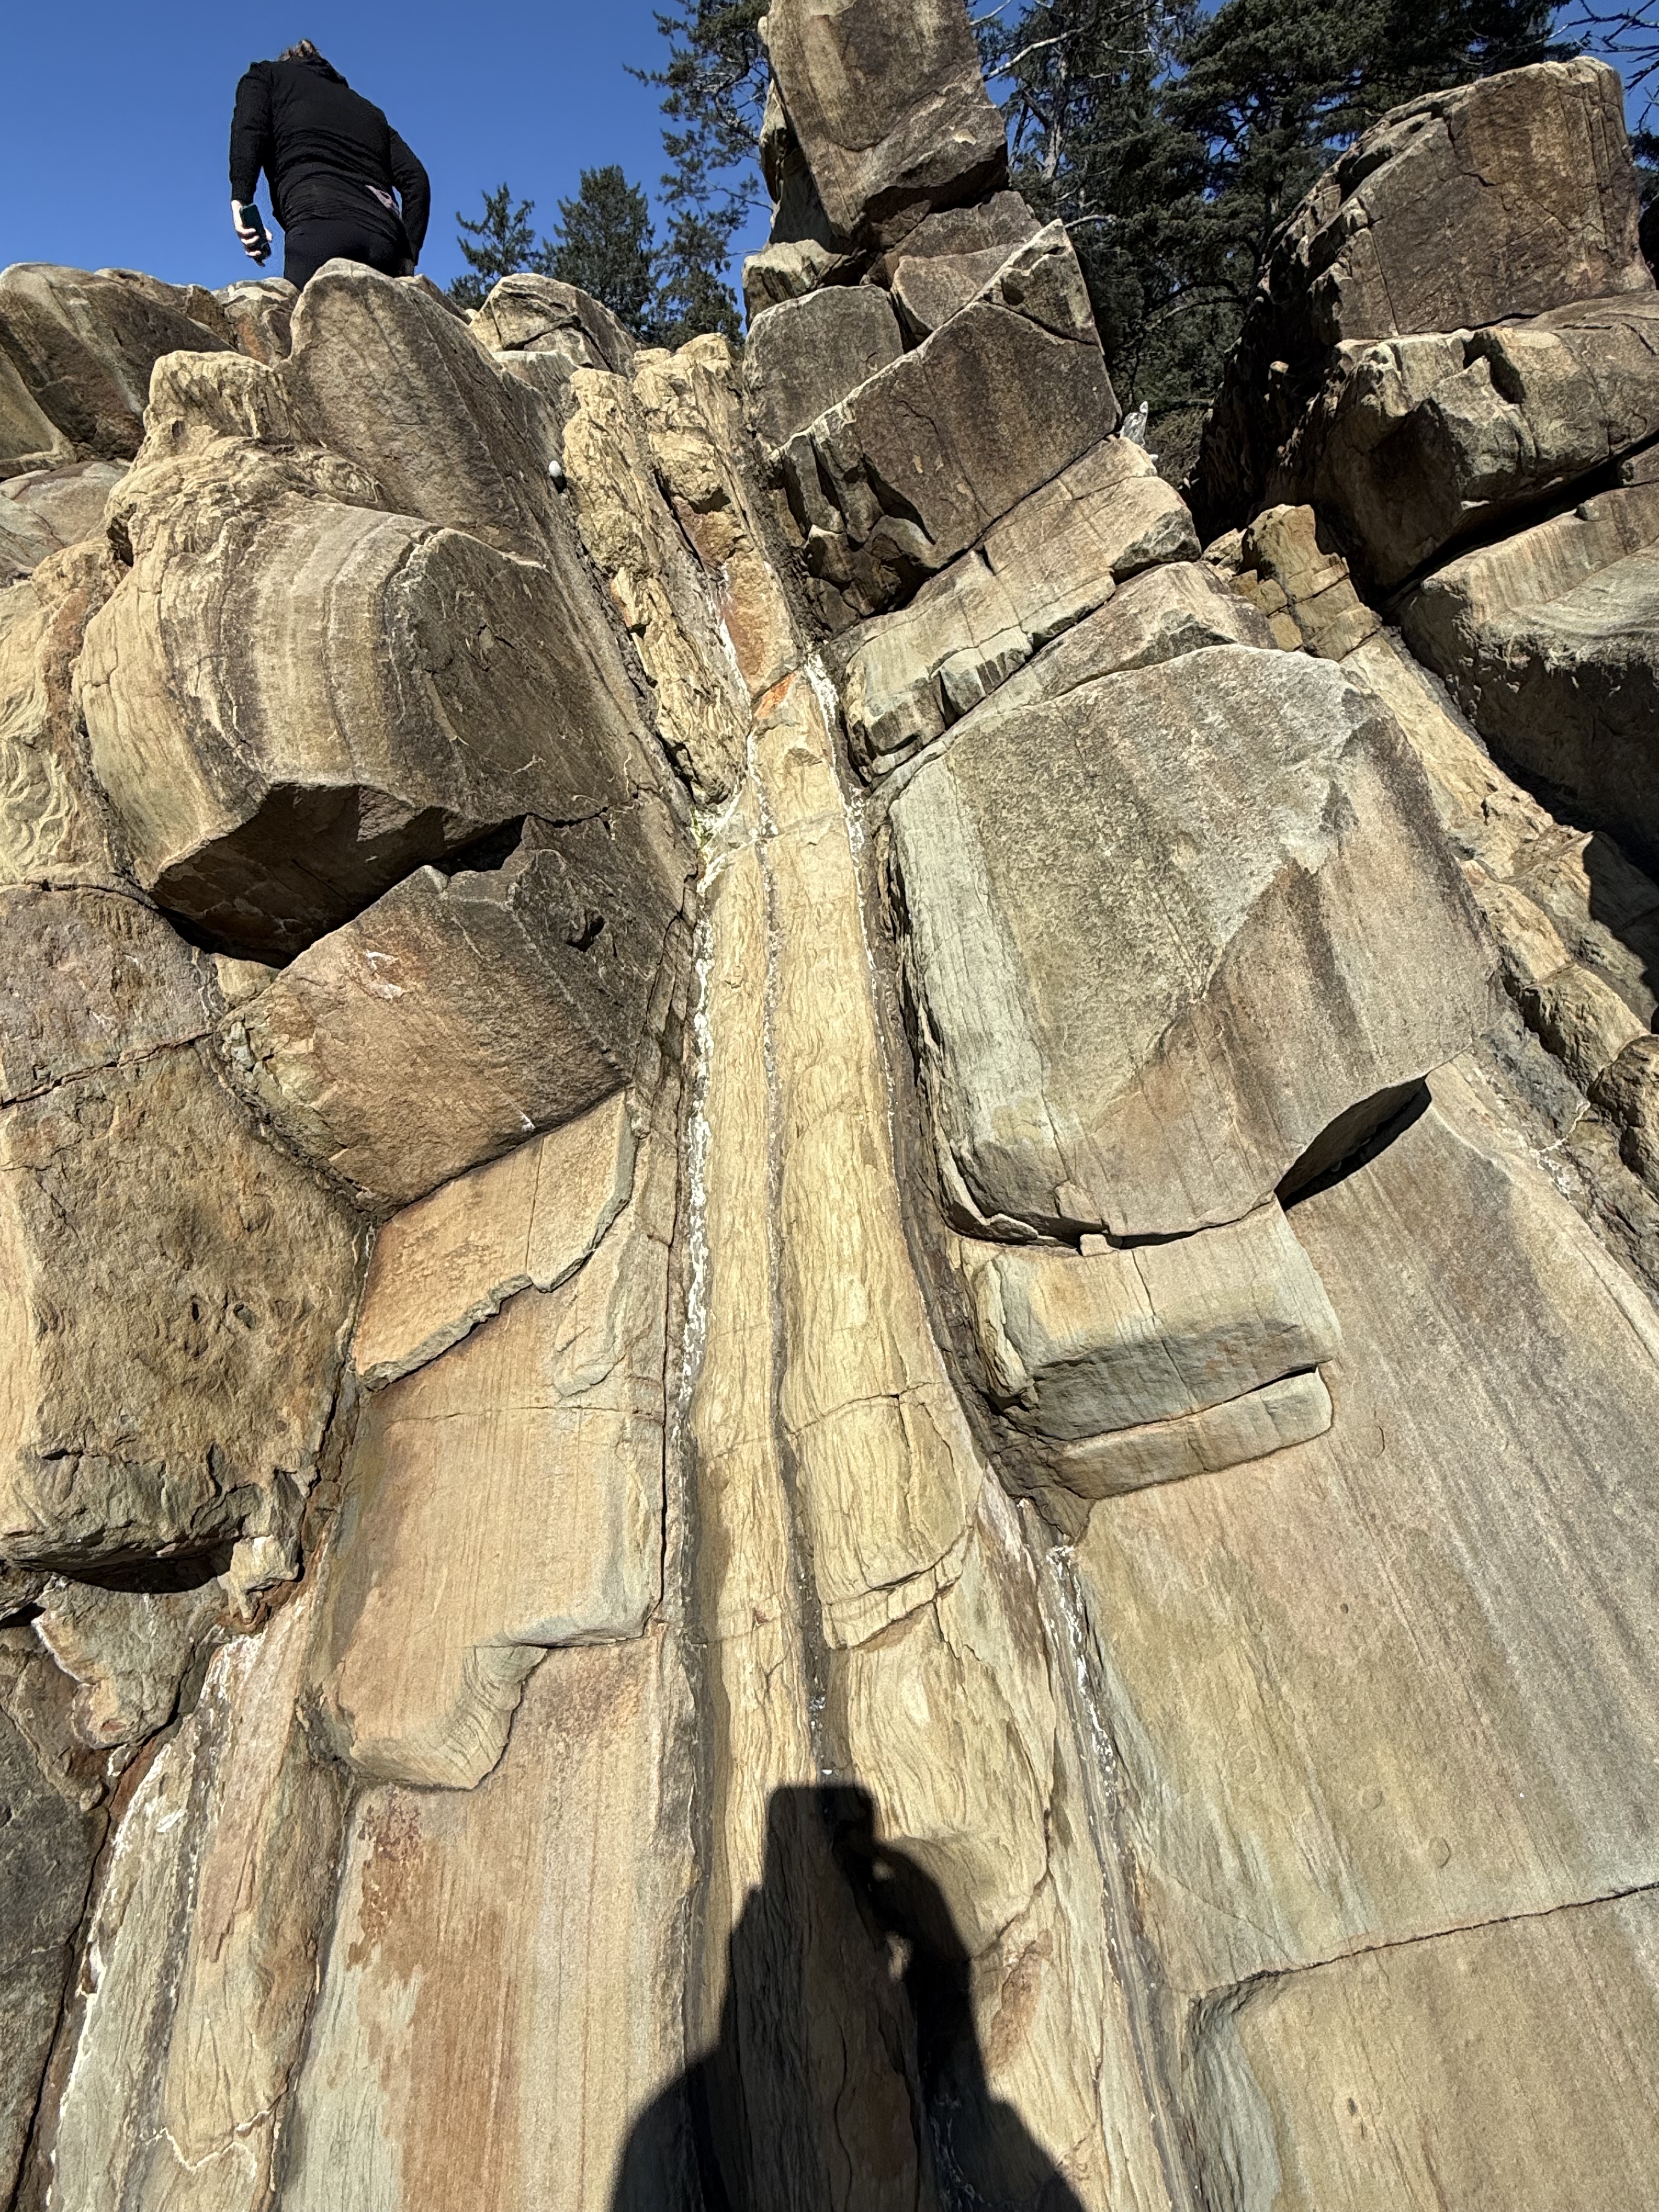
Figure 6. This photo of the Tertiary sedimentary rocks reveals packets of thin-bedded fine sandstone with intercalated dark layers of (presumably) mud. I didn’t see any cross-bedding, which would indicate deposition in a river or nearshore dominated by waves or currents. What is obvious that this ancient (~50-2 Ma) shoreline was receiving sediment from a distant source, probably the volcanic highlands of the modern Cascades (see Fig. 3). Let’s take a closer look at one of those wavy layers.
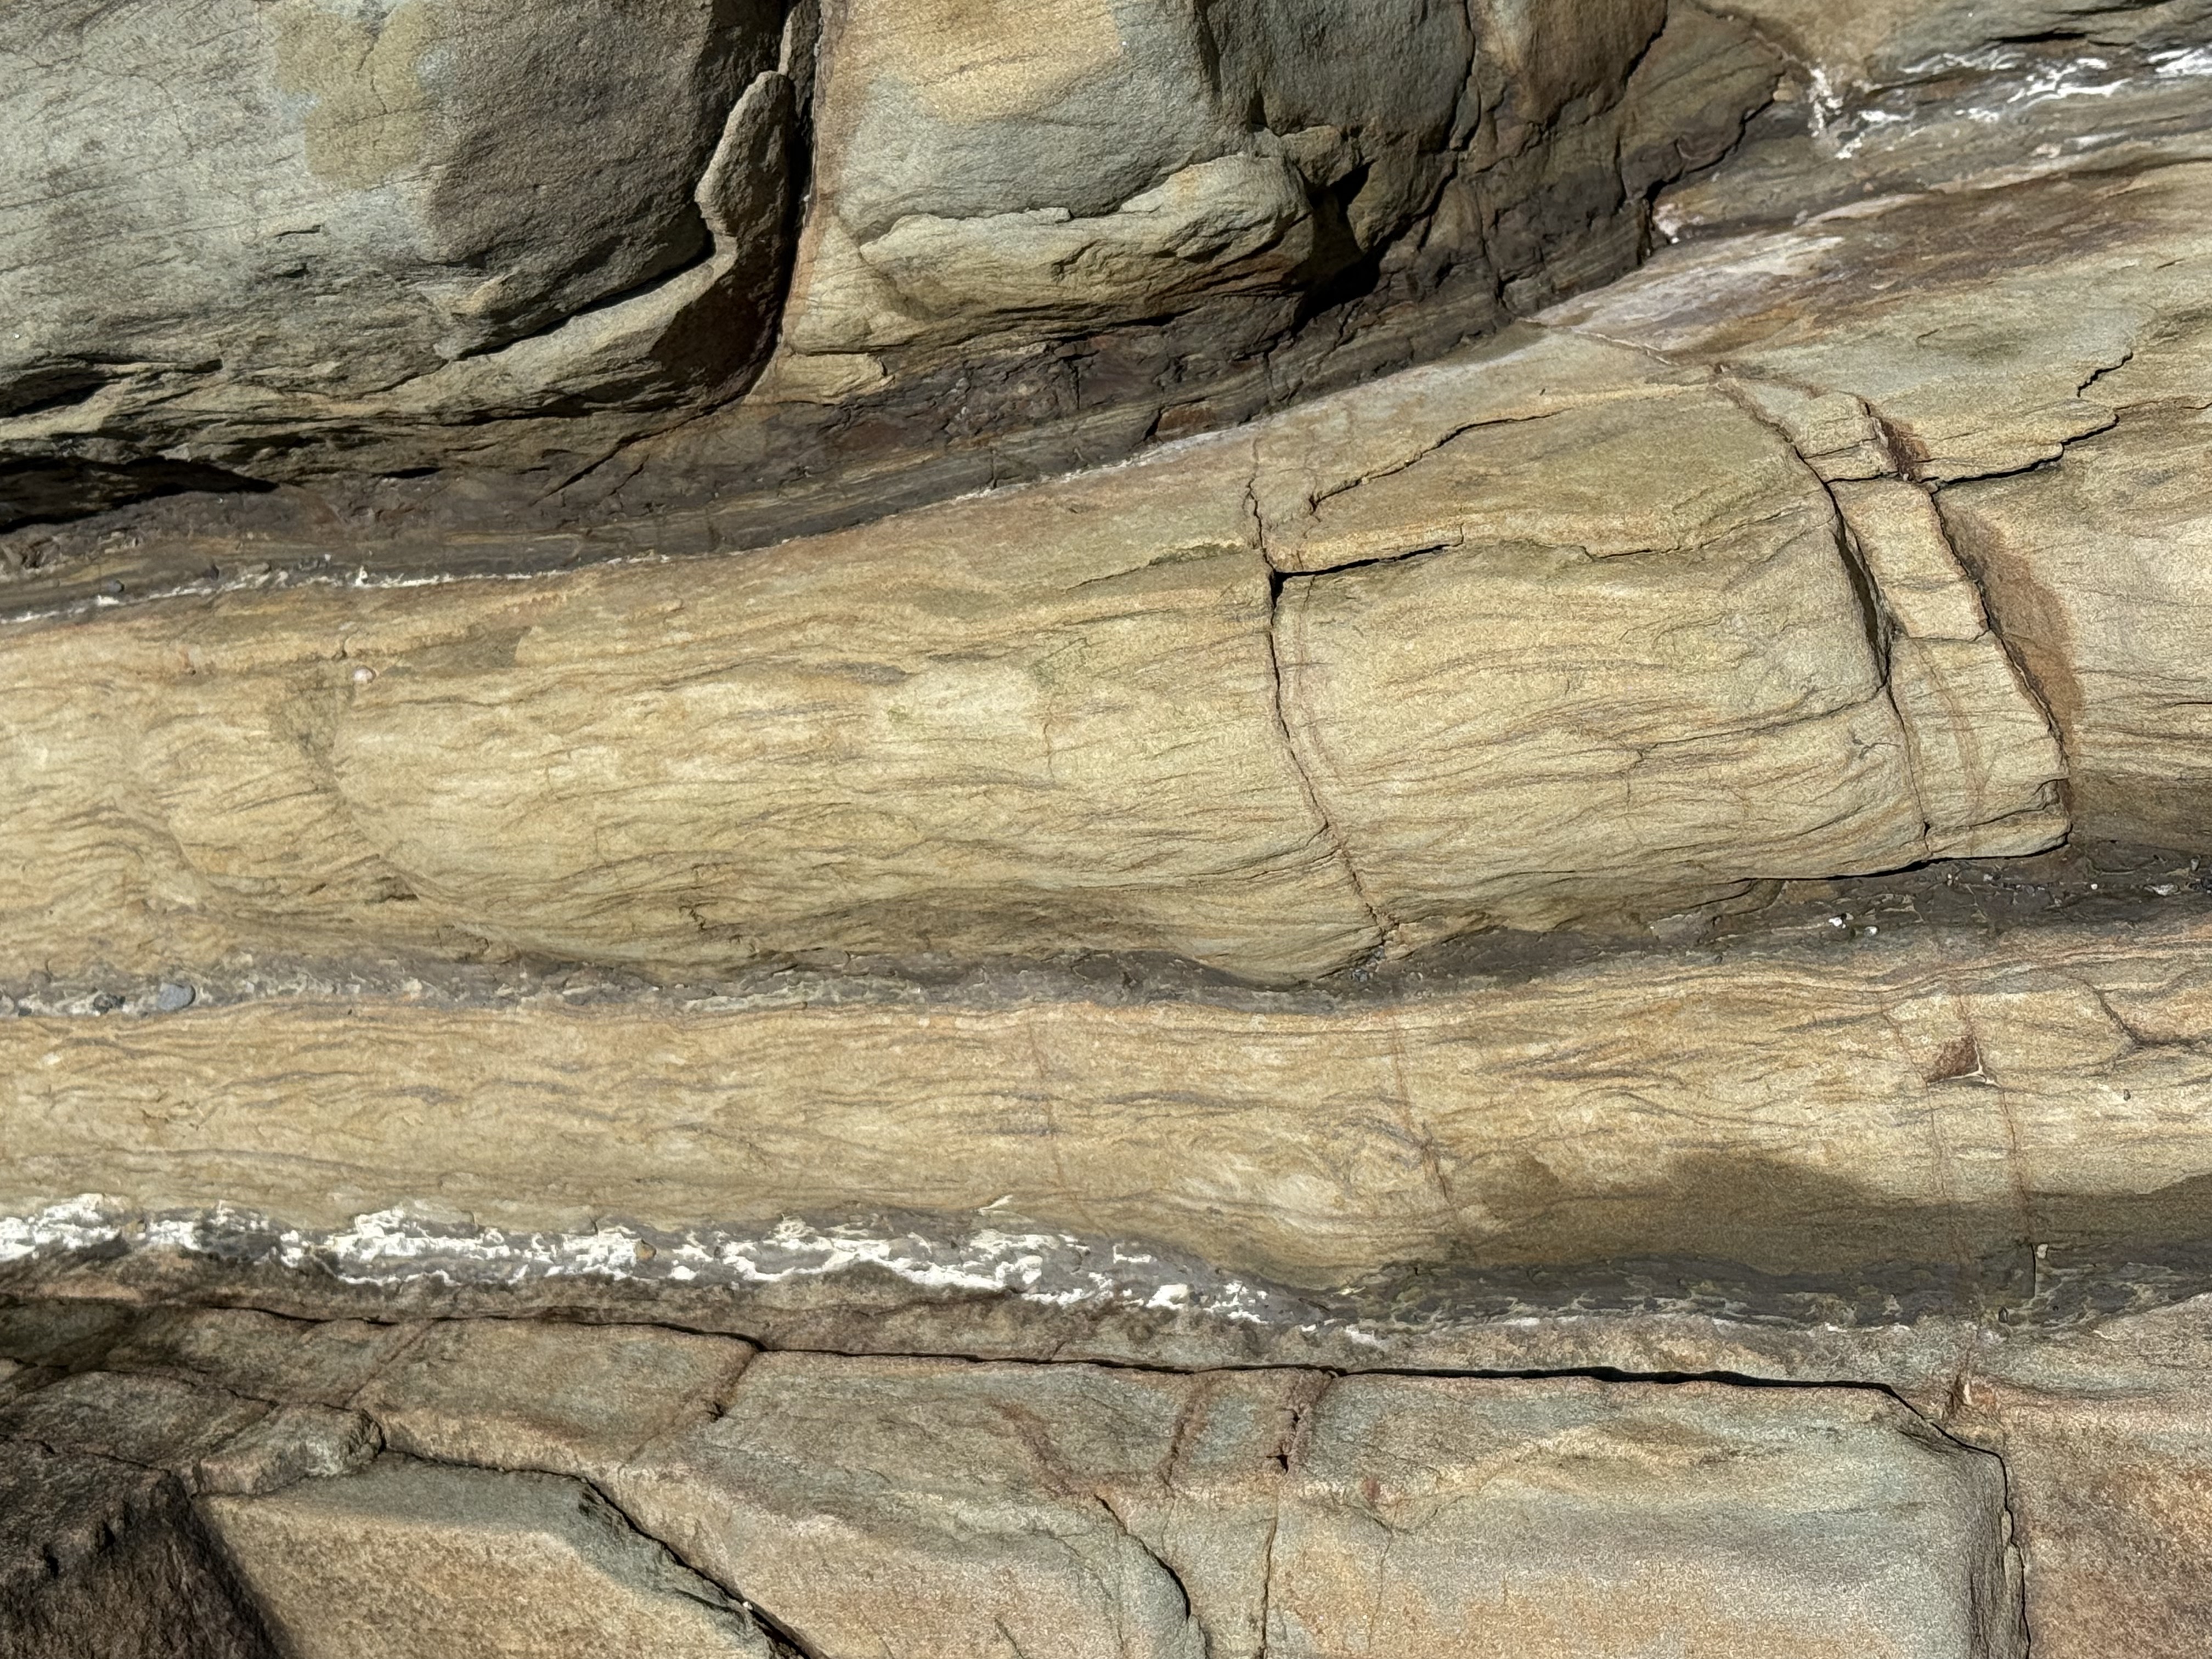
Figure 7. Close-up image of a thin layer (about 3 inches), showing what is called Flasier bedding. This is found in modern environments where high-energy (e.g. waves and tides) periods are interrupted by quiet times during which fine sediment can be deposited between ripples. It is indicative of a shallow marine environment.
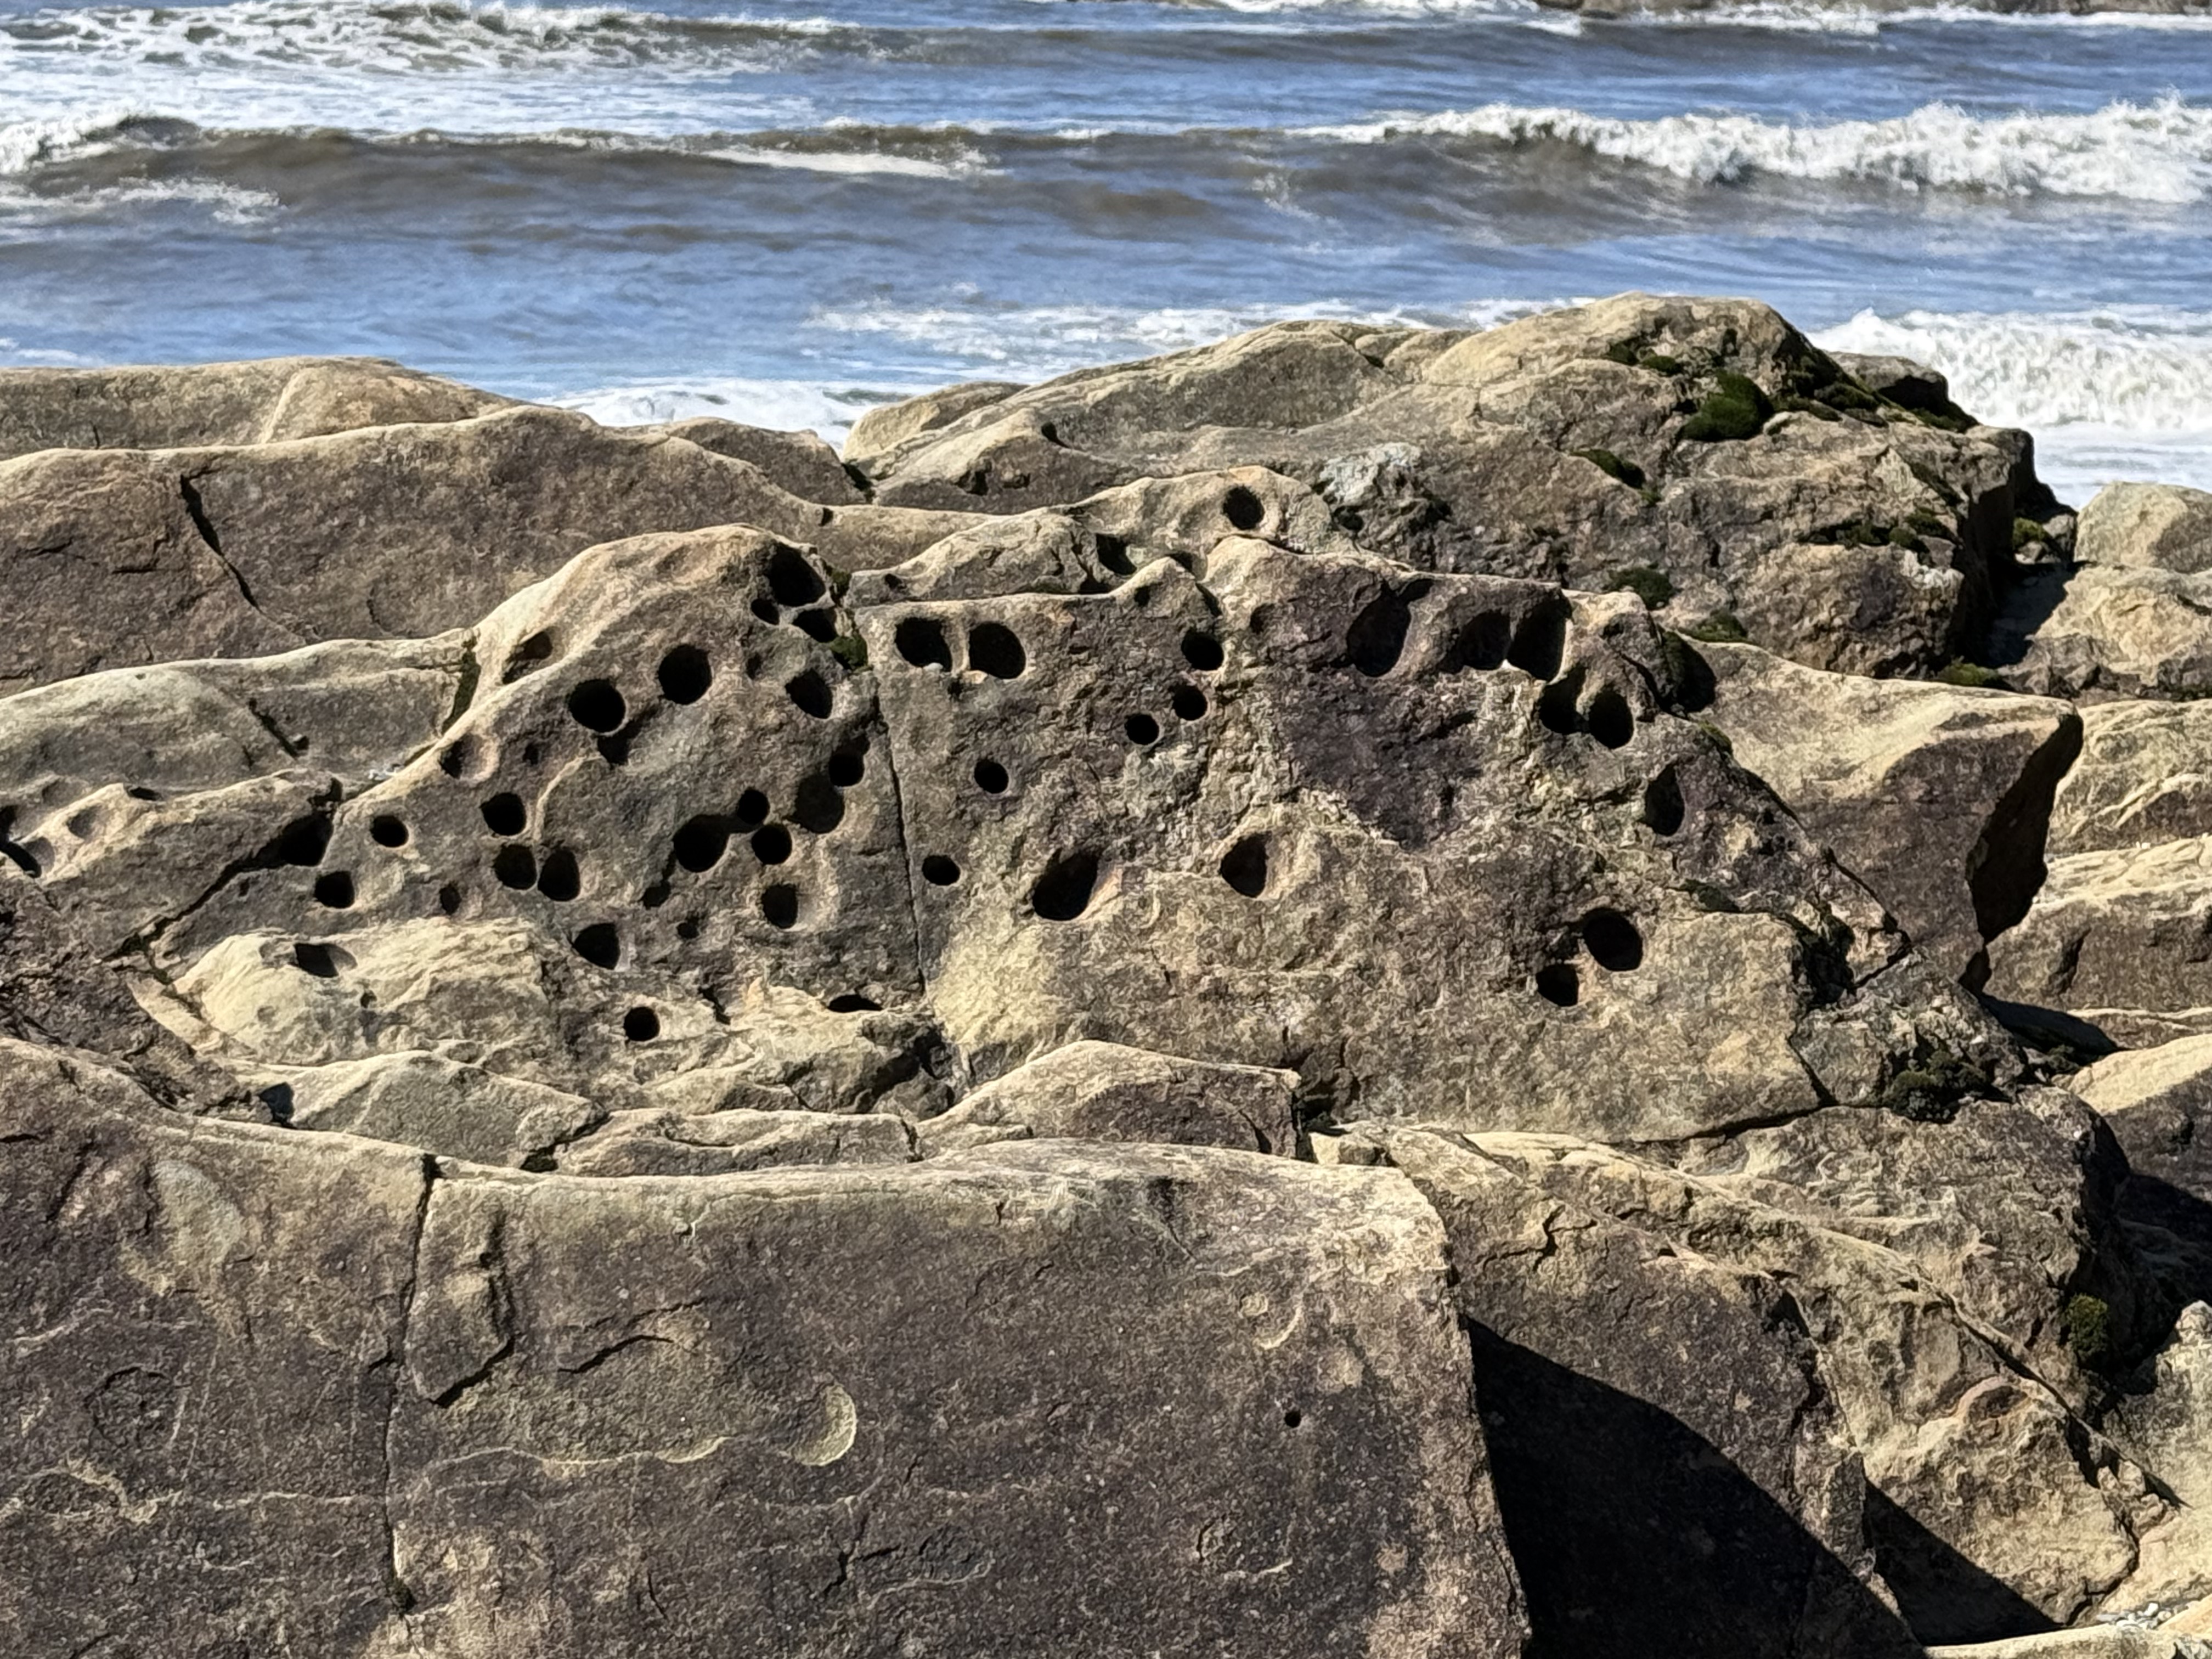
Figure 8. These holes were evident throughout the exposure. They are problematic and probably originated in several ways; however, one plausible explanation is that soft-bodied animals like worms burrowed in the sediments and their burrows filled with sediment with a different composition (e.g. fecal pellets). These channels then preferentially eroded when subjected to the harsh nearshore environment in which they are found. The presence of such holes at the unconformity (see Fig. 5) proves that they predate deposition of the overlying glacial till. Unfortunately, such trace fossils don’t tell us anything about geologic age, only that this seashore was teeming with life.
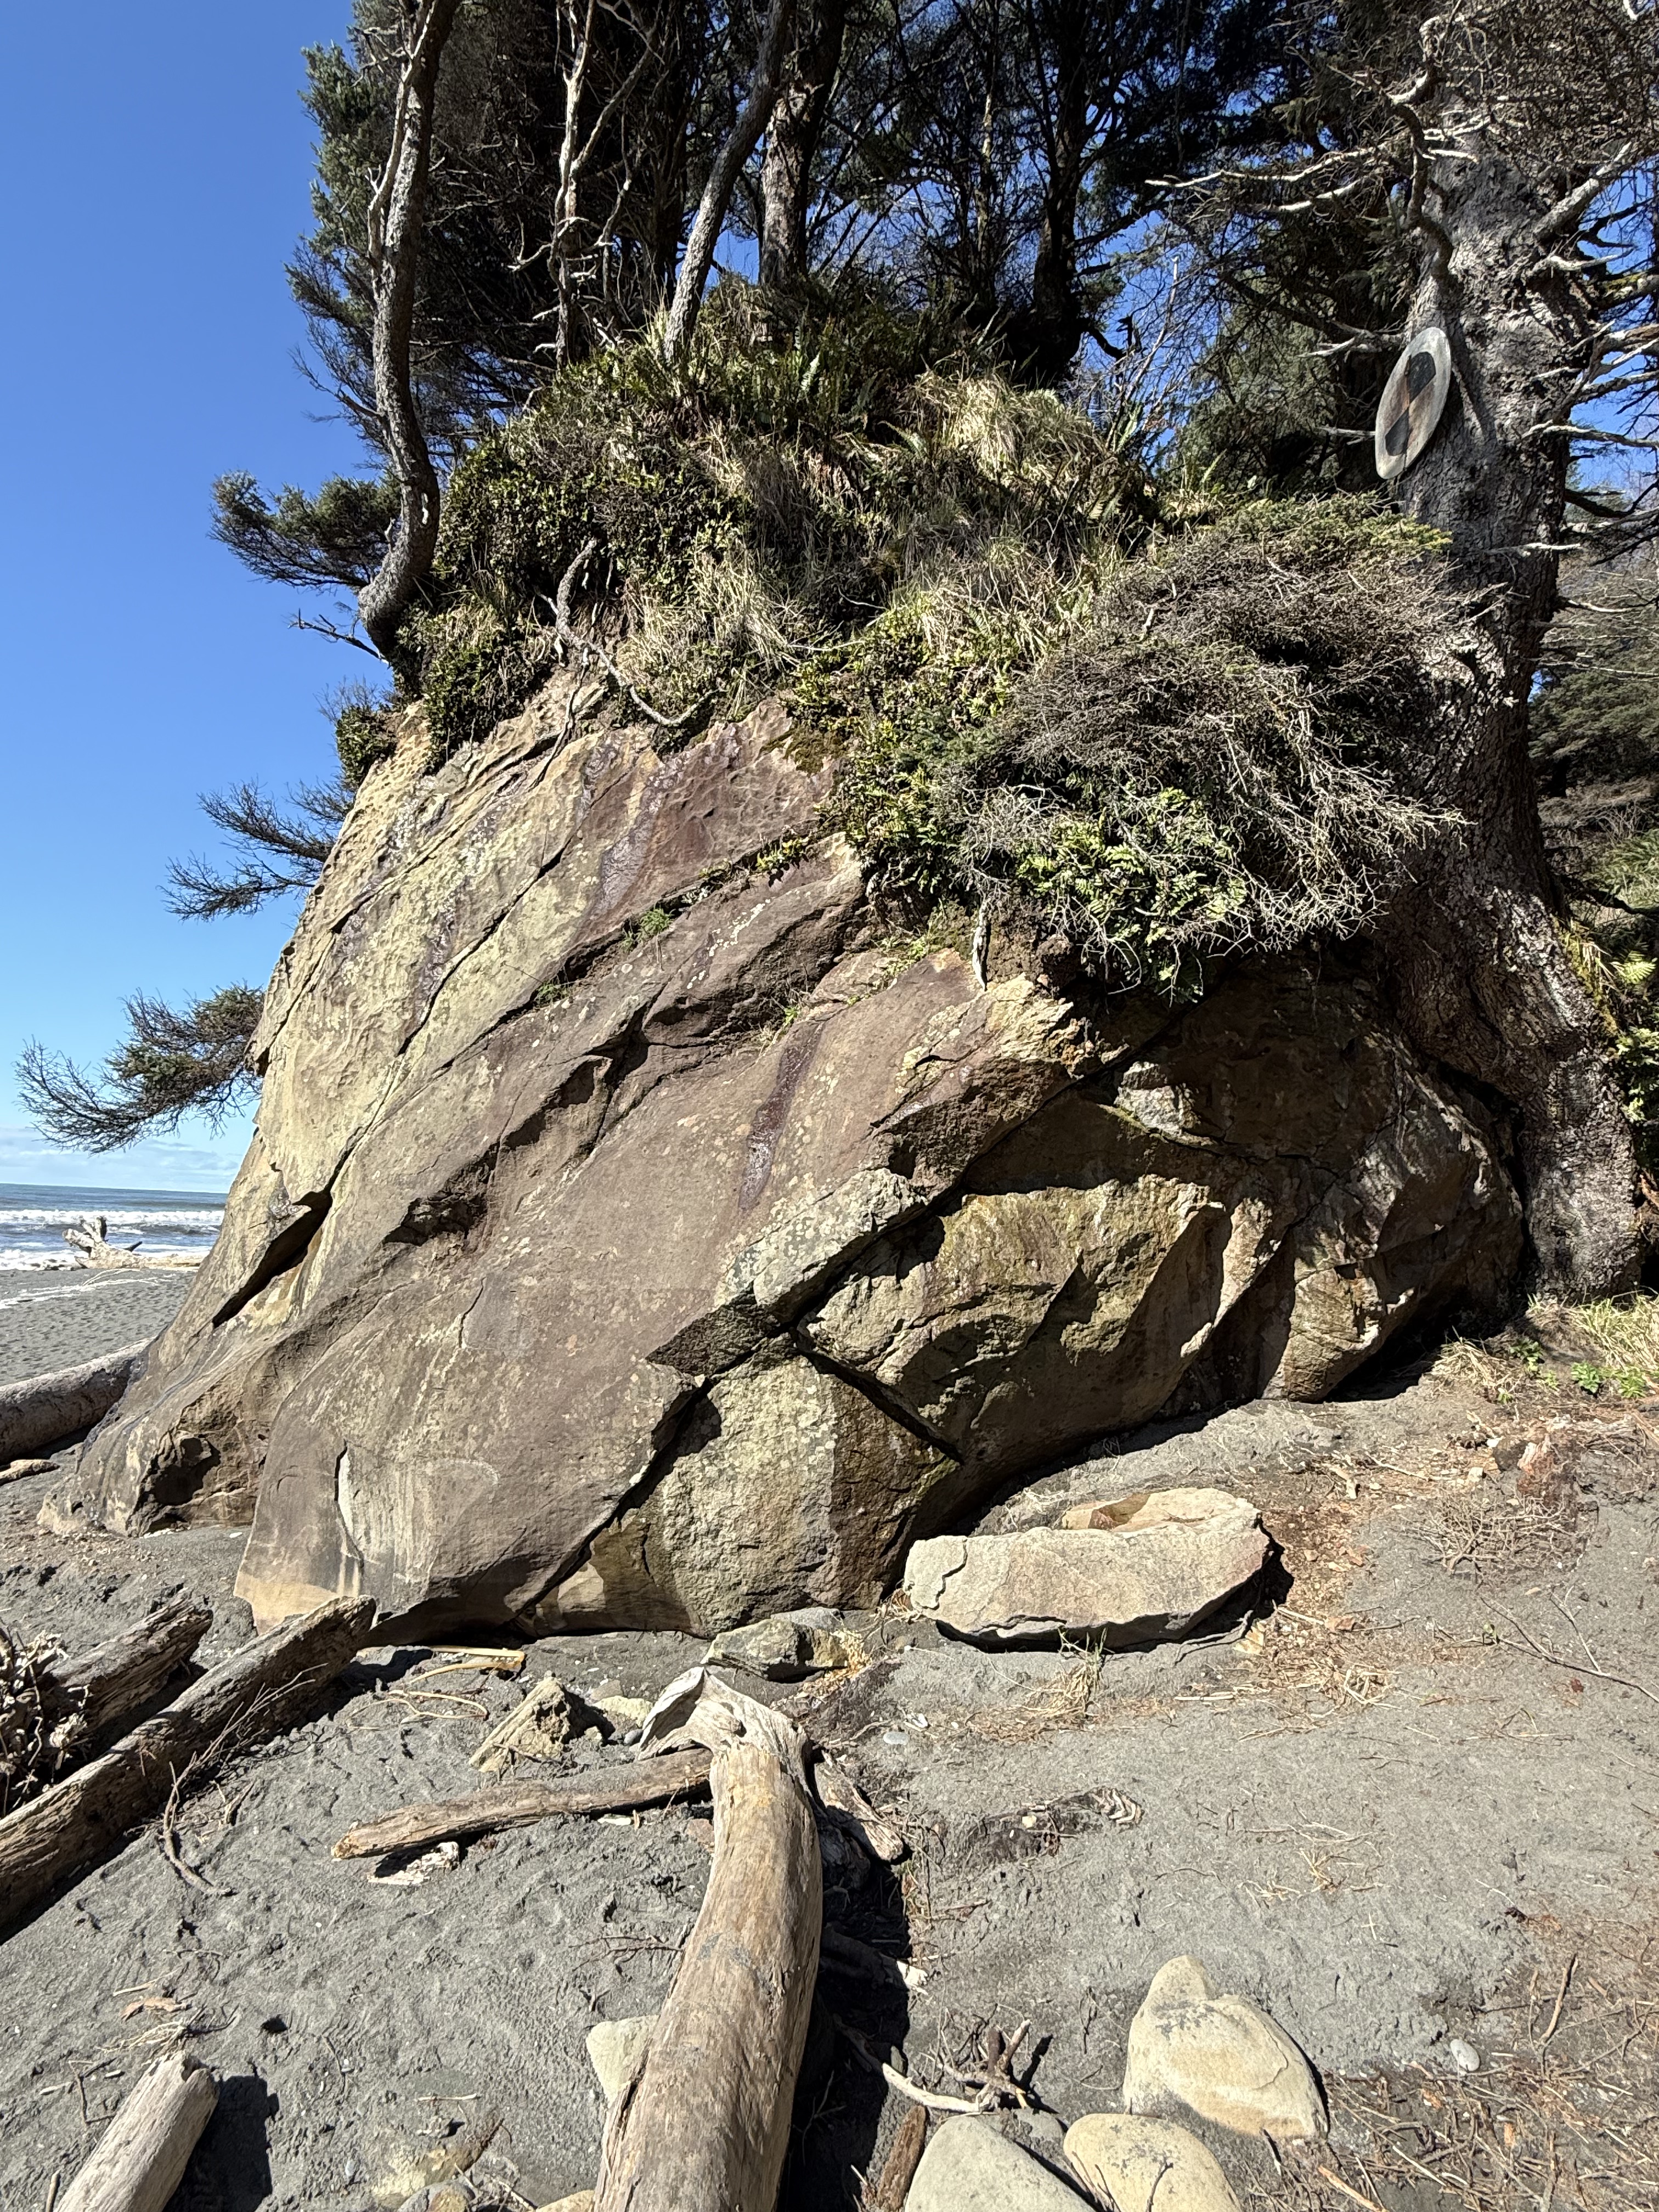
Figure 9. I stopped at another accessible beach a couple of miles south, but still indicated as Site B in Fig. 2, where the rocks were sandstone but with very little clay. The beds seen in this photo were thick (1-3 feet). They were not deposited in a high-energy, environment like those we saw before; they were probably deposited on the shoreface below fair-weather wave base–possibly part of a nearshore bar or barrier island. After deposition and burial, they were tilted less steeply than those seen further north (Fig. 6). The unconformity is seen in the upper part of this image, but it doesn’t seem to have as many rounded cobbles as before (Fig. 5). I have no way of knowing the relative age of these two exposures; this Tertiary rock unit is approximately 3000 feet thick and represents millions of years. All we can say for certain is that this shoreline wasn’t that different from what we observe today. Uniformitarianism in action.
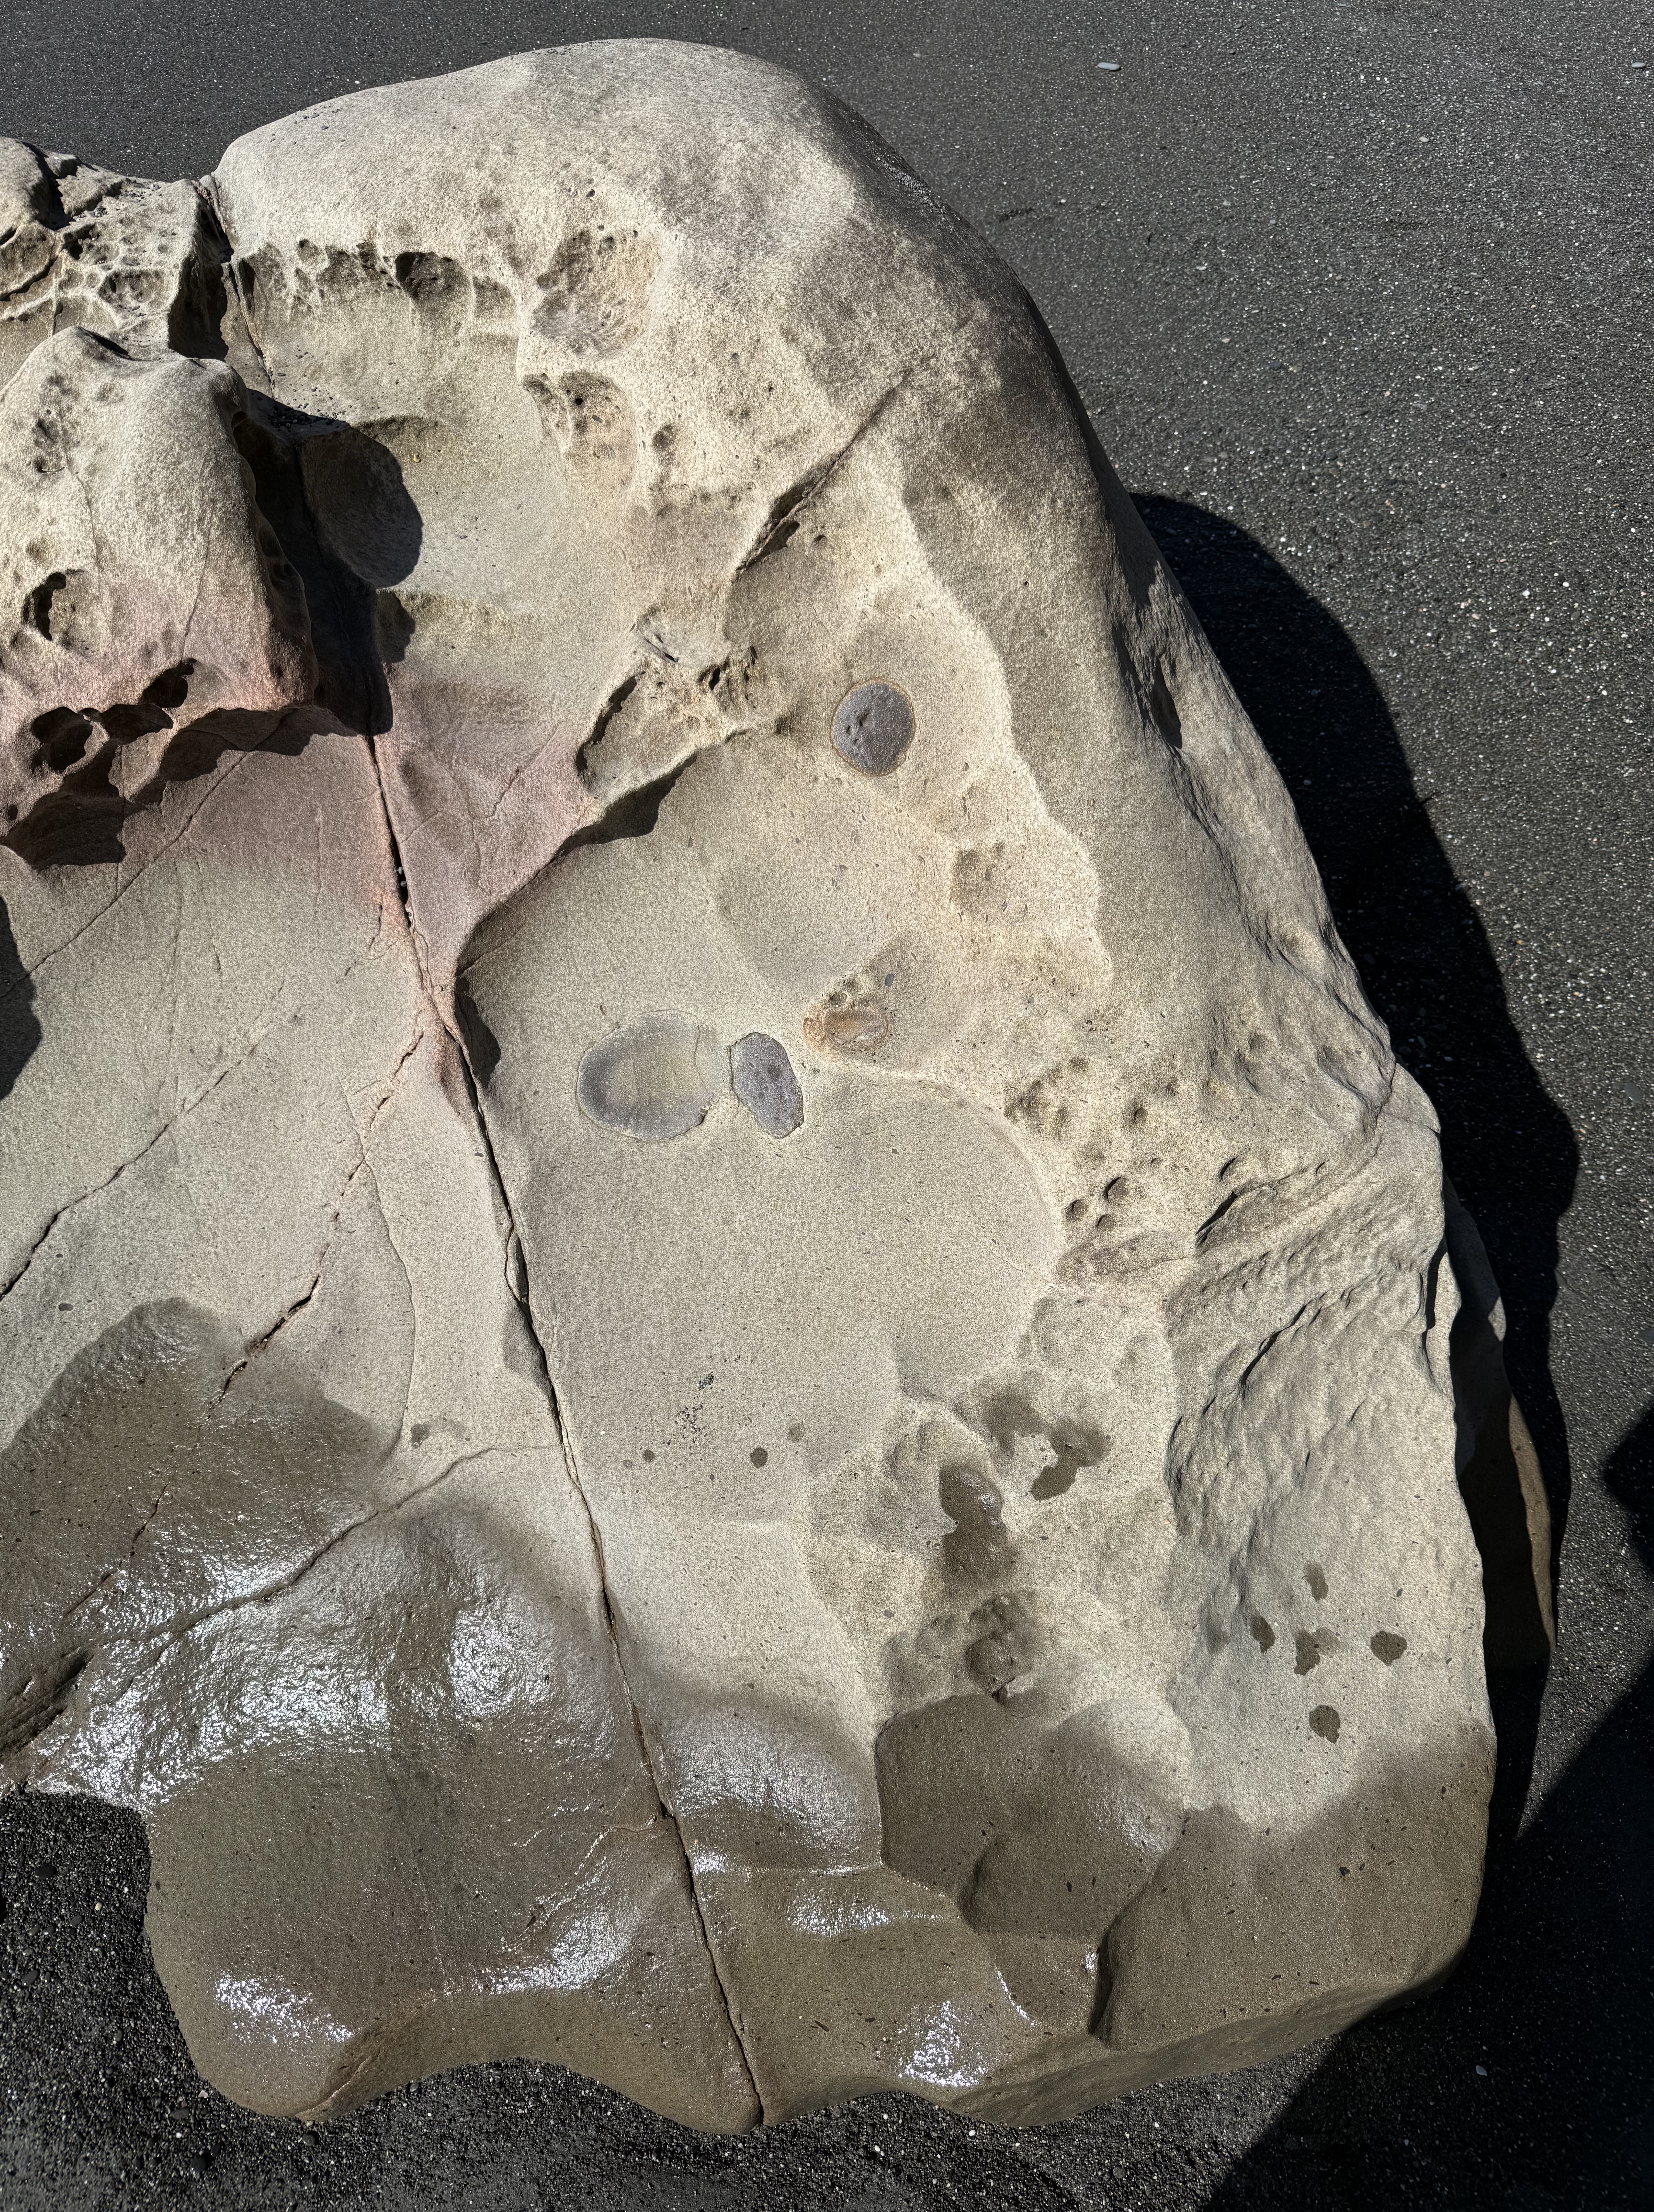
Figure 10. This exposed outcrop within the tidal zone reveals what are probably concretions of iron oxides, formed during early diagenesis. They superficially resemble fossils, but that is not the case. As the sediment was squeezed during burial, incompatible elements like iron formed irregular blobs in an otherwise uniform quartz sand matrix.
Summary
This coastline was part of the Cascadia subduction zone during most of the Tertiary period. Sediment, including a lot of sand, was eroded from rocks being uplifted further inland where volcanism was active, especially during the Eocene (55-35 Ma). Beaches like those we see toady were common, as well as the various depositional environments found along the Olympic peninsula, including fluvial and submarine fans, beaches, and cliffs. But no glacial sediment.
These sediments were buried as more material was removed from the rising orogenic belt, which included granitic rocks with lots of quartz. Eventually they were caught by the complex trench uplift (see Fig. 3) and scraped onto the edge of N. America. This involved faulting primarily, suggesting this was a fairly shallow process (folds occur at depth where rocks are ductile). The tilted rocks were eroded for millions of years; then, about 2.4 Ma glaciers (nothing to do with subduction) covered the region and deposited all kind of sediment: rivers, lakes, undifferentiated till, moraines, etc.
Just as the East Coast of America has been a passive margin for more than 200 my, the West Coast has been a convergent margin. Instead of being steadily worn away by wind and water, these rocks are rising out of the sea at about 2 inches per year. And what a ride it is…
Coast to Coast
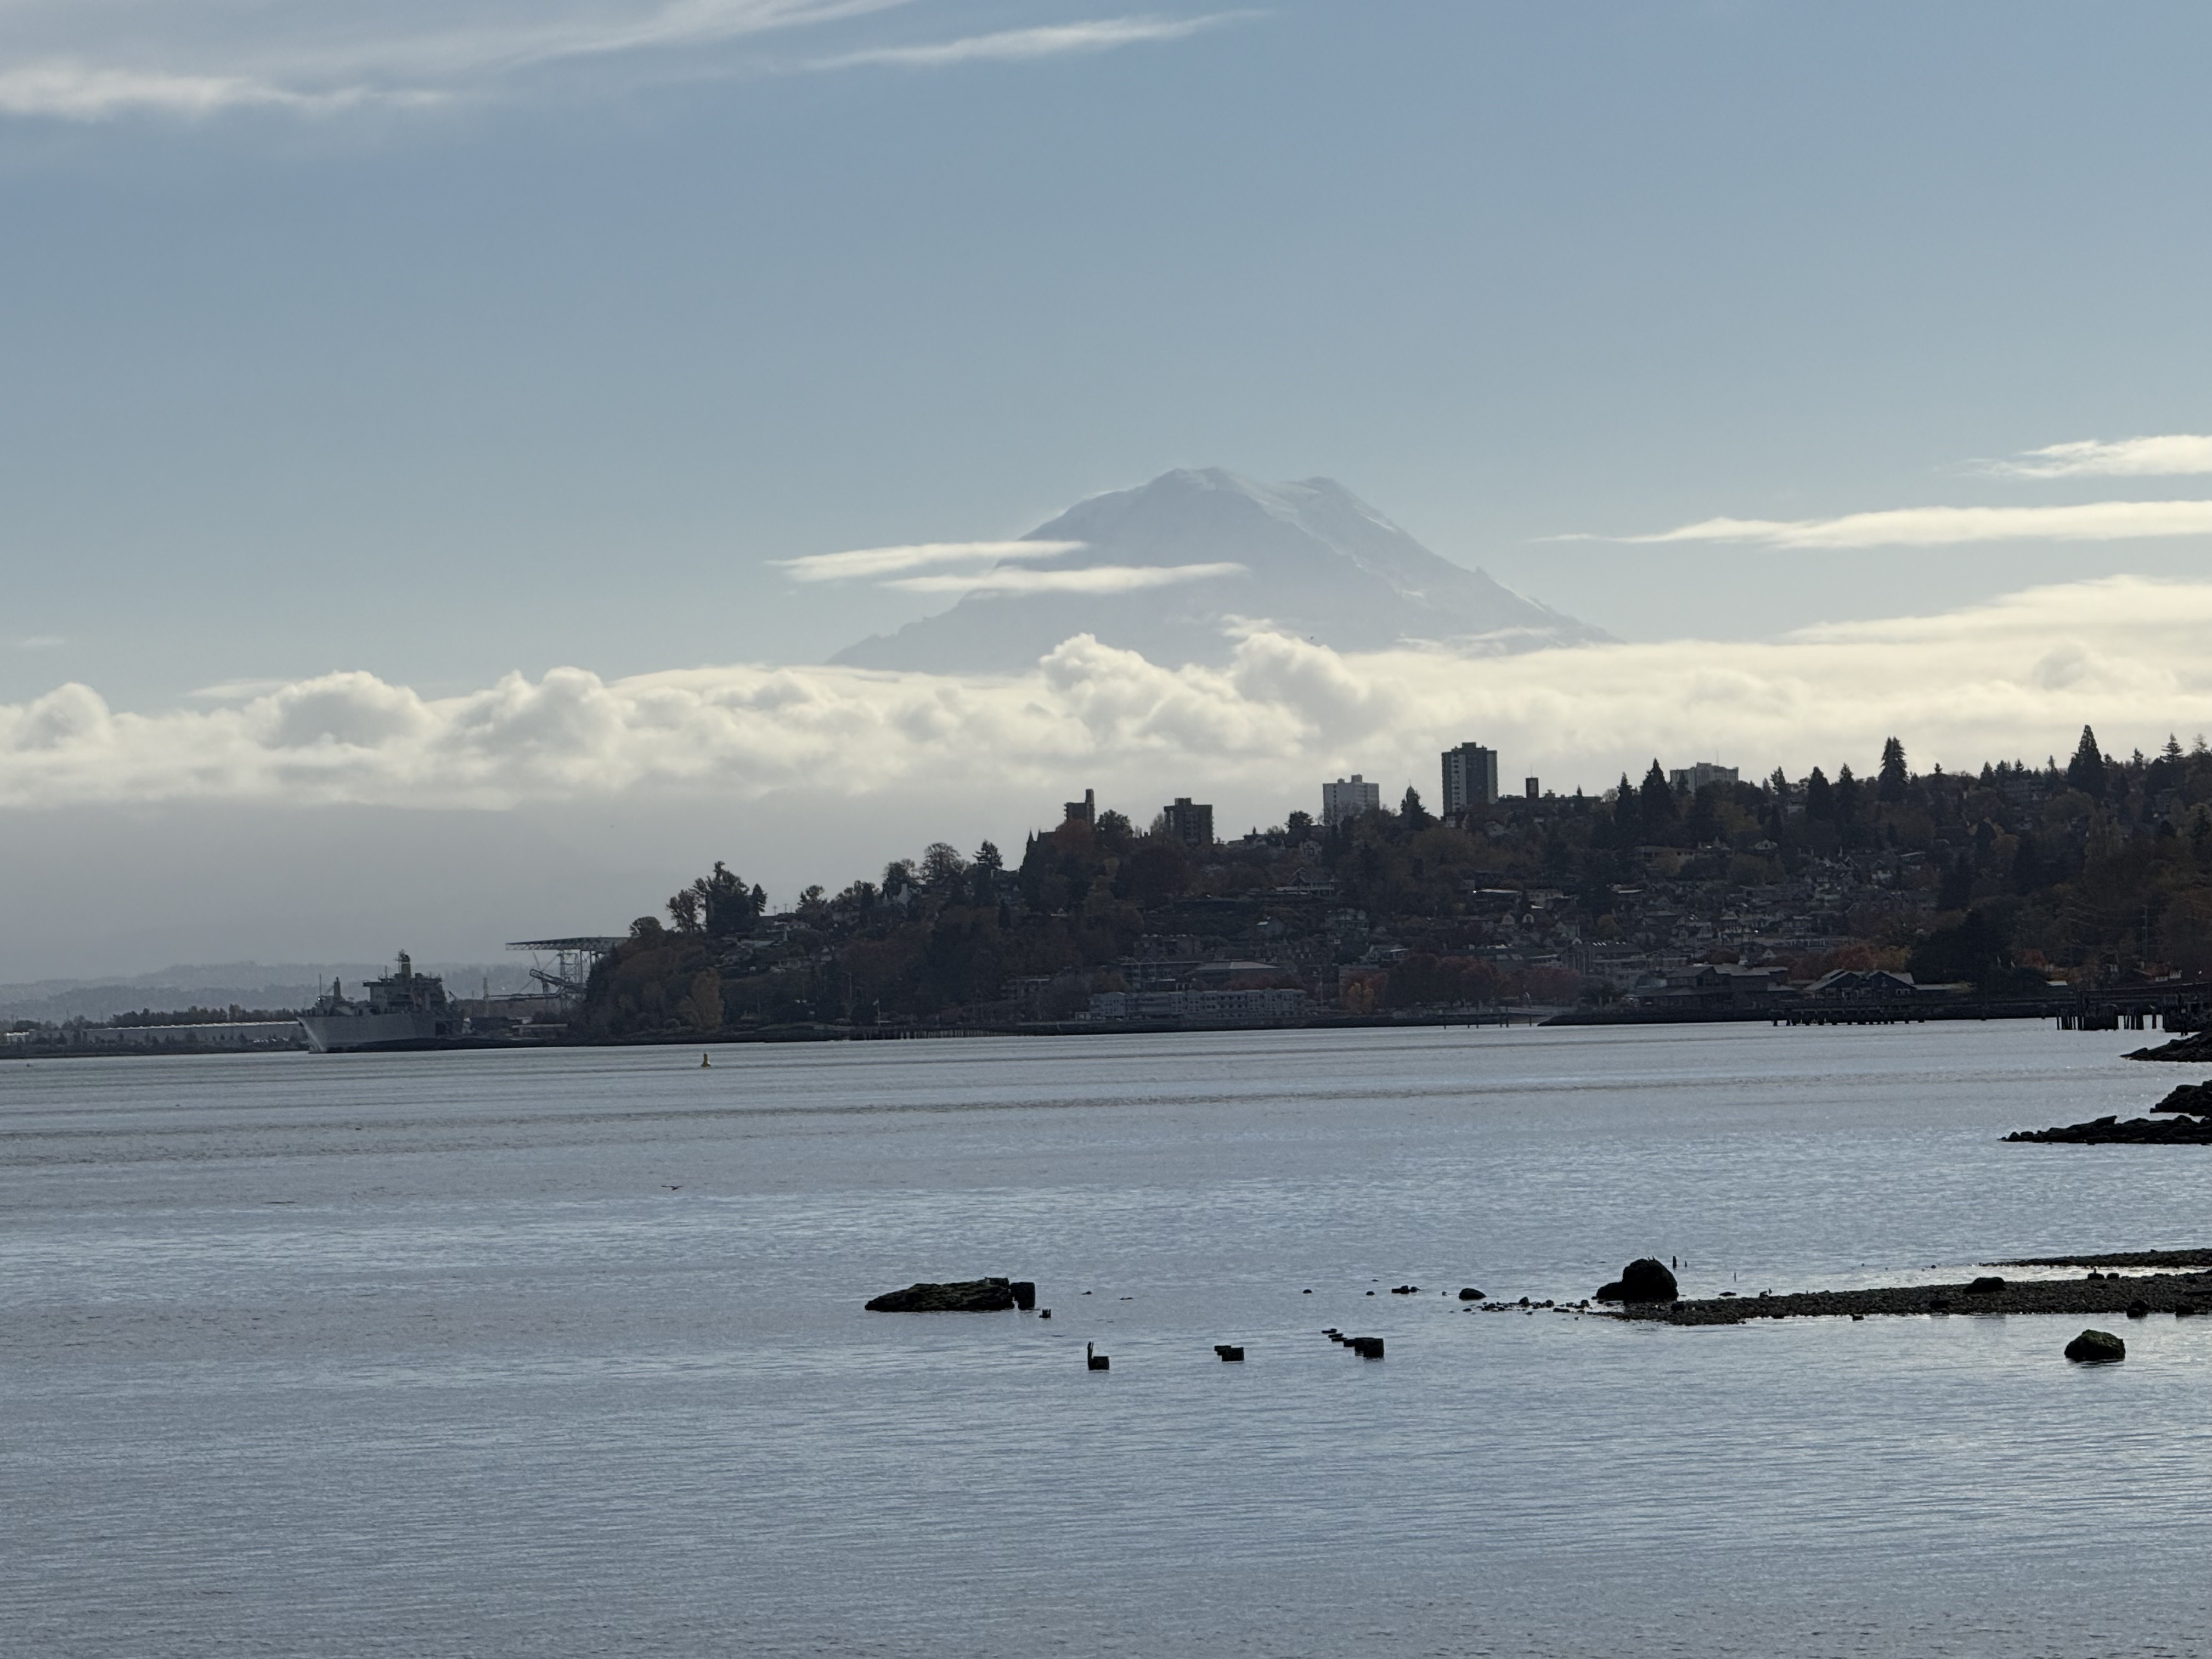
Plate 1. We’re not in Northern Virginia anymore!
I’ve relocated to the west coast–Tacoma, Washington to be exact, and that active stratovolcano looming in the background is Mt Rainier (aka Tahoma as it’s known to the indigenous people). The pristine water body is Commencement Bay at the southern end of Puget Sound. Mt Rainier is 14410 feet high, which makes it the most topographically prominent mountain in the lower 48 states; for scale, it is 43 miles from Tacoma, yet dominates the SE horizon. How did it come to be so close to the coast and yet so tall? Before I answer that question, let’s recap the geological story of NoVA that I pieced together over the last four years.
Over a billion years ago, NoVA was submerged beneath an ocean or marginal sea. Distant mountains eroded rapidly in a time before land plants. Vast quantities of sediment accumulated in layers of erosional debris that were subsequently buried by younger sediment. Between a billion and five-hundred million years ago, these sediments became rocks that were subsequently deformed as continental plates collided. They didn’t melt, however, and survived the cataclysm relatively unharmed, becoming schist and related metasedimentary rocks.

Plate 2. This schematic cross-section of the US East Coast is representative of NoVA. It shows the final closing of the Iapetus Ocean (forerunner of the Atlantic), which would have produced immense quantities of terrestrial sediments (e.g. the Devonian Catskill Delta in panel B). Unfortunately, these river and lacustrine sediments were subsequently eroded in NoVa as the ensuing mountains grew in size (panels C through E). They are today preserved in western New York State and eastern Pennsylvania. What survived in NoVA are older metasediments, ranging from ~1200 to 500 Ma, which were buried beneath the material eroded along the western margin of this figure (the yellow areas). Some Devonian intrusive rocks, intruded into older metasediments, survived along the Potomac River.

Plate 3. This reconstruction of the supercontinent, Pangea, coincides with Plate 2E. The square indicates NoVA. Pangea began to crack apart ~210 my ago, split by a spreading tectonic plate boundary, and for the last 200 million years, the older rocks have been slowly working their way to the surface as younger rocks were removed by erosion. They are now exposed to the elements and are weathering to form new layers of sediment in the Atlantic Ocean, beginning a new cycle.
What about the northwest coast, Tacoma and Seattle, you may ask?

Plate 4. This beautiful schematic cross-section represents the consensus opinion of geologists familiar with the Cascadia region. Tacoma lies at the northern end, near Mt Rainier. I will refer to this image frequently in my following posts. Study it a moment and you will realize that the geologic situation is similar to that presented in Plate 2A and B, but on the eastern (right) side of the closing ocean basin, i.e., the Pacific Ocean.
The Coast Range (including Olympic peninsula) is part of the accretionary wedge of a subduction zone, and Puget Sound lies within the forearc basin. In other words, I have moved from an extinct collisional tectonic regime to an active SUBDUCTION zone; Mt Rainier (Plate 1) is the tip of the geological iceberg, leaking sweat from the partially melting Juan de Fuca tectonic plate.
I hope you join me on this new geological adventure into the past…
Geological Cycles at Wolf Trap National Park

Figure 1. (A) Wolf Trap National Park for the Performing Arts is located about twenty miles west of Washington DC, near several parks I’ve discussed in previous posts, especially Great Falls National Monument. The geology of the area is dominated by Neoproterozoic-to-Cambrian (1000 – 511 Ma) metasedimentary rocks that originated in oceanic environments near rapidly rising mountains (e.g., a volcanic island arc). The dates are from the time of metamorphosis, which is why they give such a long time span. Taking into account the accuracy of the dates in general, this region was undergoing erosion with the resultant sediment buried in marine trenches, probably near a subduction zone, for hundreds of millions of years. The majority of the material would have been mud. There would have been hiatuses (perhaps an ocean basin briefly emerged), but such detail is lost to us after so long. (B) This map of Wolf Trap Park shows the trail we followed. The map doesn’t show topography, but the ridges are short, with maximum relief less than 100 feet. Wolf Trap creek enters from the west (left side of panel B) and flows through a wetland area (indicated by blue ellipse) before meandering a little and following the east side of the valley.
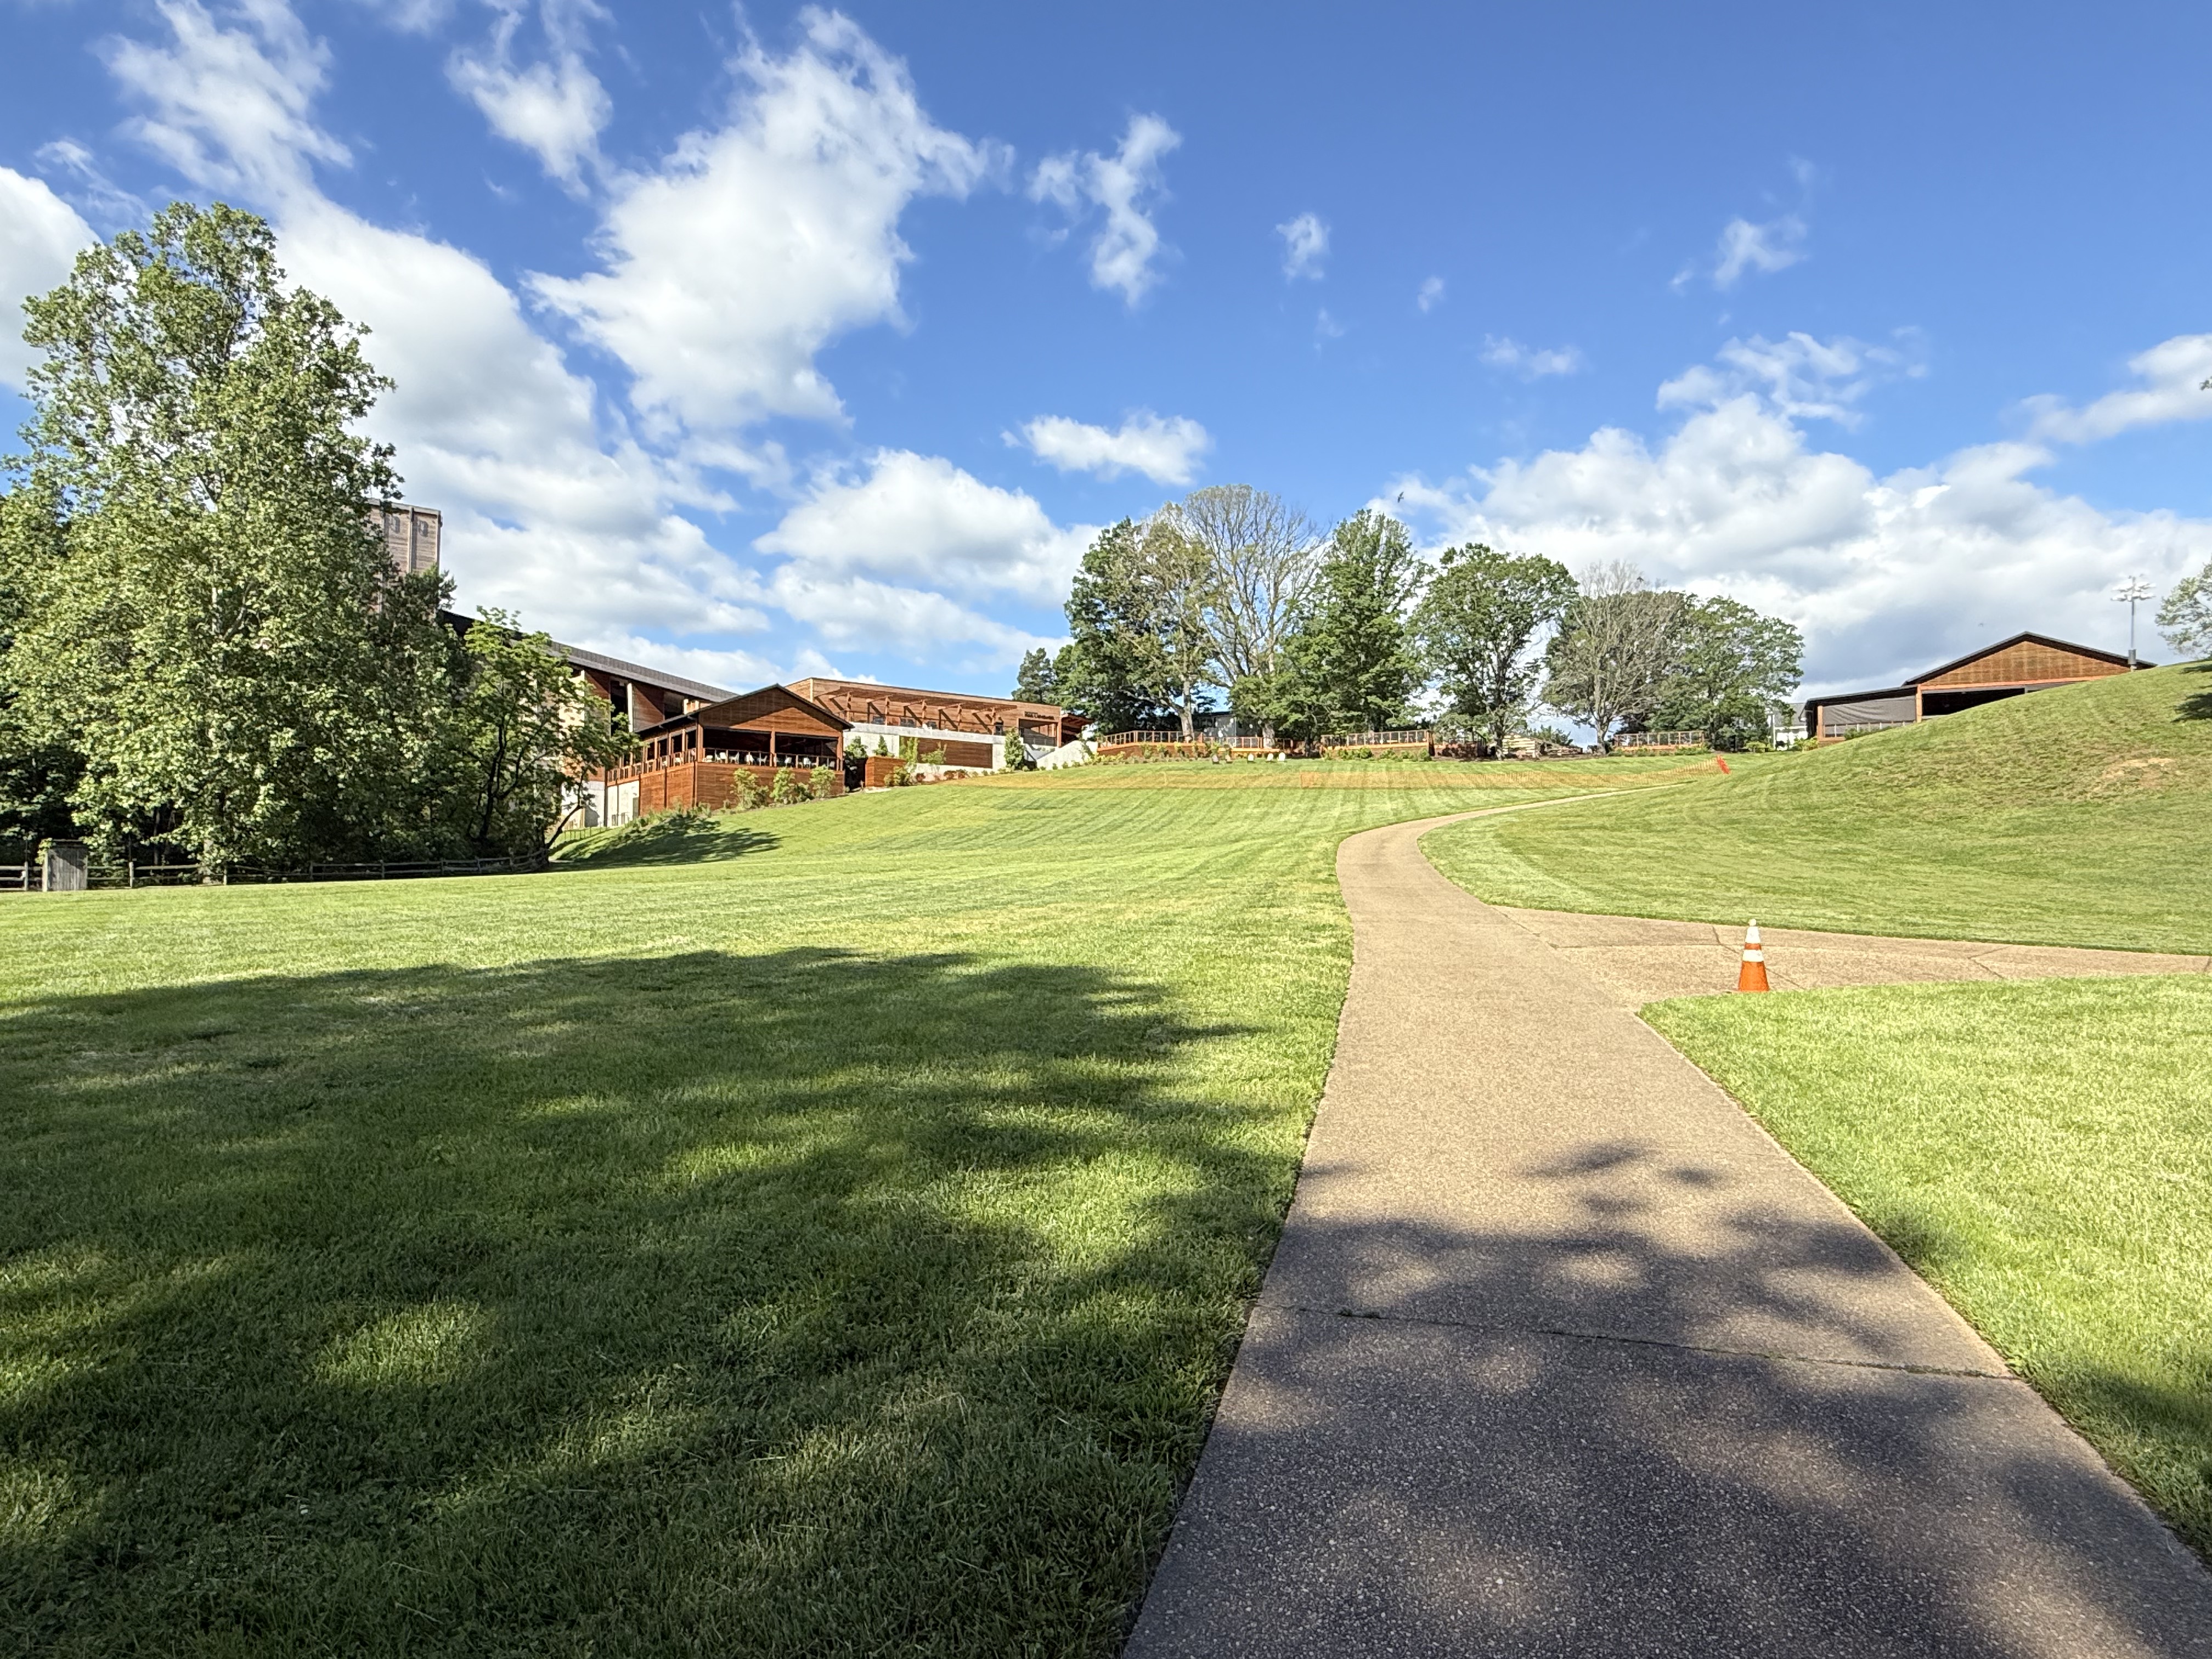
Figure 2. View of Filene Center from the SW side of our trail loop (see Fig. 1B), showing typical topographic relief at Wolf Trap park.

Figure 3. View of Wolf Trap creek where it enters the valley (Fig. 1B), showing boulders of Precambrian schist to be blocky–eroded nearby and gravitationally slid into creek but were not transported. These recently exhumed blocks are covered by Quaternary fluvial sediments, which are visible along the left side of the creek.
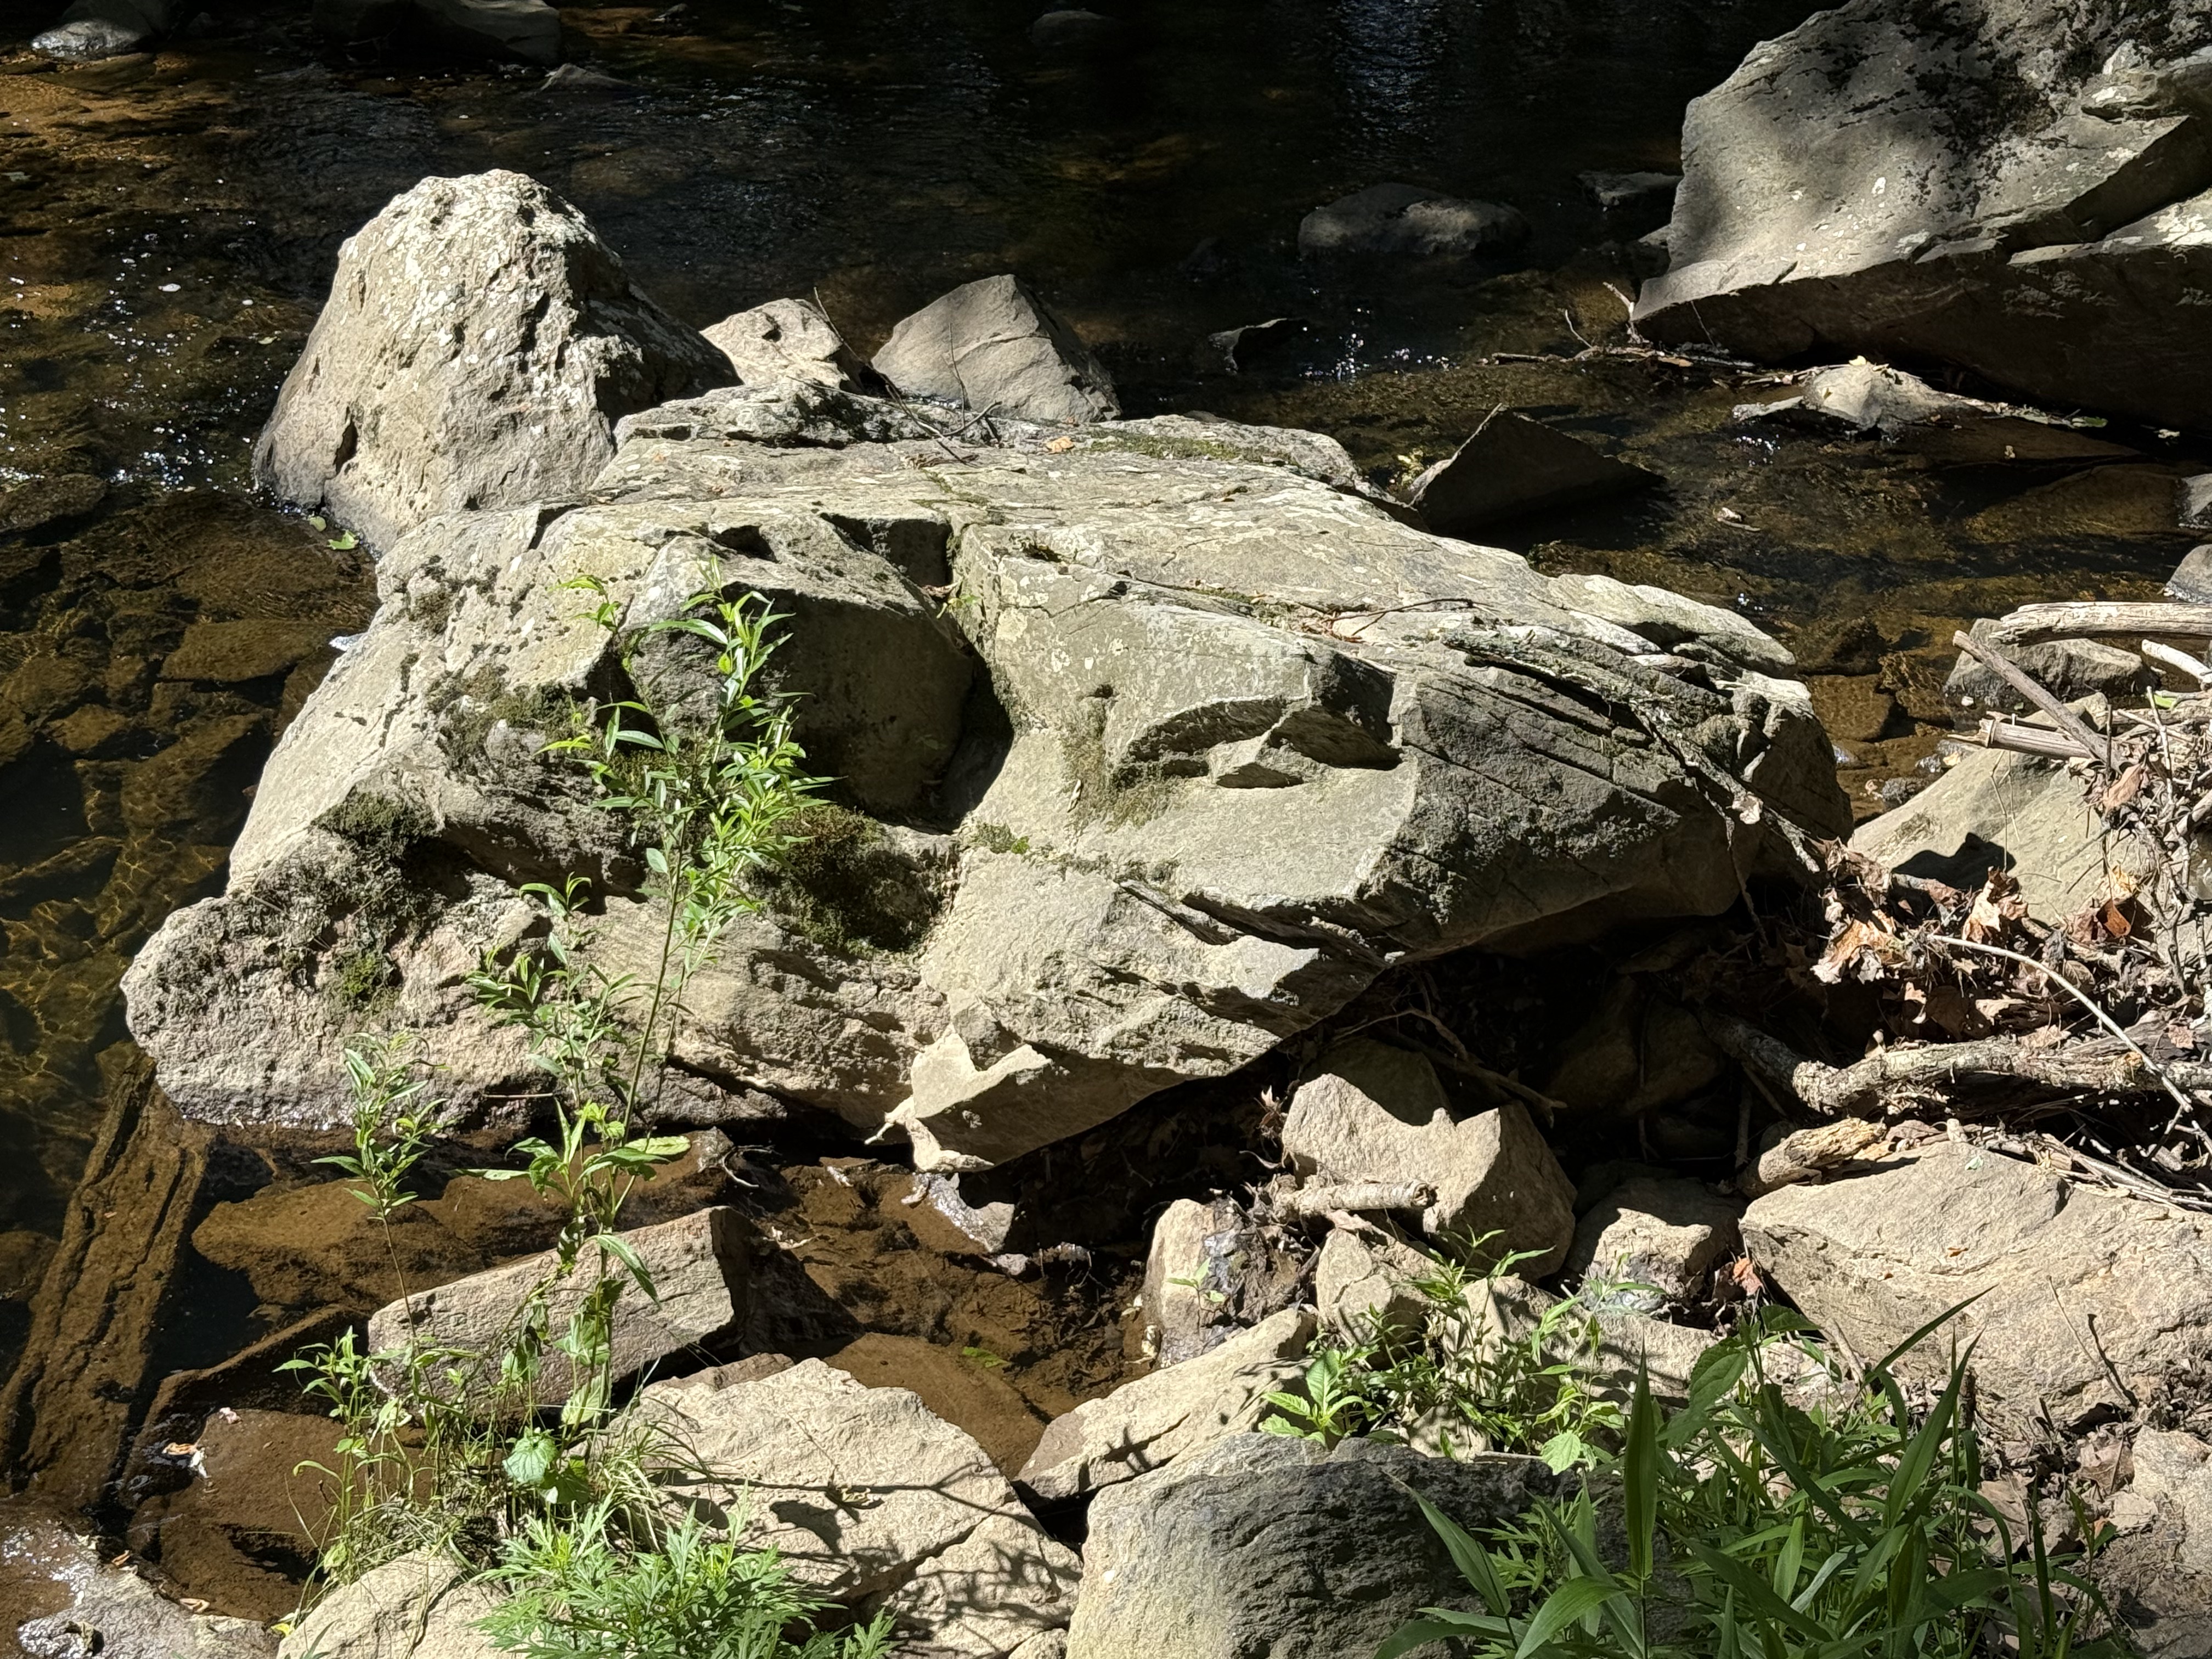
Figure 4. Large block (less than 6 feet in diameter) of schist that has been moderately weathered in place. Note the thin bedding (fissility) between thick layers with a conchoidal fracture pattern (center of image). This is the upstream side, which is pockmarked by rolling and bouncing boulders during high water. Mud becomes schist when buried deeply, retaining the lamination of the original fine-grained sediments, but remineralizing to familiar clays easily at the surface. Mud to schist to mud.

Figure 5. Meander in Wolf Trap creek along the north side of the park (see Fig. 1B), where a shallow pool of quiet water collects between runs (turbulent creek segments).

Figure 6. View looking upstream from a pedestrian bridge crossing Cthse Spring Branch, a tributary crossing our trail (dash line in Fig. 1B) before it joins Wolf Trap creek (NE side of trail in Fig. 1B). The boulders are smaller than downstream (Figs. 3 and 4), and their long axis are aligned with the stream flow. These angular blocks are sliding along on a stream-bed comprising miniature versions of themselves (note the clear view of the bottom in center of image). Even gravel and pebble-sized particles are platy because of the characteristic fissility of schist.

Figure 7. This photo dramatically reveals the effect of water on erosion.

Figure 8. This image is one I’ve seen too often here in northern VA. The sewer systems frequently follow streams because they are low points and run downhill (a good property for a sanitary system). However, when stream levels exceed expected values, the system is compromised and raw sewage can be released into the environment.
Summary. Over a billion years ago, this area was submerged beneath an ocean or marginal sea. Distant mountains eroded rapidly in a time before land plants. Vast quantities of sediment accumulated in layers of erosional debris that were subsequently buried by younger sediment. Between a billion and five-hundred million years ago, these sediments became rocks that were subsequently deformed as continental plates collided. They didn’t melt, however, and survived the cataclysm relatively unharmed, becoming schist and related metasedimentary rocks. For the last 200 million years, they have been slowly working their way to the surface as younger rocks are removed by water erosion in streams like we see all throughout NoVA. They are now exposed to the elements and are weathering to form new layers of sediment in the Atlantic Ocean, beginning a new cycle.
Slipping and Sliding: Holocene Landslides in Central Virginia
Introduction.
This post is a summary of a field trip I took during the Geological Society of America’s Southeastern Section meeting in Harrisonburg, Virginia: Ancient and Modern Landslides of the Eastern Blue Ridge of Virginia. I was joined by more than twenty geologists on this ten-hour excursion, which was led by two geologists from the Virginia Department of Energy. Thus, I’ll be adding my photographs and comments to the narrative supplied by our expert guides, as well as aircraft-flown LIDAR (Laser Imaging Detection and Ranging) data with one-meter resolution and maps compiled by the VADoE Geology and Mineral Resources division.
Debris flows have been identified in many places and certainly occurred throughout geological time, often associated with alluvial fans or volcanic eruptions. This post focuses on those which pose some hazard to the residents of Virginia and is not an exhaustive catalogue of all such features.
We looked at landslide deposits ranging in age from about 10000 years ago ( Holocene) to a debris flow created by a severe thunderstorm in 1995. Such deposits can be classified as modern, relict or ancient. As I understand these terms, modern can be attributed to a specific event. In geomorphology, a relict landform is a landform formed by either erosive or constructive surficial processes that are no longer active as they were in the past (Wikipedia). An ancient landform is from the geological past and has been extensively modified by surface processes, as well as burial and metamorphosis for very old rocks.
Any errors in my report are solely due to my misunderstanding what was presented on a topic I am unfamiliar with and not the leaders of the field trip.
Observations.

Figure 1. (A) The study area is located along the first ridge of the Valley and Ridge province of the Appalachian Mountains. Blue colors indicate higher elevations, including the Blue Ridge with peaks of about 400 m. The Blue Ridge is not strictly part of the Valley and Ridge; it is the result of a series of thrust faults which placed Precambrian metamorphic rocks over younger Paleozoic strata. (B) The field area (black ellipse) encloses a crenulated landscape comprising short canyons with steep slopes and rolling valleys. We visited the numbered stops in sequence.
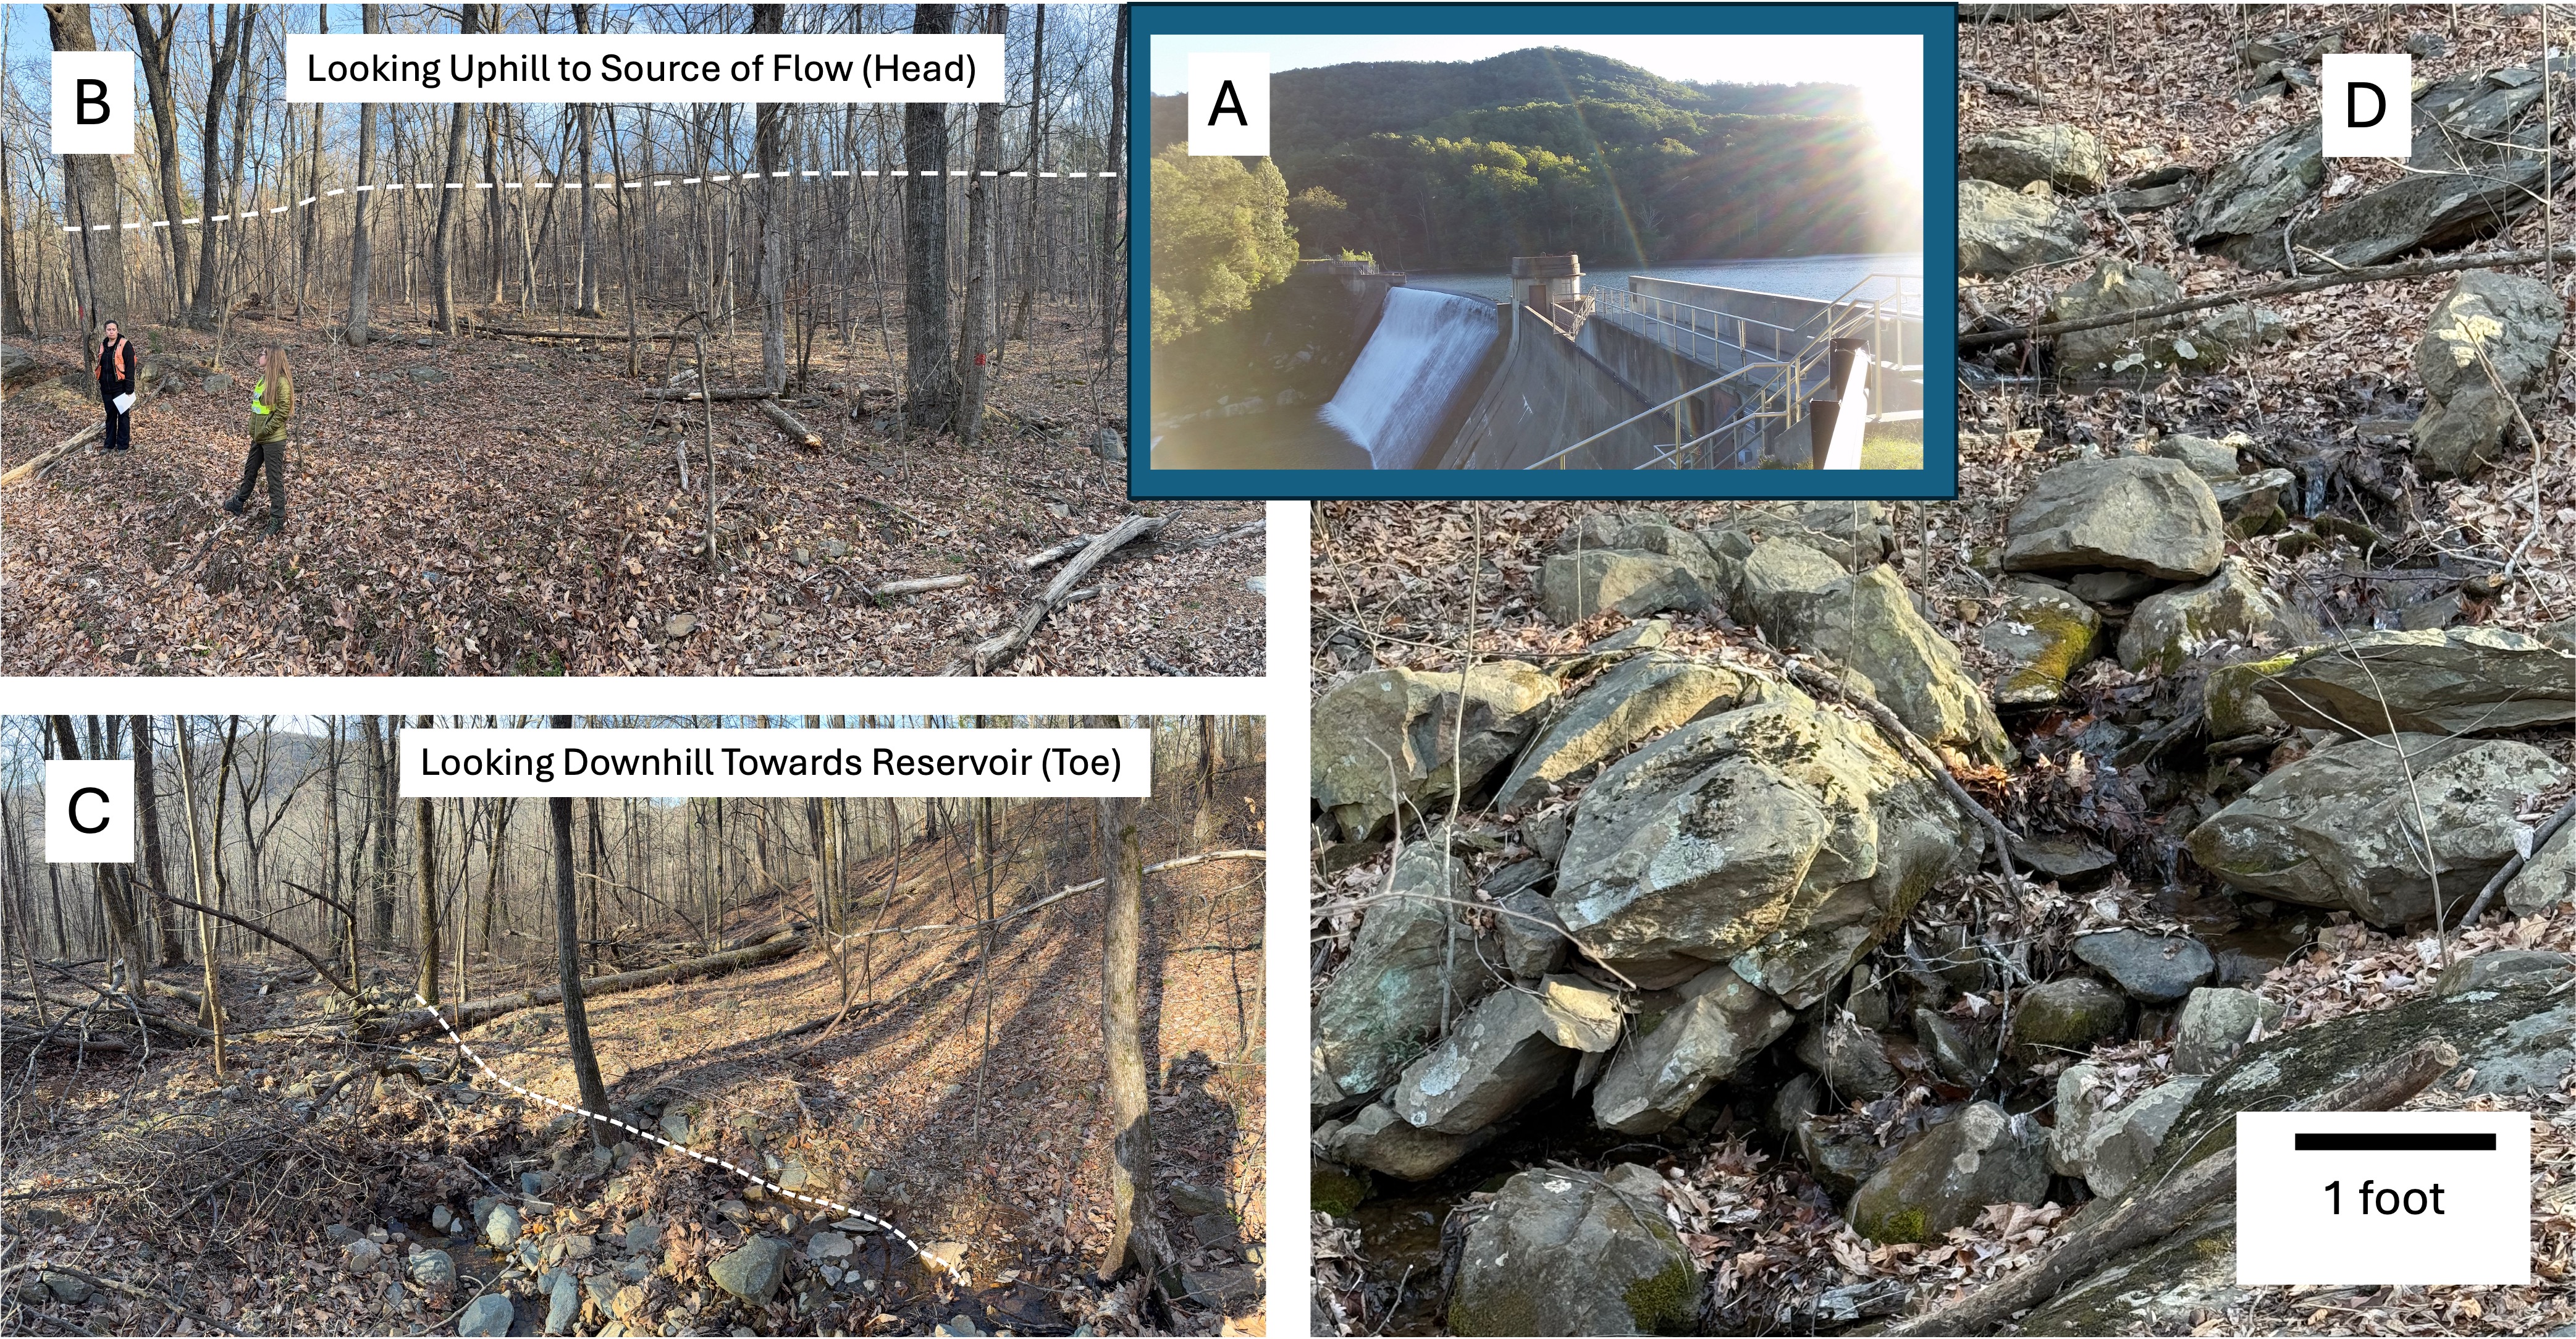
Figure 2. (A) Our first stop was at Sugar Hollow Reservoir. An intense thunderstorm dropped torrential rain on the area in June, 1995, causing a debris flow that decreased the reservoir’s volume by 15%. (B) Looking uphill we see an undulating surface littered with angular boulders from the top of the hill (dashed line). (C) Streams have started eroding into the debris flow, revealing a jumble of boulders beneath the surface, as seen in plate D. Recent mass flows like this are recognized by an irregular surface and angular boulders that didn’t originate from nearby slopes.

Figure 3. (A) Stop two (see Fig. 1B for location) took us to a relict debris flow easily identified in this high-resolution LIDAR image (courtesy of VA Dept. of Energy). Note the hummocky surface which originates at the top of the ridge. (B) The slope is very steep here and there were no trails to the summit. The Moorman River is at the bottom of the slope. (C) Photo taken at the location of the triangle in (A). The image shows a cutout from the slope, indicated by dashed lines; the long dashes locate the top of the scarp and the short dashes the approximate location of the lip. Compare this to the LIDAR image in (A), which shows a depression with a slight lip. There was a dramatic change in surface morphology along the slide, which is delineated by downslope ridges on either side.
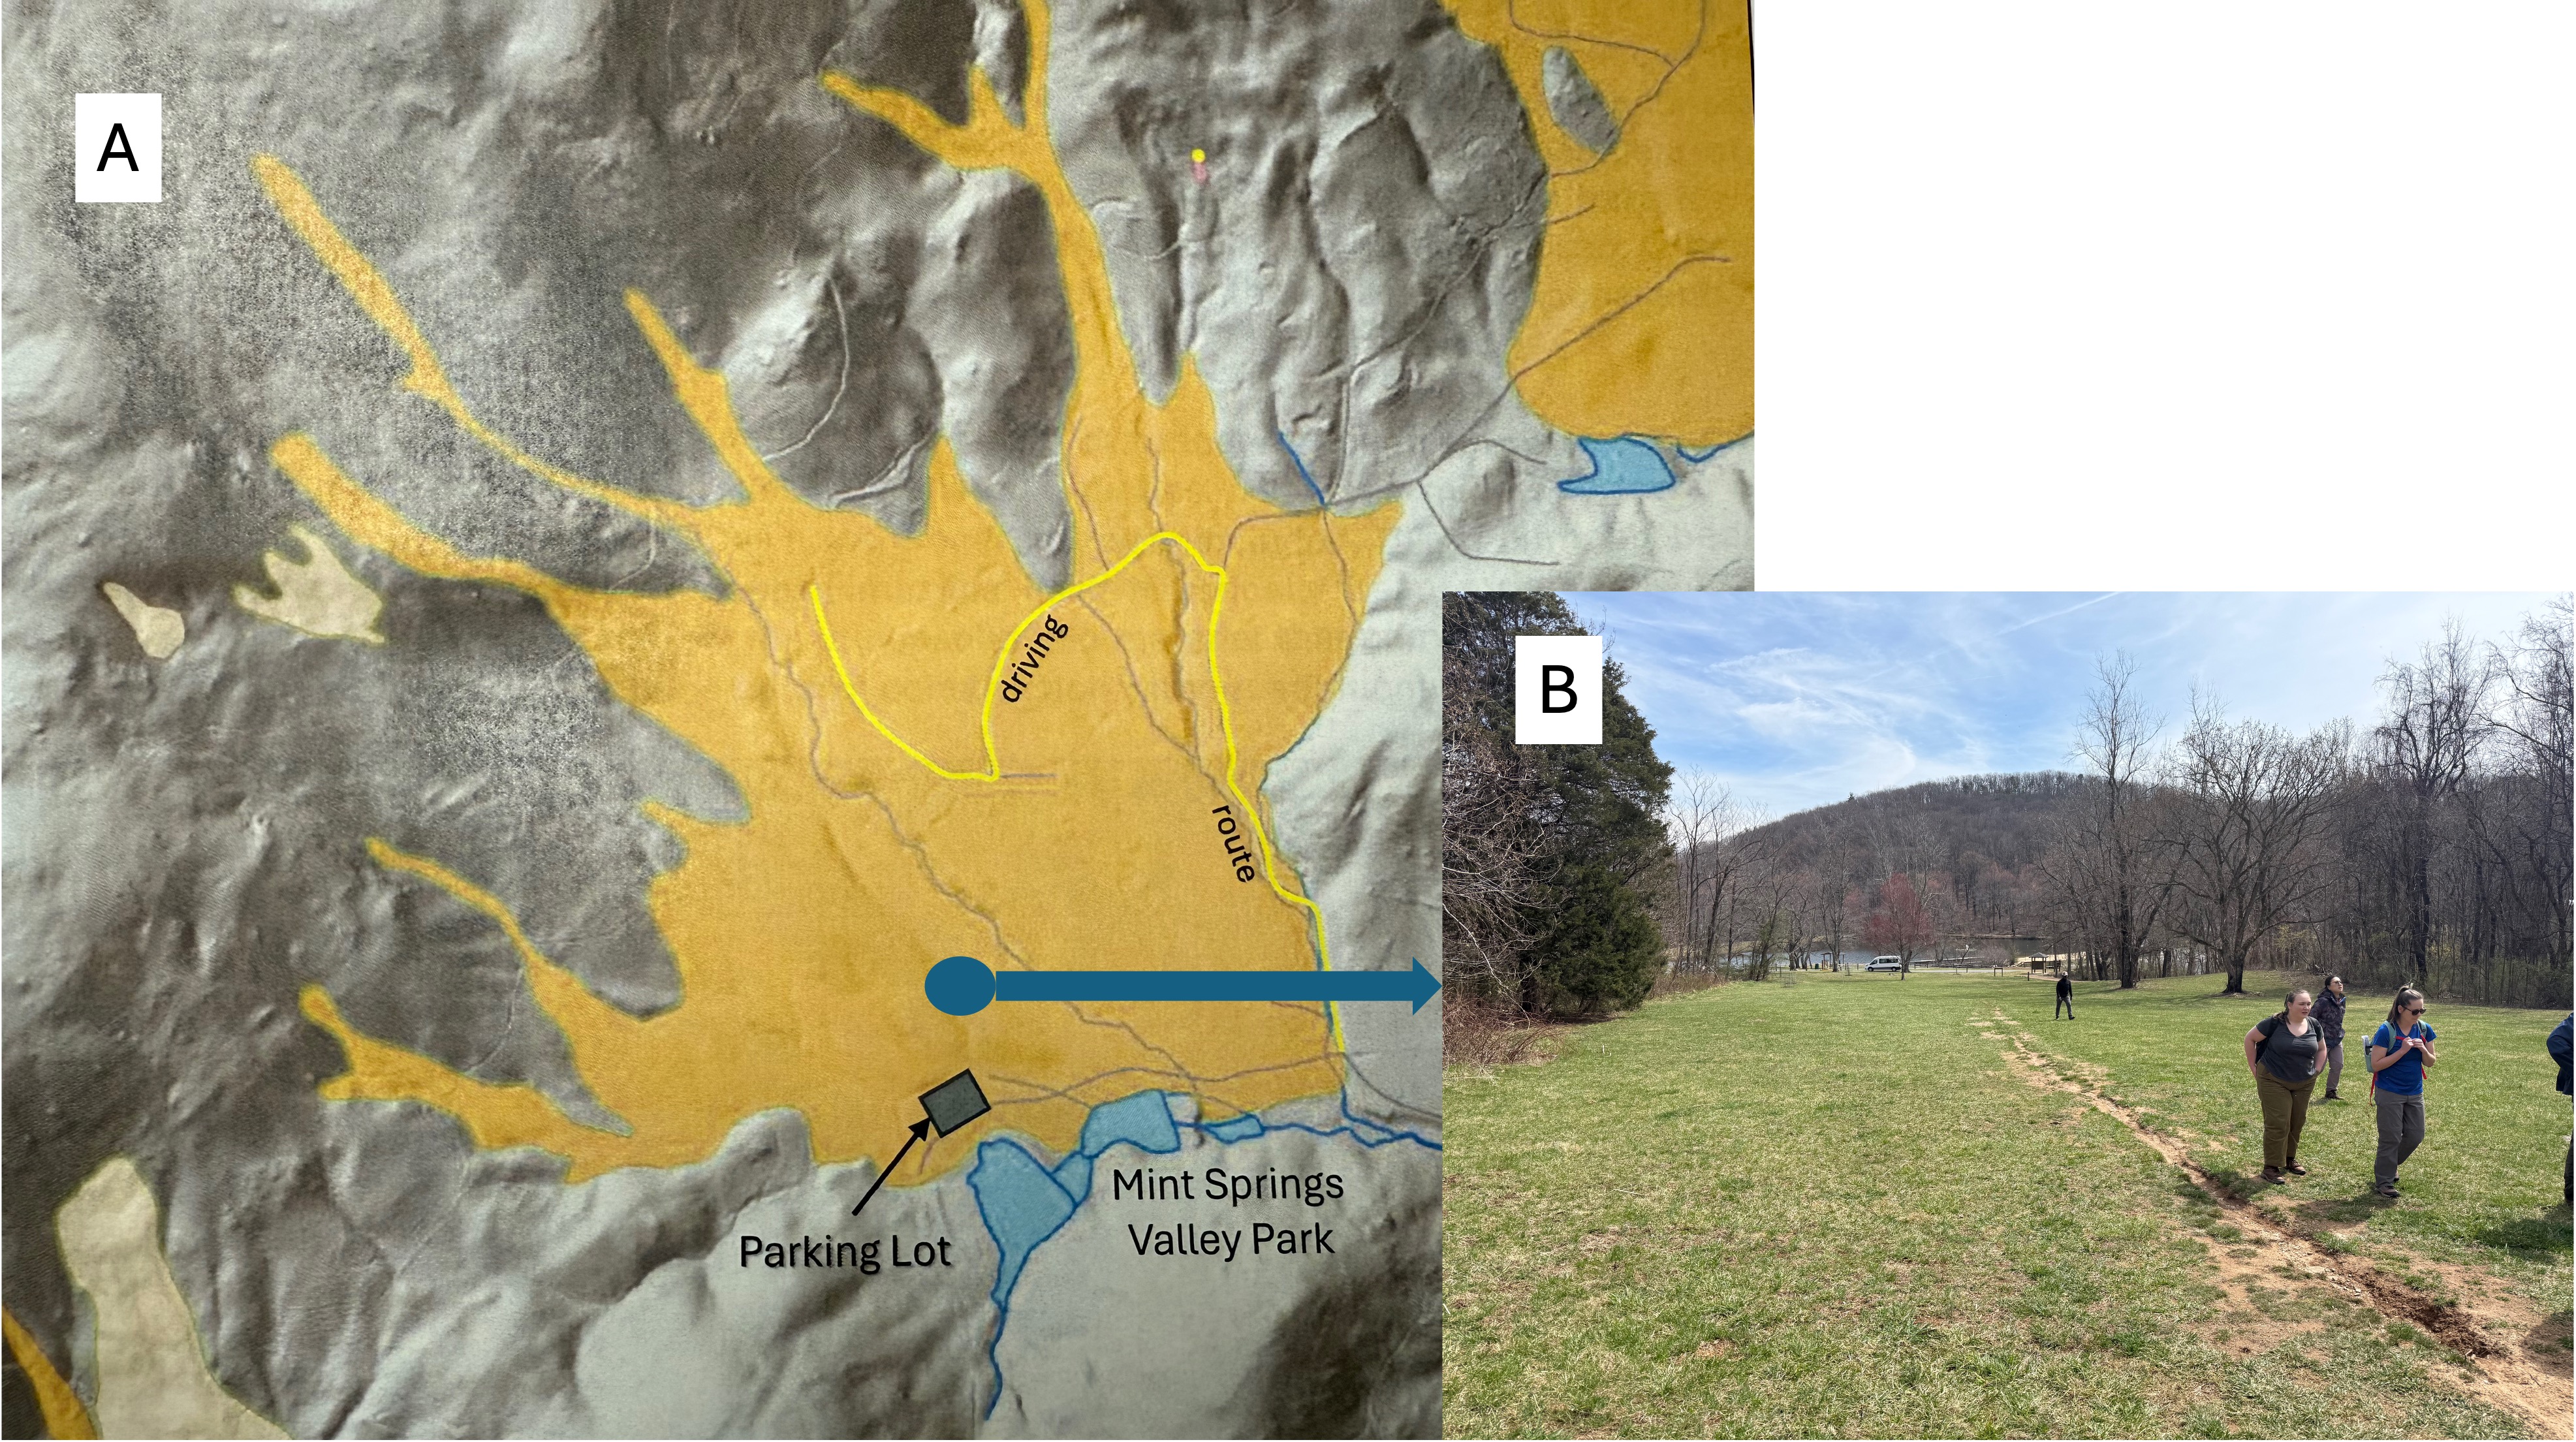
Figure 4. (A) Map of a debris flow (aka alluvial fan) at Mint Springs Valley Park, stop three in Fig. 1B (map courtesy of VA Dept. of Energy), showing how it was focused on the small lake at the park. Further up the valley, large boulders became apparent, but the landscape had been massively altered during construction of homes. (B) At the park, the slide appears as a smooth (graded) surface devoid of large boulders.

Figure 5. Ancient landslide deposit at Stoney Creek Park (stop 4 in Fig. 1B). (A) A stream-cut cliff revealed weathered Precambrian granulite directly overlain by a unit composed of angular-to-weathered boulders supported by a fine-grained matrix. The original bedding of the granulite, which originated as a sedimentary rock (probably sandstone or arkose) is labeled. The original sediments were deeply buried to reach such a high metamorphic grade, before being uplifted and eroded to create a surface on which the debris flow was deposited, probably in the precursor to the modern stream. (B) Detail showing the characteristic matrix-supported structure of the debris flow. This flow is interpreted as older, due in part to the extensive weathering of the clasts it contains. There was a lot of mud moving with these boulders.
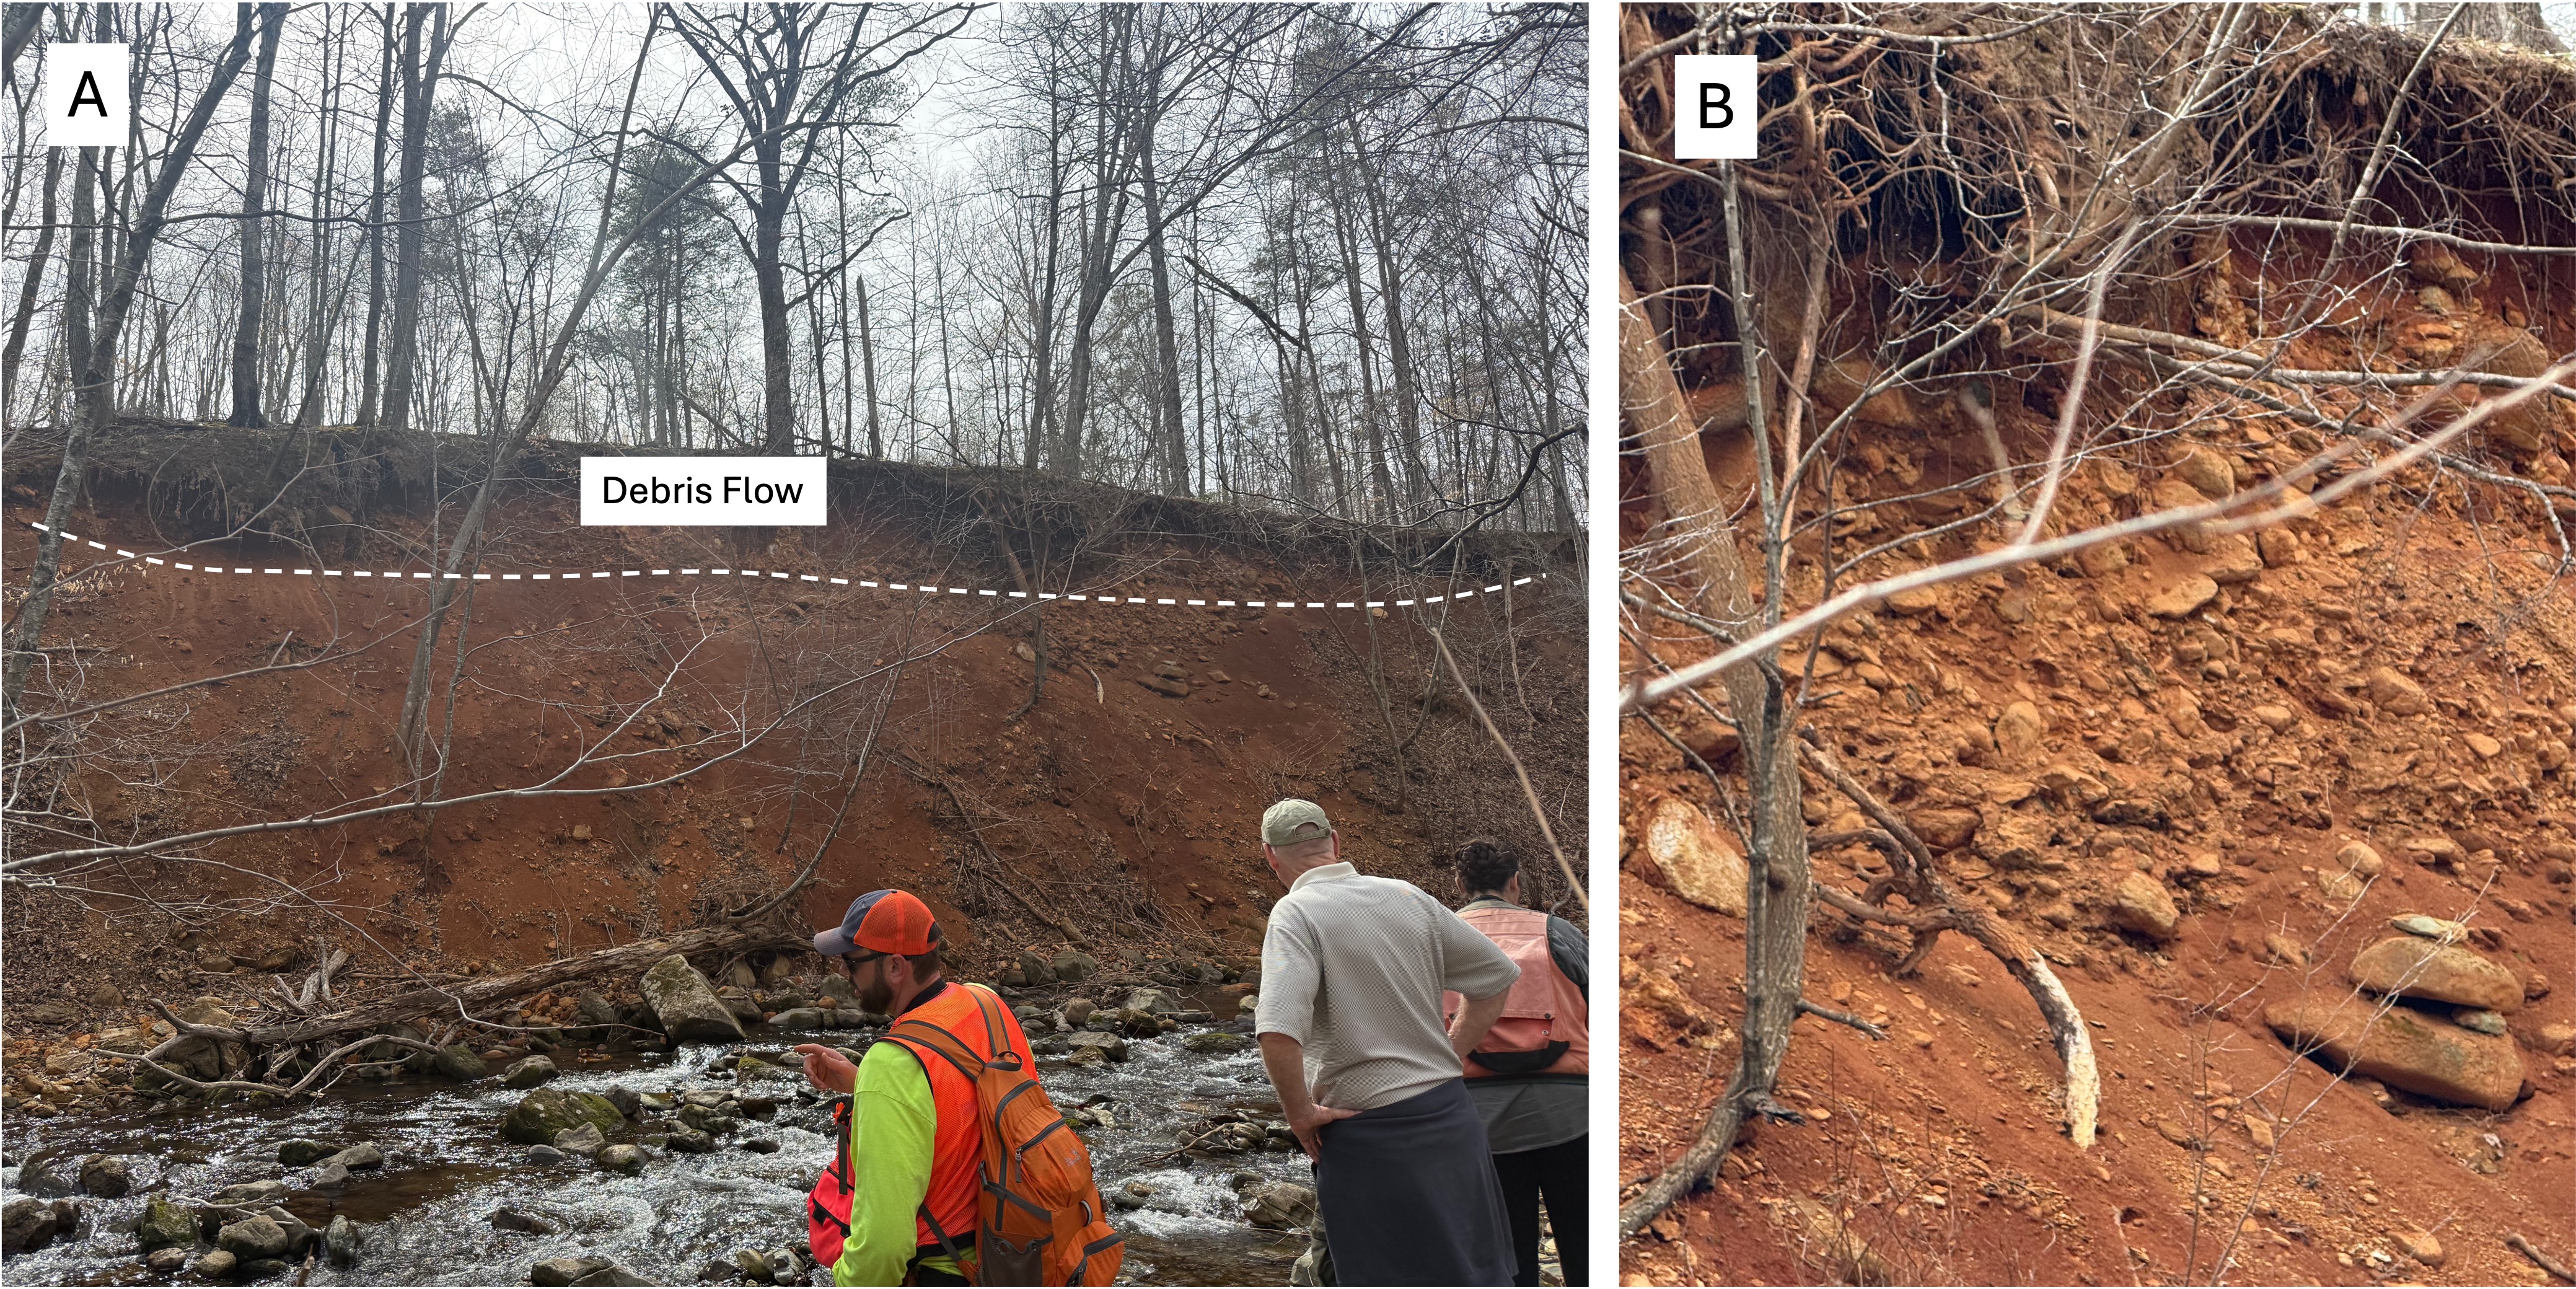
Figure 6. Ancient landslide deposit at Stoney Creek Park. (A) A debris flow is exposed as a planar surface on top of alluvium. Other flows are suggested by the exposure of boulders lower within the section, but it was difficult to be sure because of collapse of the upper surface. (B) This detailed image of the surface deposit reveals a higher concentration of boulders than in Fig. 5. They are also more rounded. This suggests fluvial reworking, which would have removed much of the fine matrix seen in Fig. 5. This flow, and others lower in the section, are considered to be younger in age, although radiometric dating is not available. Furthermore, the geologic map from Rock D (not shown) indicates several faults aligned with Stoney Creek, suggesting that uplift contributed to mass wasting of highlands to the west.

Figure 7. Stop five, Edgewood Farm (see Fig. 1B for location). (A) Geologic map from Rock D, annotated to show the source of material for a slide that was concentrated on a farm (blue circle) by a narrow gorge. (B) view looking WSW towards Mars Knob, showing the toe of the debris flow that resulted from heavy rain during Hurricane Camille in 1969. (C) Large boulder at the entrance to the canyon, marking the extent of transport of such debris. (D) Hummocky and boulder-littered surface within the arroyo, similar in appearance to stop one (Fig. 2).
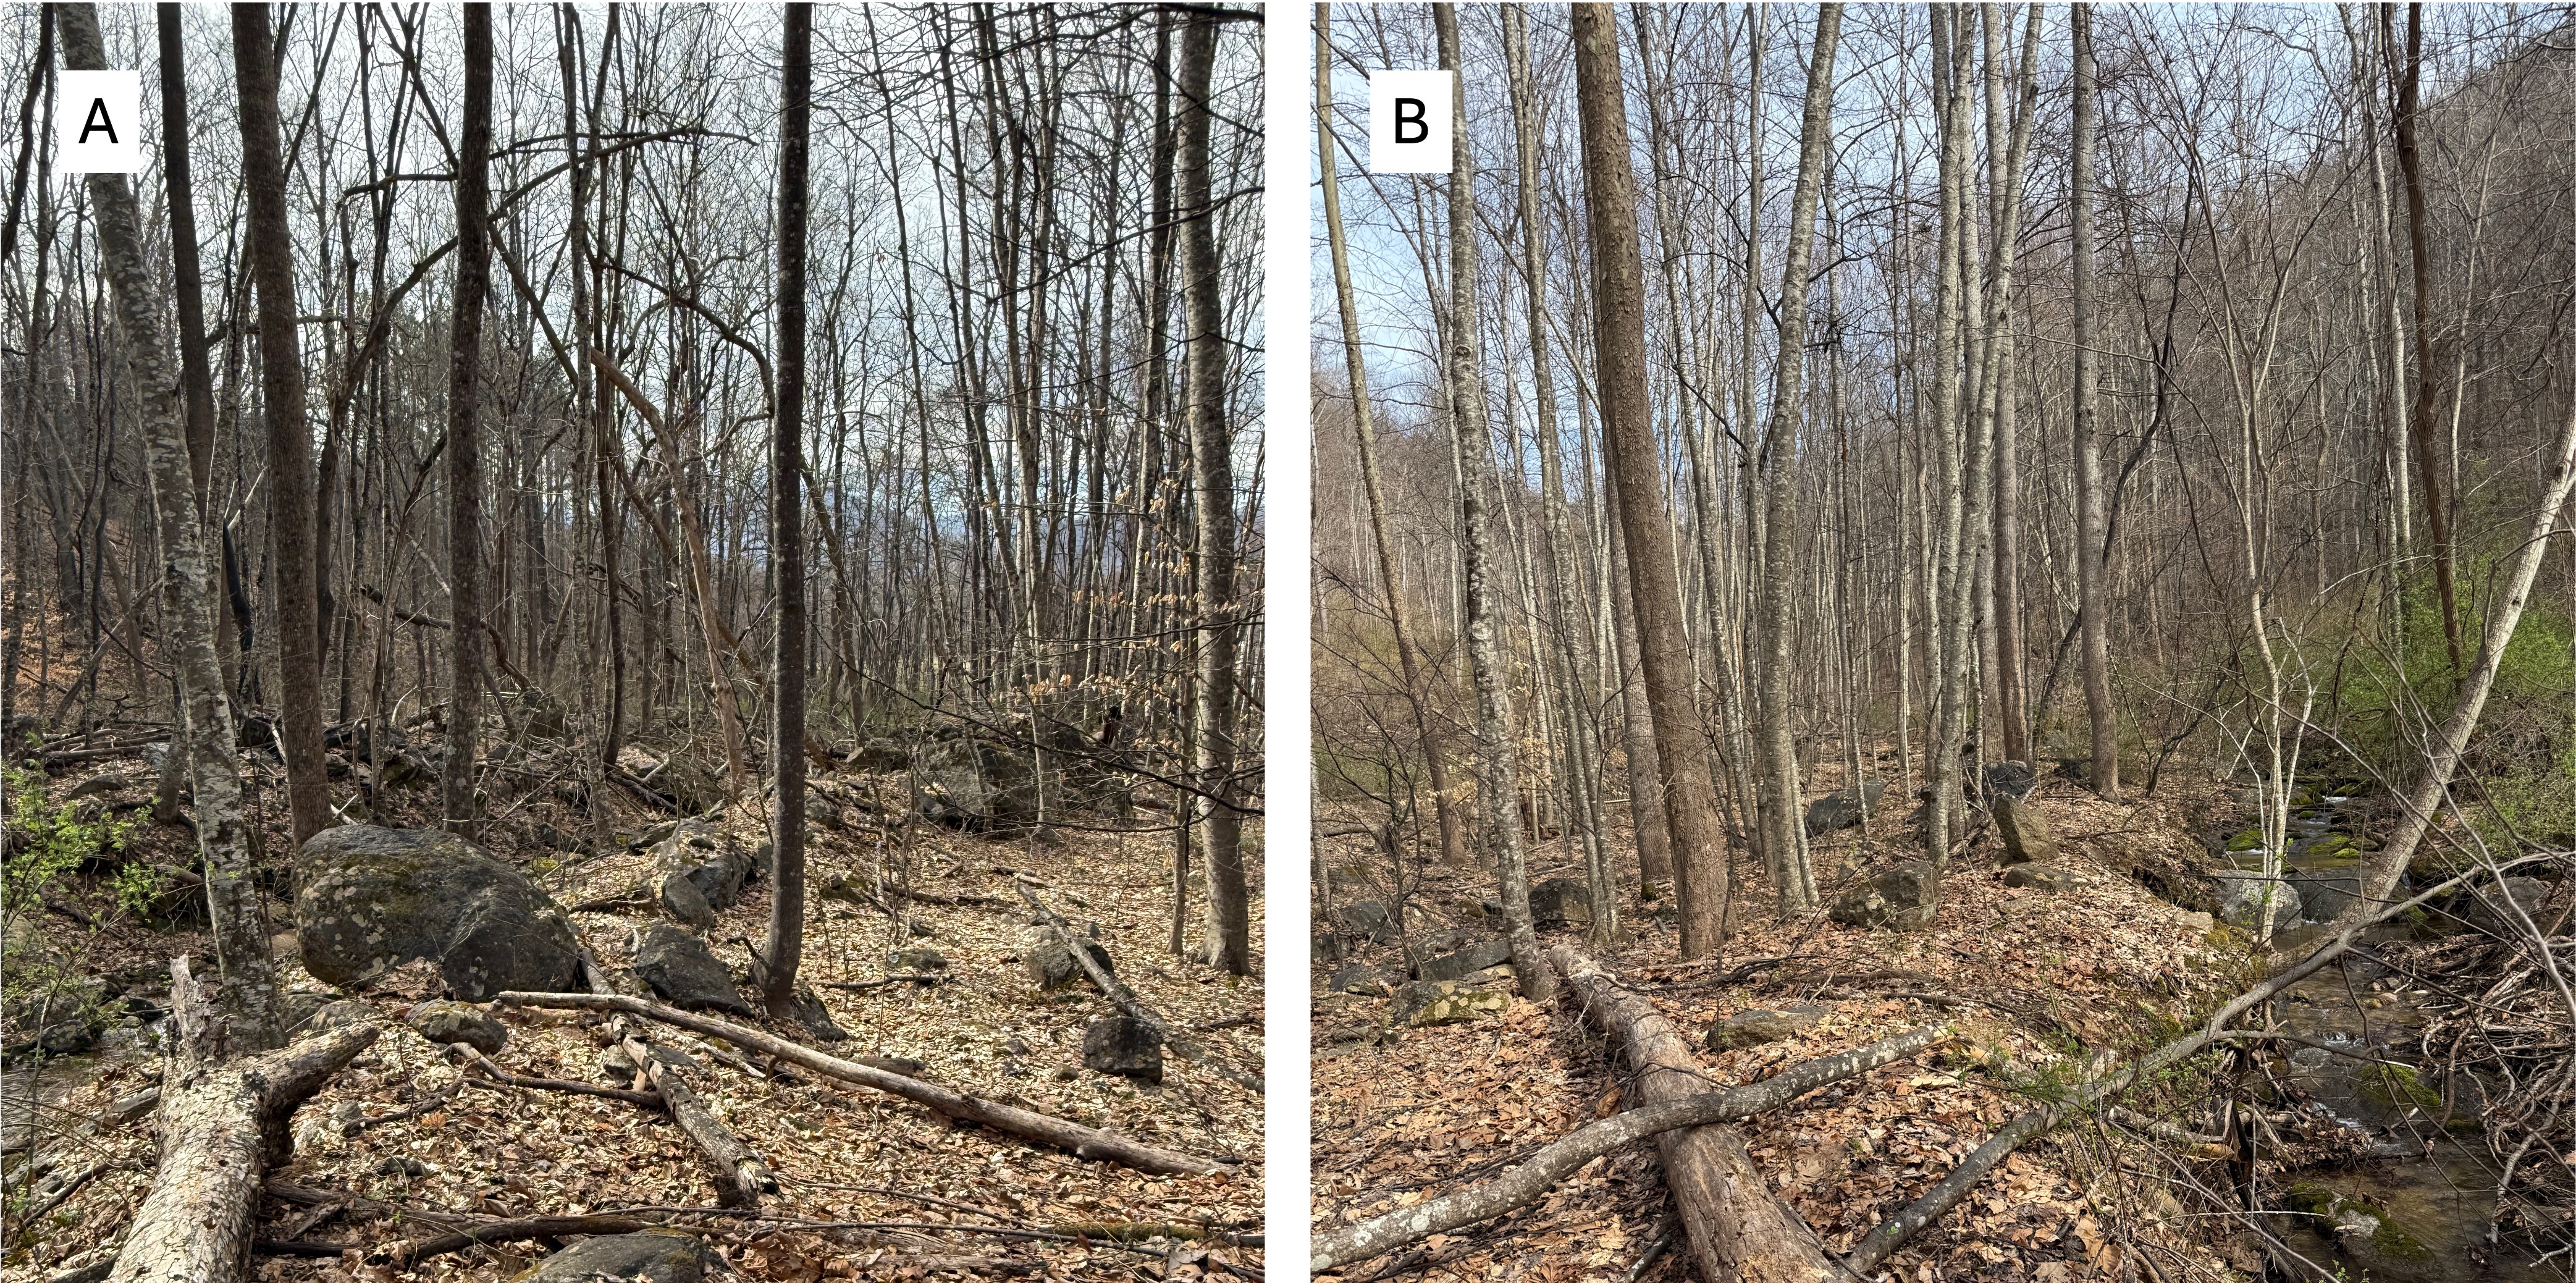
Figure 8. Images further upstream at stop five. (A) The north side of the valley is blocked by debris, including large boulders (>4 feet). (B) The south side seems to be less congested, and the stream has eroded a new channel through less-resistant material although the bed comprised smaller boulders (<2 feet). Such a large volume of material originated from a large source area (Fig. 7A) that was saturated by heavy rain, transporting a massive amount of rock debris with a relatively small amount of mud.
Summary.
I have only briefly summarized all the information supplied during the field trip. Nevertheless, these observations reinforce my previous opinion that surface erosion is dominated by episodic events. From thin layers of sand on alluvial fans, flood deposits along large rivers like the Mississippi, and storm beds on the continental shelf, to pyroclastic flows and fluvial/alluvial debris flows like these, Mother Nature doesn’t do anything slow and easy. It’s more like wait and wait … then all hell breaks loose.
At least that’s what I think …
Acknowledgment.

Figure 9. This field trip was led by Wendy Kelly (left) and Anne Witt (right) of the Virginia Department of Energy’s Division of Geology and Mineral Resources. Their expertise made this a very enlightening and geologically uplifting experience. I will certainly be on the lookout for evidence of debris flows as I continue my geological adventure.
Washington Monument State Park, MD: Familiar Cambrian Metasediments
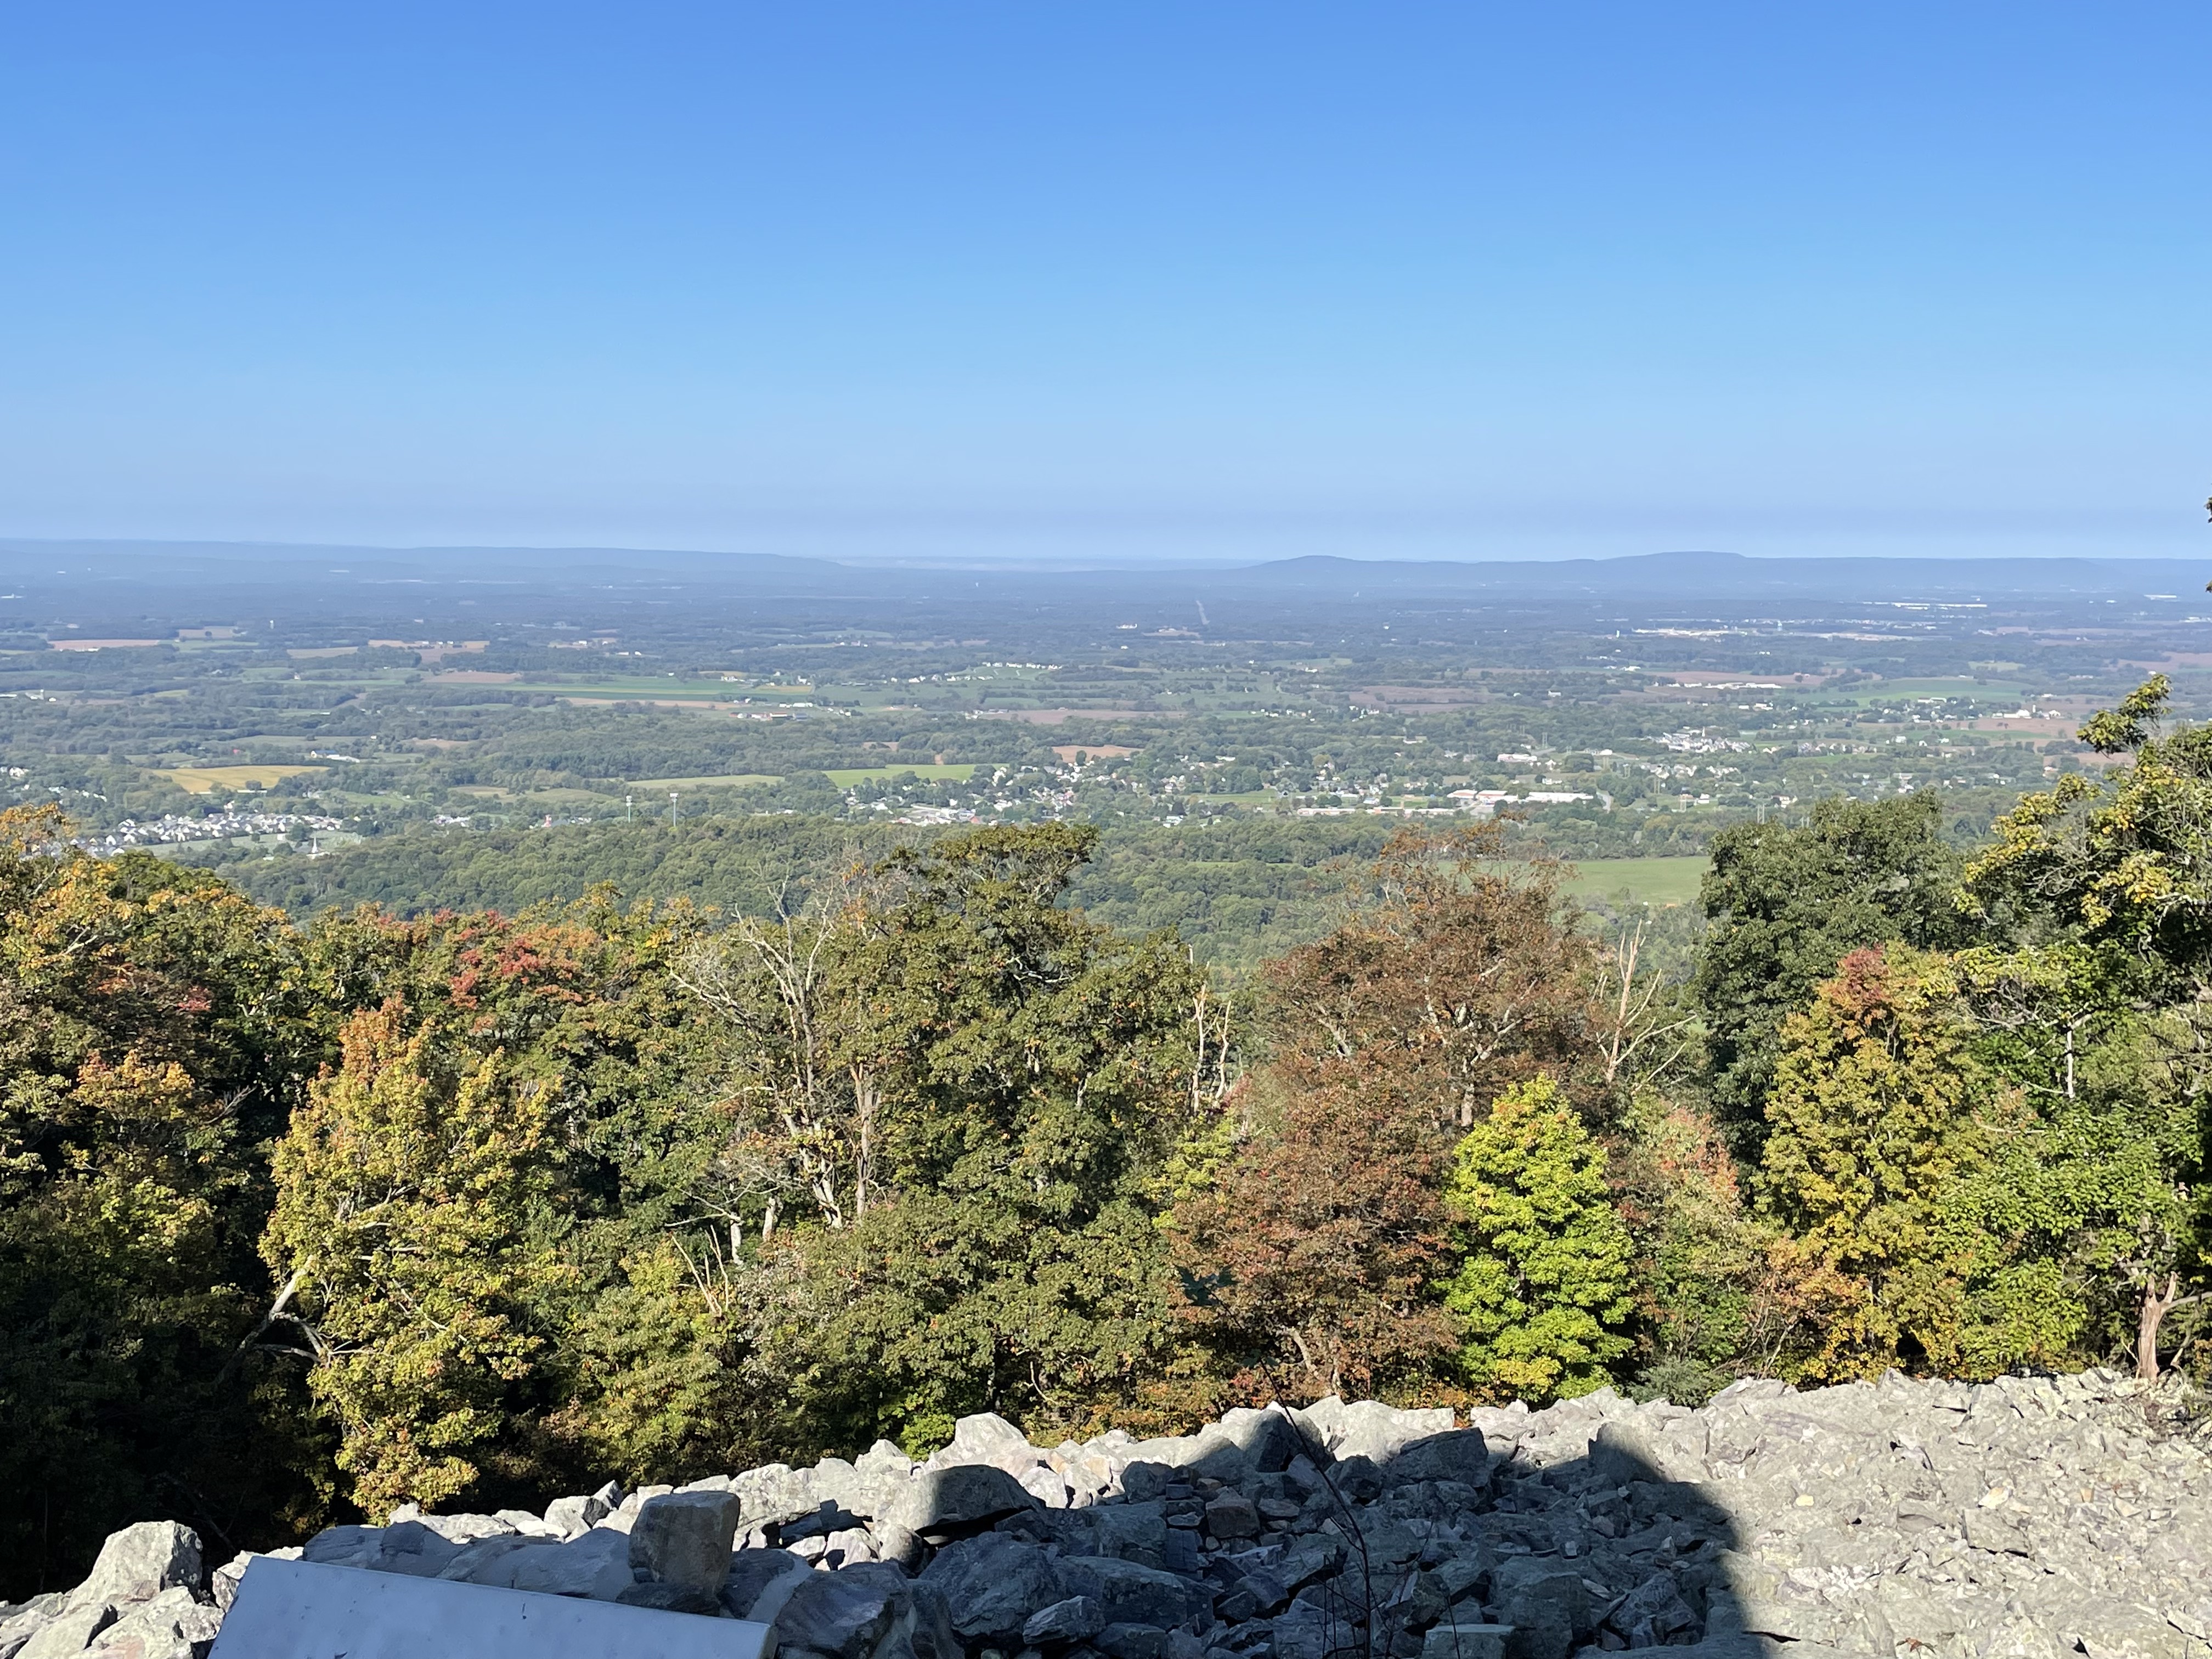
Figure 1. Looking west from Washington Monument, atop the Blue Ridge in Maryland. The valley is equivalent to the Shenandoah Valley in VA (see Fig. 2), but I couldn’t find a map with it labeled. The Appalachian trail follows the ridge through MD; we encountered it a few miles south of here in a previous post. We expect to see some of the same Proterozoic-to-Cambrian (2500-500 Ma) metasedimentary rocks here that we saw before, in addition to a surprise from an older post.
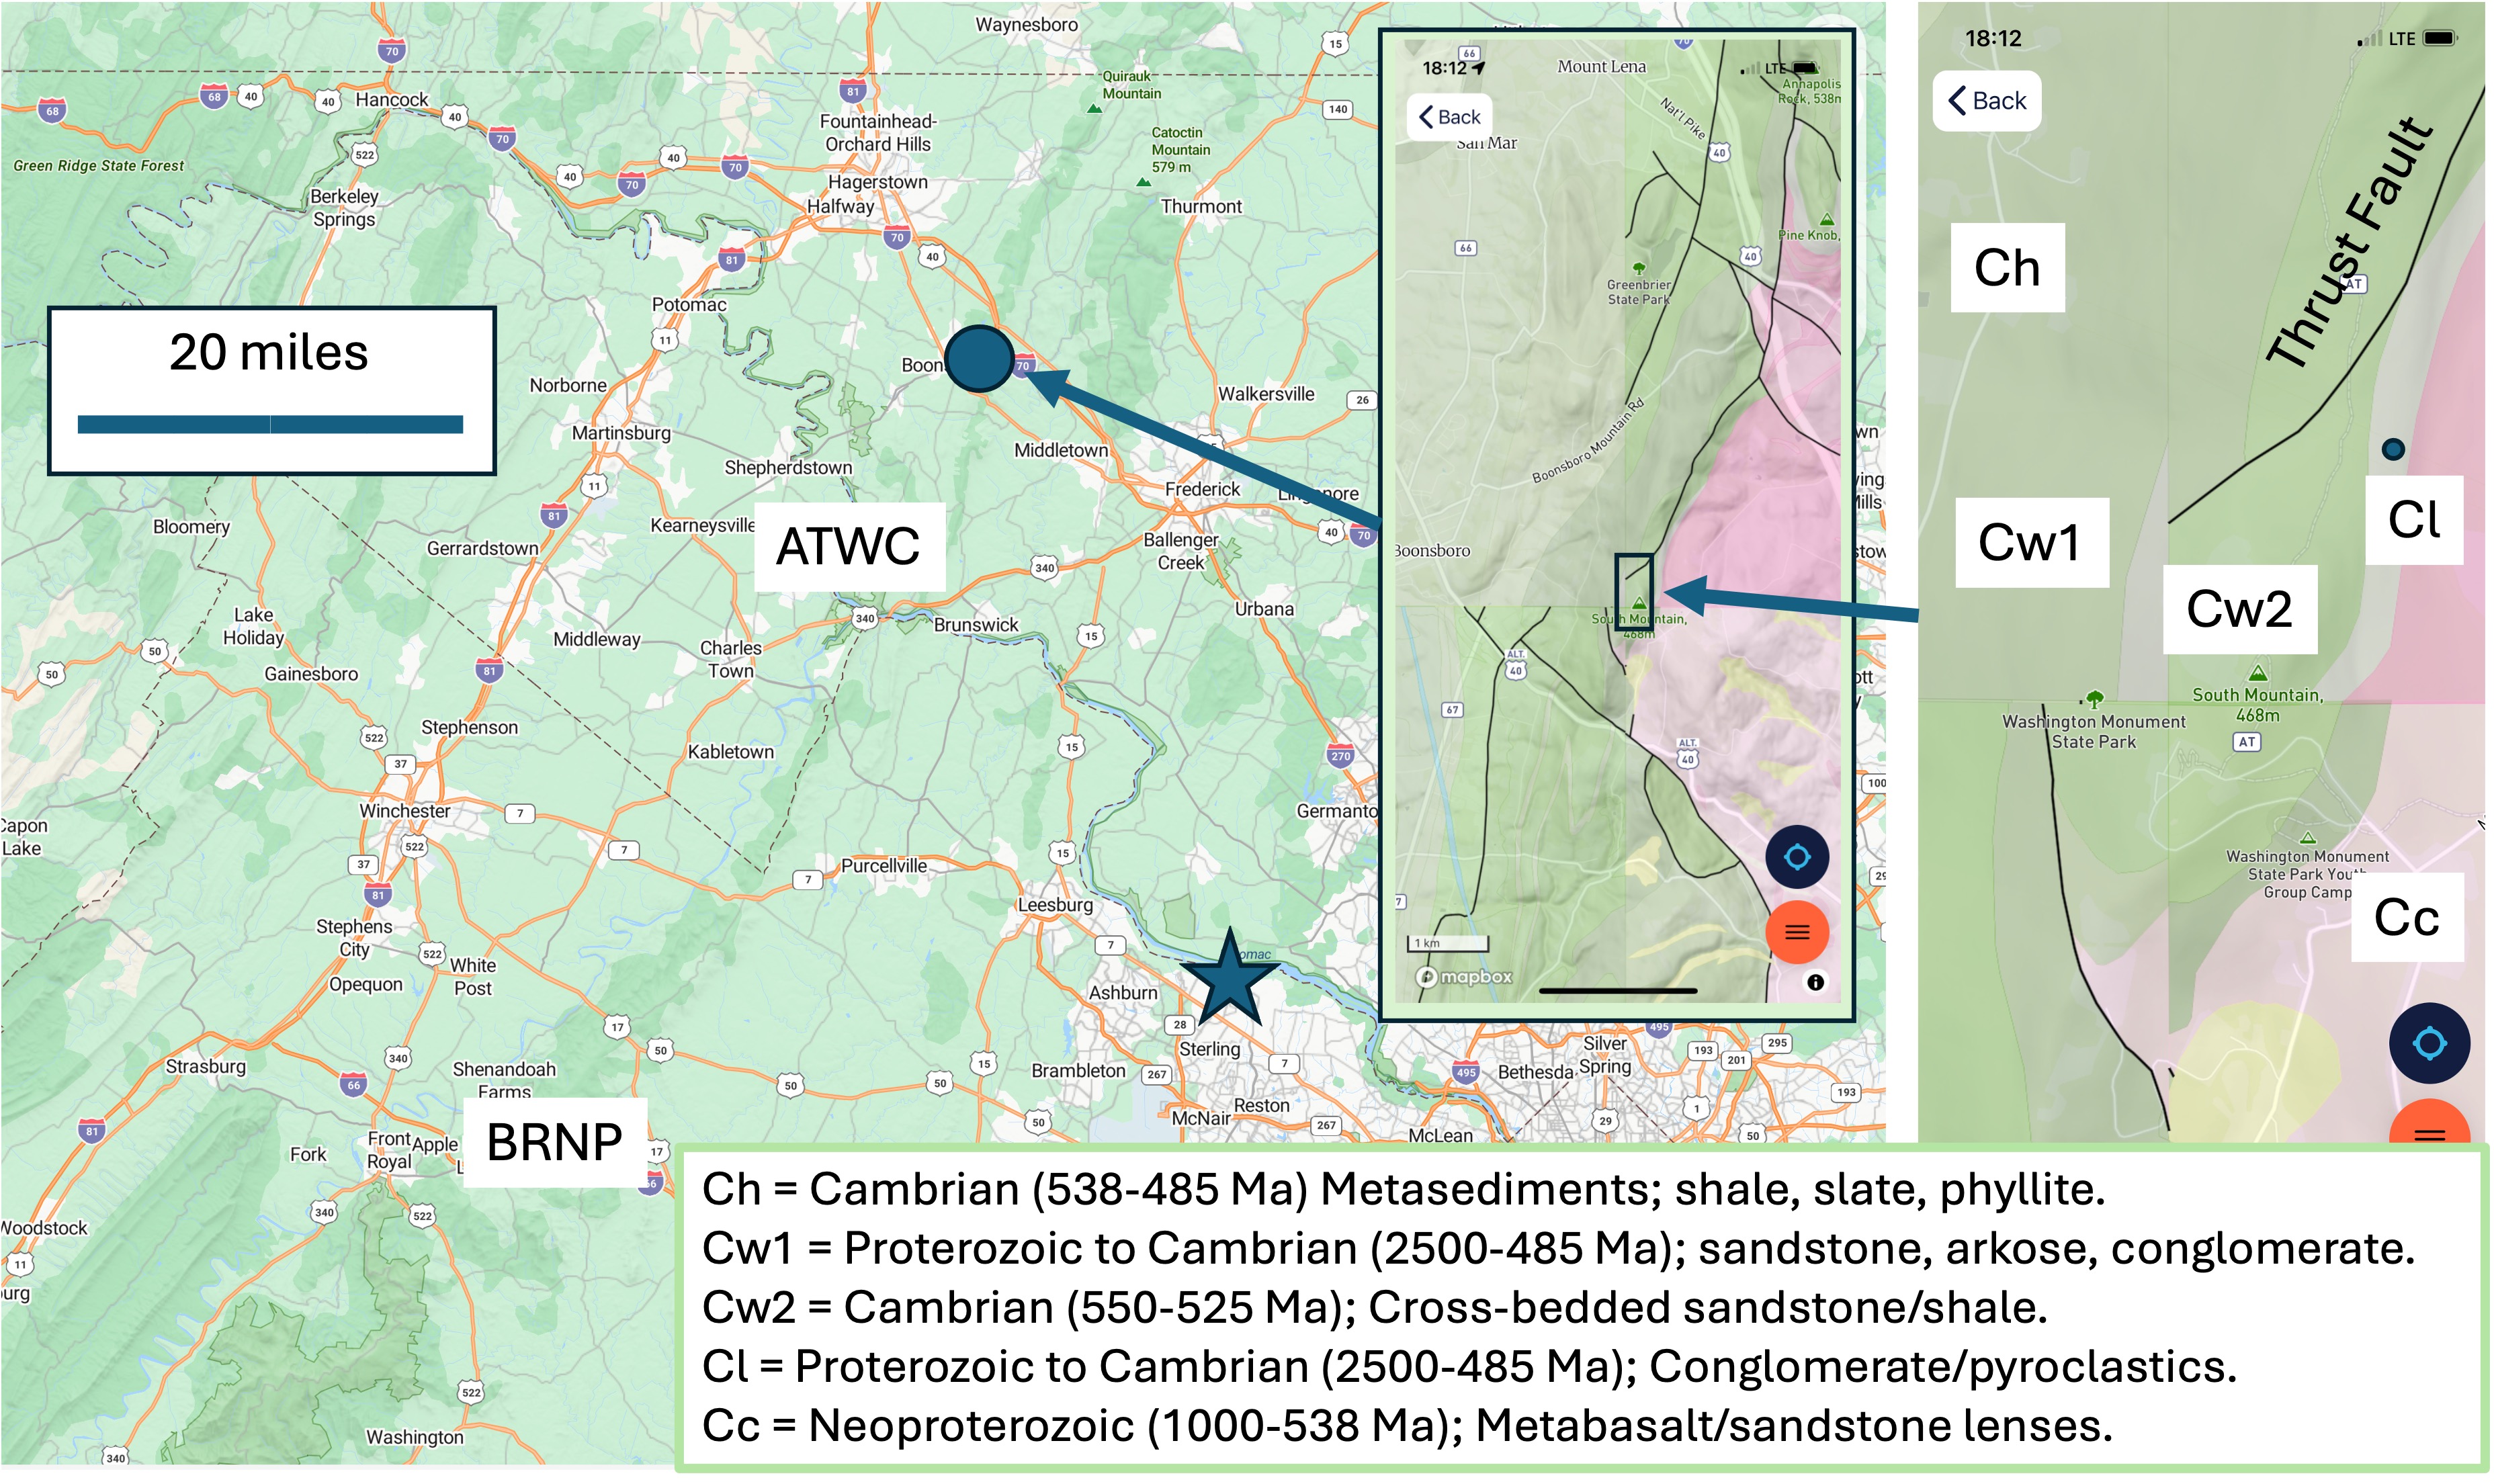
Figure 2. The field site. Washington Monument is indicated by the purple circle and arrow in the large map. The first inset map shows the geology around the monument. Note the mismatch in geology from different quadrangles; this must be a problem with either the data or Rock D, but the units (indicated in the smaller inset map to the right) were consistent when I clicked on a point. My home is indicated by the star, so you can see we haven’t traveled far. ATWC refers to the Appalachian trail at Weverton Cliff, MD, which I recommend you read to get some background. BRNP represents Bull Run Nature Preserve, which I posted last year. The geological legend for the detailed inset map is at the bottom of the figure. Note that Ma stands for a radiometric age of one-million years; this age is indicative of cooling below the threshold to set the atomic clocks within the minerals, but sedimentary rocks can’t be dated this way. Therefore, these are dates when deep burial and/tectonic deformation/magmatism ceased (i.e. when an orogenic period ended).

Figure 3. Rubble near the monument that resulted from in-place weathering of Weverton Formation rocks (Cw1 and Cw2 in Fig. 2). All of the weathering products (e.g. clays and carbonates) have been washed away, leaving large slabs (~6 feet) piled up. This is a common feature of rocky knolls with good drainage.
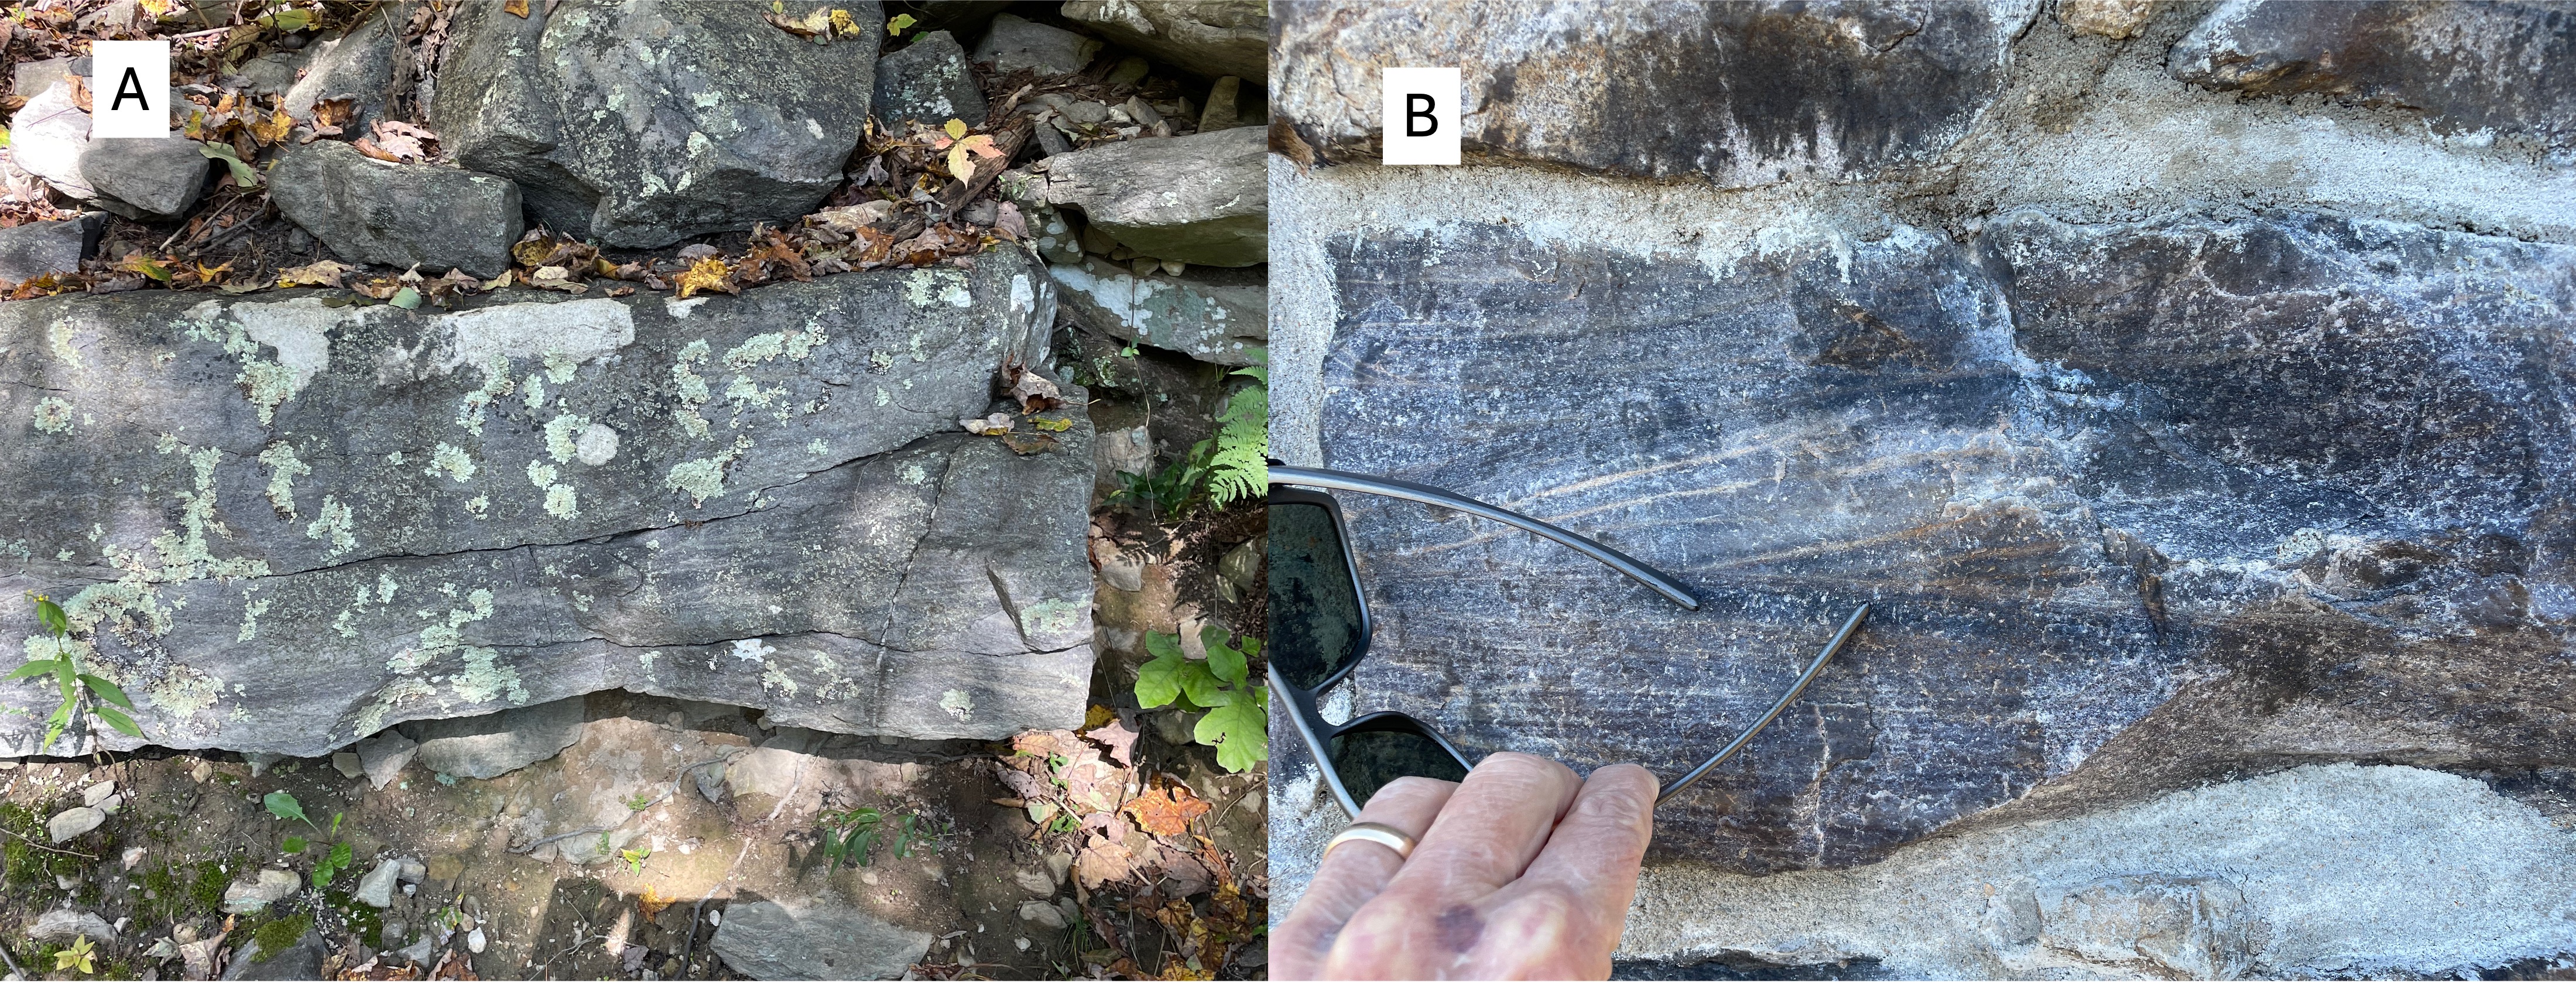
Figure 4. (A) Outcrop of older Weverton formation rocks (Cw1 in Fig. 1), revealing weathered material below and boulders on top. This outcrop contains cross-bedded layers on close examination. (B) Photo of a block of Cw1 used in the monument , which shows the crossbedding better than panel A because a fresh surface was cleaved during a recent repair of the 30-foot tower. The color is important: green sedimentary rocks like these represent marine environments, where there is less oxygen; sedimentary rocks deposited in rivers tend to be reddish because of oxidation (rusting) of Fe-containing minerals. These are probably shallow marine sands.

Figure 5. (A) Quartz in a vein (<1 inch thick) from near the monument. Note that the cross-bedding is very similar to Fig. 4 but more weathered. (B) Less-common view of a quartz vein seen obliquely, showing the surface that was against the country rock. These veins would have been injected during a period of magmatism, sometime between 2500 and 511 Ma; I can’t be more specific because I don’t know exactly where the radiometric ages were measured within these rocks. However, the Weverton formation is approximately 4500 feet (1.4 km) thick here; thus it’s possible that these rocks were deposited episodically during this immense time interval; but no unconformity (i.e. erosion or non deposition) is mentioned in RockD.

Figure 6. View looking east from the Appalachian Trail, showing the terrain typical of the Appalachian foothills. To the left of center, outcrops of Weverton rocks (Cw1 and Cw2 in Fig. 2) can be seen.
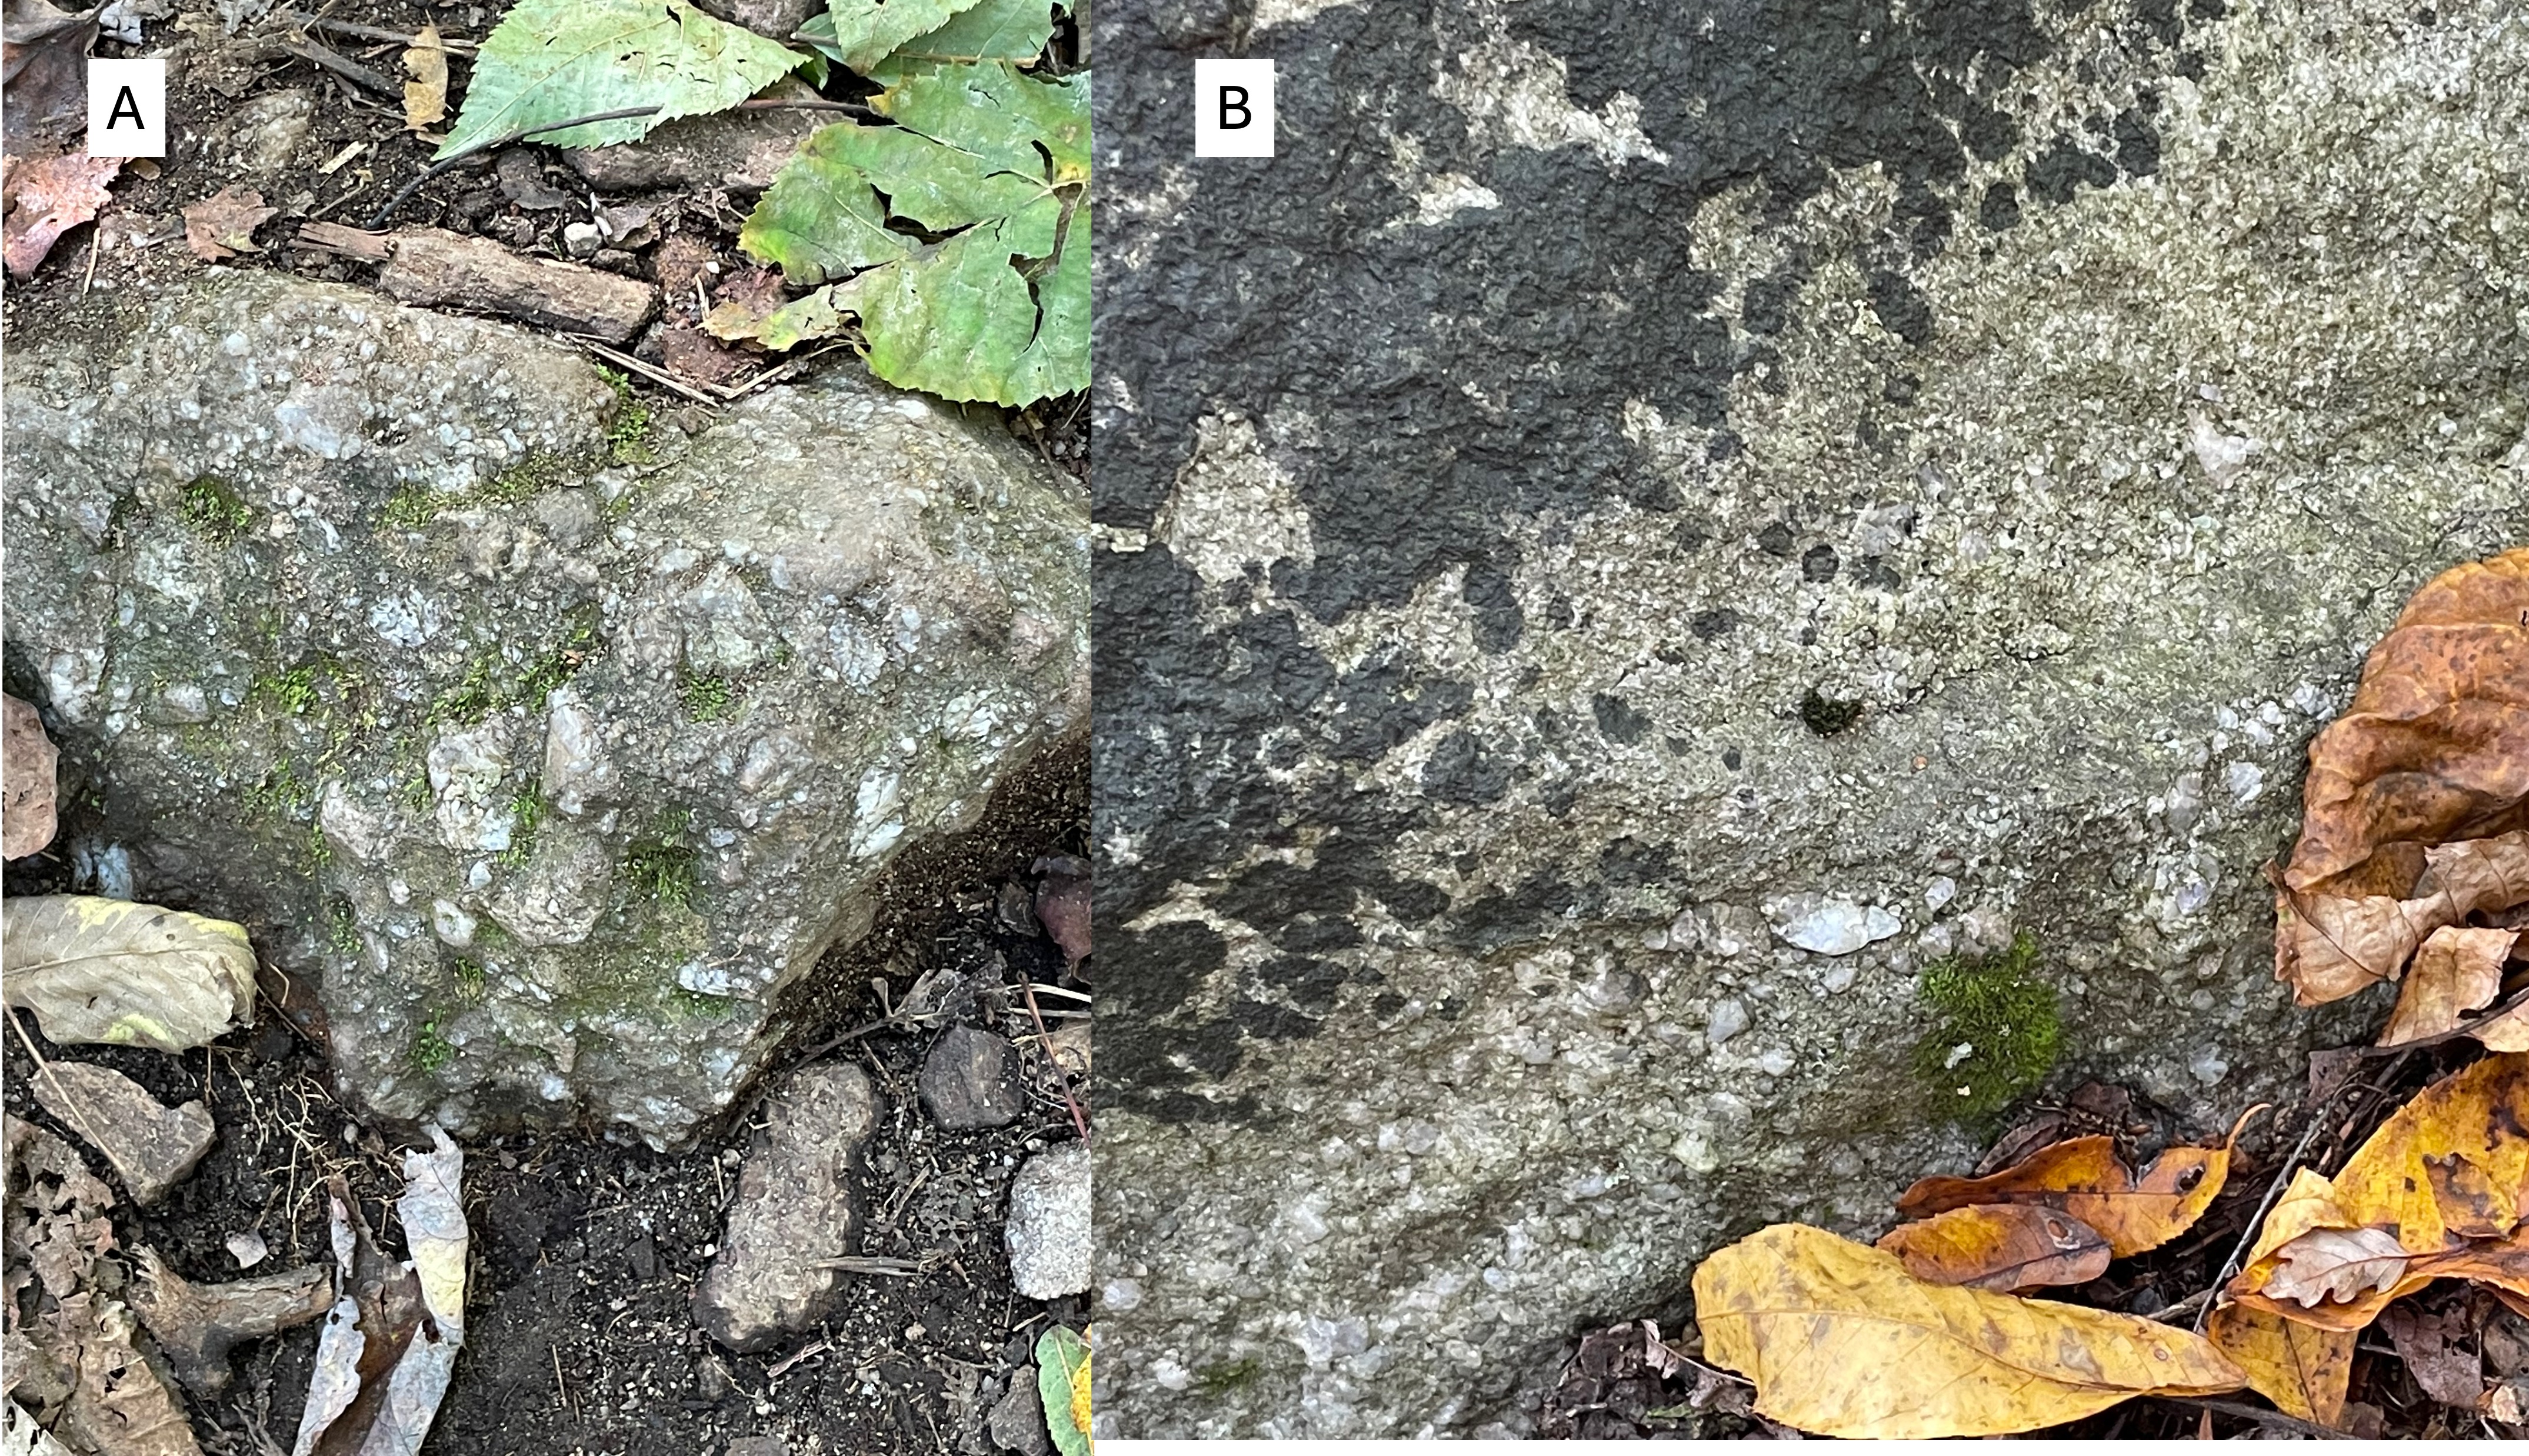
Figure 7. (A) Boulder (~2 feet across) of arkose, revealing angular clasts of rock fragments in a sandy matrix. (B) Poor outcrop of conglomerate with rounded rock and quartz in a similar, sandy matrix. Comparing these images to Fig. 4 shows the variability of sedimentation (and thus depositional environment) during relatively short time intervals (say … tens of millions of years, for example). This kind of variability implies changing sediment sources, possibly caused by tectonic uplift (with magmatism) to the east.

Figure 8. This figure is from the Bull Run Nature Preserve field trip. It is a schematic of how layers of sedimentary rocks (shown in different colors) can slide over one another along thrust faults. This process results in stacking of similar sediments, making stratigraphic analysis of sparse field data problematic. The rocks on the left are sliding upward to the right along a series of thrust faults (dashed line). At Bull Run Nature Preserve, a fault like this could be identified by older rocks clearly being stratigraphically higher than younger ones. That isn’t the case at Washington monument, where the interleaved rocks (blue and green) are too similar in lithology and age to be differentiated.
SUMMARY
The thrust fault labeled in Fig. 2 has been confidently identified (represented by a solid line), no doubt through more investigation than I was willing to spend time on. This unnamed fault underlies the northern Blue Ridge, and marks the beginning of the Valley and Ridge province; the Blue Ridge was thus an anomaly, which has been identified as a belt of older rocks thrust over younger ones about 500 million-years ago, when the supercontinent of Pangea was being created.
We have followed the Weverton formation through time (2500-485 Ma) and space (more than 40 miles). During this unimaginable interval, this small piece of the Earth’s crust has moved thousands of miles. Only the last 500 my of its journey is known with any confidence. This tectonic plate has been carrying these sediments to unknowable latitudes, colliding with immovable objects while spreading the remnants of mountain ranges that are now forgotten, deconstructed by the irresistible power of water, wind, ice and time.
Some things aren’t meant for us to know …

Recent Comments